Cisco Umbrella
The Sumo Logic App for Cisco Umbrella provides analytics and visibility into DNS, Proxy, and Admin activity. It gives insights into Geolocation of traffic sources, blocked clients, top categories, and more. It also analyzes traffic passing through Umbrella SWG and selective proxy, and provides information on client requests, malware, AV detections, and traffic summary. The Admin Activity dashboard provides snapshots of changes made in Umbrella's settings.
Log types
Sumo Logic app for Cisco Umbrella uses the following log types:
Sample log messages
To know about the Sample Logs and Schema for Cisco Umbrella logs, click here.
Sample queries
_sourceCategory=Labs/cisco_umbrella
| where _sourceName matches "*dnslogs*"
| parse "\"*\",\"*\",\"*\",\"*\",\"*\",\"*\",\"*\",\"*\",\"*\",\"*\",\"*\",\"*\",\"*\"" as timestamp,identity,identites_all,internal_ip,external_ip,action,query_type,response_code,domain_name,categories,first_identity_type_matched,all_identity_types,blocked_categories
_sourceCategory=Labs/cisco_umbrella
| where _sourceName matches "*proxylogs*"
| parse "\"*\",\"*\",\"*\",\"*\",\"*\",\"*\",\"*\",\"*\",\"*\",\"*\",\"*\",\"*\",\"*\",\"*\",\"*\",\"*\",\"*\",\"*\",\"*\",\"*\",\"*\",\"*\",\"*\",\"*\",\"*\",\"*\",\"*\",\"*\",\"*\",\"*\",\"*\",\"*\",\"*\",\"*\",\"*\"" as timestamp,policy_identity_label,internal_client_ip,external_client_ip,destination_ip,content_type,action,url,referer,user_agent,status_code,request_size,response_size,response_body_size,sha256,categories,av_detections,PUAs,AMP_disposition,AMP_malware_name,AMP_score,policy_identity_type,blocked_categories,identities,identity_types,request_method,DLP_status,certificate_errors,file_name,ruleset_ID,rule_ID,destination_list_IDs,isolate_action,file_action,warn_status
_sourceCategory=Labs/cisco_umbrella
| where _sourceName matches "*auditlogs*"
| parse "\"*\",\"*\",\"*\",\"*\",\"*\",\"*\",\"*\",\"*\",\"*\"" as  id, timestamp, email, user, type, action, ip, before, after
Collecting logs for Cisco Umbrella
This section provides instructions for setting up collection for Cisco Umbrella for analysis in Sumo Logic.
The Cisco Umbrella app offers logging to Amazon S3 as it has the ability to upload, store, and archive traffic activity logs from your Umbrella dashboards to the cloud through Amazon S3. CSV formatted Umbrella logs are compressed (gzip) and uploaded every ten minutes so that there's a minimum of delay between traffic from the customer's Umbrella dashboard being logged and then being available to download from an S3 bucket.
- Login to your Amazon S3 admin account. You need to have a admin account to collect logs from Amazon S3 account.
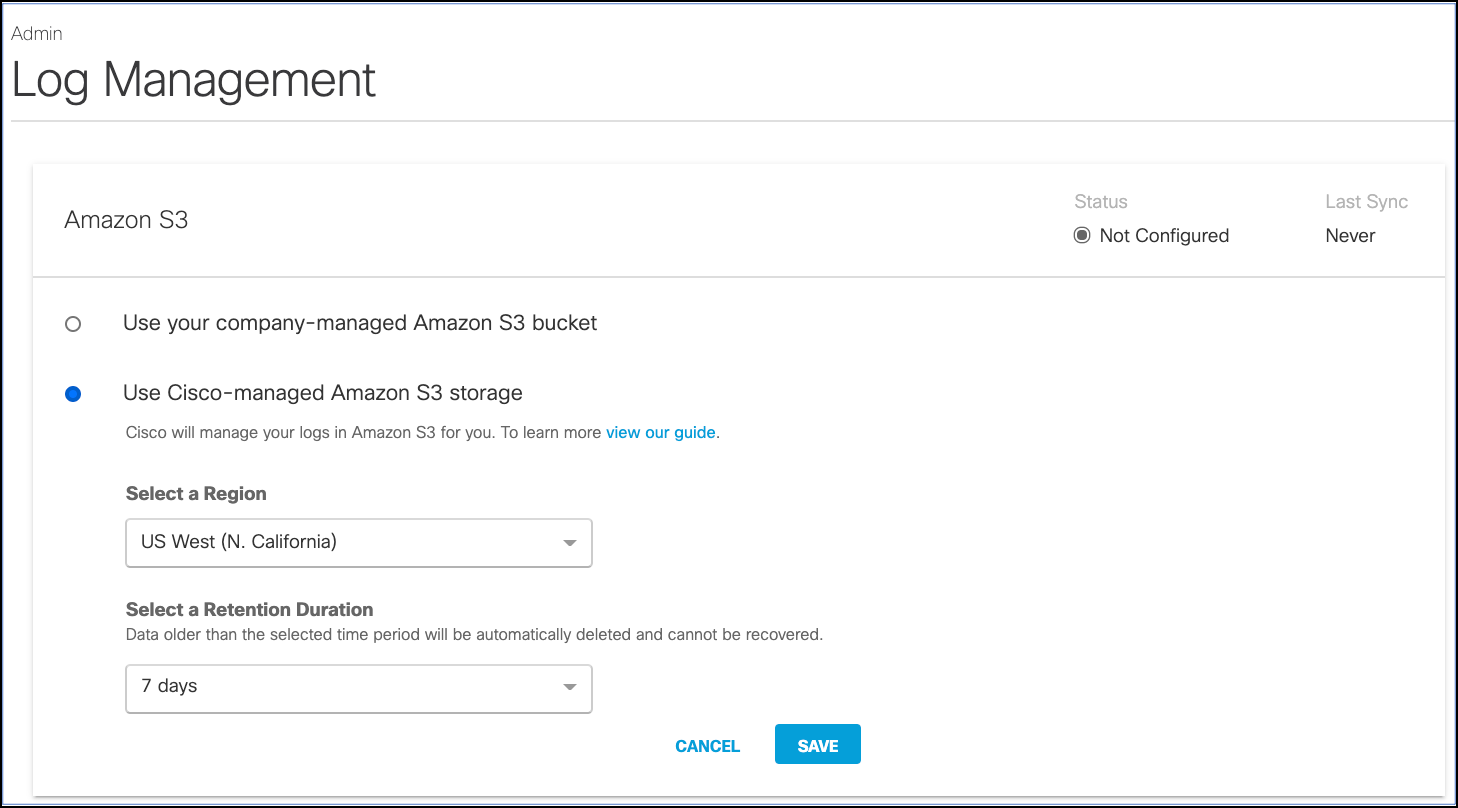
- Navigate to the Log Management.
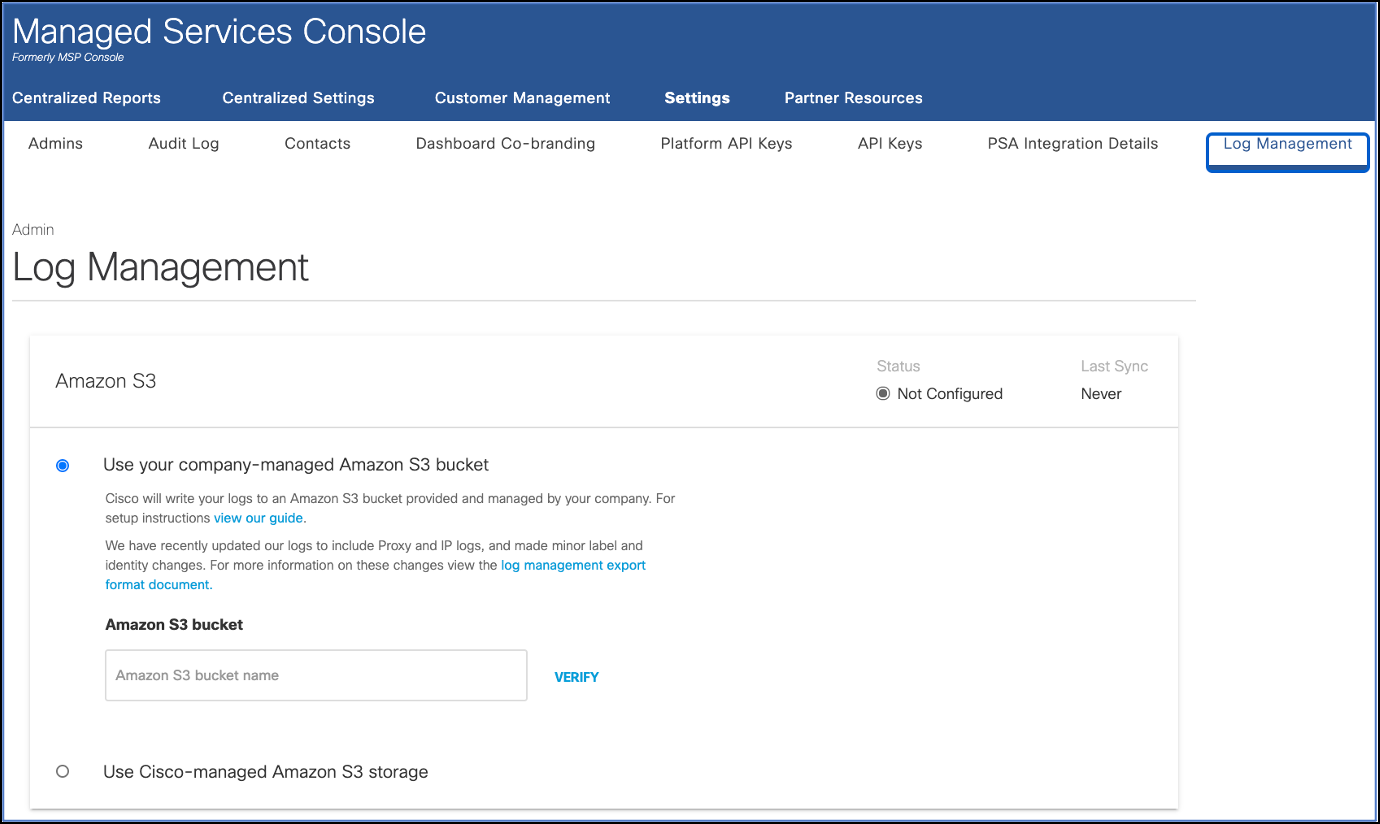
- You have the following two options on Cisco Umbrella Amazon S3:
- A self-managed bucket. You own the Amazon S3 bucket, including its configuration and management.
- A Cisco-managed bucket. Cisco Umbrella owns the bucket and sets the configuration and management of it. For more information, see Enable Logging to a Cisco-managed S3 Bucket.
Collection from a Cisco-managed S3 bucket has the following limitations:
- AWS versioned APIs are not supported. The Use AWS versioned APIs setting on the Source must be disabled.
- S3 Event Notifications Integration is not supported, so you cannot use an SNS subscription endpoint.
- Access must be provided with an Access ID and Key. Role-based access is not supported.
- Use a prefix in the path expression so it doesn't point to the root directory.
- Ensure that your path expression ends in
/*. Otherwise, you will get a ListBucket error. For example:- Bucket Name:
cisco-managed-us-east-1 - Path Expression:
987654321_12e34c..../*
- Bucket Name:
By having all your logs uploaded to an S3 bucket, you can then download logs automatically to keep in perpetuity in backup storage. Or, ingest the logs through your SIEM or another security tool to determine if any security events in these Umbrella logs coincide with events in other security tools.
For more information, see Cisco Umbrella Documentation.
Installing the Cisco Umbrella app
To install the app, do the following:
Next-Gen App: To install or update the app, you must be an account administrator or a user with Manage Apps, Manage Monitors, Manage Fields, Manage Metric Rules, and Manage Collectors capabilities depending upon the different content types part of the app.
- Select App Catalog.
- In the 🔎 Search Apps field, run a search for your desired app, then select it.
- Click Install App.
note
Sometimes this button says Add Integration.
- Click Next in the Setup Data section.
- In the Configure section of your respective app, complete the following fields.
- Field Name. If you already have collectors and sources set up, select the configured metadata field name (eg _sourcecategory) or specify other custom metadata (eg: _collector) along with its metadata Field Value.
- Click Next. You will be redirected to the Preview & Done section.
Post-installation
Once your app is installed, it will appear in your Installed Apps folder, and dashboard panels will start to fill automatically.
Each panel slowly fills with data matching the time range query received since the panel was created. Results will not immediately be available but will be updated with full graphs and charts over time.
Viewing Cisco Umbrella dashboards
All dashboards have a set of filters that you can apply to the entire dashboard. Use these filters to drill down and examine the data to a granular level.
- You can change the time range for a dashboard or panel by selecting a predefined interval from a drop-down list, choosing a recently used time range, or specifying custom dates and times. Learn more.
- You can use template variables to drill down and examine the data on a granular level. For more information, see Filtering Dashboards with Template Variables.
- Most Next-Gen apps allow you to provide the scope at the installation time and are comprised of a key (
_sourceCategoryby default) and a default value for this key. Based on your input, the app dashboards will be parameterized with a dashboard variable, allowing you to change the dataset queried by all panels. This eliminates the need to create multiple copies of the same dashboard with different queries.
Admin Activities
Cisco Umbrella - Admin Activities. This dashboard displays snapshots of changes made to Umbrella's settings by the admin. By using the dashboard's filters, you can easily sort through the data based on key fields such as action.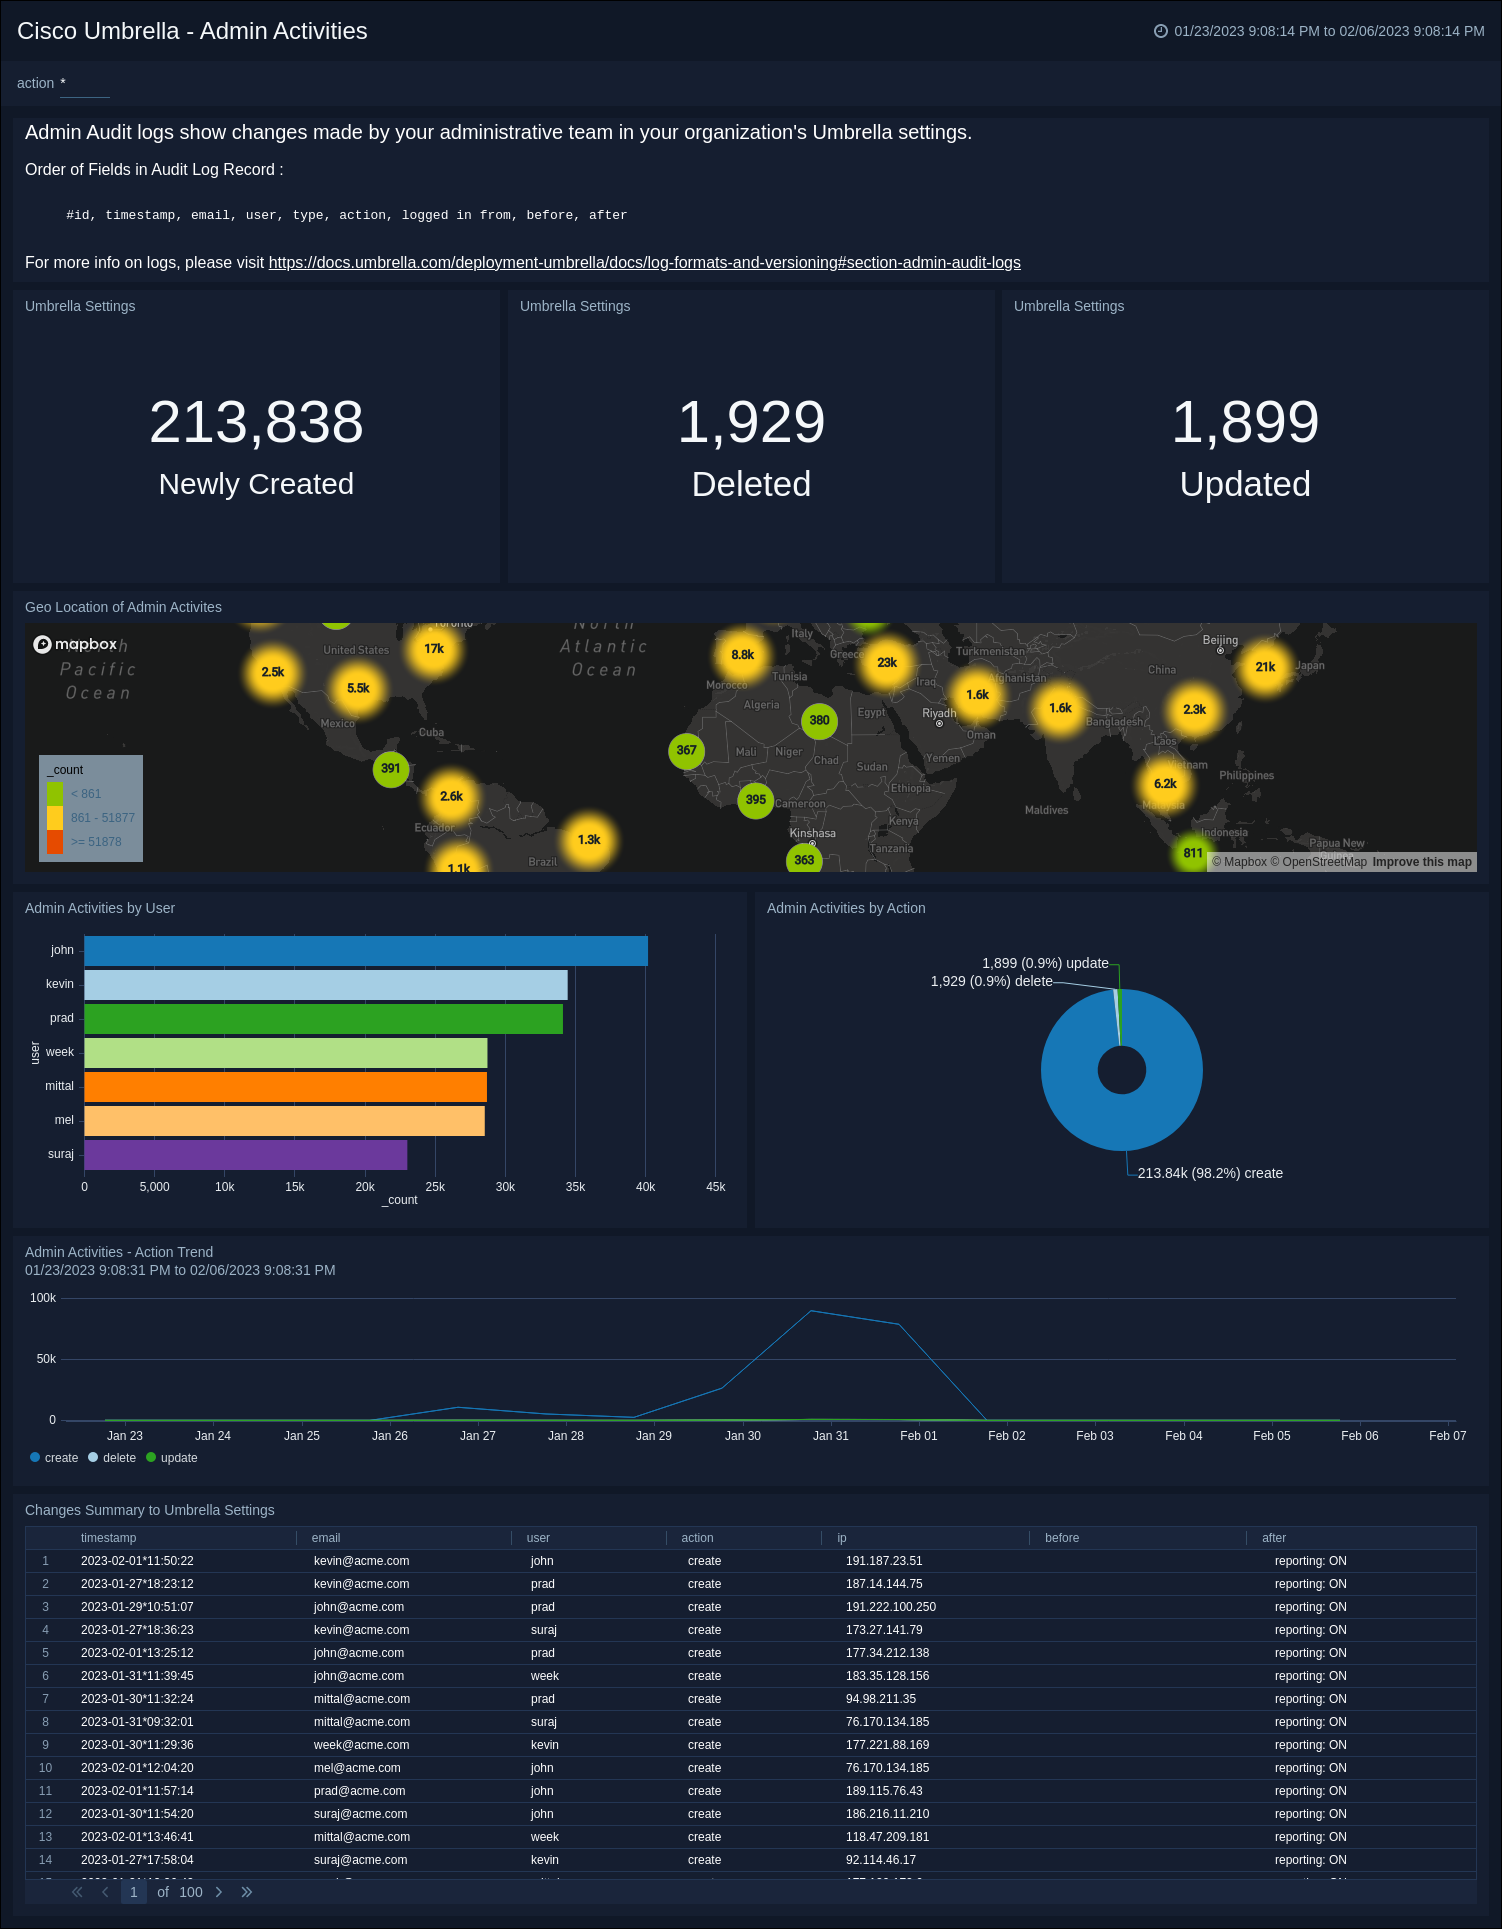
DNS
Cisco Umbrella - DNS. This dashboard offers insights into traffic that has been processed by Cisco DNS resolvers. It provides a view of the geographical location of the traffic sources, clients that were blocked, the most popular categories and categories blocked by DNS. Additionally, it analyzes the domains requested, the related blocked requests and traffic, and the identities associated with them. The dashboard filters can be utilized to analyze the data based on crucial fields such as action, identity, response code, blocked category, and category.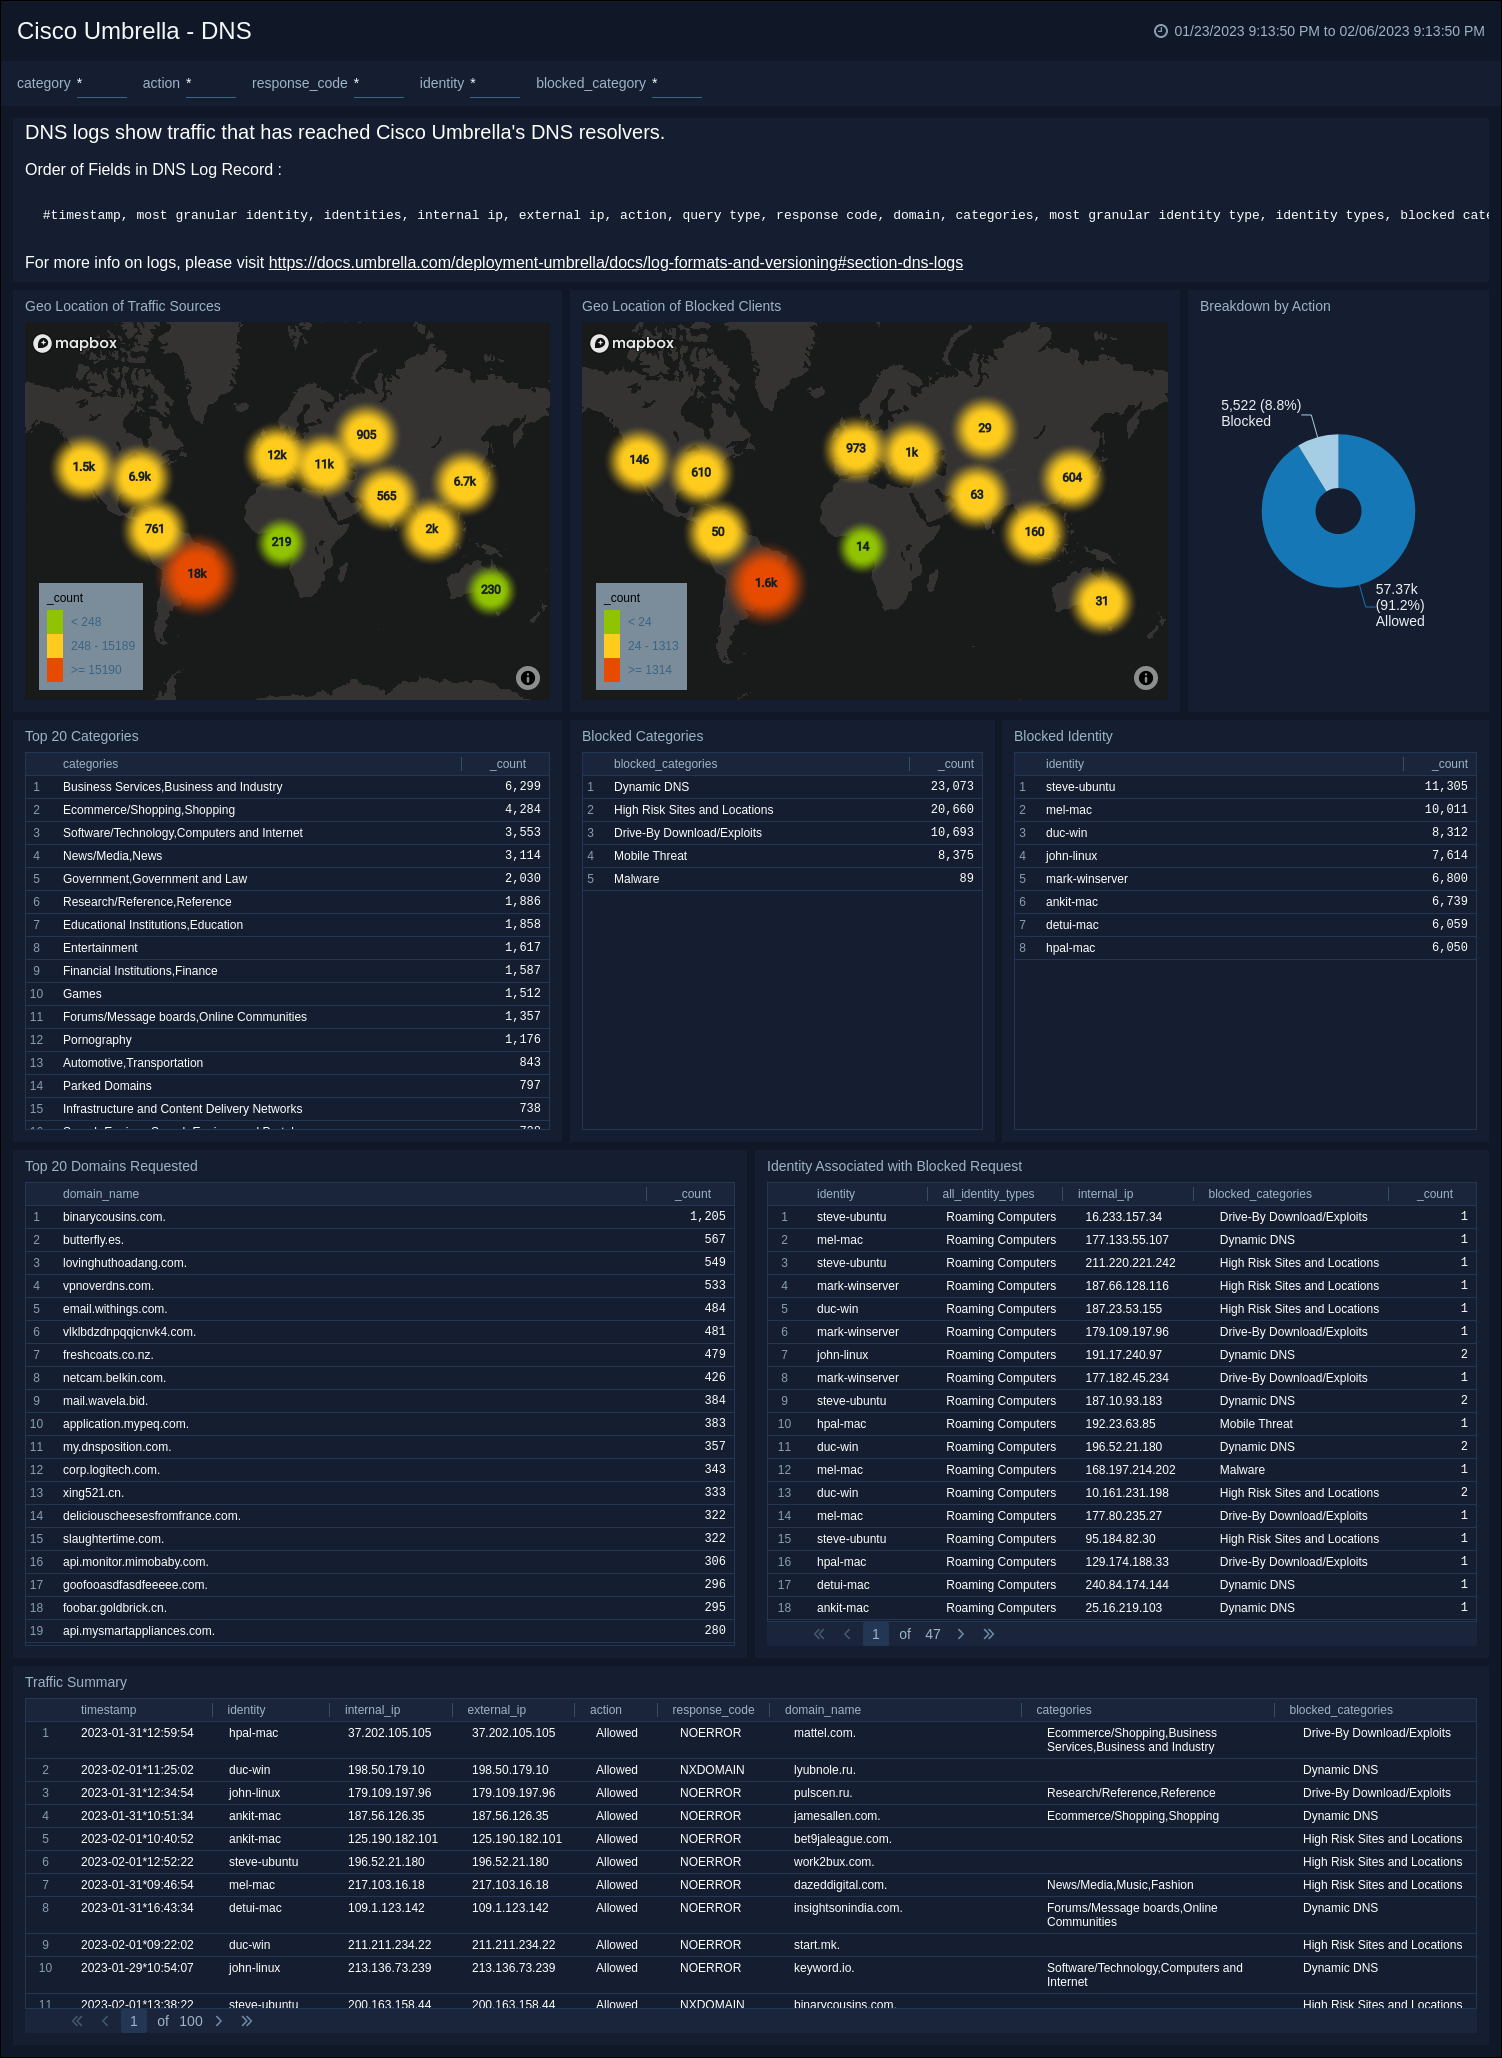
Proxy
Cisco Umbrella - Proxy. This dashboard provides insights into the traffic that has gone through Umbrella's Secure Web Gateway (SWG) or Selective Proxy. It gives you a clear view of the geographical location of the traffic sources, client requests by blocked or allowed actions, malware detections, blocked sources and URLs, anti-virus detections, traffic request/response size, and an overall traffic summary.
By using the dashboard's filters, you can easily analyze the data by different key fields such as action, identity, malware, anti-virus detection, blocked category, referrer, and category.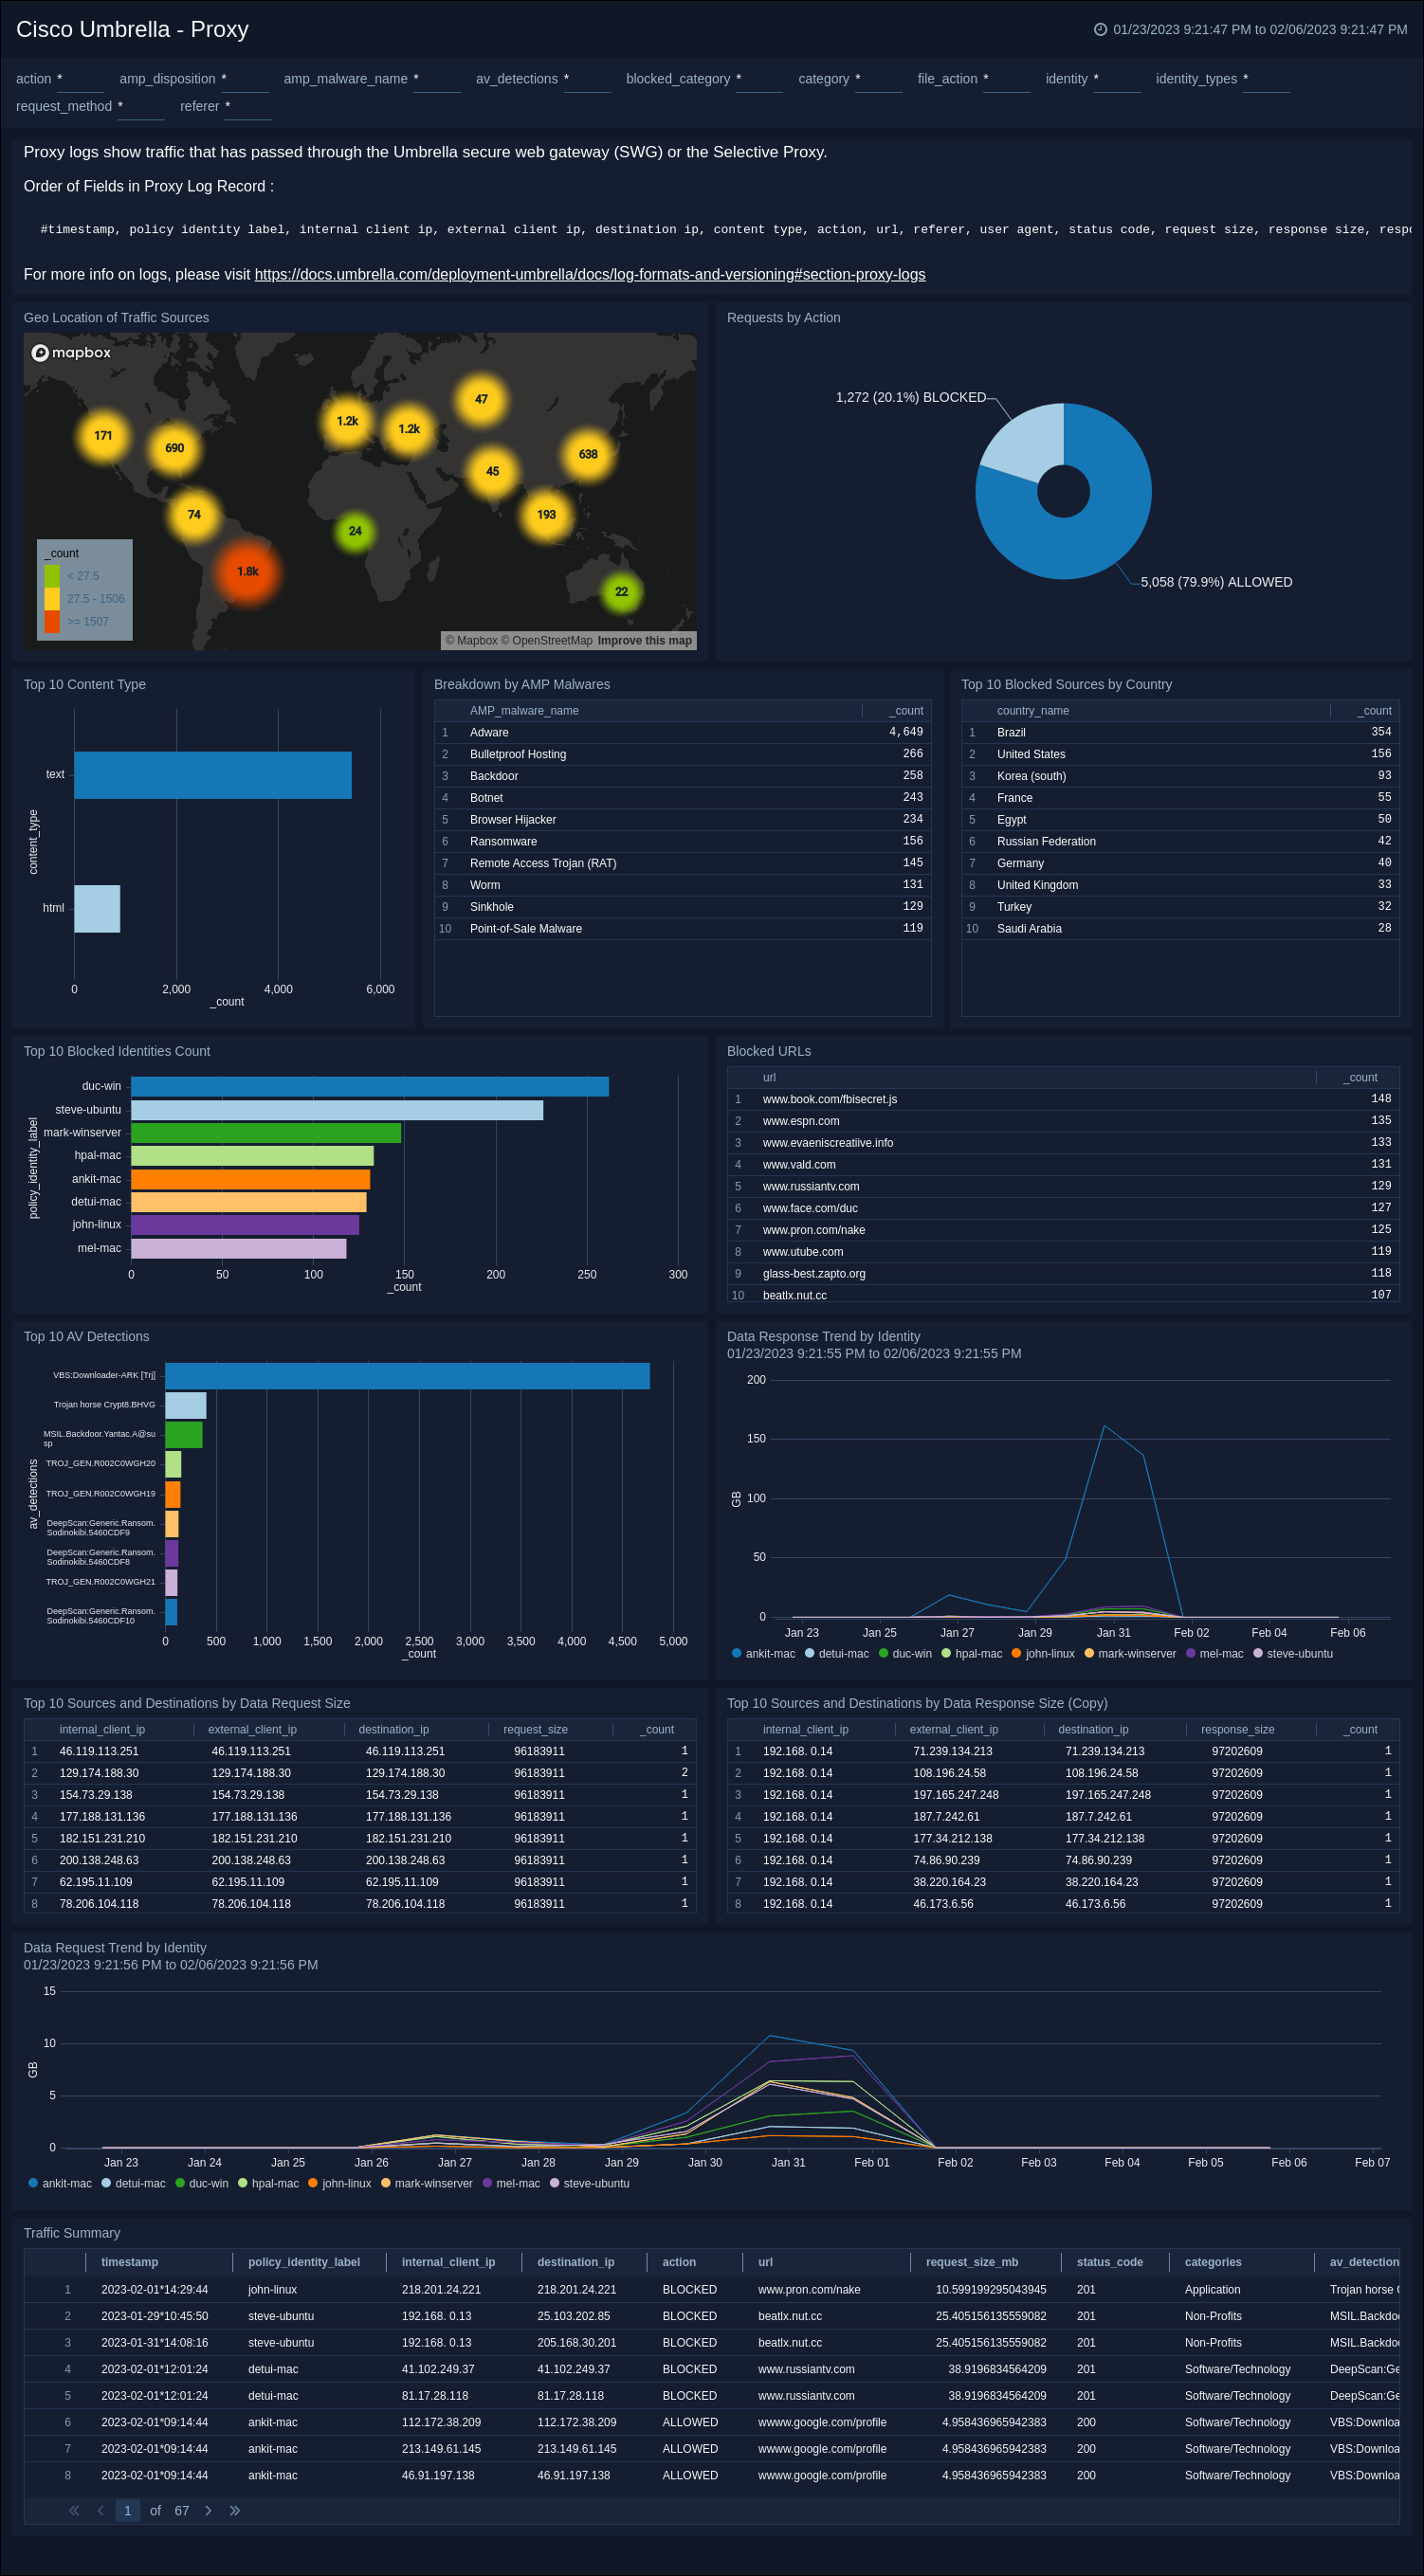
Upgrade/Downgrade the Cisco Umbrella app (Optional)
To update the app, do the following:
Next-Gen App: To install or update the app, you must be an account administrator or a user with Manage Apps, Manage Monitors, Manage Fields, Manage Metric Rules, and Manage Collectors capabilities depending upon the different content types part of the app.
- Select App Catalog.
- In the Search Apps field, search for and then select your app.
Optionally, you can identify apps that can be upgraded in the Upgrade available section. - To upgrade the app, select Upgrade from the Manage dropdown.
- If the upgrade does not have any configuration or property changes, you will be redirected to the Preview & Done section.
- If the upgrade has any configuration or property changes, you will be redirected to the Setup Data page.
- In the Configure section of your respective app, complete the following fields.
- Field Name. If you already have collectors and sources set up, select the configured metadata field name (eg _sourcecategory) or specify other custom metadata (eg: _collector) along with its metadata Field Value.
- Click Next. You will be redirected to the Preview & Done section.
Post-update
Your upgraded app will be installed in the Installed Apps folder and dashboard panels will start to fill automatically.
See our Release Notes changelog for new updates in the app.
To revert the app to a previous version, do the following:
- Select App Catalog.
- In the Search Apps field, search for and then select your app.
- To version down the app, select Revert to < previous version of your app > from the Manage dropdown.
Uninstalling the Cisco Umbrella app (Optional)
To uninstall the app, do the following:
- Select App Catalog.
- In the 🔎 Search Apps field, run a search for your desired app, then select it.
- Click Uninstall.