cloudflare
This application has been developed and is supported by Cloudflare. In case of technical questions, please review the technical documentation for Cloudflare logs or email analytics@cloudflare.com.
The Cloudflare App provides a set of dashboards that make analyzing Cloudflare logs easy, helping you to understand events and trends from your websites and applications on the Cloudflare network. Logs are gathered from all 160+ Cloudflare data centers in near real-time and can be combined with other data sources, such as your origin data, to provide unique insights and help you improve the performance and security of your websites and applications.
Log types
The Cloudflare App uses HTTP request logs in JSON format gathered from all of the 160+ Cloudflare data centers. By default, timestamps are returned as Unix nanosecond integers. We recommend using the RFC 3339 format for sending logs to Sumo Logic. For a description of the fields available in the logs see link here.
Sample log messages
{
"ClientIP": "89.163.242.206",
"ClientRequestHost": "www.theburritobot.com",
"ClientRequestMethod": "GET",
"ClientRequestURI": "/static/img/testimonial-hipster.png",
"EdgeEndTimestamp": 2018-12-15T02:20:57Z,
"EdgeResponseBytes": 69045,
"EdgeResponseStatus": 200,
"EdgeStartTimestamp": 2018-12-15T02:20:57Z,
"RayID": "3a6050bcbe121a87"
}
Sample queries
The following log query is from the ‘Total Number of Requests’ panel in the ‘Cloudflare - Snapshot’ dashboard.
ClientCountry*
| json "EdgePathingSrc", "EdgePathingOp","EdgePathingStatus", "ClientCountry",
"ClientIP", "ClientDeviceType", "ClientRequestHost", "ClientRequestUserAgent",
"ClientRequestURI", "OriginResponseStatus", "EdgeResponseStatus", "OriginIP",
"ClientIPClass" as edge_pathing_src, edge_pathing_op, edge_pathing_status, client_country,
client_ip, client_device_type, client_request_host, client_request_user_agent,
client_request_uri, origin_response_status, edge_response_status, origin_ip, client_ip_class
| count
Collecting logs for Cloudflare
This section shows you how to set up a Hosted Collector and specify a Sumo Logic Source.
To send Cloudflare logs to Sumo Logic directly, you can follow the steps outlined below, or follow the guide in the Cloudflare documentation (Enable Logpush to Sumo Logic).
The Sumo Logic Cloudflare app works exclusively with zone-scoped datasets. For more information, refer to the log fields in the Cloudflare documentation.
Cloudflare Logpush supports pushing logs directly to Sumo Logic via the Cloudflare dashboard or via API. Cloudflare can send logs to a Hosted Collector with HTTP Logs and Metrics as the source. Once you have set up a collector, you simply provide the HTTP Source Address (a unique URL) to which logs can be posted.
Ensure Log Share permissions are enabled in Cloudflare before attempting to read or configure a Logpush job. For more information, refer to the Roles section in the Cloudflare documentation.
Configure a Hosted Collector
- Follow the instructions to Configure a Hosted Collector and Source in Sumo Logic to start collecting logs.
- Follow the instructions to Configure an HTTP Logs and Metrics Source.
- Optional: To forward logs to Cloud SIEM, click +Add Field with the key
_parserand value/Parsers/System/Cloudflare/Cloudflare Logpush - Click Advanced, if the settings are not already shown.
- For Timestamp Format, select Specify a format and enter the following:
- Format:
yyyy-MM-dd'T'HH:mm:ss'Z' - Timestamp Locator:
\"EdgeStartTimestamp\"\s*:\s*\"(.*)\"
- Format:
- Click Test. A Test Timestamp Parsing dialog appears.
- Enter a sample log message in the Test Timestamp Parsing dialog, such as the following, and then click Test: "EdgeStartTimestamp":"2022-12-19T23:38:10Z". A dialog confirming that your timestamp format matched should appear.
- Click Done and then click Save to save the timestamp parsing to the source.
Configure Logpush to Sumo Logic via the Cloudflare Dashboard
To enable the Cloudflare Logpush service:
- Log in to the Cloudflare dashboard.
- Select the Enterprise account or domain you want to use with Logpush.
- Go to Analytics & Logs > Logs.
- Click Add Logpush job. A modal window opens where you will need to complete several steps.
- Select the dataset you want to push to a storage service.
- Select the data fields to include in your logs. Add or remove fields later by modifying your settings in Logs > Logpush.
- Select Sumo Logic.
- Enter or select the HTTP Source Address. Note that the same collector can be used for multiple Logpush jobs, but each job must have a dedicated source.
- Click Validate access.
- Enter the Ownership token (included in a file or log Cloudflare sends to your provider) and click Prove ownership. To find the ownership token, click the Open button in the Overview tab of the ownership challenge file.
- Click Save and Start Pushing to finish enabling Logpush.
Once connected, Cloudflare lists Sumo Logic as a connected service under Logs > Logpush. Edit or remove connected services from here.
Installing the Cloudflare app
To install the app, do the following:
Next-Gen App: To install or update the app, you must be an account administrator or a user with Manage Apps, Manage Monitors, Manage Fields, Manage Metric Rules, and Manage Collectors capabilities depending upon the different content types part of the app.
- Select App Catalog.
- In the 🔎 Search Apps field, run a search for your desired app, then select it.
- Click Install App.
note
Sometimes this button says Add Integration.
- Click Next in the Setup Data section.
- In the Configure section of your respective app, complete the following fields.
- Field Name. If you already have collectors and sources set up, select the configured metadata field name (eg _sourcecategory) or specify other custom metadata (eg: _collector) along with its metadata Field Value.
- Click Next. You will be redirected to the Preview & Done section.
Post-installation
Once your app is installed, it will appear in your Installed Apps folder, and dashboard panels will start to fill automatically.
Each panel slowly fills with data matching the time range query received since the panel was created. Results will not immediately be available but will be updated with full graphs and charts over time.
Viewing Cloudflare dashboards
This section has instructions for installing the Cloudflare App for Sumo Logic.
Now that you've set up log and metric collection, you can install the Cloudflare App, and use its pre-configured searches and dashboards.
All dashboards have a set of filters that you can apply to the entire dashboard. Use these filters to drill down and examine the data to a granular level.
- You can change the time range for a dashboard or panel by selecting a predefined interval from a drop-down list, choosing a recently used time range, or specifying custom dates and times. Learn more.
- You can use template variables to drill down and examine the data on a granular level. For more information, see Filtering Dashboards with Template Variables.
- Most Next-Gen apps allow you to provide the scope at the installation time and are comprised of a key (
_sourceCategoryby default) and a default value for this key. Based on your input, the app dashboards will be parameterized with a dashboard variable, allowing you to change the dataset queried by all panels. This eliminates the need to create multiple copies of the same dashboard with different queries.
Snapshot
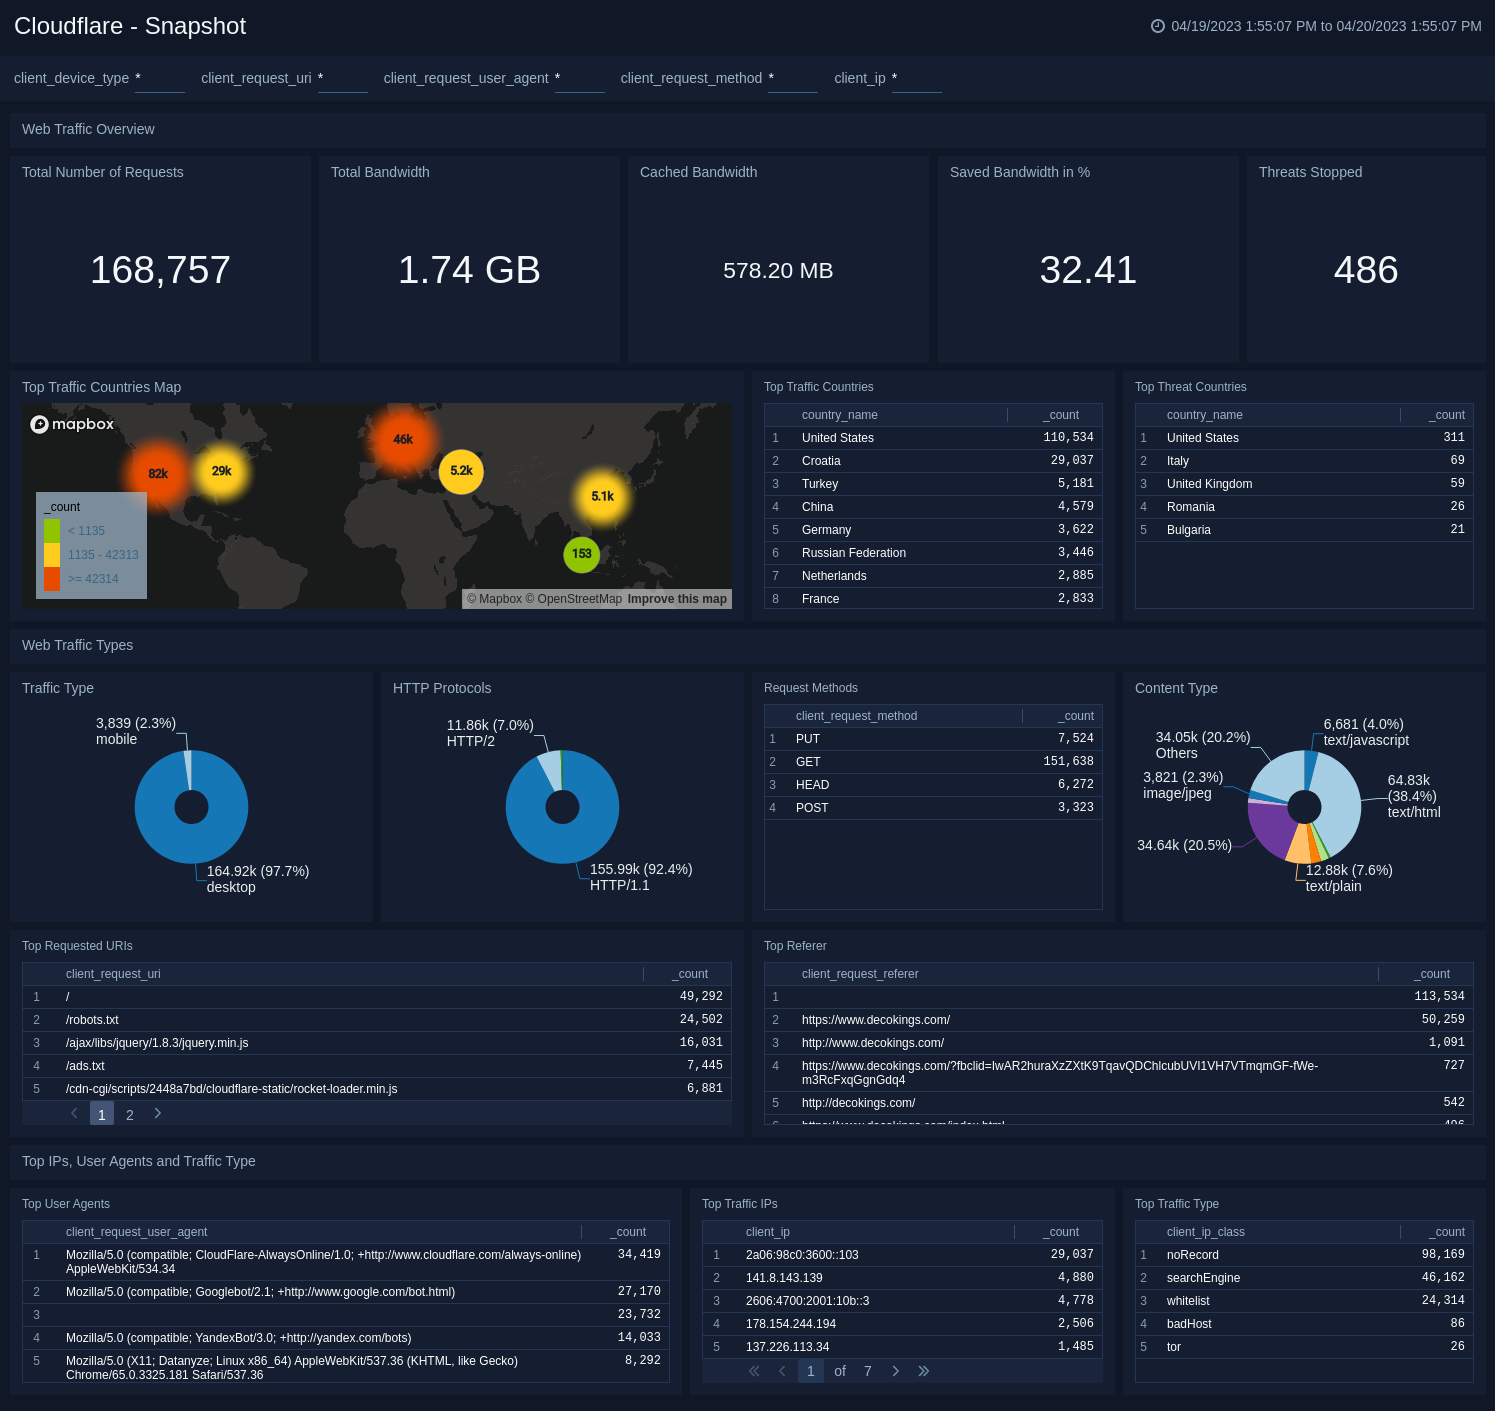
The Cloudflare - Snapshot dashboard provides an at-a-glance overview of the most important metrics from your websites and applications on the Cloudflare network. You can use dashboard filters to further slice and dice the information for granular analysis of events and trends.
Use this dashboard to:
- Monitor the most important web traffic metrics of your websites and applications on the Cloudflare network.
- View what countries and IPs your traffic is coming from and analyze the breakdown between mobile and desktop traffic, protocol, methods, and content types.
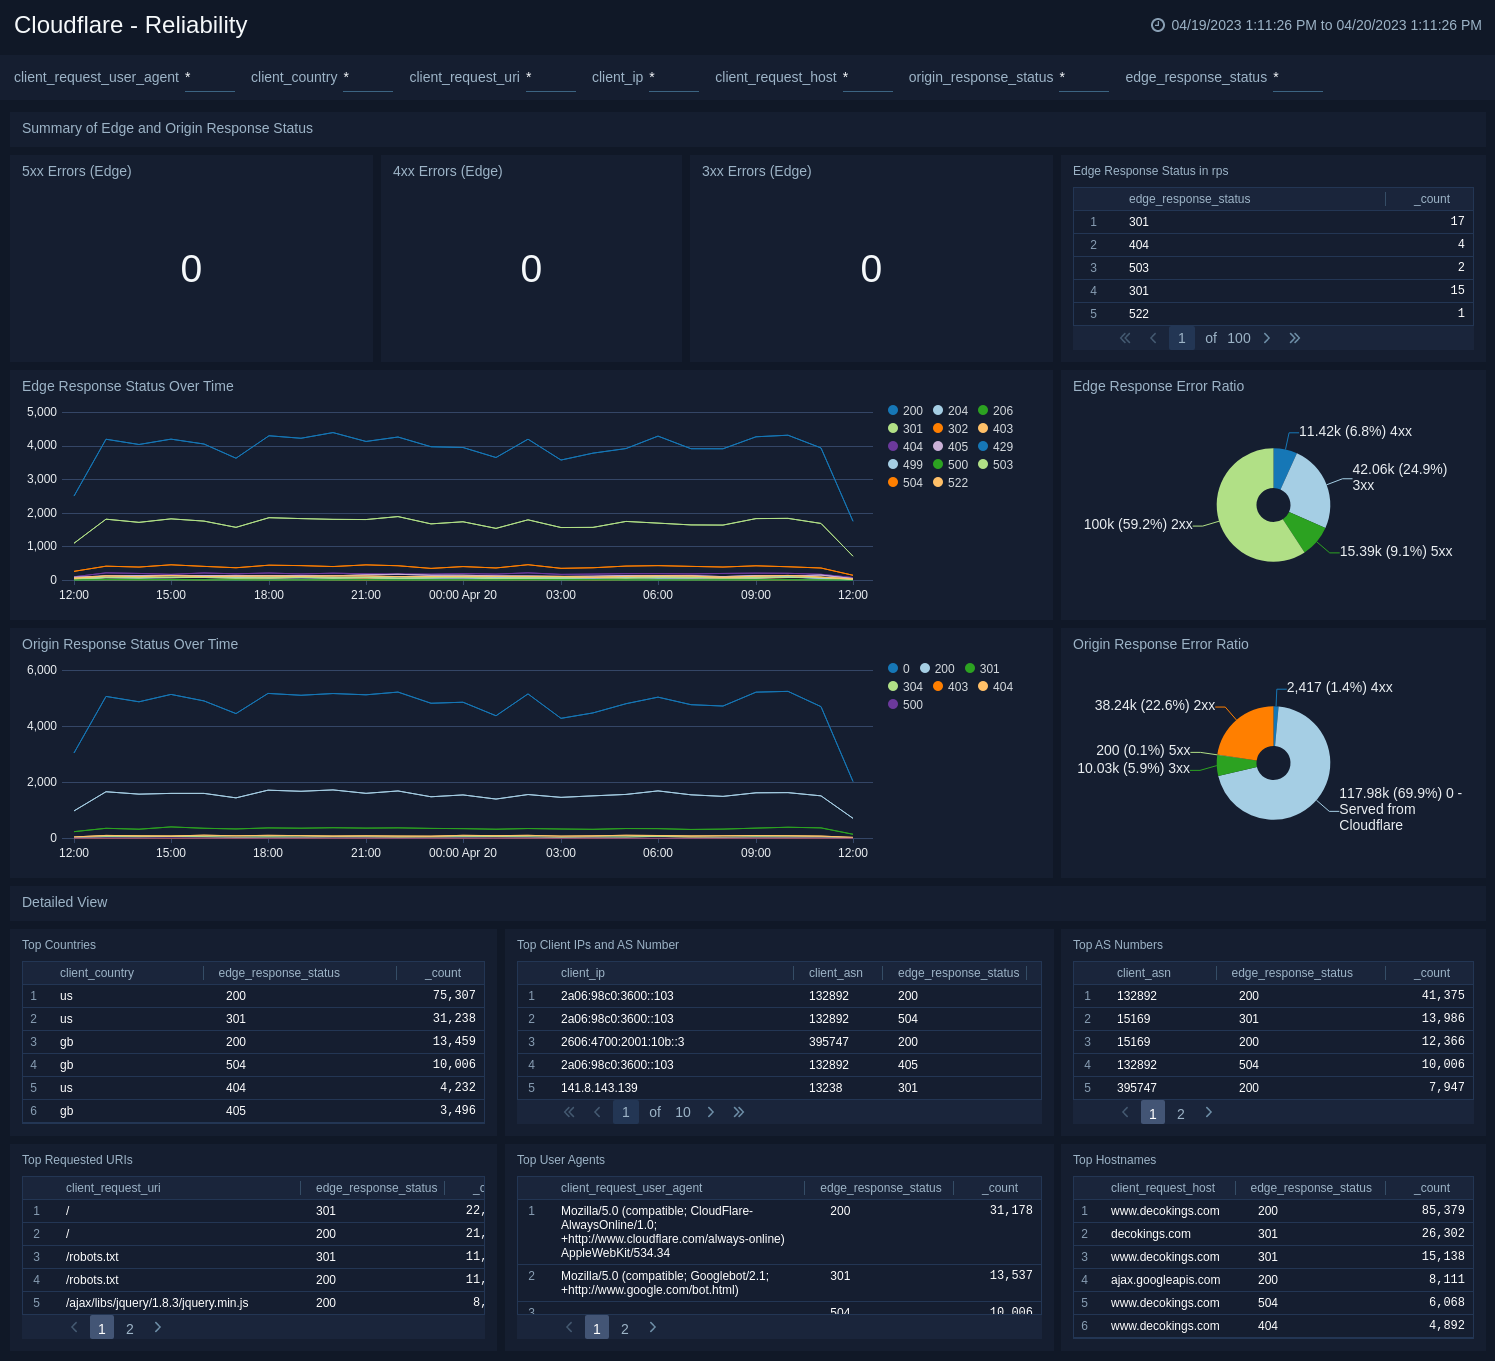
Reliability
The Cloudflare - Reliability dashboard provides insights on the availability of your websites and applications. Metrics include origin response error ratio, origin response status over time, percentage of 3xx/4xx/5xx errors over time, and more.
Use this dashboard to:
- Investigate errors on your websites and applications by viewing edge and origin response status codes.
- Further analyze errors based on status codes by countries, client IPs, hostnames, and other metrics.
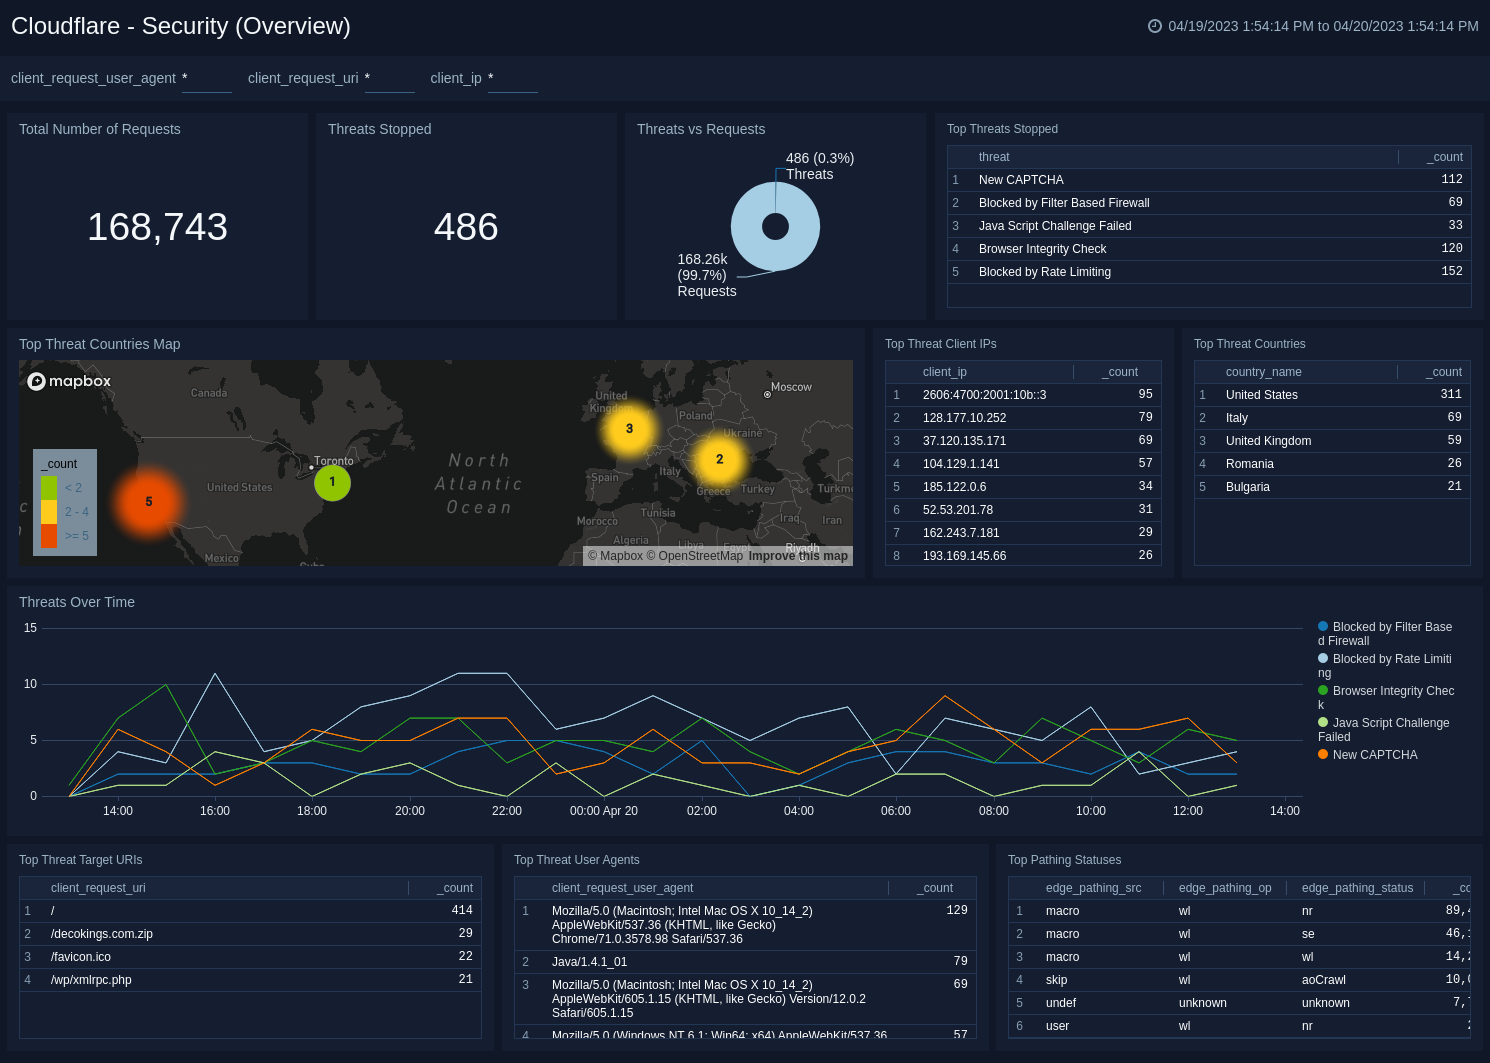
Security (Overview)
The Cloudflare - Security (Overview) dashboard provides insights on threats to your websites and applications, including number of threats stopped, threats over time, top threat countries, and more.
Use this dashboard to:
- Monitor the most important security and threat metrics for your websites and applications.
- Fine tune and configure your IP firewall.
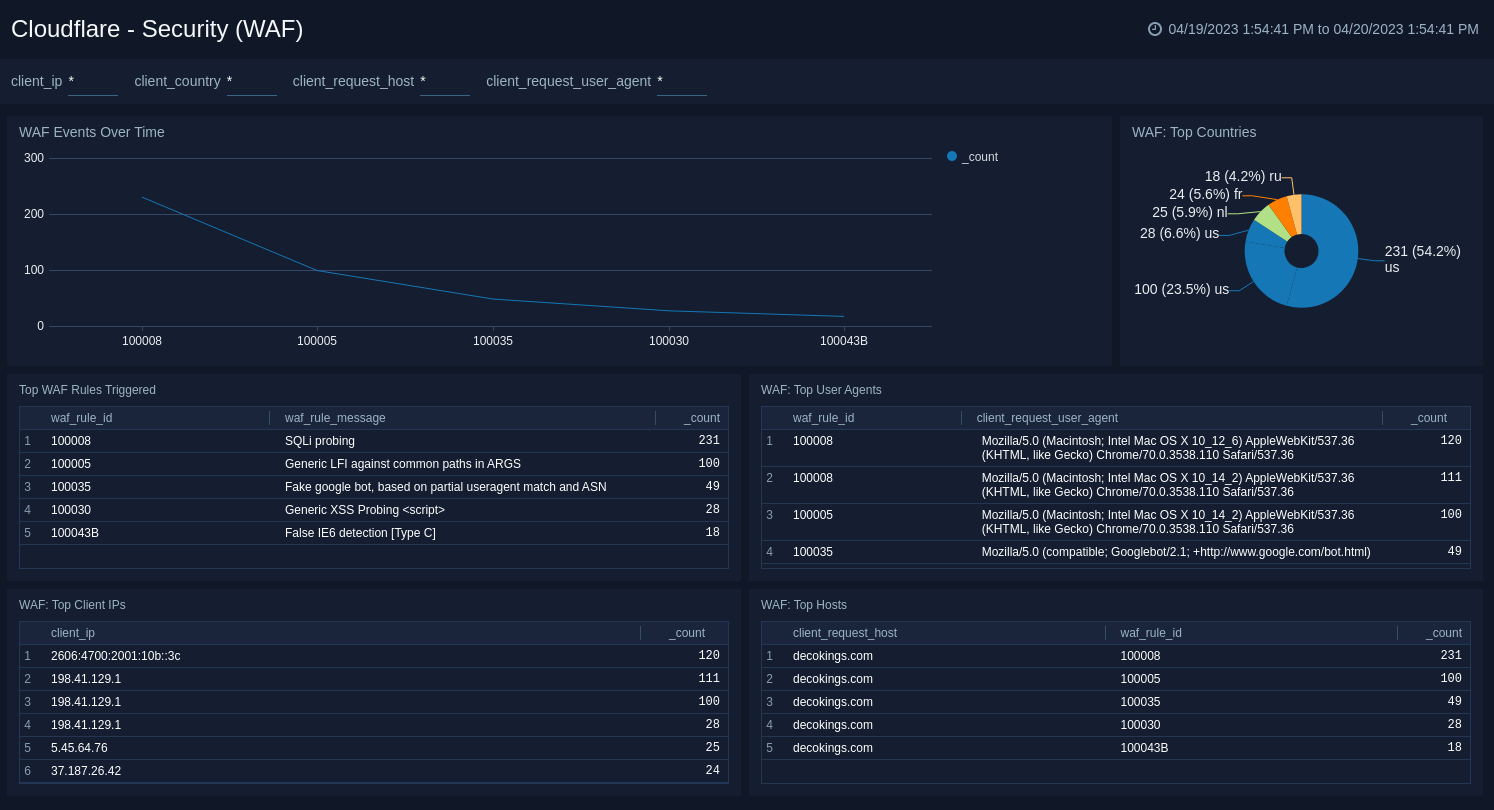
Security (WAF)
The Cloudflare - Security (WAF) dashboard provides insights on threat identification and mitigation by our Web Application Firewall (WAF), including events like SQL injections, XSS, and more.
Use this dashboard to:
- Understand attacks and WAF rules triggered to reveal vulnerabilities and false positives.
- Fine tune the WAF to target obvious threats and prevent false positives.
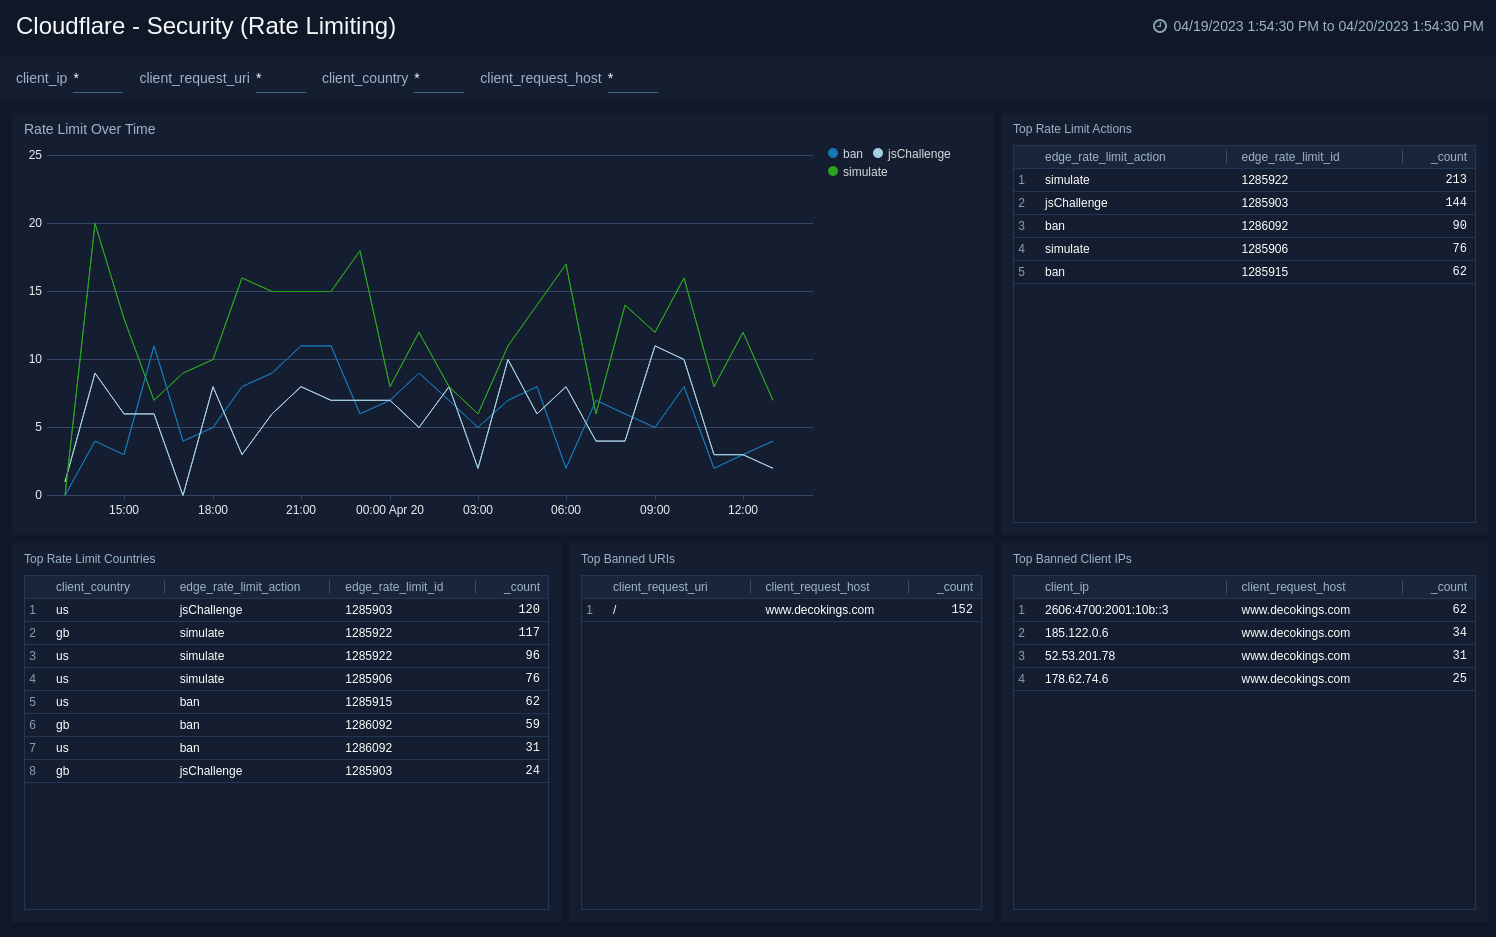
Security (Rate Limiting)
The Cloudflare - Security (Rate Limiting) dashboard provides insights on rate limiting protection against denial-of-service attacks, brute-force login attempts, and other types of abusive behavior targeted at your websites and applications.
Use this dashboard to:
- Investigate attacks by looking at rate limiting over time, top rate limit actions, top rate limit countries, top banned URIs, and top banned client IPs.
- Define thresholds or block client IP addresses to protect your website or application from malicious traffic.
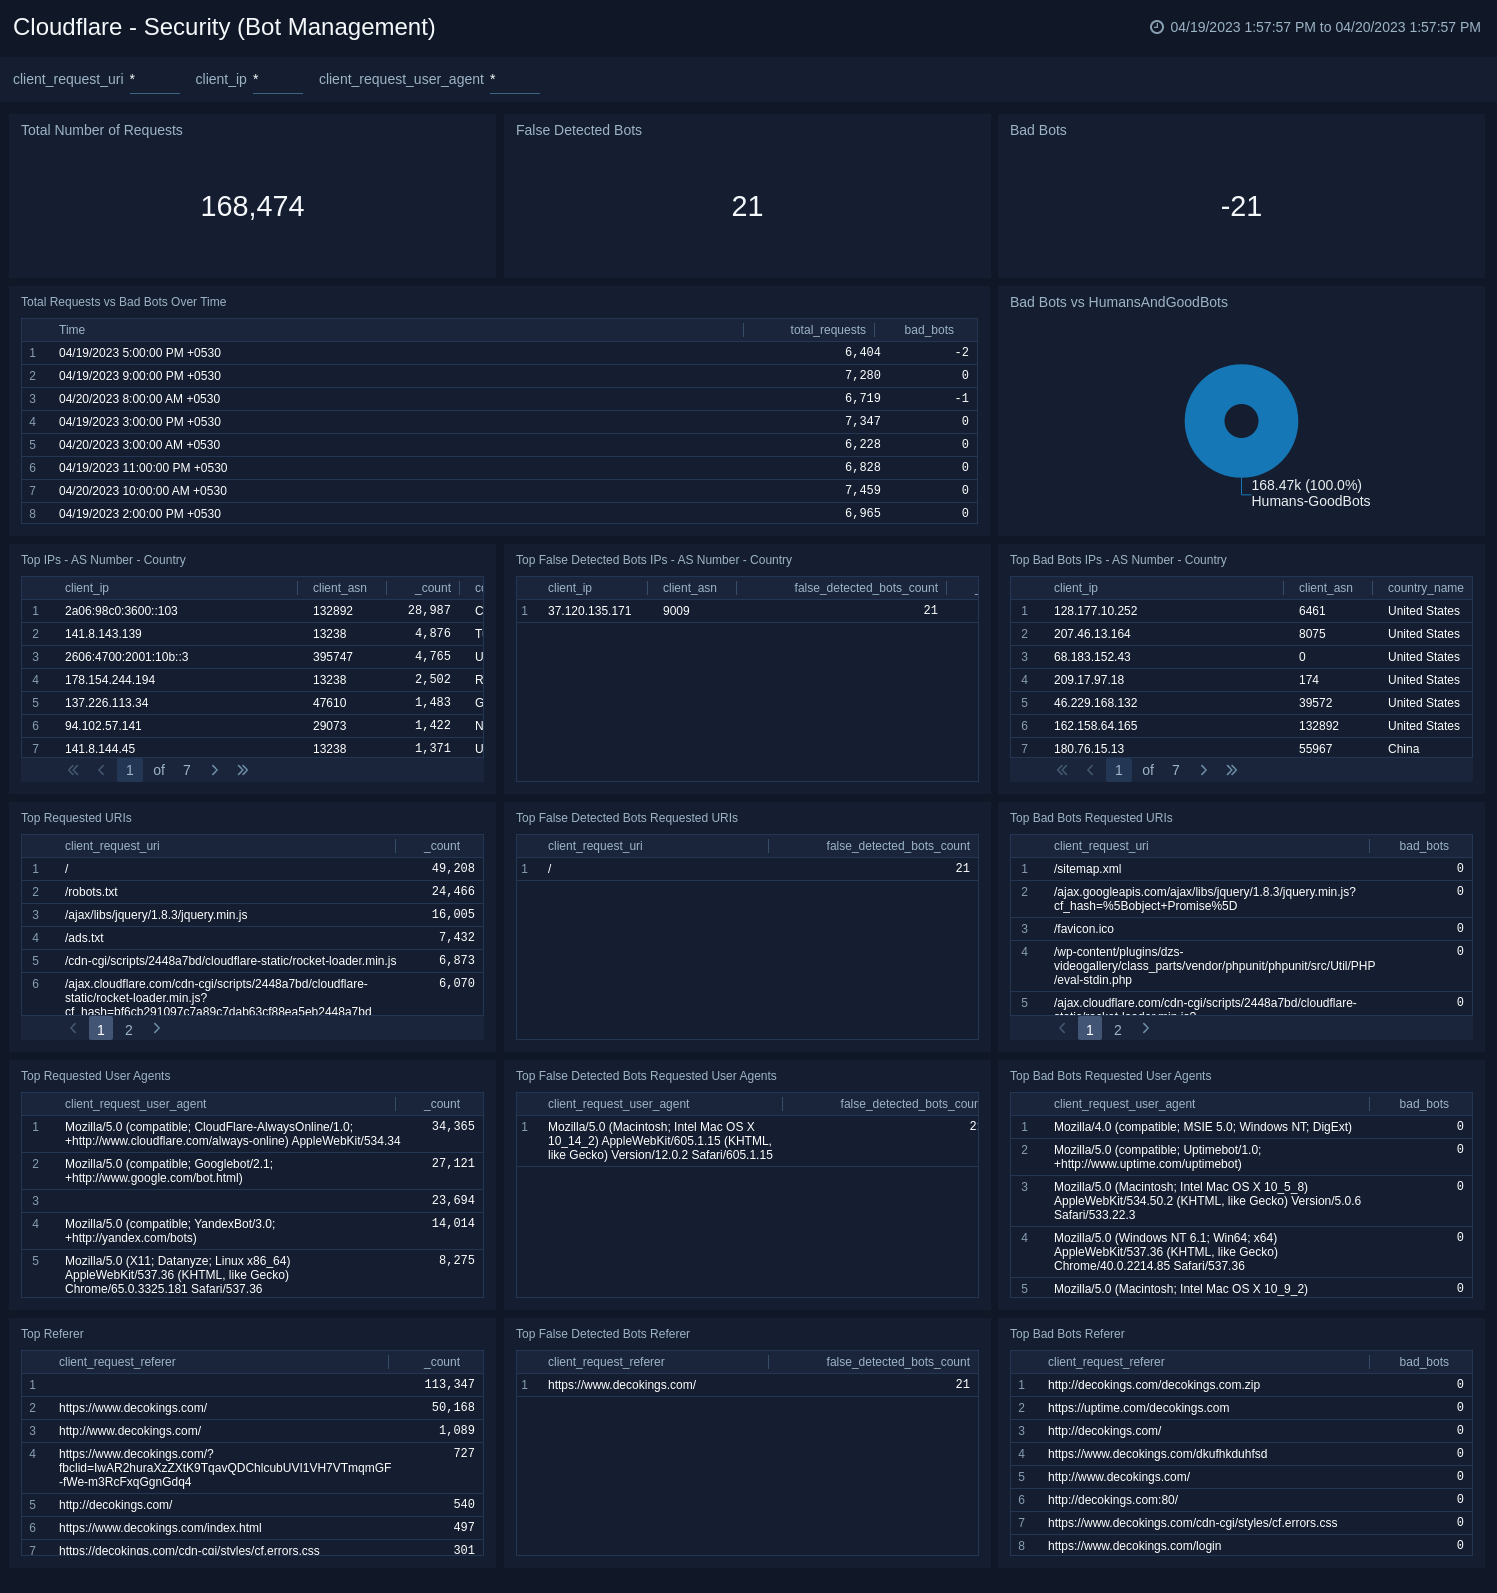
Security (Bot Management)
The Cloudflare - Security (Bot Management) dashboard reliably detects and mitigates bad bots to prevent credential stuffing, spam registration, content scraping, click fraud, inventory hoarding, and other malicious activities.
To get bot requests identified correctly, use only one Filter Based Firewall rule with action "Challenge (Captcha)". For more information, see the Cloudflare documentation.
Use this dashboard to:
- Investigate bot activity on your website to prevent content scraping, checkout fraud, spam registration and other malicious activities.
- Use insight to tune Cloudflare to prevent bots from excessive usage and abuse across websites, applications, and API endpoints.
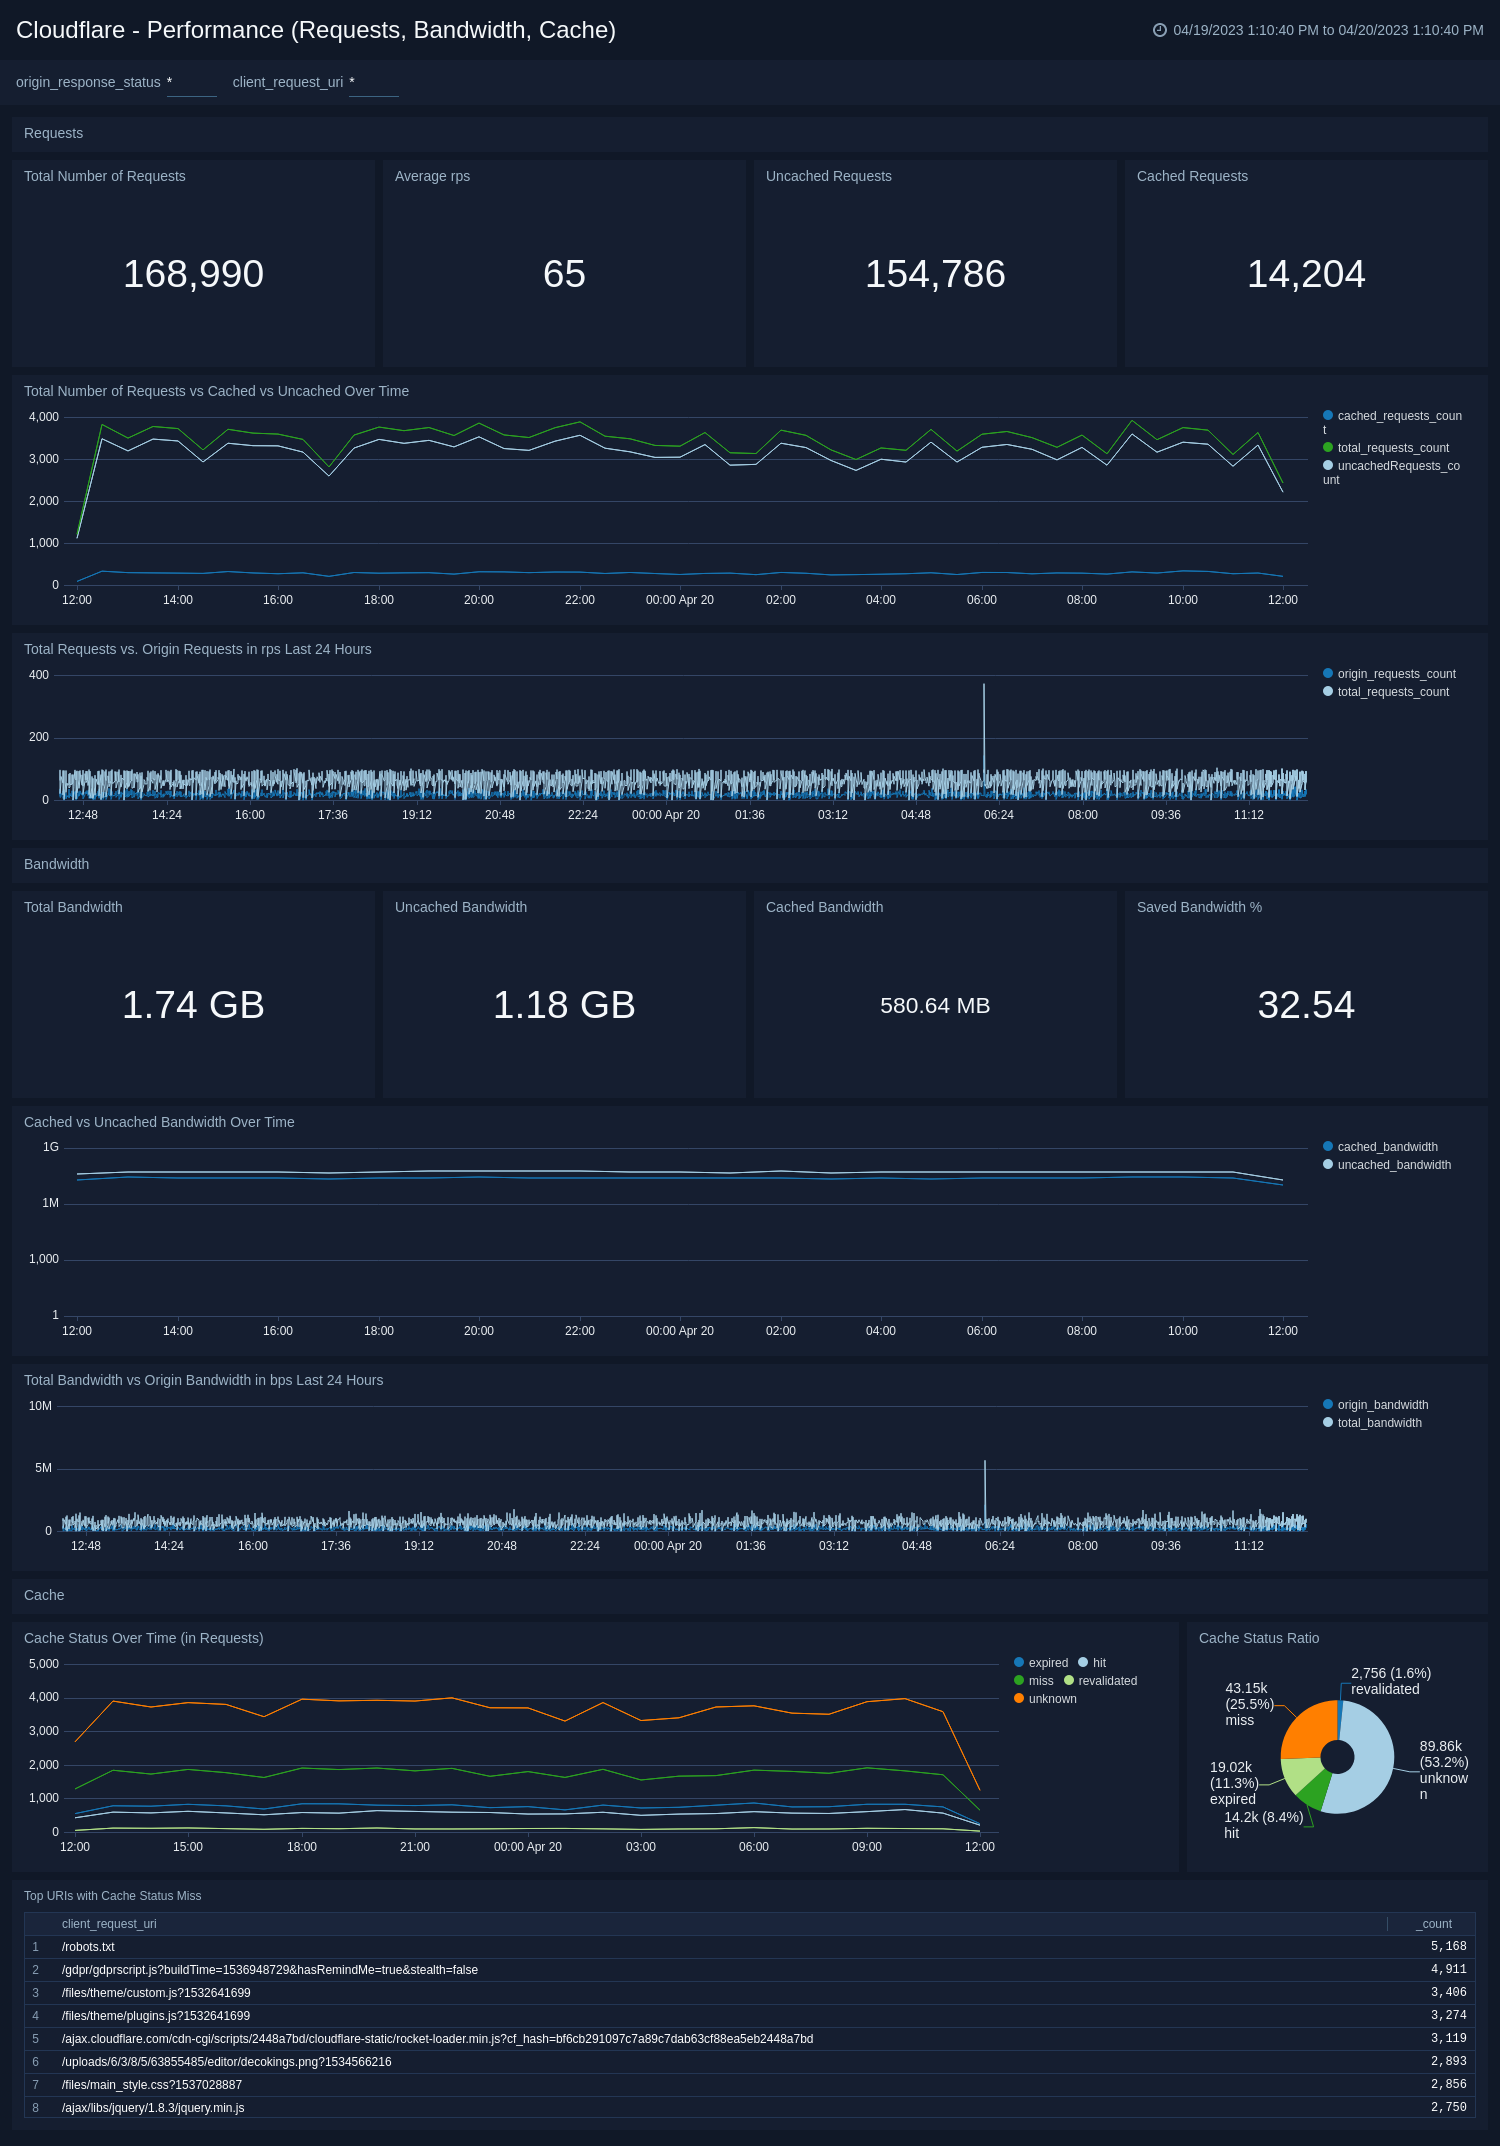
Performance (Requests, Bandwidth, Cache)
The Cloudflare - Performance (Requests, Bandwidth, Cache) dashboard identifies and addresses performance issues and caching misconfigurations. Metrics include total vs. cached bandwidth, saved bandwidth, total requests, cache ratio, top uncached requests, and more.
Use this dashboard to:
- Monitor caching behavior and identify misconfigurations.
- Improve configuration and caching ratio.
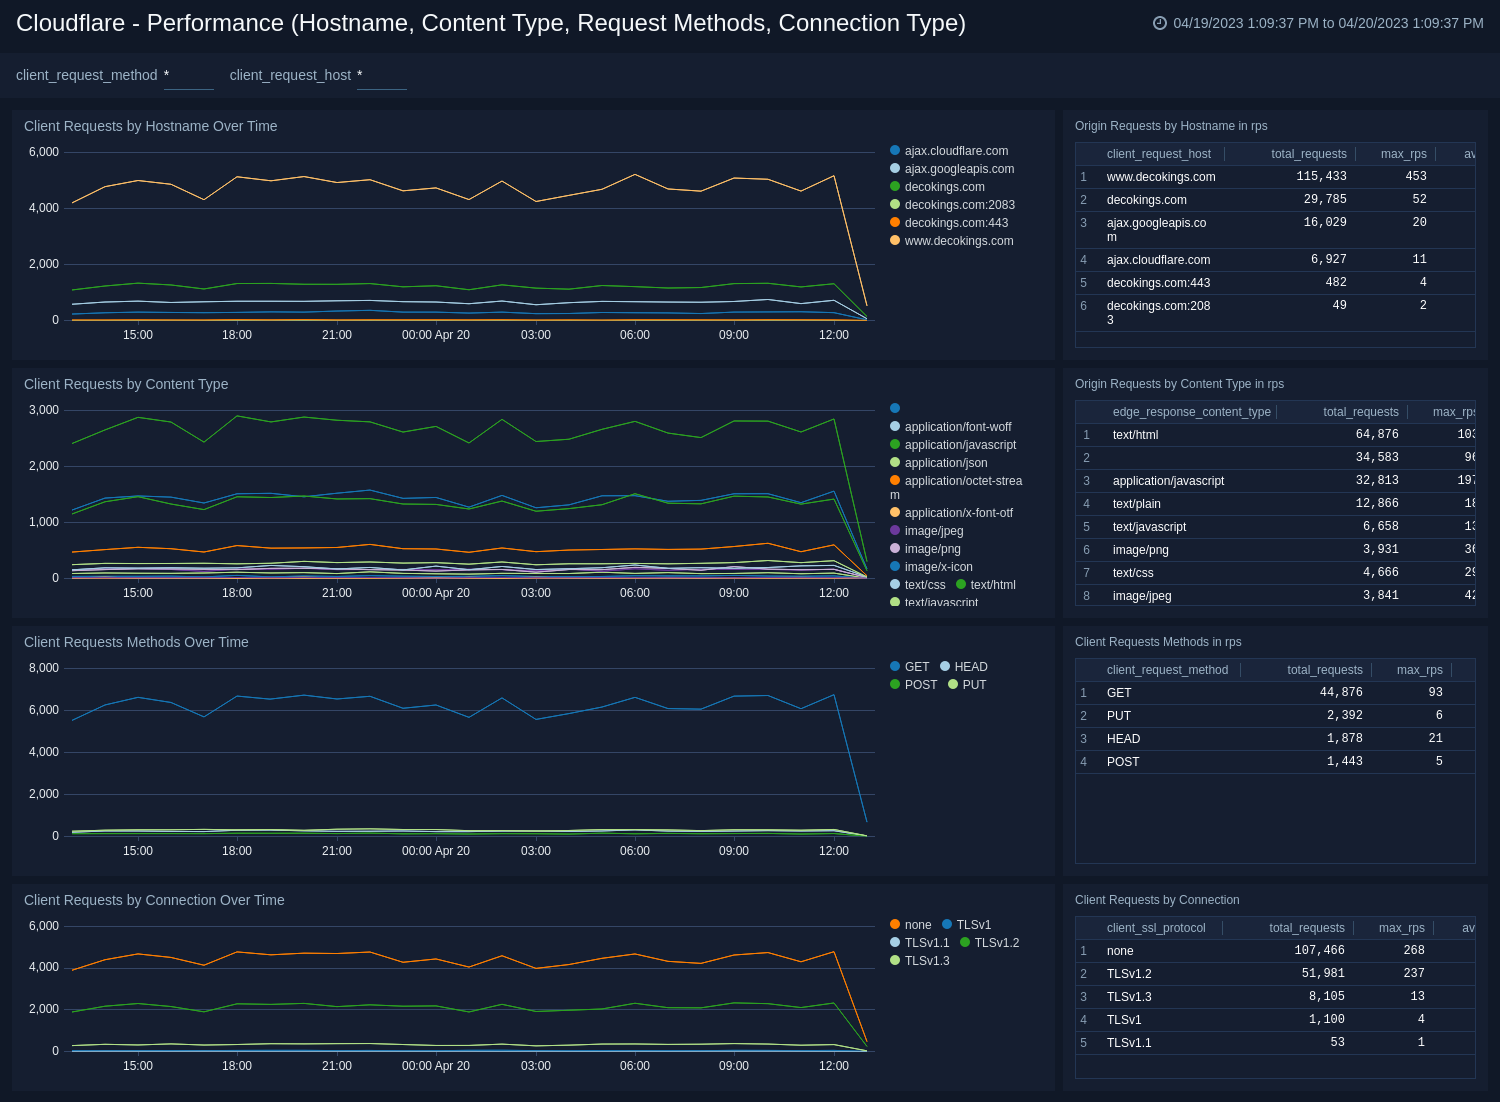
Performance (Hostname, Content Type, Request Methods, Connection Type)
The Cloudflare - Performance (Hostname, Content Type, Request Methods, Connection Type) dashboard provides insights into your most popular hostnames, most requested content types, breakdown of request methods, and connection type.
Use this dashboard to:
- Review the most requested content types, popular hostnames, and top triggered methods and TLS protocols.
- Compare these metrics over time and in requests per second.
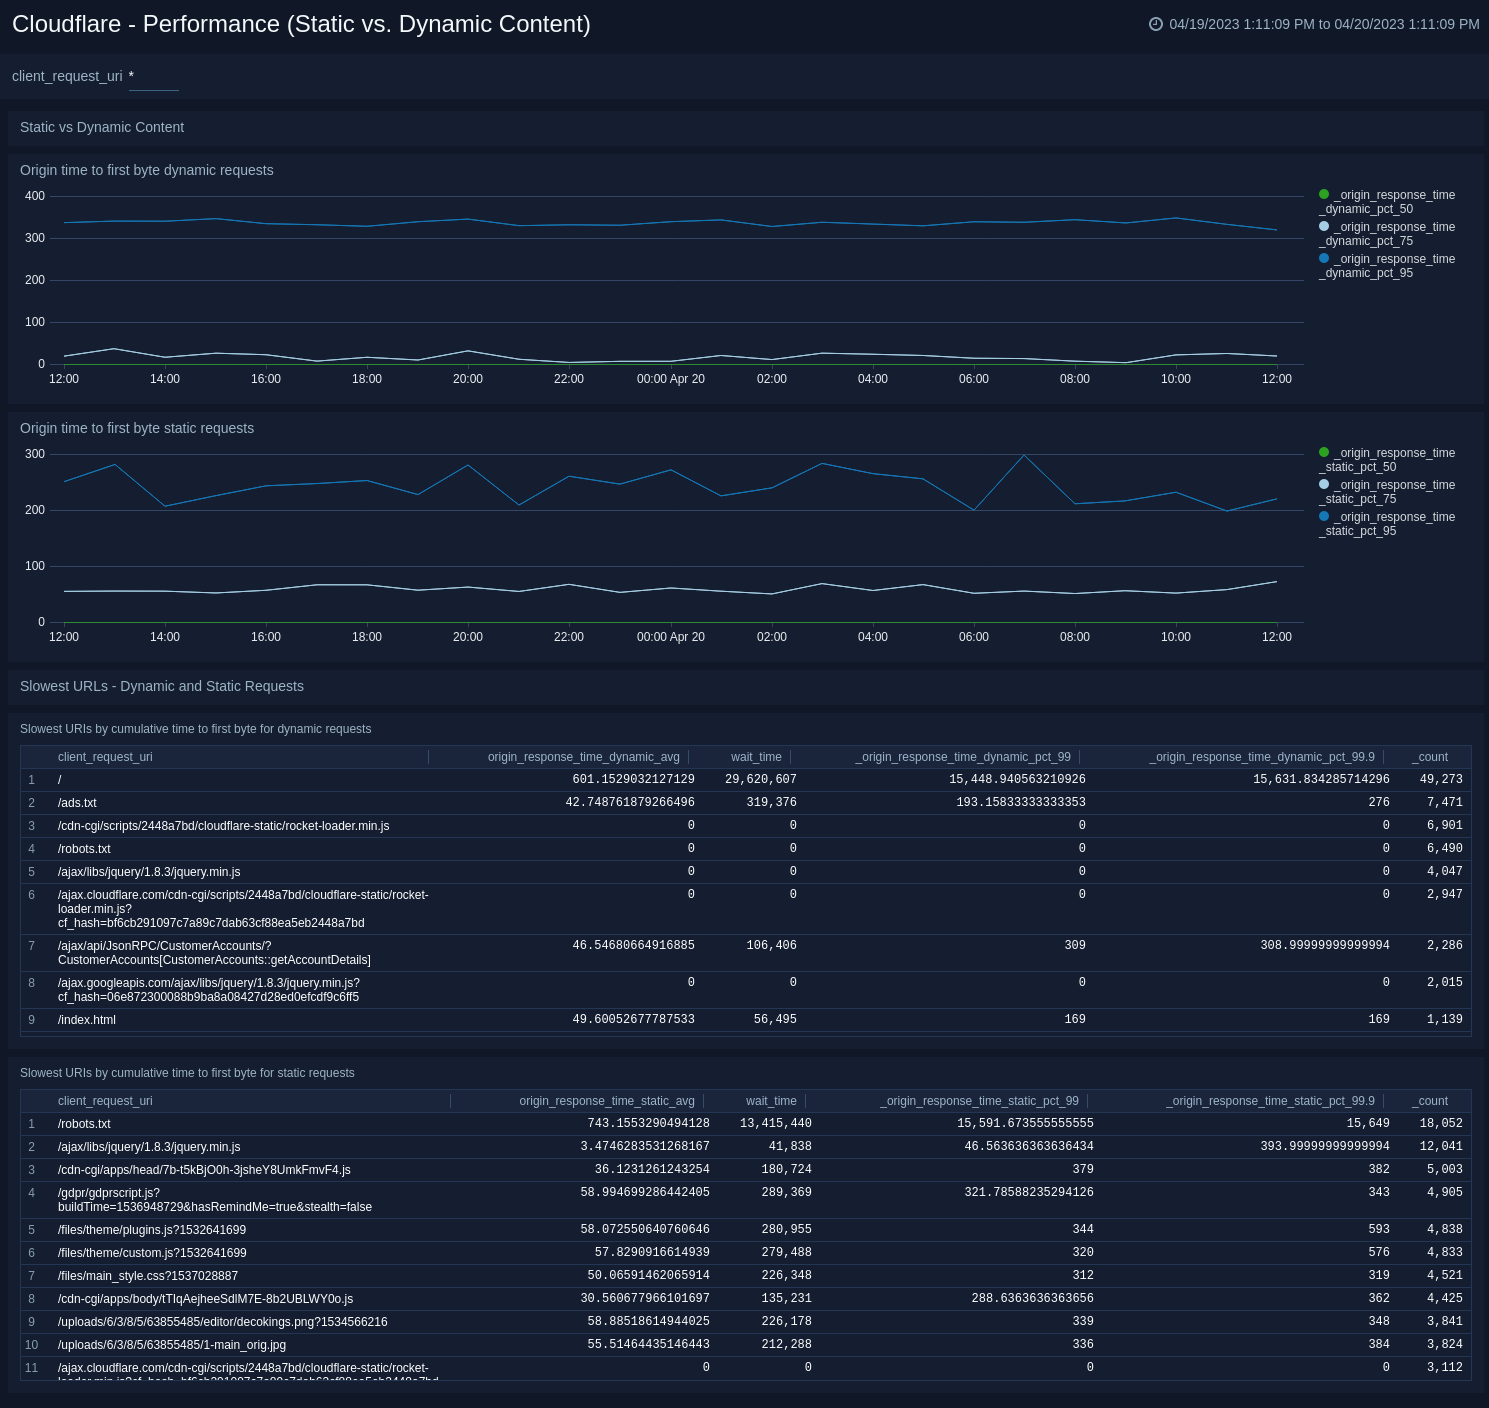
Performance (Static vs. Dynamic Content)
The Cloudflare - Performance (Static vs. Dynamic Content) dashboard provides insights into the performance of your static and dynamic content, including slowest URLs.
Use this dashboard to:
- Compare your static and dynamic content performance.
- Investigate the cause of slow requested URLs in order to improve performance.
Upgrade/Downgrade the Cloudflare app (Optional)
To update the app, do the following:
Next-Gen App: To install or update the app, you must be an account administrator or a user with Manage Apps, Manage Monitors, Manage Fields, Manage Metric Rules, and Manage Collectors capabilities depending upon the different content types part of the app.
- Select App Catalog.
- In the Search Apps field, search for and then select your app.
Optionally, you can identify apps that can be upgraded in the Upgrade available section. - To upgrade the app, select Upgrade from the Manage dropdown.
- If the upgrade does not have any configuration or property changes, you will be redirected to the Preview & Done section.
- If the upgrade has any configuration or property changes, you will be redirected to the Setup Data page.
- In the Configure section of your respective app, complete the following fields.
- Field Name. If you already have collectors and sources set up, select the configured metadata field name (eg _sourcecategory) or specify other custom metadata (eg: _collector) along with its metadata Field Value.
- Click Next. You will be redirected to the Preview & Done section.
Post-update
Your upgraded app will be installed in the Installed Apps folder and dashboard panels will start to fill automatically.
See our Release Notes changelog for new updates in the app.
To revert the app to a previous version, do the following:
- Select App Catalog.
- In the Search Apps field, search for and then select your app.
- To version down the app, select Revert to < previous version of your app > from the Manage dropdown.
Uninstalling the Cloudflare app (Optional)
To uninstall the app, do the following:
- Select App Catalog.
- In the 🔎 Search Apps field, run a search for your desired app, then select it.
- Click Uninstall.