Istio

Istio reduces the complexity of managing Kubernetes deployments by providing a uniform platform for securing, connecting, and monitoring microservices.
The Sumo Logic App for Istio provides visibility into the health and performance of Istio and its control plane components, including Mixer, Galley, Citadel, Pilot and Envoy. App dashboards also allow you to monitor how services and applications are performing in Istio Mesh, providing insights into service latency, errors, network traffic, and request workloads.
This app supports Istio versions 1.8.x and 1.9.x+.
Log and Metrics Types
- Access logs - Refer to this page for Istio Access log format.
- Istio Metrics - Refer to this page for detailed Istio Metrics
Sample queries
Query Sample from Dashboard "Istio - Logs" > Panel "Non 200 Response Codes":
namespace=istio-system cluster={{cluster}}
| json field=_raw "log" as log_message
| parse regex field=log_message "\[(?<start_time>.+)\] \"(?<req>.+?)\" (?<response_code>.+?) (?<response_flags>.+?) (?<response_code_details>.+?) (?<con_term_details>.+?) \"(?<upstream_fail_reason>.+?)\" (?<bytes_recvd>.+?) (?<bytessent>.+?) (?<duration>.+?) (?<resp>.+?) \"(?<req_fwd_for>.+?)\" \"(?<user_agent>.+?)\" \"(?<request_id>.+?)\" \"(?<request_authority>.+?)\" \"(?<upstream_host>.+?)\" (?<upstream_cluster>.+?) (?<upstream_loacl_address>.+?) (?<downstream_local_address>.+?) (?<downstream_remote_address>.+?) (?<requested_server_name>.+?) (?<route_name>.+?)"
| where response_code != "200"
| timeslice 1h
| count by response_code, _timeslice
| transpose row _timeslice column response_code
Collecting logs and metrics for the Istio App
This section provides instructions for collecting logs and metrics for the Sumo App for Istio. Logs and metrics are collected with the Sumo Logic Kubernetes Collection Helm Chart. If you've not yet set up Kubernetes Collection, visit our Kubernetes and Kubernetes Quickstart docs to learn how to install.
This app supports Istio versions 1.8.x and 1.9.x+. Configure log and metrics collection with the Sumo Logic Helm chart, using one of the following options:
Log Collection:
- Enable Access Logging to write logs to stdout.
The Sumo Logic Kubernetes Collection Helm Chart will automatically capture the logs from stdout and will send the logs to Sumologic.
Metrics Collection:
-
If you did install using the Sumo Logic Kubernetes Helm Chart, update the Helm Chart values file with the following config:
kube-prometheus-stack:
  prometheus:
    prometheusSpec:
      additionalScrapeConfigs:
        ...
        - job_name: 'istiod'
          kubernetes_sd_configs:
          - role: endpoints
            namespaces:
              names:
              - istio-system
          relabel_configs:
          - source_labels: [__meta_kubernetes_service_name, __meta_kubernetes_endpoint_port_name]
            action: keep
            regex: istiod;http-monitoring
        - job_name: 'envoy-stats'
          metrics_path: /stats/prometheus
          kubernetes_sd_configs:
          - role: pod
          relabel_configs:
          - source_labels: [__meta_kubernetes_pod_container_port_name]
            action: keep
            regex: '.*-envoy-prom'
You can read more about the above scrape configs here
-
Add following configuration to additionalRemoteWrite. These remote write configs make sure only metrics used by Sumo Logic Istio App are forwarded to Sumo Logic by Sumo Logic Kubernetes Helm Chart.
kube-prometheus-stack:
  prometheus:
    prometheusSpec:
      additionalRemoteWrite:
        ...
        - url: http://$(METADATA_METRICS_SVC).$(NAMESPACE).svc.cluster.local:9888/prometheus.metrics.istio
          remoteTimeout: 5s
          writeRelabelConfigs:
            - action: keep
              regex: (?:galley_validation_(passed|failed|config_updates|config_update_error))
              sourceLabels: [__name__]
        - url: http://$(METADATA_METRICS_SVC).$(NAMESPACE).svc.cluster.local:9888/prometheus.metrics.istio
          remoteTimeout: 5s
          writeRelabelConfigs:
            - action: keep
              regex: (?:istio_(response_(bytes_sum|bytes_bucket)|requests_total|request_(duration_milliseconds_sum|duration_milliseconds_bucket|bytes_sum|bytes_bucket)|build|agent_(process_virtual_memory_bytes|process_max_fds|pilot_xds_pushes|pilot_xds_expired_nonce|pilot_xds|pilot_virt_services|pilot_proxy_queue_time_sum|pilot_endpoint_not_ready|num_outgoing_requests|num_failed_outgoing_requests|go_threads|go_memstats_heap_inuse_bytes|go_memstats_heap_alloc_bytes|go_memstats_gc_cpu_fraction|go_memstats_alloc_bytes_total|go_memstats_alloc_bytes|go_gc_duration_seconds)))
sourceLabels: [__name__] -
Upgrade the sumo logic helm chart by running the following:
helm upgrade --install <my-release-name> sumologic/sumologic -f sumologic-istio.yaml
Validation Steps
-
Do port forward via your terminal (
my-releaseis my release I used while setting up Sumo Logic Kubernetes Collection Helm Chart:kubectl port-forward prometheus-my-release-kube-prometheus-prometheus-0 9090 -
Open http://127.0.0.1:9090/config in a web browser and make sure the following remotewrite configs are present:
- url: http://my-release-sumologic-remote-write-proxy.sumologic.svc.cluster.local:9888/prometheus.metrics.istio
  remote_timeout: 5s
  write_relabel_configs:
  - source_labels: [__name__]
    separator: ;
    regex: (?:galley_validation_(passed|failed|config_updates|config_update_error))
    replacement: $1
    action: keep
  queue_config:
    capacity: 2500
    max_shards: 200
    min_shards: 1
    max_samples_per_send: 500
    batch_send_deadline: 5s
    min_backoff: 30ms
    max_backoff: 100ms
- url: http://my-release-sumologic-remote-write-proxy.sumologic.svc.cluster.local:9888/prometheus.metrics.istio
  remote_timeout: 5s
  write_relabel_configs:
  - source_labels: [__name__]
    separator: ;
    regex: (?:istio_(response_(bytes_sum|bytes_bucket)|requests_total|request_(duration_milliseconds_sum|duration_milliseconds_bucket|bytes_sum|bytes_bucket)|build|agent_(process_virtual_memory_bytes|process_max_fds|pilot_xds_pushes|pilot_xds_expired_nonce|pilot_xds|pilot_virt_services|pilot_proxy_queue_time_sum|pilot_endpoint_not_ready|num_outgoing_requests|num_failed_outgoing_requests|go_threads|go_memstats_heap_inuse_bytes|go_memstats_heap_alloc_bytes|go_memstats_gc_cpu_fraction|go_memstats_alloc_bytes_total|go_memstats_alloc_bytes|go_gc_duration_seconds)))
    replacement: $1
    action: keep
  queue_config:
    capacity: 2500
    max_shards: 200
    min_shards: 1
    max_samples_per_send: 500
    batch_send_deadline: 5s
    min_backoff: 30ms
    max_backoff: 100ms
Above remotewrite configs make sure only metrics used by Sumo Logic Istio App are forwarded to Sumo Logic by Sumo Helm Chart.
-
Open http://127.0.0.1:9090/config in a web browser and make sure the following scrape configs are present:
- job_name: istiod
  honor_timestamps: true
  scrape_interval: 30s
  scrape_timeout: 10s
  metrics_path: /metrics
  scheme: http
  follow_redirects: true
  enable_http2: true
  relabel_configs:
  - source_labels: [__meta_kubernetes_service_name, __meta_kubernetes_endpoint_port_name]
    separator: ;
    regex: istiod;http-monitoring
    replacement: $1
    action: keep
  kubernetes_sd_configs:
  - role: endpoints
    kubeconfig_file: ""
    follow_redirects: true
    enable_http2: true
    namespaces:
      own_namespace: false
      names:
      - istio-system
- job_name: envoy-stats
  honor_timestamps: true
  scrape_interval: 30s
  scrape_timeout: 10s
  metrics_path: /stats/prometheus
  scheme: http
  follow_redirects: true
  enable_http2: true
  relabel_configs:
  - source_labels: [__meta_kubernetes_pod_container_port_name]
    separator: ;
    regex: .*-envoy-prom
    replacement: $1
    action: keep
  kubernetes_sd_configs:
  - role: pod
    kubeconfig_file: ""
    follow_redirects: true
    enable_http2: true
Installing the Istio App
This section provides instructions for installing the Istio App, as well as descriptions and examples for each of the dashboards.
Now that you have set up metric and log collection for Istio, install the Sumo Logic App for Istio and access the pre-configured dashboards that provide visibility into your Istio environment.
To install the app:
- Select App Catalog.
- In the 🔎 Search Apps field, run a search for your desired app, then select it.
- Click Install App.
note
Sometimes this button says Add Integration.
- On the next configuration page, under Select Data Source for your App, complete the following fields:
- Data Source. Select one of the following options:
- Choose Source Category and select a source category from the list; or
- Choose Enter a Custom Data Filter, and enter a custom source category beginning with an underscore. For example,
_sourceCategory=MyCategory.
- Folder Name. You can retain the existing name or enter a custom name of your choice for the app.
- All Folders (optional). The default location is the Personal folder in your Library. If desired, you can choose a different location and/or click New Folder to add it to a new folder.
- Data Source. Select one of the following options:
- Click Next.
- Look for the dialog confirming that your app was installed successfully.
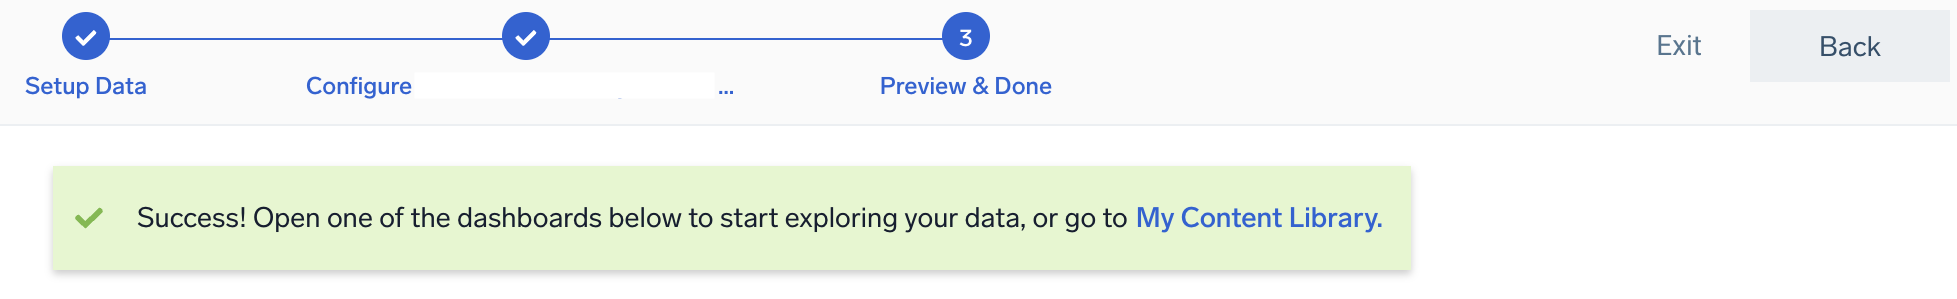
Post-installation
Once your app is installed, it will appear in your Personal folder or the folder that you specified. From here, you can share it with other users in your organization. Dashboard panels will automatically start to fill with data matching the time range query received since you created the panel. Results won't be available immediately, but within about 20 minutes, you'll see completed graphs and maps.
Viewing Istio Dashboards
Template variables provide dynamic dashboards that can rescope data on the fly. As you apply variables to troubleshoot through your dashboard, you view dynamic changes to the data for a quicker resolution to the root cause. You can use template variables to drill down and examine the data on a granular level. For more information, see Filter with template variables.
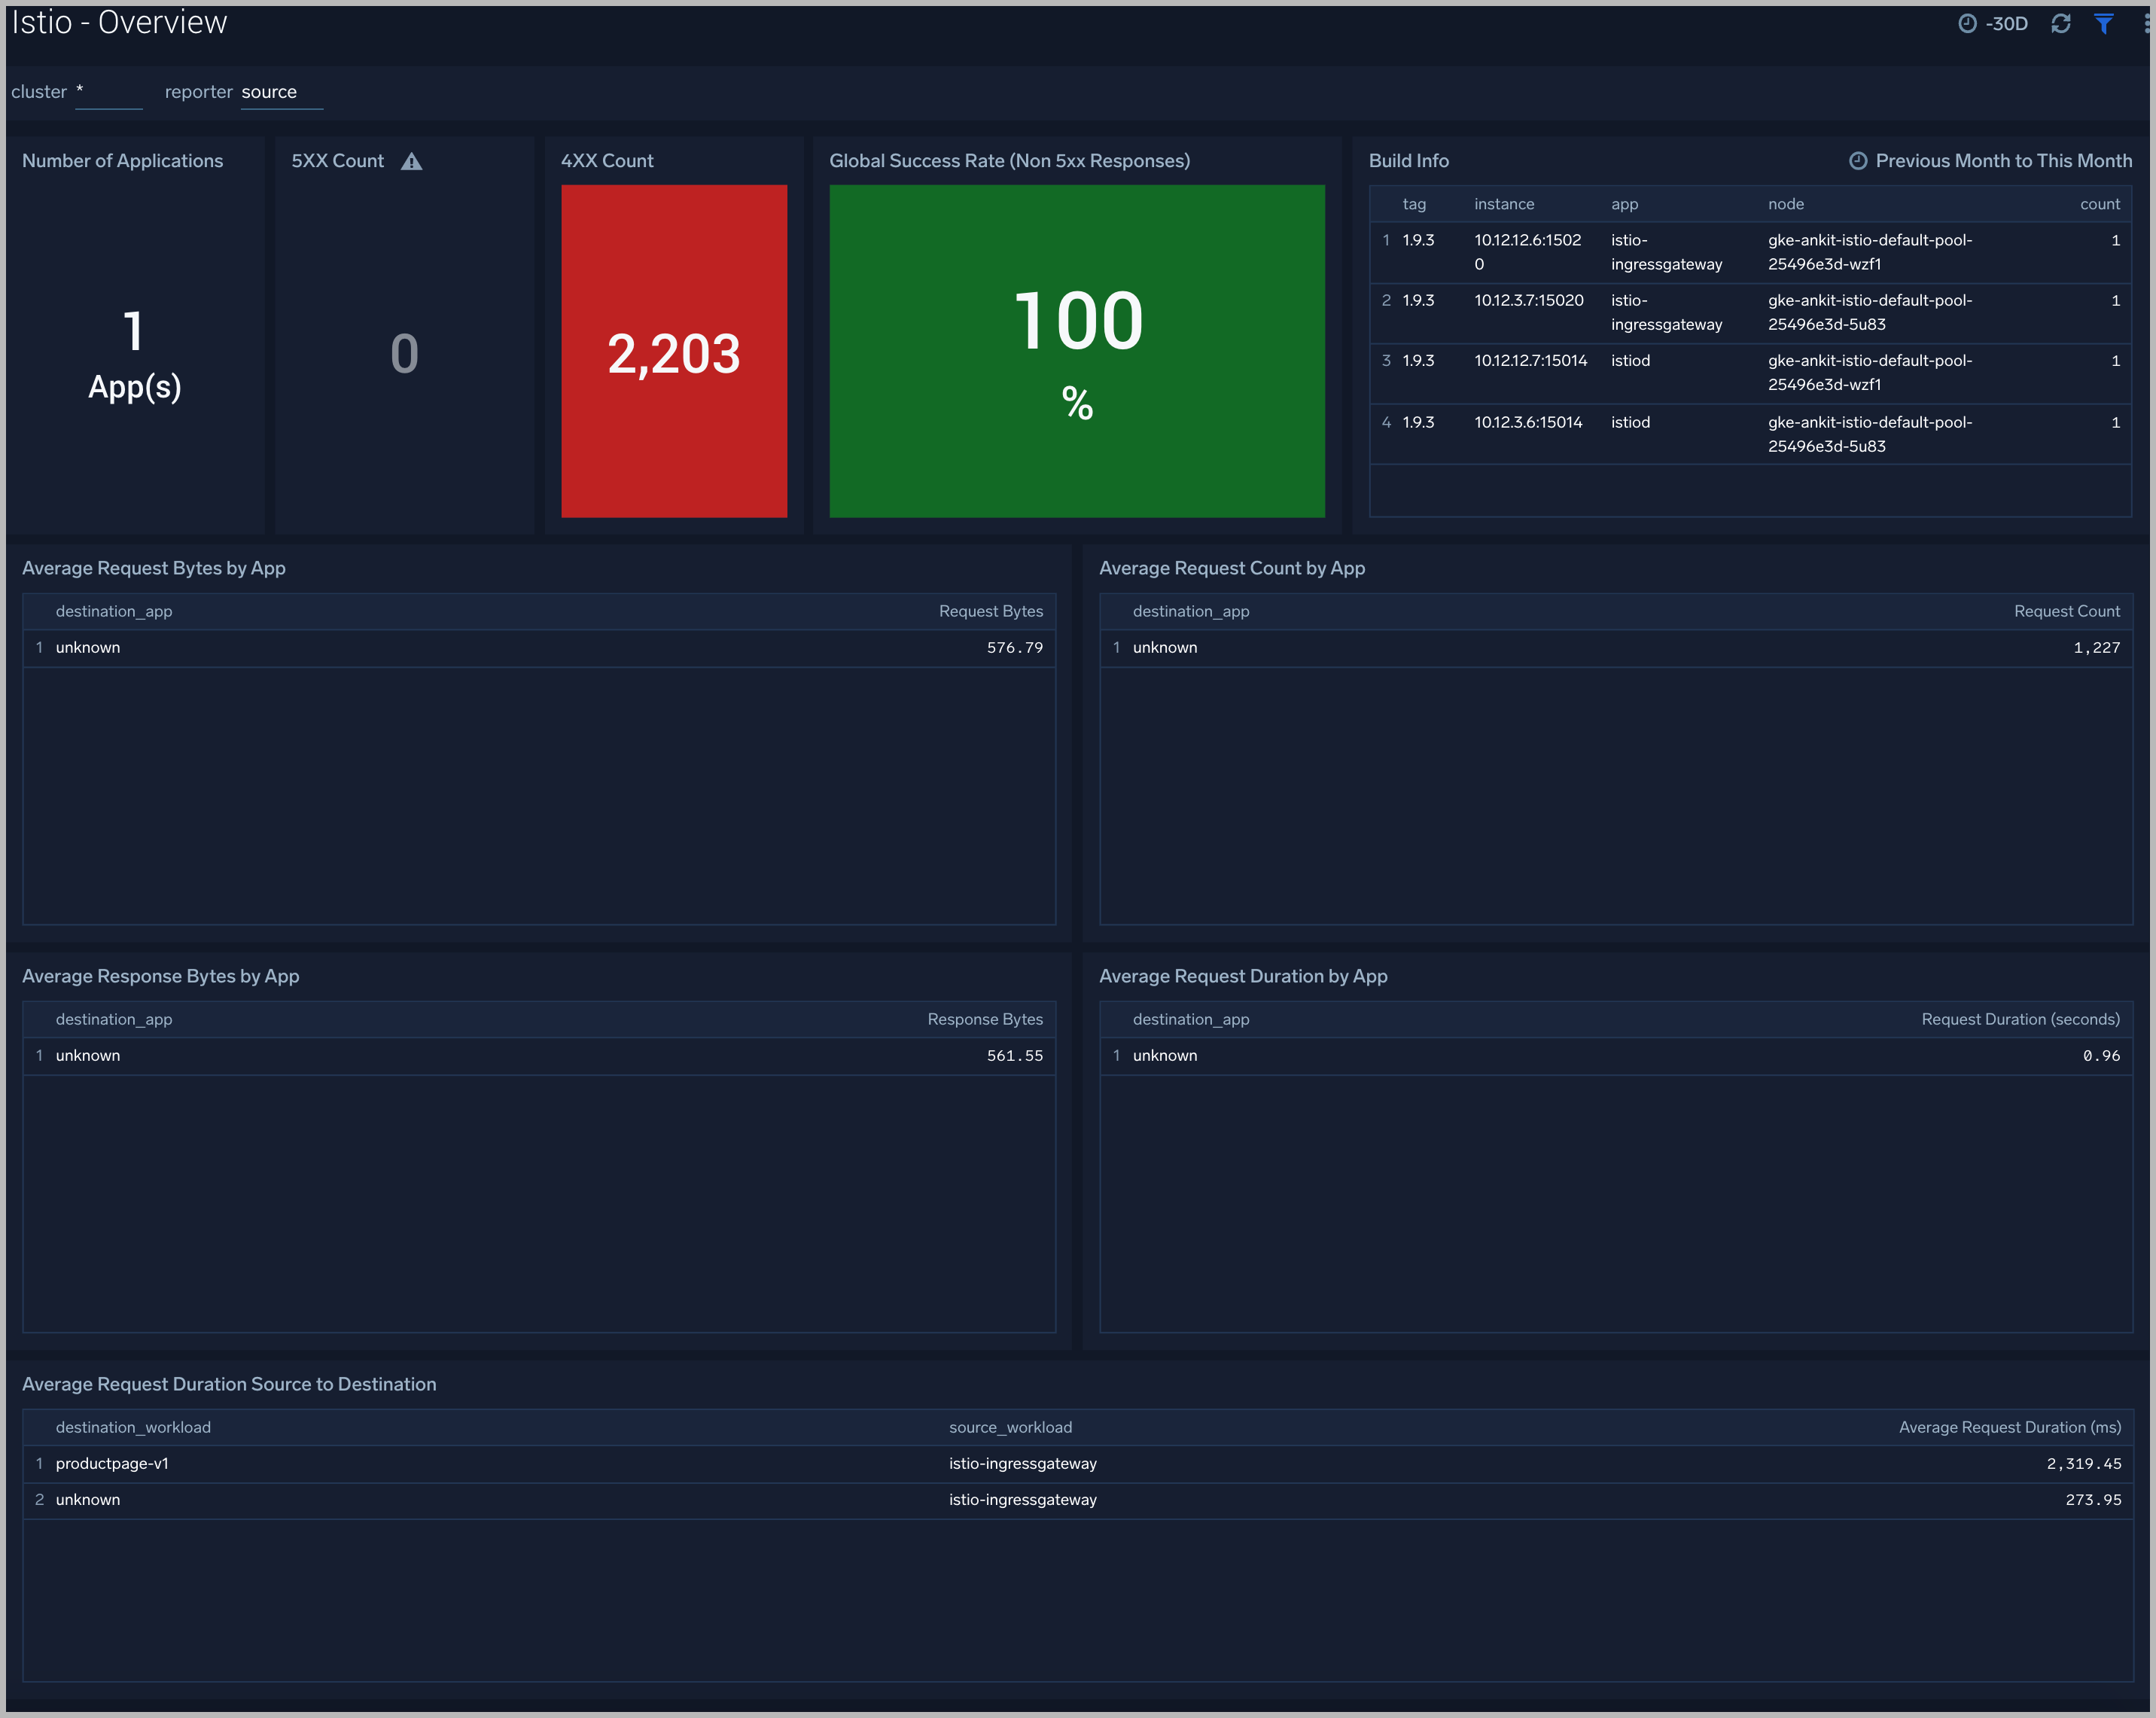
Overview
The Istio Overview dashboard provides a high-level view of the number of applications in your environment, the average requests and responses, and the average duration of requests.
Use this dashboard to:
- Monitor application activity by requests, bytes transferred, and latency.
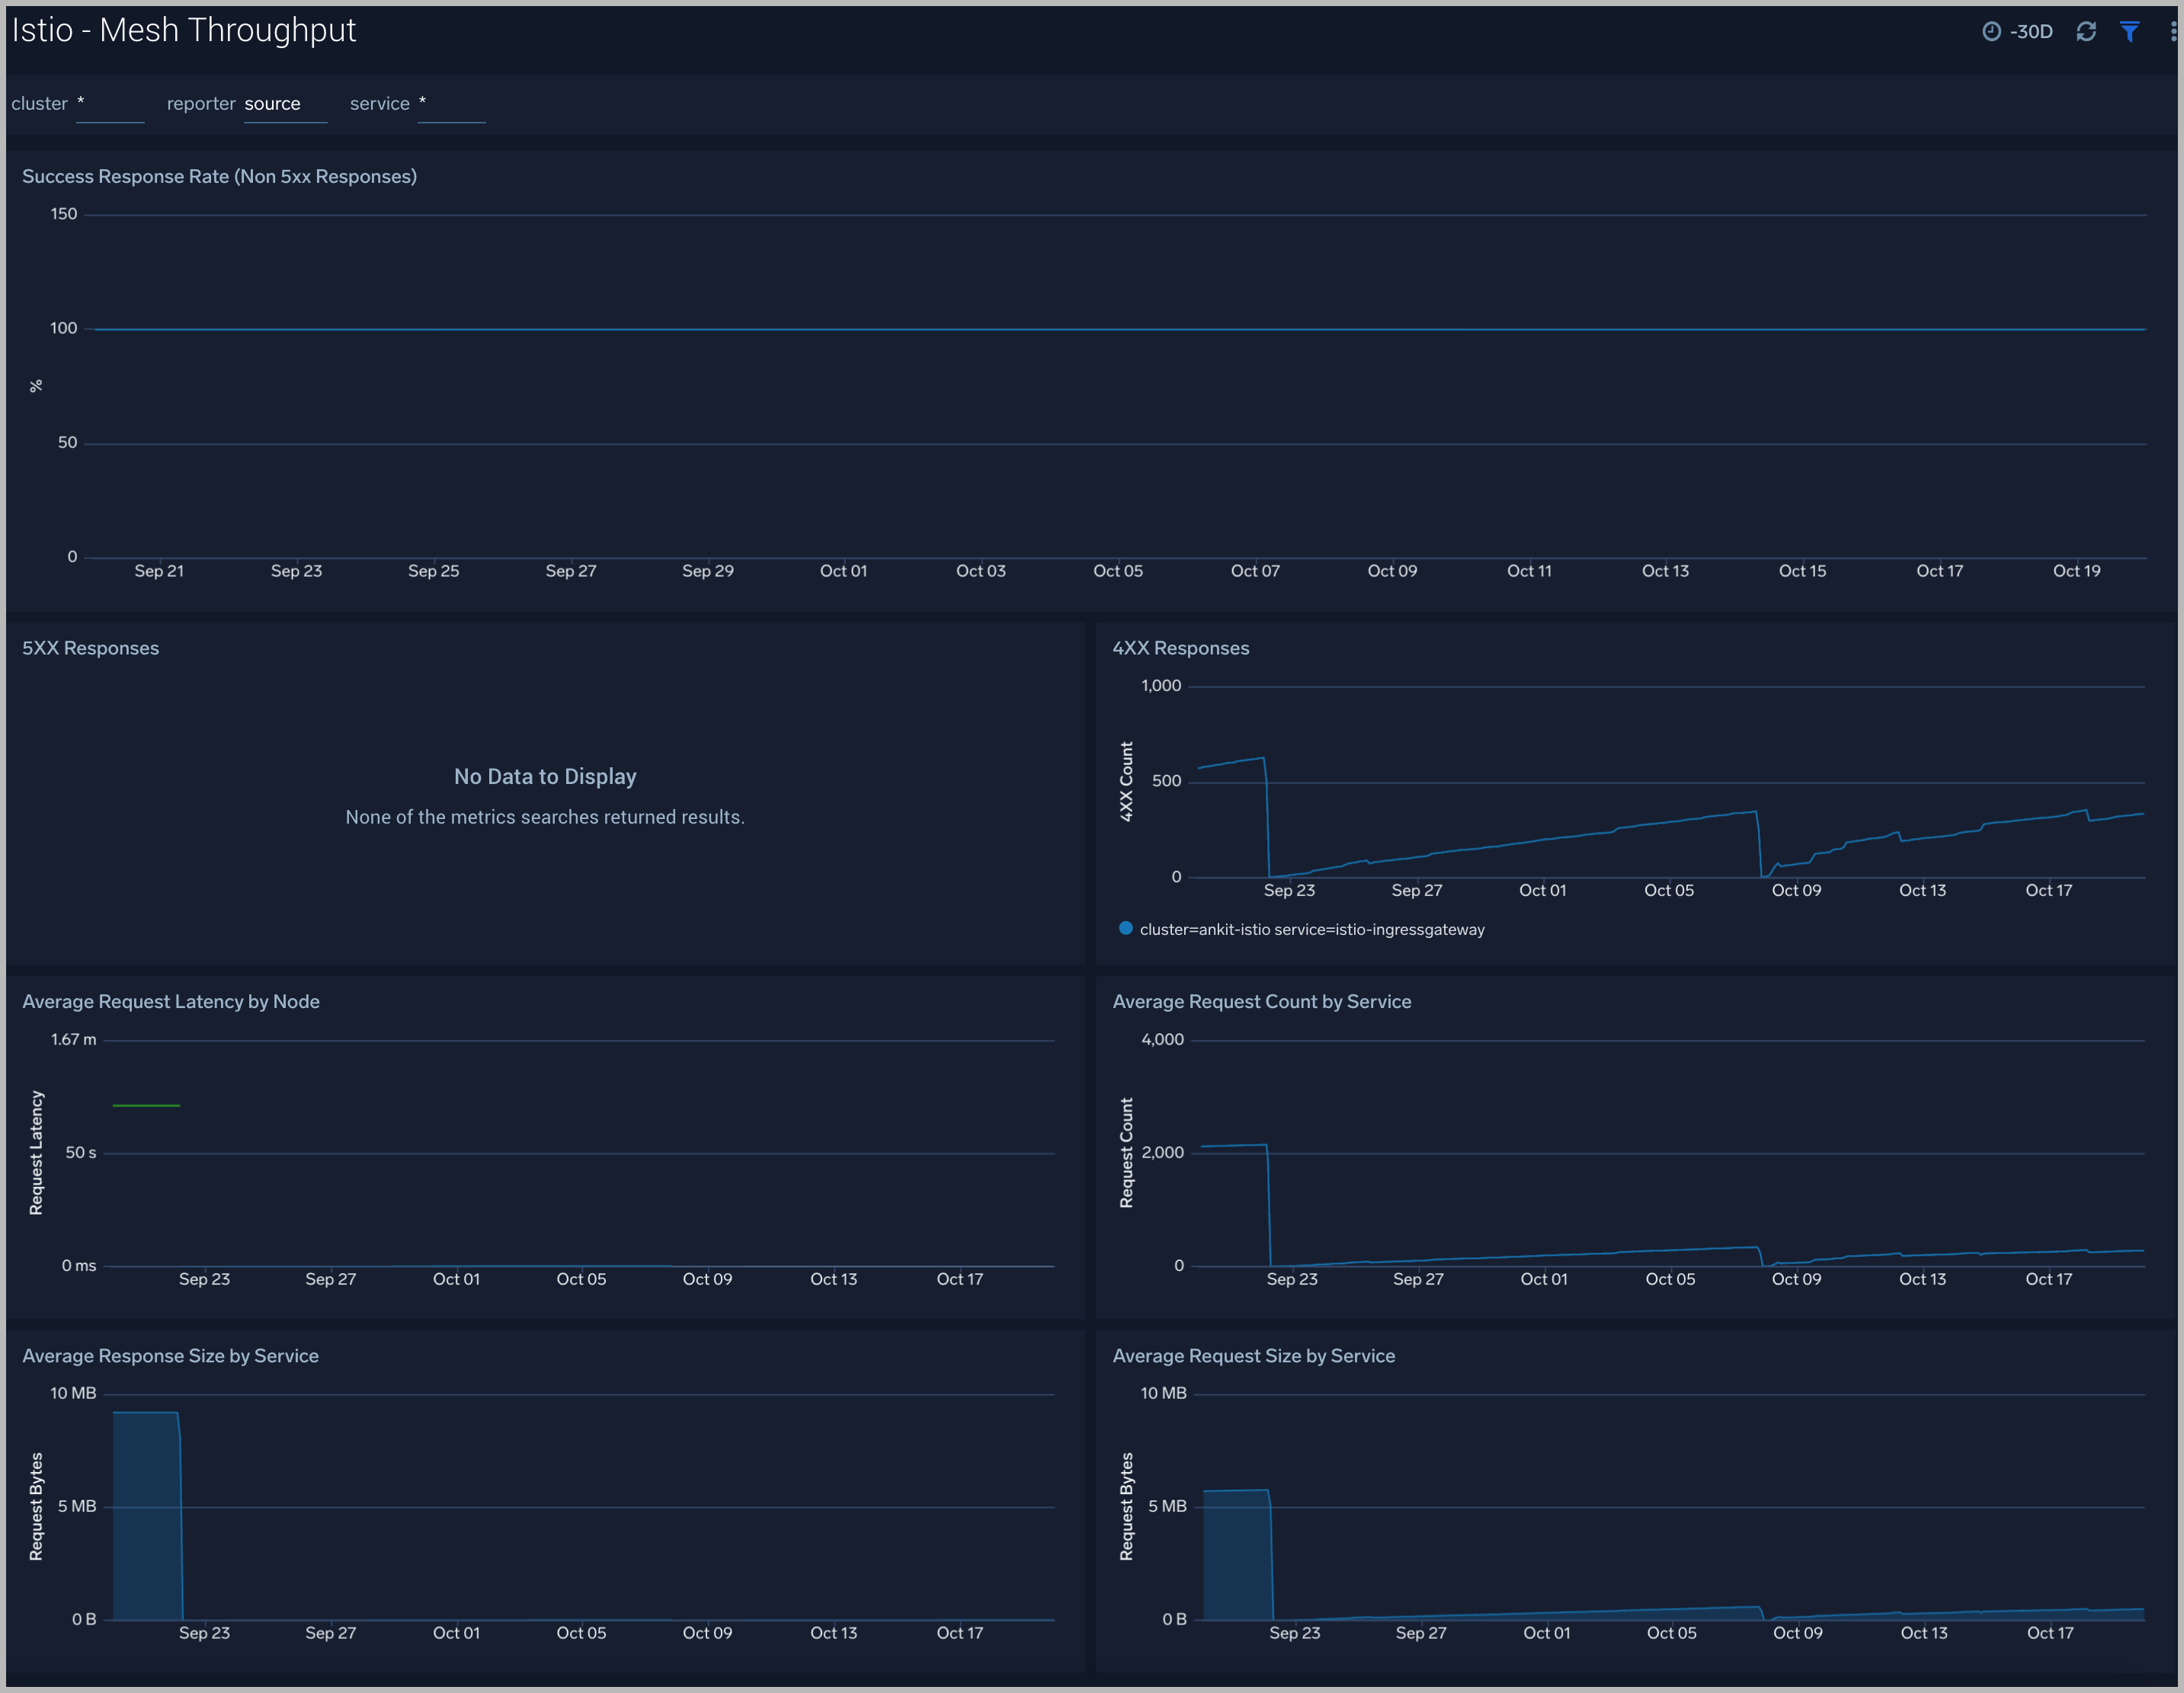
Mesh Throughput
The Istio Mesh dashboard provides insights into the network of microservices in your environment, service success response rate, 4XX/5XX responses, latency, requests count, and request/response statistics.
Use this dashboard to:
- Monitor mesh performance and latency
- Monitor Errors and request/response size.
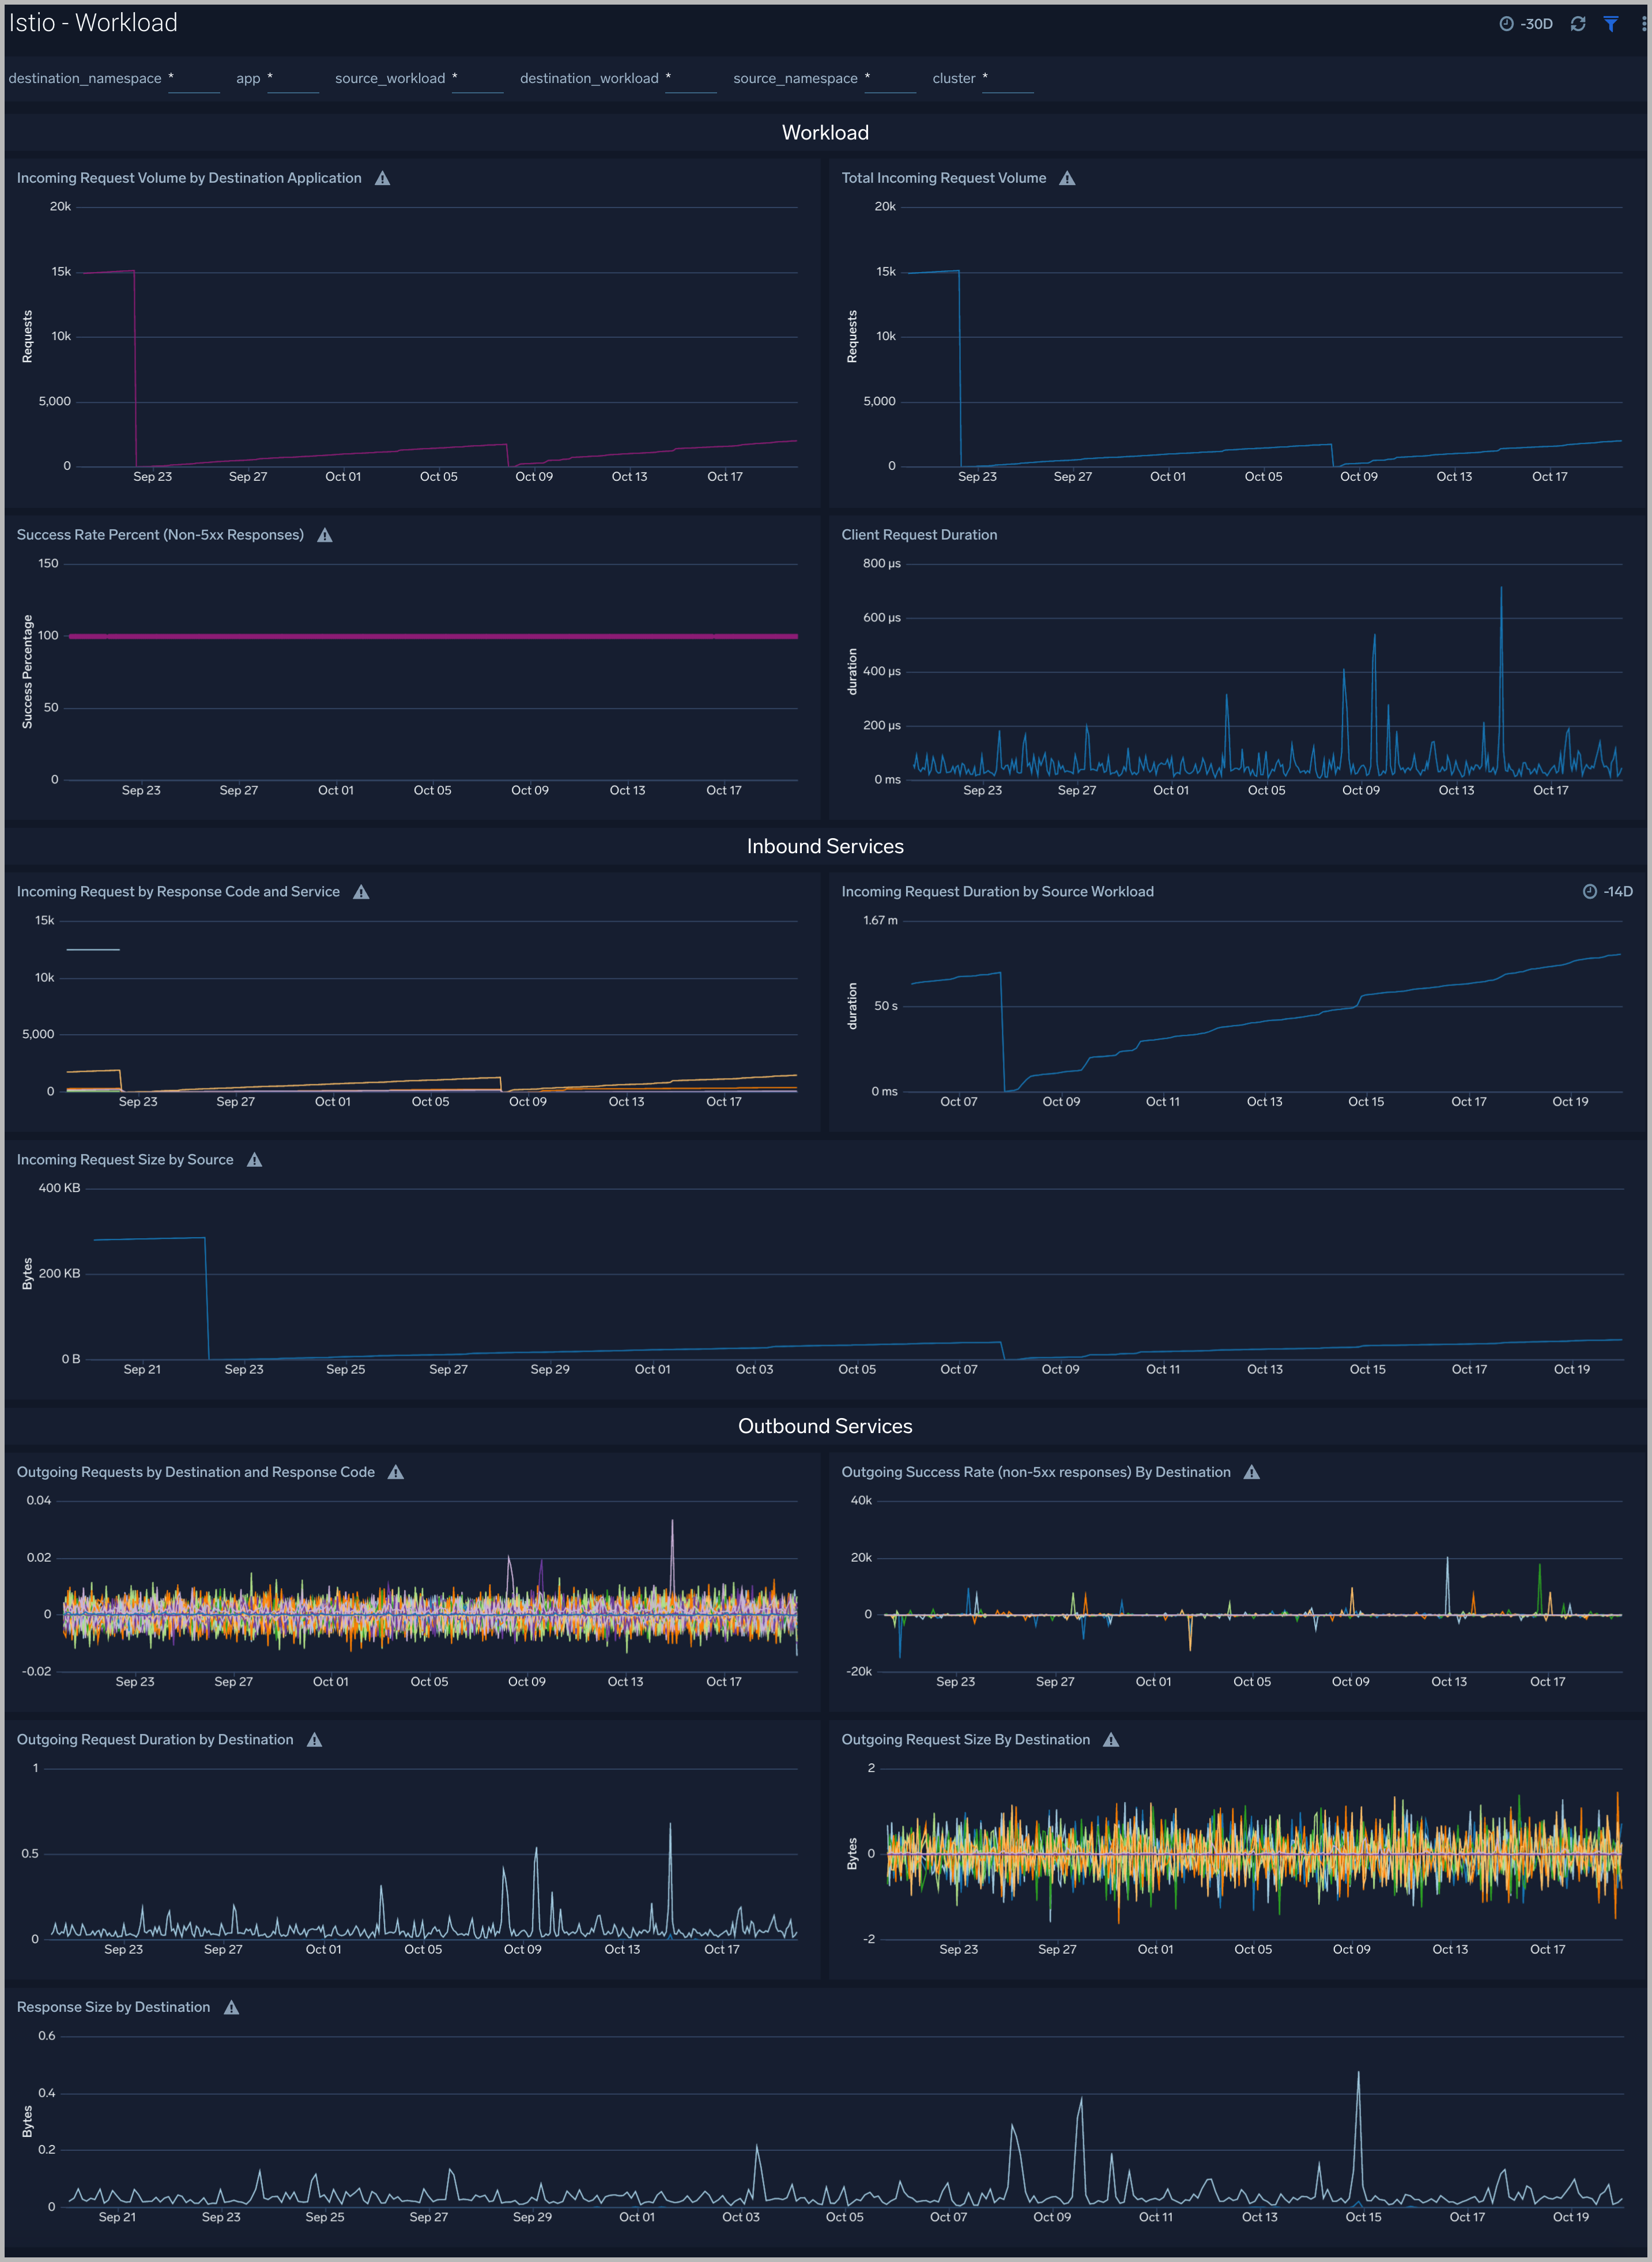
Workload
The Istio Workload dashboard allows you to monitor the overall workloads in Istio and provides detailed breakdowns on inbound and outbound services.
Use this dashboard to:
- Monitor requests and responses for individual workloads.
- Analyze inbound and outbound services for workloads.
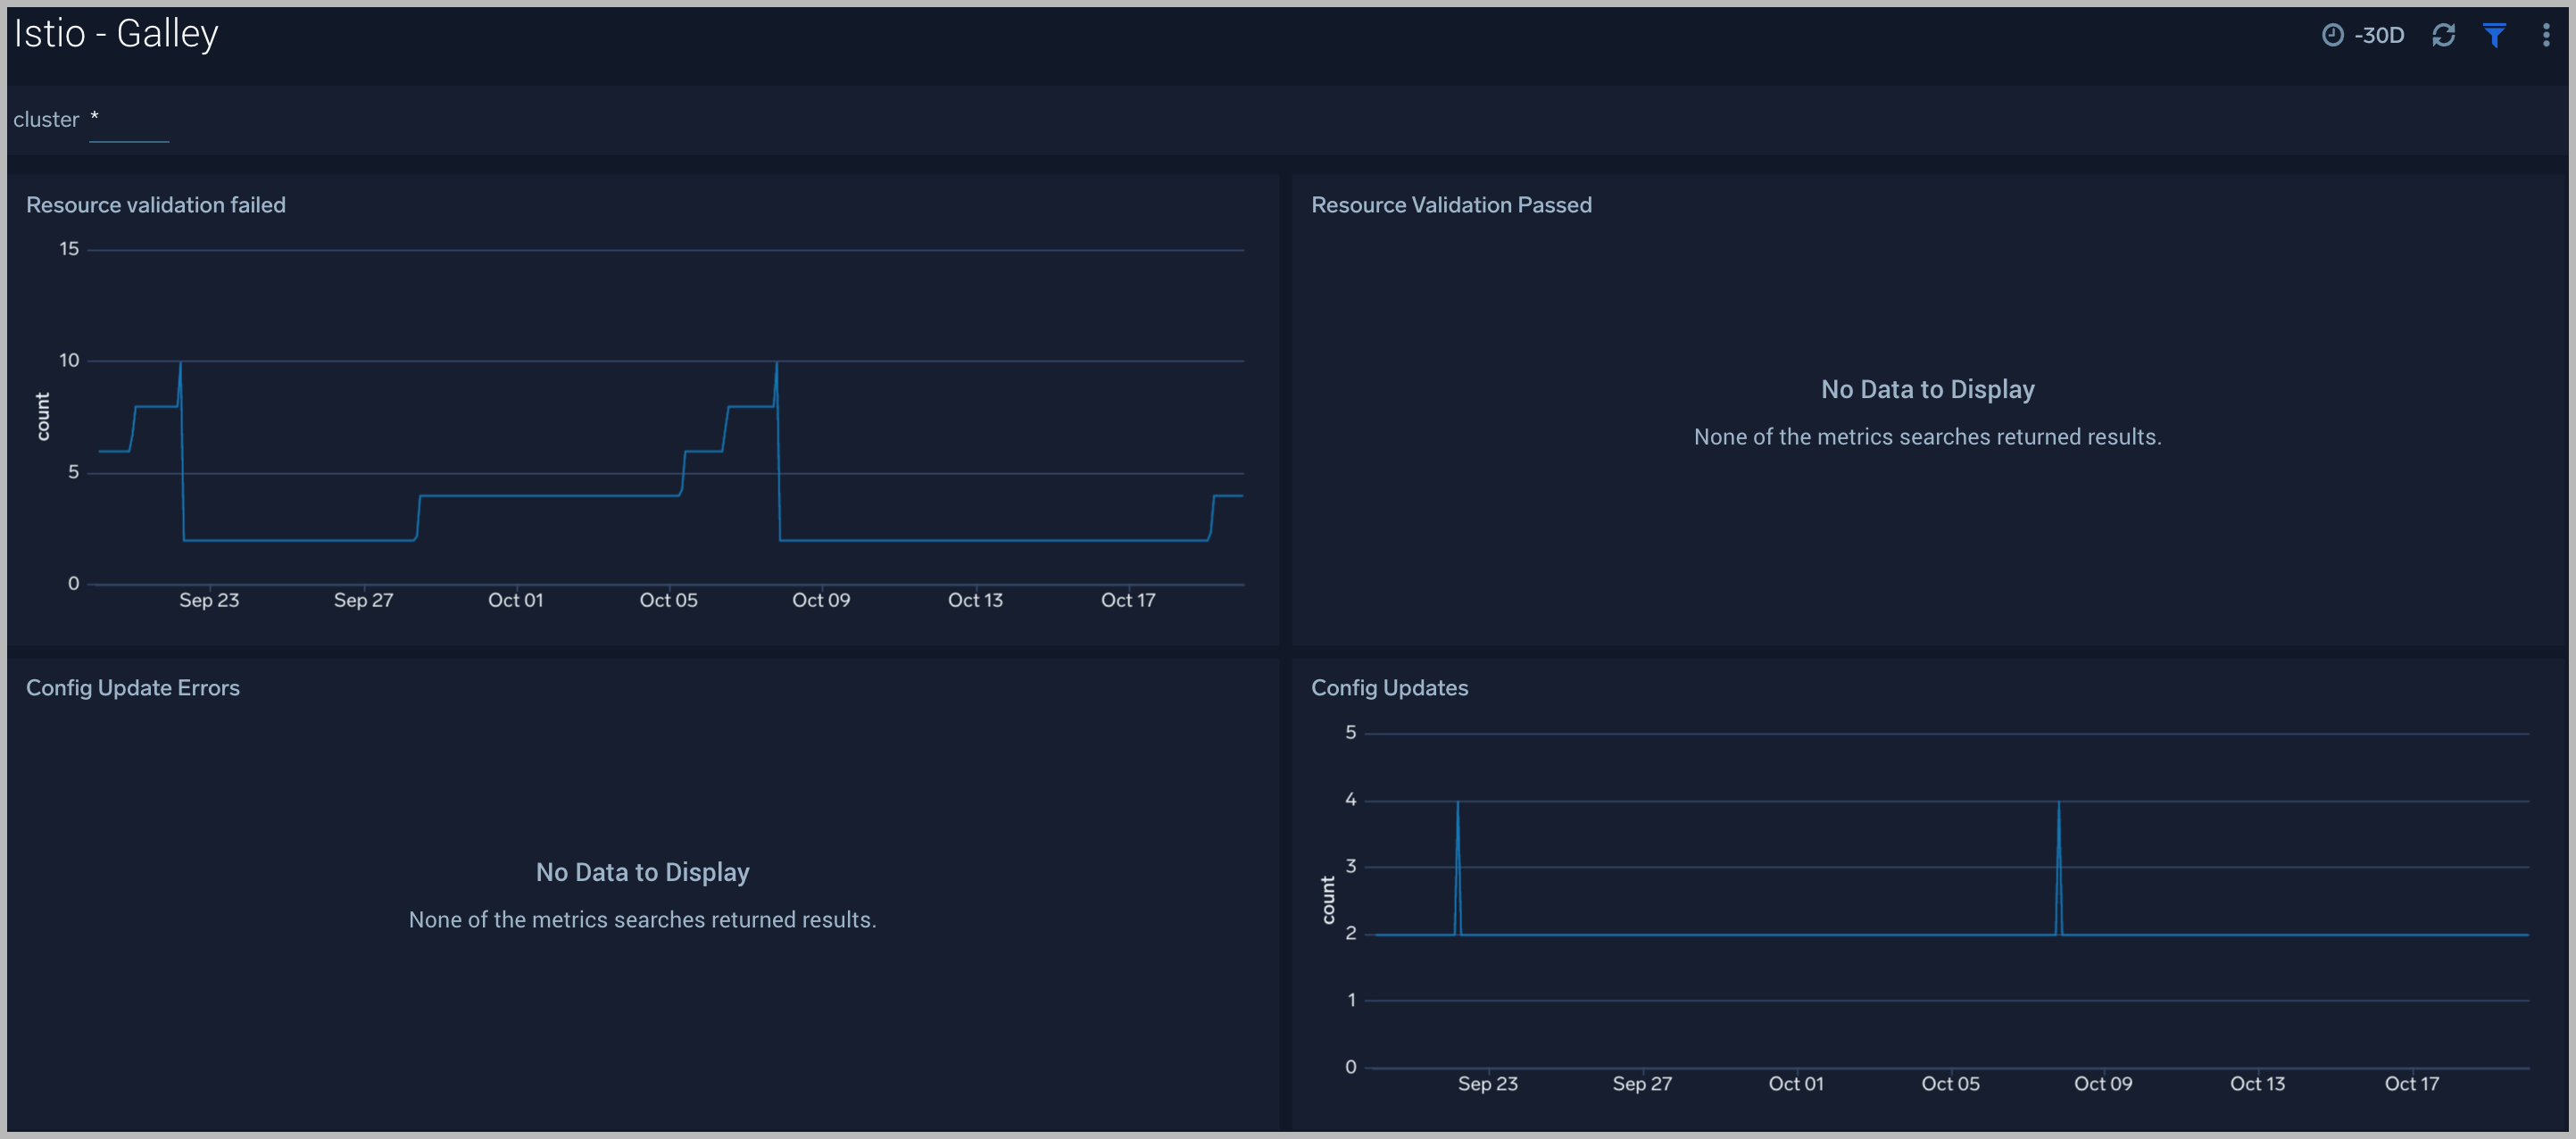
Galley
The Istio - Galley Dashboard allows you to monitor the Istio Galley.
Use this dashboard to:
- Monitor resource validation passed/failed events and config updates errors.
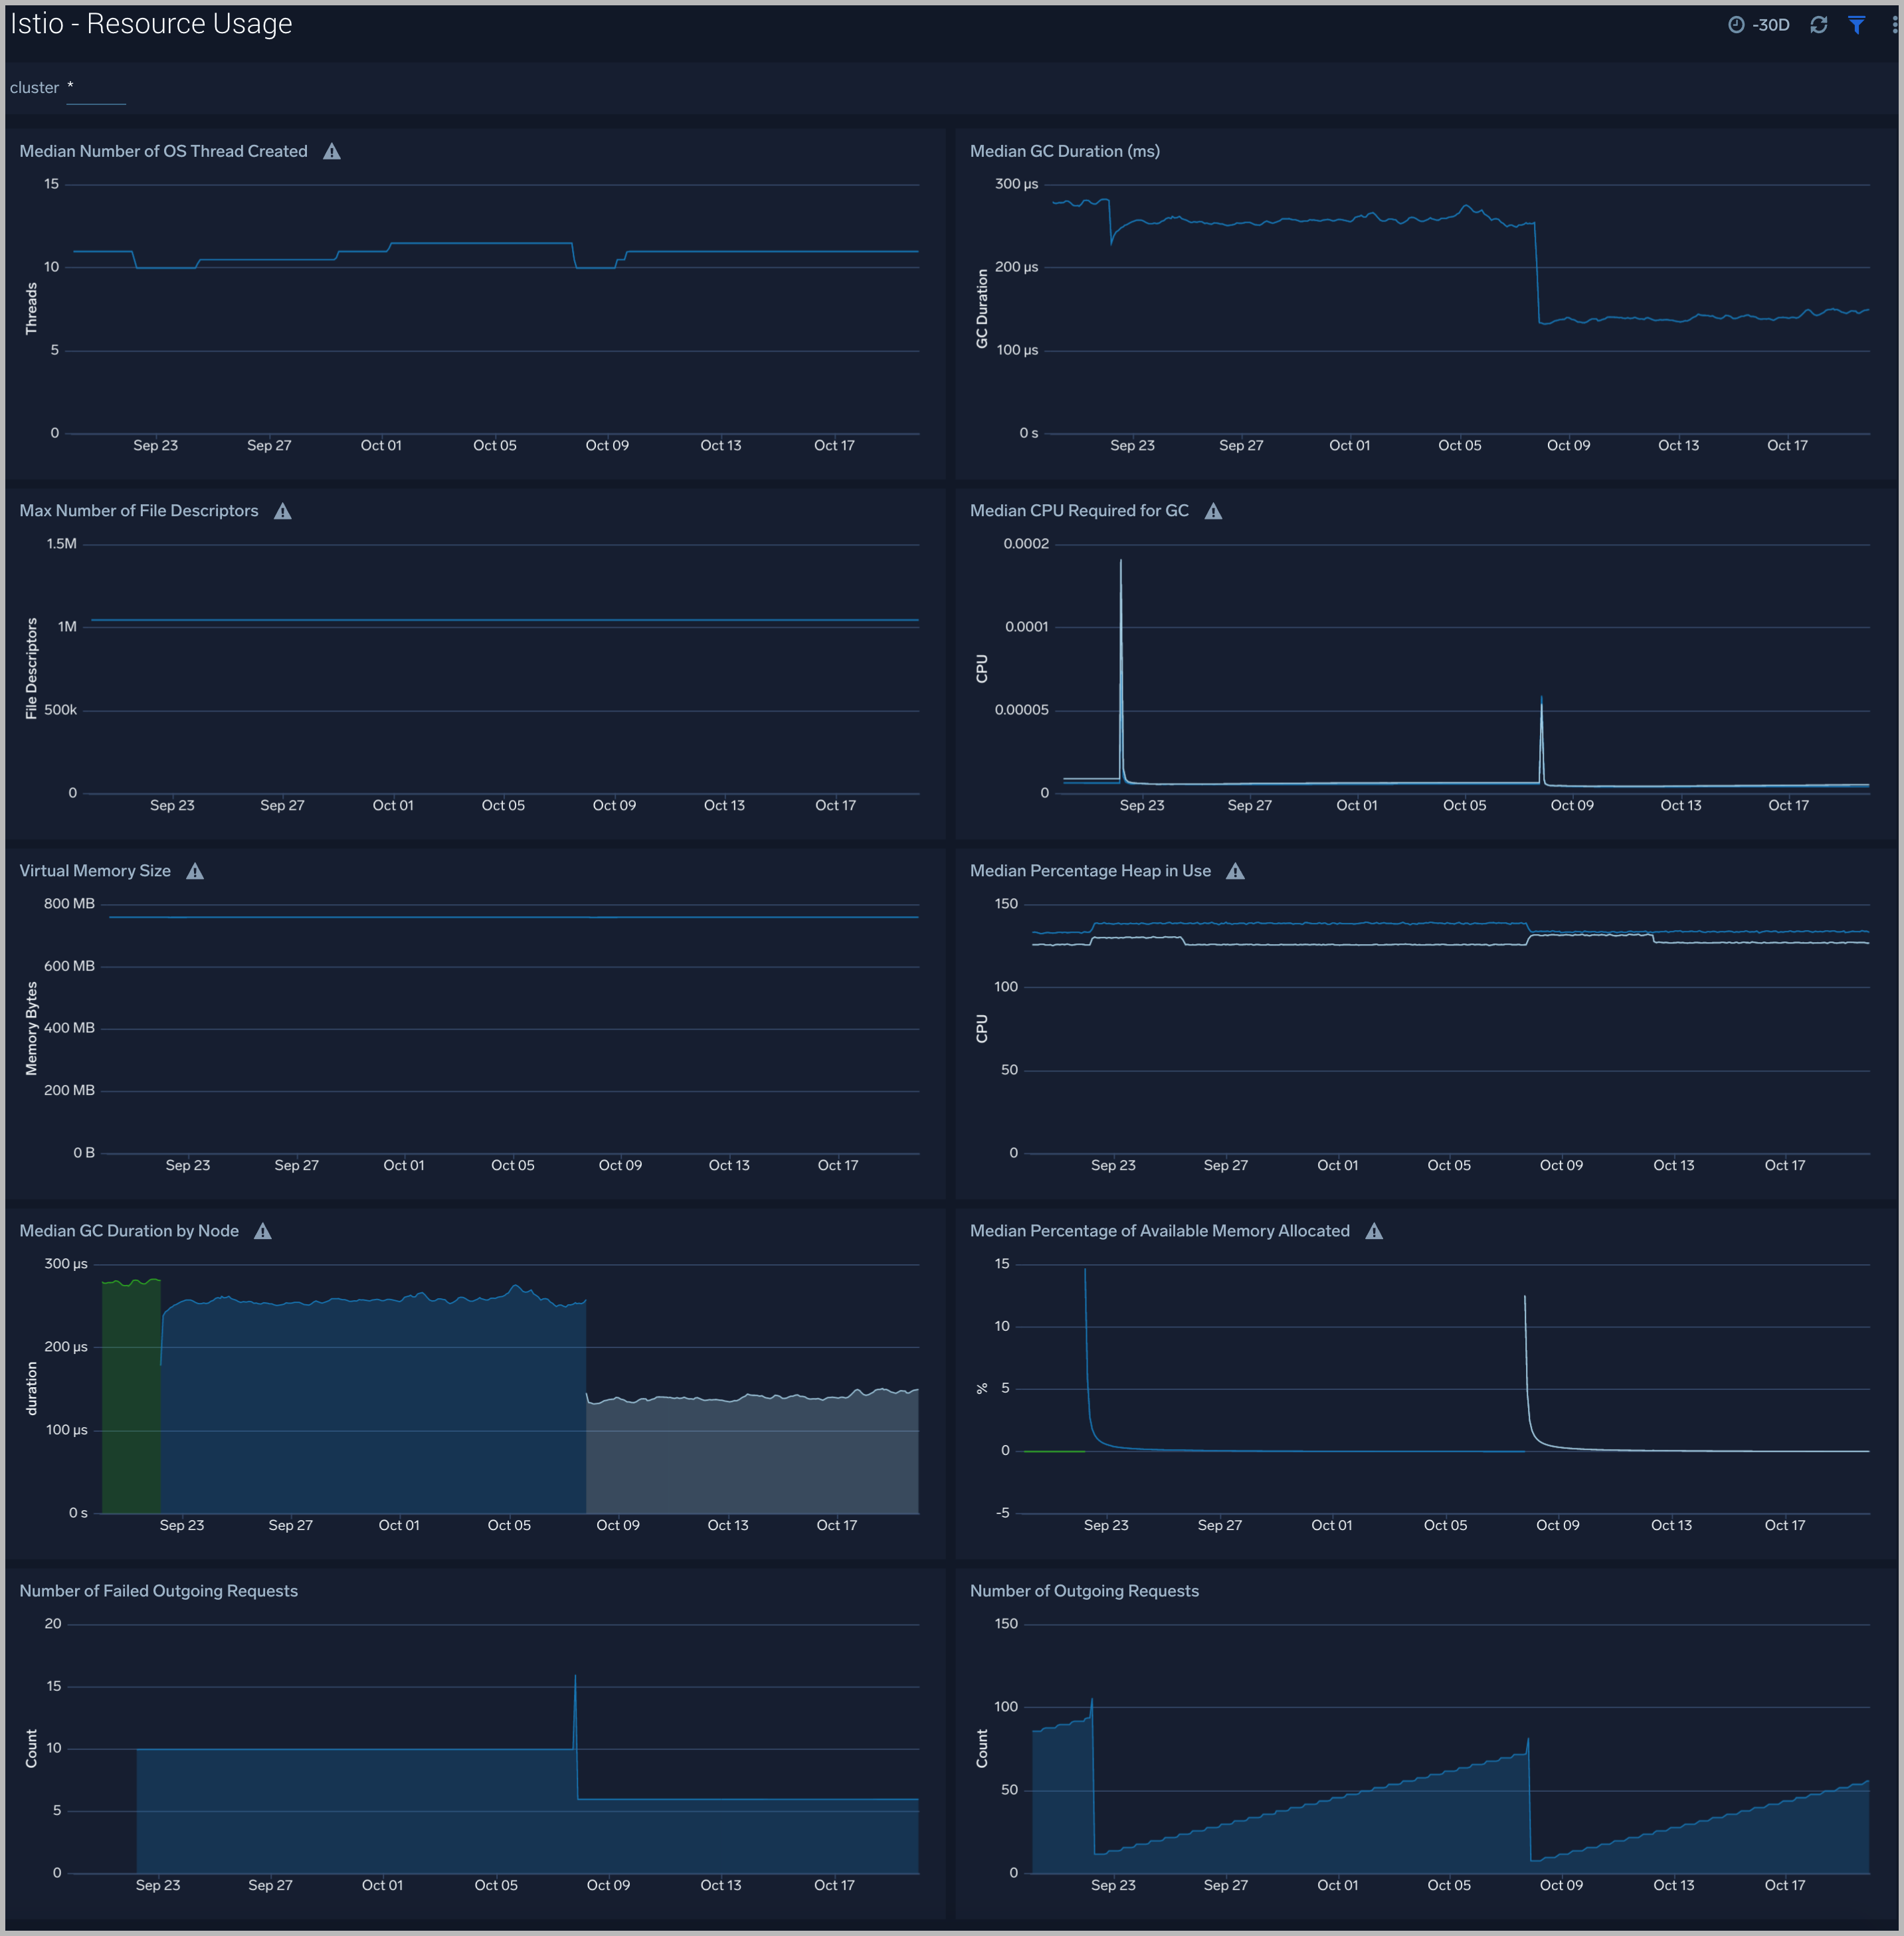
Resource Usage
The Istio - Resource Usage dashboard allows you to monitor the overall performance of Istio from a single dashboard.
Use this dashboard to:
- Monitor number of OS threads, GC duration, File descriptors CPU, and Memory.
- Analyze the number of outgoing failed requests.
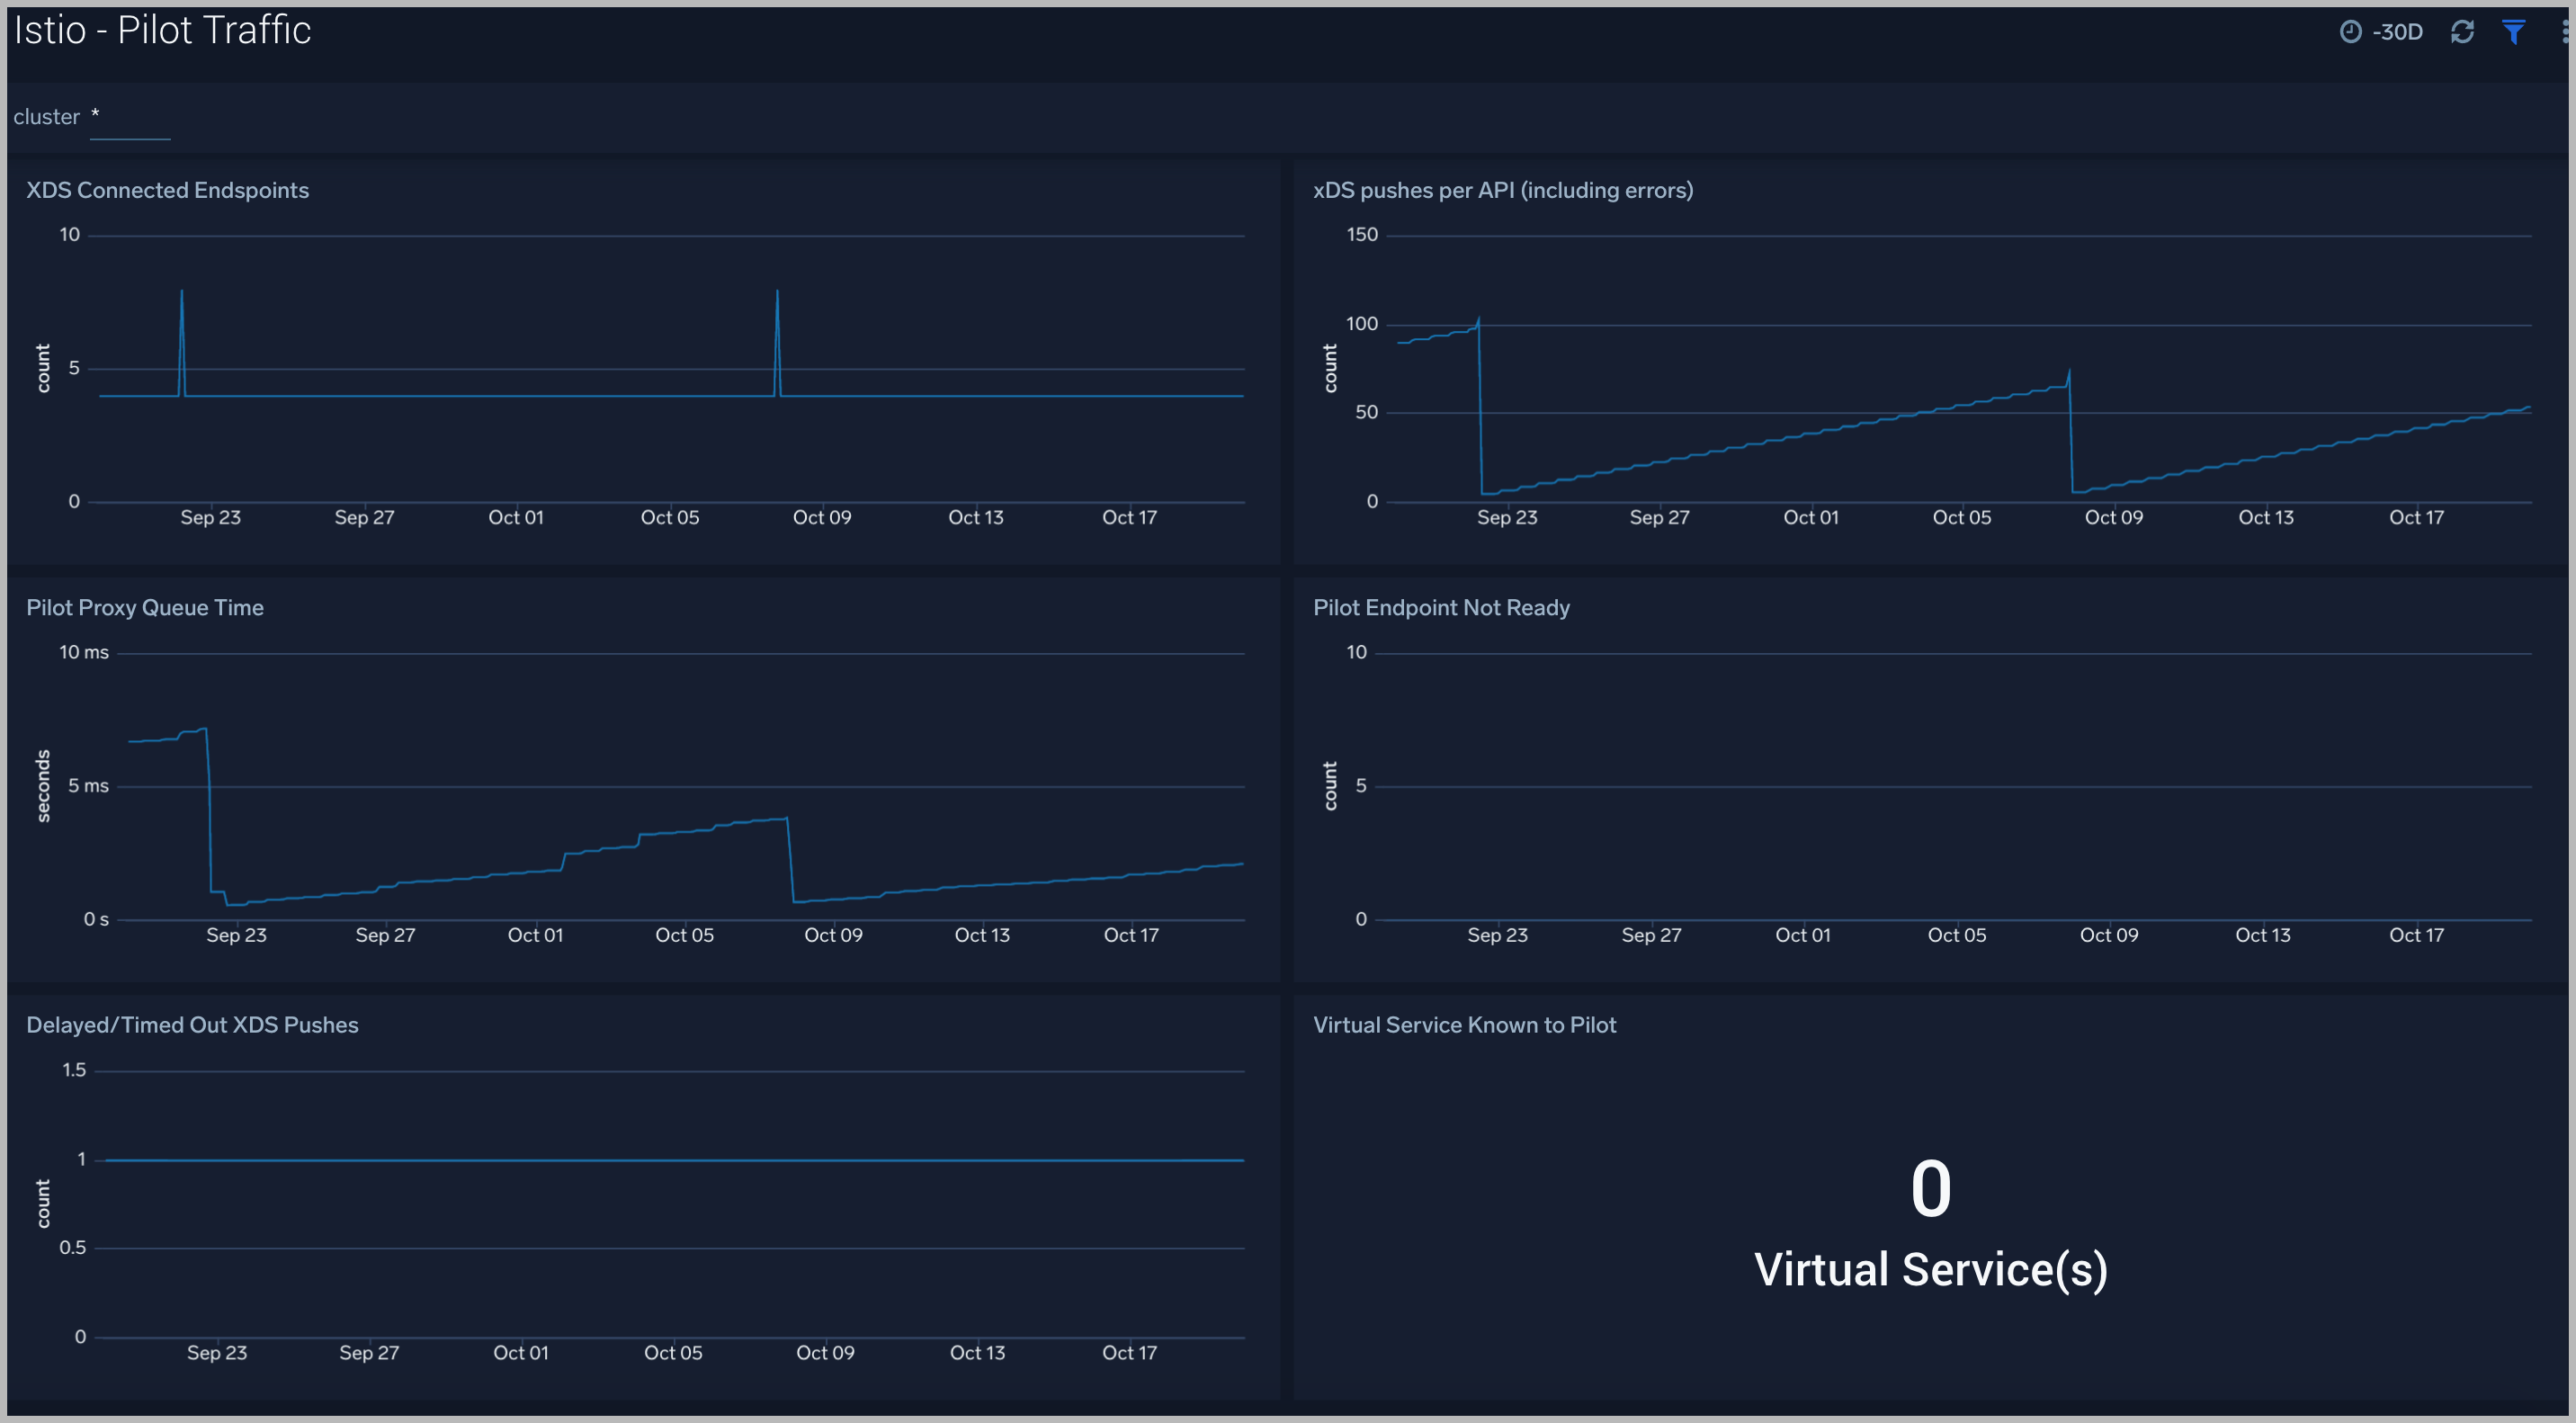
Pilot Traffic Dashboard
The Istio - Pilot Traffic dashboard assists in monitoring the Istio Pilot component
Use this dashboard to:
- Monitor Pilot queue time, endpoints connected to Pilot, endpoints not in ready state, and virtual service known to Pilot.