Microsoft Graph Security V1

The Sumo Logic app for Microsoft Graph Security V1 enables you to identify security threats by analyzing alert logs and helps you to improve web security posture, proactively detect and mitigate potential security risks, and improve compliance with security policies and regulations.
This version of the app uses alerts from Microsoft Graph API and continues to be supported for existing customers who are bringing in alerts from that source. If you are setting up a new cloud-to-cloud source, it will use API V2 which is covered by the Microsoft Graph Security V2 app.
Key features of the Microsoft Graph Security app include:
- Detect and mitigate potential ransomware attacks.
- Monitor endpoint security and identify potential threats.
- High-level overview of the organizational security posture, including metrics such as the number of alerts, alert severity, and status.
- Allows security teams to identify potential threats and take appropriate action based on the trends and patterns of security alerts over time.
Log types
This app uses Sumo Logic’s Microsoft Graph Security Source to collect Alerts from Microsoft Graph Security.
Learn more about fields of alert.
Sample log messages
Sample Alert Log
 {
           "azureSubscriptionId": null,
           "riskScore": null,
           "tags": [],
           "id": "02064FE6-AS23-43FF-BA16-78C21FQS23F",
           "azureTenantId": "00000001-0001-0001-0001-000000000001",
           "activityGroupName": null,
           "assignedTo": "Josh",
           "category": "ransomware",
           "closedDateTime": null,
           "comments": [],
           "confidence": 10,
           "createdDateTime": "2023-05-09T20:21:22Z",
           "description": "The user Charles Fife (charles@M365x594651.onmicrosoft.com)\" performed an impossible travel activity. The user was active from 131.107.159.34 in Washington, US and 31.154.212.66 in Rosh Haayin, Hamerkaz, IL within 55 minutes. Additional risks in this user session: 131.107.159.34 was used for the first time in 268 days by this user. 191d5be7-f855-4d22-b8d0-bdb8ba7ccd7a was accessed for the first time in 268 days by this user.",
           "detectionIds": [],
           "eventDateTime": "2023-05-09T18:30:40Z",
           "feedback": "falsePositive",
           "lastModifiedDateTime": "2023-05-09T20:21:22Z",
           "recommendedActions": [],
           "severity": "low",
           "sourceMaterials": [],
           "status": "inProgress",
           "title": "Ransome Attack",
           "vendorInformation": {
               "provider": "Cloud Application Security",
               "providerVersion": "3.0",
               "subProvider": "",
               "vendor": "Microsoft"
           },
           "cloudAppStates": [],
           "fileStates": [],
           "hostStates": [],
           "malwareStates": [
               {
                   "category": "trojan",
                   "family": "wannacry",
                   "name": "Trojan:Win32/Powessere.H",
                   "severity": "high",
                   "wasRunning": true
               }
           ],
           "networkConnections": [],
           "processes": [],
           "registryKeyStates": [],
           "triggers": [
               {
                   "name": "hostState.privateIpAddress",
                   "type": "String",
                   "value": "101.33.128.0"
               }
           ],
           "userStates": [
               {
                   "aadUserId": null,
                   "accountName": "Charles",
                   "domainName": "M365x584651.onmicrosoft.com",
                   "emailRole": "unknown",
                   "isVpn": null,
                   "logonDateTime": null,
                   "logonId": 1,
                   "logonIp": "101.33.128.0",
                   "logonLocation": "US",
                   "logonType": "batch",
                   "onPremisesSecurityIdentifier": null,
                   "riskScore": "0.5",
                   "userAccountType": "standard",
                   "userPrincipalName": "Charles@M365x584651.onmicrosoft.com"
               }
           ],
           "vulnerabilityStates": []
       }
Sample queries
_sourceCategory="ms_graph"
|json"id","status","severity","category","feedback","assignedTo","userStates[*]",,"title","description","confidence","malwareStates[*].category" as  alert_id,status,severity,category,feedback,analyst,user_info,title,description,confidence,malware_category nodrop
| where severity matches "{{severity}}"
| where status matches "{{status}}"
| count_distinct(alert_id)
Collection configuration and app installation
Depending on the set up collection method, you can configure and install the app in three ways:
- Create a new collector and install the app. Create a new Sumo Logic Cloud-to-Cloud (C2C) source under a new Sumo Logic Collector and later install the app, or
- Use an existing collector and install the app. Create a new Sumo Logic Cloud-to-Cloud (C2C) source under an existing Sumo Logic Collector and later install the app, or
- Use existing source and install the app. Use your existing configured Sumo Logic Cloud-to-Cloud (C2C) source and install the app.
Use the Cloud-to-Cloud Integration for Microsoft Graph Security to create the source and use the same source category while installing the app. By following these steps, you can ensure that your Microsoft Graph Security app is properly integrated and configured to collect and analyze your Microsoft Graph Security data.
Create a new collector and install the app
To set up collection and install the app, do the following:
Next-Gen App: To install or update the app, you must be an account administrator or a user with Manage Apps, Manage Monitors, Manage Fields, Manage Metric Rules, and Manage Collectors capabilities depending upon the different content types part of the app.
- Select App Catalog.
- In the 🔎 Search Apps field, run a search for your desired app, then select it.
- Click Install App.
note
Sometimes this button says Add Integration.
- In the Set Up Collection section of your respective app, select Create a new Collector.
- Collector Name. Enter a Name to display the Source in the Sumo Logic web application. The description is optional.
- Timezone. Set the default time zone when it is not extracted from the log timestamp. Time zone settings on Sources override a Collector time zone setting.
- (Optional) Metadata. Click the +Add Metadata link to add a custom log Metadata Fields. Define the fields you want to associate, each metadata field needs a name (key) and value.
 A green circle with a checkmark is shown when the field exists and is enabled in the Fields table schema.
 An orange triangle with an exclamation point is shown when the field doesn't exist, or is disabled, in the Fields table schema. In this case, an option to automatically add or enable the nonexistent fields to the Fields table schema is provided. If a field is sent to Sumo that does not exist in the Fields schema or is disabled it is ignored, known as dropped.
- Click Next.
- Configure the source as specified in the
Infobox above, ensuring all required fields are included. - In the Configure section of your respective app, complete the following fields.
- Field Name. If you already have collectors and sources set up, select the configured metadata field name (eg _sourcecategory) or specify other custom metadata (eg: _collector) along with its metadata Field Value.
- Click Next. You will be redirected to the Preview & Done section.
Post-installation
Once your app is installed, it will appear in your Installed Apps folder, and dashboard panels will start to fill automatically.
Each panel slowly fills with data matching the time range query received since the panel was created. Results will not immediately be available but will be updated with full graphs and charts over time.
Use an existing collector and install the app
To set up the source in the existing collector and install the app, do the following:
Next-Gen App: To install or update the app, you must be an account administrator or a user with Manage Apps, Manage Monitors, Manage Fields, Manage Metric Rules, and Manage Collectors capabilities depending upon the different content types part of the app.
- Select App Catalog.
- In the 🔎 Search Apps field, run a search for your desired app, then select it.
- Click Install App.
note
Sometimes this button says Add Integration.
- In the Set Up Collection section of your respective app, select Use an existing Collector.
- From the Select Collector dropdown, select the collector that you want to set up your source with and click Next.
- Configure the source as specified in the
Infobox above, ensuring all required fields are included. - In the Configure section of your respective app, complete the following fields.
- Field Name. If you already have collectors and sources set up, select the configured metadata field name (eg _sourcecategory) or specify other custom metadata (eg: _collector) along with its metadata Field Value.
- Click Next. You will be redirected to the Preview & Done section.
Post-installation
Once your app is installed, it will appear in your Installed Apps folder, and dashboard panels will start to fill automatically.
Each panel slowly fills with data matching the time range query received since the panel was created. Results will not immediately be available but will be updated with full graphs and charts over time.
Use an existing source and install the app
To skip collection and only install the app, do the following:
Next-Gen App: To install or update the app, you must be an account administrator or a user with Manage Apps, Manage Monitors, Manage Fields, Manage Metric Rules, and Manage Collectors capabilities depending upon the different content types part of the app.
- Select App Catalog.
- In the 🔎 Search Apps field, run a search for your desired app, then select it.
- Click Install App.
note
Sometimes this button says Add Integration.
- In the Set Up Collection section of your respective app, select Skip this step and use existing source and click Next.
- In the Configure section of your respective app, complete the following fields.
- Field Name. If you already have collectors and sources set up, select the configured metadata field name (eg _sourcecategory) or specify other custom metadata (eg: _collector) along with its metadata Field Value.
- Click Next. You will be redirected to the Preview & Done section.
Post-installation
Once your app is installed, it will appear in your Installed Apps folder, and dashboard panels will start to fill automatically.
Each panel slowly fills with data matching the time range query received since the panel was created. Results will not immediately be available but will be updated with full graphs and charts over time.
Viewing Microsoft Graph Security dashboards
All dashboards have a set of filters that you can apply to the entire dashboard. Use these filters to drill down and examine the data to a granular level.
- You can change the time range for a dashboard or panel by selecting a predefined interval from a drop-down list, choosing a recently used time range, or specifying custom dates and times. Learn more.
- You can use template variables to drill down and examine the data on a granular level. For more information, see Filtering Dashboards with Template Variables.
- Most Next-Gen apps allow you to provide the scope at the installation time and are comprised of a key (
_sourceCategoryby default) and a default value for this key. Based on your input, the app dashboards will be parameterized with a dashboard variable, allowing you to change the dataset queried by all panels. This eliminates the need to create multiple copies of the same dashboard with different queries.
Alerts Overview
The Microsoft Graph Security - Alerts Overview dashboard provides a comprehensive overview of events which helps you to analyze security threats and take proactive measures to safeguard your organization. This dashboard features various widgets, including total alerts, high severity alerts, alerts by status, alerts by analyst feedback, alerts by confidence level, alerts by malware category, top analyst, and top alert categories.
The geo-location widget highlights alerts from high-risk countries, making it easier to identify and respond to potential threats from specific locations. The severity and trend widgets provide a detailed overview of the frequency and severity of alerts over time, allowing you to take proactive measures to mitigate risks. The top users associated with the alerts widget helps you pinpoint and address potential security risks related to user behavior efficiently. The recent alerts widget offers a quick snapshot of the latest security activity, ensuring you are always up-to-date on the latest developments.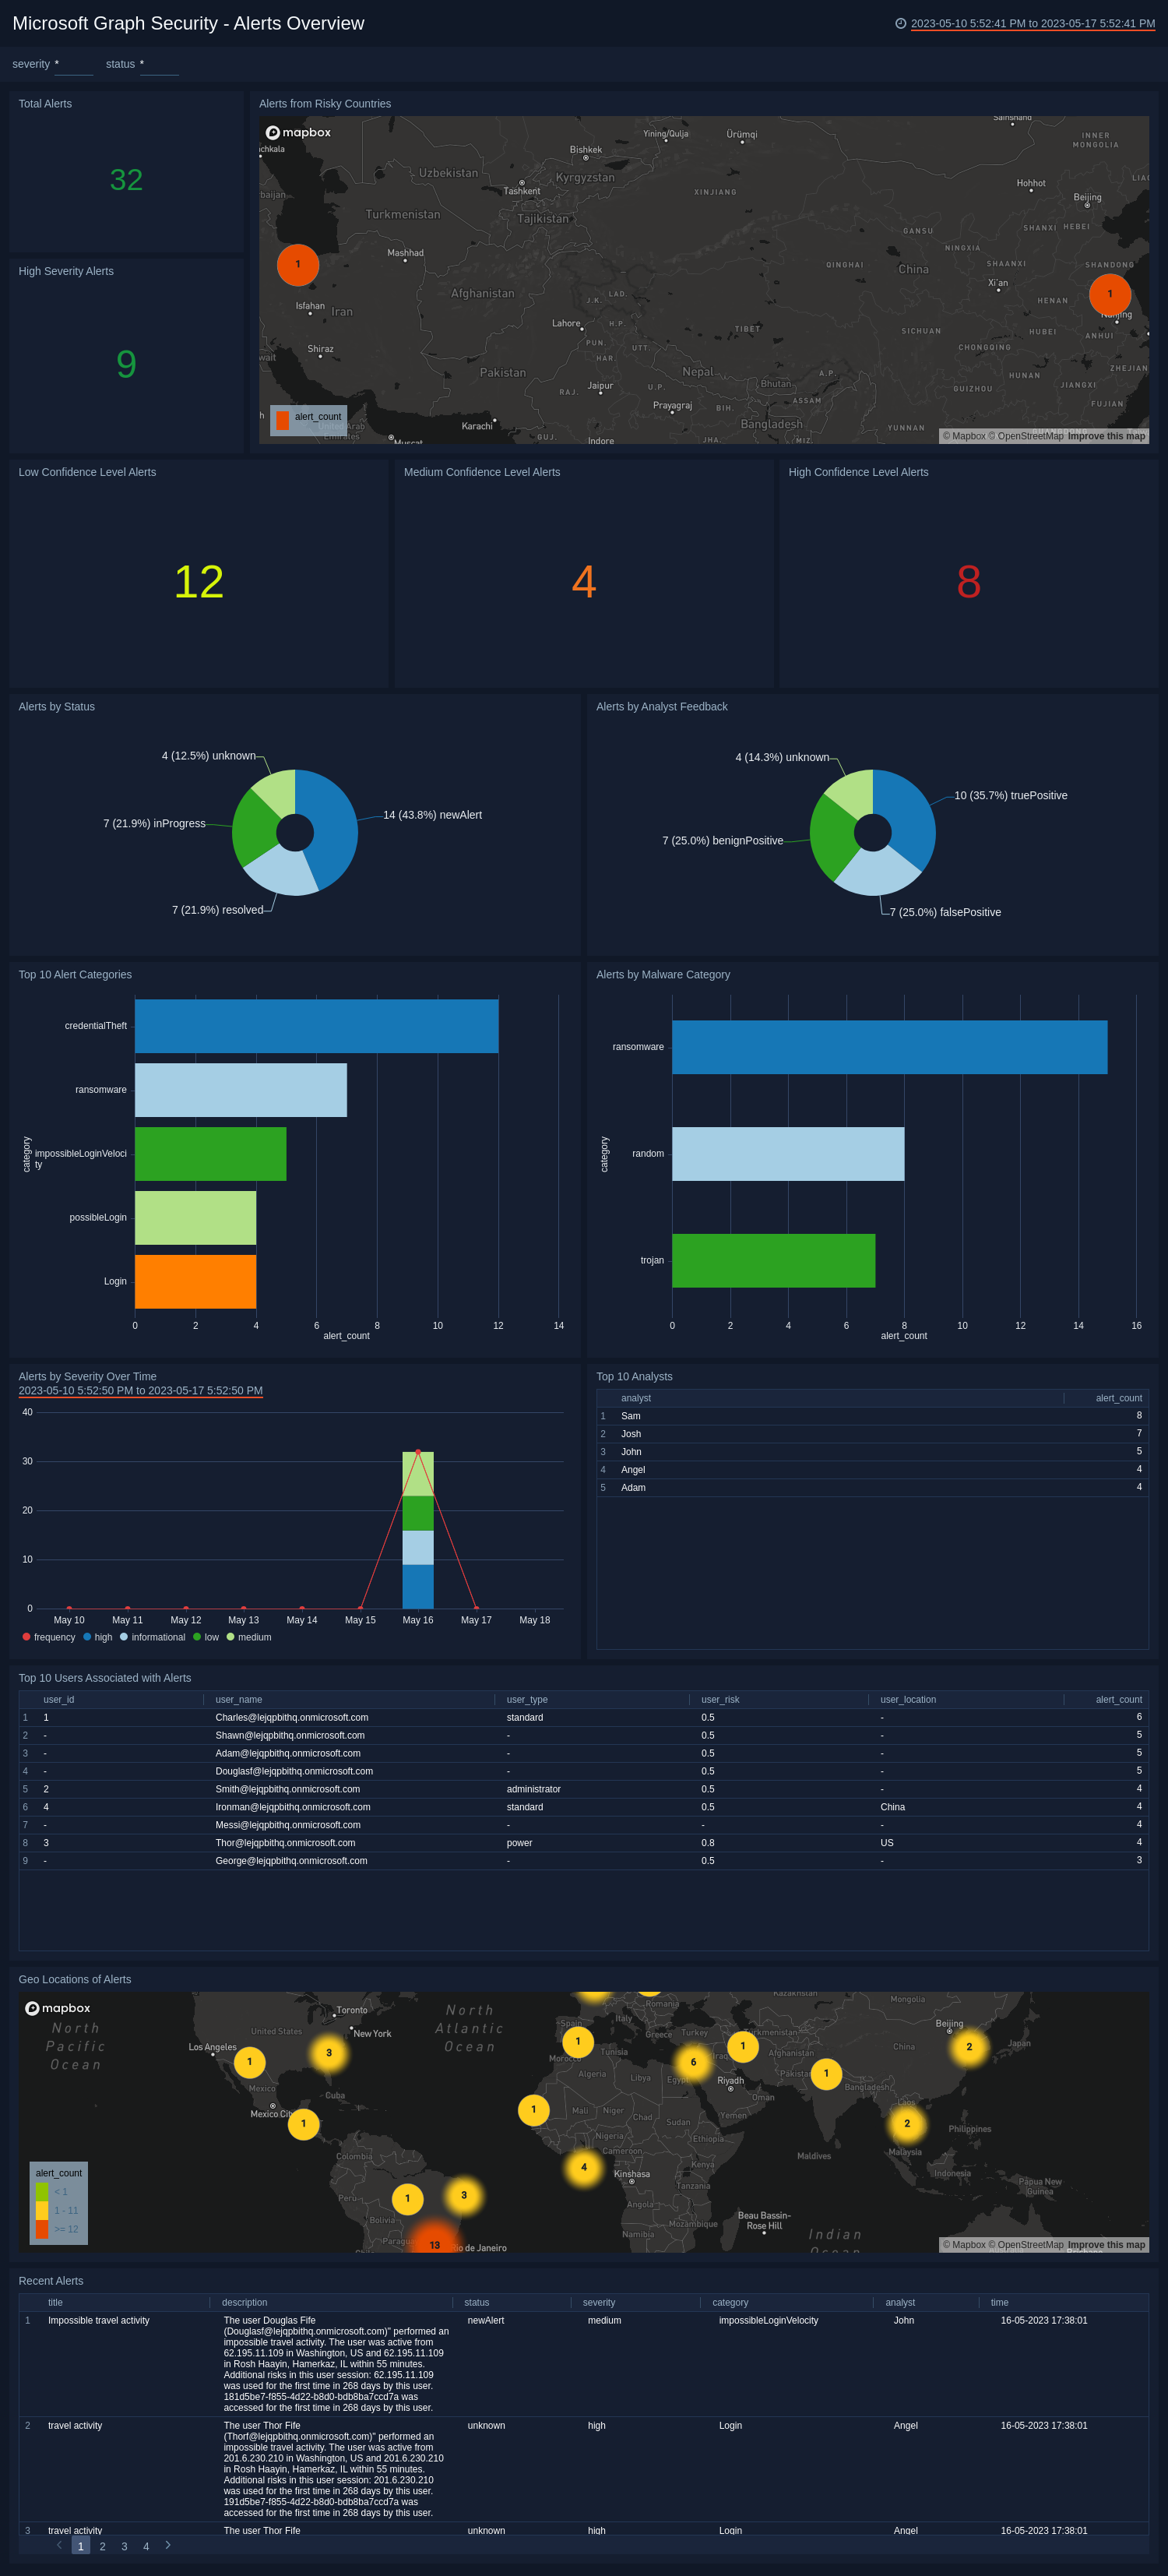
Upgrade/Downgrade the Microsoft Graph Security app (Optional)
To update the app, do the following:
Next-Gen App: To install or update the app, you must be an account administrator or a user with Manage Apps, Manage Monitors, Manage Fields, Manage Metric Rules, and Manage Collectors capabilities depending upon the different content types part of the app.
- Select App Catalog.
- In the Search Apps field, search for and then select your app.
Optionally, you can identify apps that can be upgraded in the Upgrade available section. - To upgrade the app, select Upgrade from the Manage dropdown.
- If the upgrade does not have any configuration or property changes, you will be redirected to the Preview & Done section.
- If the upgrade has any configuration or property changes, you will be redirected to the Setup Data page.
- In the Configure section of your respective app, complete the following fields.
- Field Name. If you already have collectors and sources set up, select the configured metadata field name (eg _sourcecategory) or specify other custom metadata (eg: _collector) along with its metadata Field Value.
- Click Next. You will be redirected to the Preview & Done section.
Post-update
Your upgraded app will be installed in the Installed Apps folder and dashboard panels will start to fill automatically.
See our Release Notes changelog for new updates in the app.
To revert the app to a previous version, do the following:
- Select App Catalog.
- In the Search Apps field, search for and then select your app.
- To version down the app, select Revert to < previous version of your app > from the Manage dropdown.
Uninstalling the Microsoft Graph Security app (Optional)
To uninstall the app, do the following:
- Select App Catalog.
- In the 🔎 Search Apps field, run a search for your desired app, then select it.
- Click Uninstall.