Palo Alto Cortex XDR

The Sumo Logic app for Palo Alto Cortex XDR provides comprehensive visibility and analysis of alerts and incidents from the Palo Alto Networks Cortex XDR platform. Our app empowers your security teams to proactively monitor and respond to security threats, strengthen incident response processes, improve overall security posture, and protect critical assets from advanced threats and attacks.
Key features of the Palo Alto Networks Cortex XDR app include:
- Real-Time Monitoring. Gain real-time visibility into security events and incidents across your organization's infrastructure. Monitor and analyze alerts, threats, and suspicious activities to detect and promptly respond to potential threats.
- Interactive Dashboards. Explore interactive dashboards that provide a holistic view of alerts, incidents, and threat intelligence. Visualize data with pre-built charts, graphs, and tables to understand trends, patterns, and anomalies.
- Incident Management. Streamline incident management processes by tracking security incidents. Monitor incident status, and collaborate with your security team for effective incident response.
Log types
This app uses Palo Alto Cortex XDR source to collect alerts and incidents from Palo Alto Cortex XDR.
Sample log messages
View Sample Log Message
{
   "action": "DETECTED",
   "action_pretty": "Detected",
   "agent_os_sub_type": "Windows 11 [10.0 (Build 22621)]",
   "agent_os_type": "Windows",
   "agent_version": "7.9.1.26645",
   "alert_id": "161",
   "alert_type": "Unclassified",
   "bioc_category_enum_key": "IP",
   "category": "IP",
   "description": "IOC ( IP = 103.36.10.156 )",
   "detection_timestamp": 1677153320321,
   "endpoint_id": "eba0735df9a24a67b95b75ecfdf3c77f",
   "external_id": "6d6806d1-dbc2-4da0-b3b6-b16d097f20eb",
   "host_ip": [
      "192.168.5.5"
   ],
   "host_name": "DESKTOP-DLU1NRR",
   "is_pcap": false,
   "is_whitelisted": false,
   "local_insert_ts": 1677153820311,
   "matching_service_rule_id": "5",
   "matching_status": "MATCHED",
   "name": "IOC (103.36.10.156)",
   "original_tags": [
      "DS:PANW/XDR Agent"
   ],
   "resolution_status": "STATUS_010_NEW",
   "severity": "critical",
   "source": "XDR IOC",
   "starred": false,
   "tags": [
      "DS:PANW/XDR Agent"
   ]
}
{
  "incident_id": "4",
  "incident_name": null,
  "creation_time": 1677067079585,
  "modification_time": 1677154139505,
  "detection_time": null,
  "status": "remediated",
  "severity": "medium",
  "description": "'IOC (trunapol.xyz)' along with 139 other alerts generated by XDR Agent and XDR IOC detected on host desktop-dlu1nrr involving 2 users",
  "assigned_user_mail": "ksh@gmail.com",
  "assigned_user_pretty_name": "ksha",
  "alert_count": 140,
  "low_severity_alert_count": 0,
  "med_severity_alert_count": 25,
  "high_severity_alert_count": 35,
  "critical_severity_alert_count": 80,
  "user_count": 2,
  "host_count": 1,
  "notes": null,
  "resolve_comment": null,
  "resolved_timestamp": null,
  "manual_severity": null,
  "manual_description": null,
  "xdr_url": "https://sumologic-partner.xdr.us.paloaltonetworks.com/incident-view?caseId=4",
  "starred": false,
  "hosts": [
    "desktop-dlu1nrr:eba0735df9a24a67b95b75ecfdf3c77f"
  ],
  "users": [
    "n/a\\crest_sophos_logs_",
    "desktop-dlu1nrr\\crest_sophos_logs_"
  ],
  "incident_sources": [
    "XDR Agent",
    "XDR IOC"
  ],
  "rule_based_score": null,
  "predicted_score": null,
  "manual_score": null,
  "aggregated_score": null,
  "wildfire_hits": 20,
  "alerts_grouping_status": "Disabled",
  "mitre_tactics_ids_and_names": [
    "TA0002 - Execution",
    "TA0006 - Malfunction Check"
  ],
  "mitre_techniques_ids_and_names": [
    "TA0002 - Execution",
    "TA0006 - Malfunction Check"
  ],
  "alert_categories": [
    "Domain Name",
    "File Name",
    "IP",
    "Malware"
  ],
  "original_tags": [
    "DS:PANW/XDR Agent"
  ],
  "tags": [
    "DS:PANW/XDR Agent"
  ]
}
Sample queries
View sample queries
_sourceCategory="palo_alto_cortex_xdr" "alert_id" "is_whitelisted"
| json "alert_id","name","severity","source","host_ip","alert_type","action_pretty","agent_os_type","category","detection_timestamp","is_whitelisted","resolution_status" as alert_id,name,severity,source,host_ip,alert_type,action_pretty,agent_os_type,category,detection_timestamp,is_whitelisted,resolution_status nodrop
| action_pretty as action
| where severity matches "{{severity}}"
| where category matches "{{category}}"
| where source matches "{{source}}"
| where action matches "{{action}}"
| where agent_os_type matches "{{agent_os}}"
| where alert_type matches "{{alert_type}}"
| where is_whitelisted matches "{{is_whitelisted}}"
| count_distinct(alert_id)
_sourceCategory="palo_alto_cortex_xdr" "incident_id" "incident_name"
| json "incident_id","incident_name","creation_time","modification_time","status","severity","assigned_user_mail","alert_count","high_severity_alert_count","critical_severity_alert_count","user_count","xdr_url","wildfire_hits","alerts_grouping_status","mitre_tactics_ids_and_names","mitre_techniques_ids_and_names" as incident_id,incident_name,creation_time,modification_time,status,severity,assigned_user_mail,alert_count,high_severity_alert_count,critical_severity_alert_count,user_count,xdr_url,wildfire_hits,alerts_grouping_status,mitre_tactics_ids_and_names,mitre_techniques_ids_and_names nodrop
| where alerts_grouping_status matches"{{alerts_grouping_status}}"
| where severity matches "{{severity}}"
| where status matches "{{status}}"
| count_distinct(incident_id)
Collection configuration and app installation
Depending on the set up collection method, you can configure and install the app in three ways:
- Create a new collector and install the app. Create a new Sumo Logic Cloud-to-Cloud (C2C) source under a new Sumo Logic Collector and later install the app, or
- Use an existing collector and install the app. Create a new Sumo Logic Cloud-to-Cloud (C2C) source under an existing Sumo Logic Collector and later install the app, or
- Use existing source and install the app. Use your existing configured Sumo Logic Cloud-to-Cloud (C2C) source and install the app.
Use the Cloud-to-Cloud Integration for Palo Alto Cortex XDR to create the source and use the same source category while installing the app. By following these steps, you can ensure that your Palo Alto Cortex XDR app is properly integrated and configured to collect and analyze your Palo Alto Cortex XDR data.
Create a new collector and install the app
To set up collection and install the app, do the following:
Next-Gen App: To install or update the app, you must be an account administrator or a user with Manage Apps, Manage Monitors, Manage Fields, Manage Metric Rules, and Manage Collectors capabilities depending upon the different content types part of the app.
- Select App Catalog.
- In the 🔎 Search Apps field, run a search for your desired app, then select it.
- Click Install App.
note
Sometimes this button says Add Integration.
- In the Set Up Collection section of your respective app, select Create a new Collector.
- Collector Name. Enter a Name to display the Source in the Sumo Logic web application. The description is optional.
- Timezone. Set the default time zone when it is not extracted from the log timestamp. Time zone settings on Sources override a Collector time zone setting.
- (Optional) Metadata. Click the +Add Metadata link to add a custom log Metadata Fields. Define the fields you want to associate, each metadata field needs a name (key) and value.
 A green circle with a checkmark is shown when the field exists and is enabled in the Fields table schema.
 An orange triangle with an exclamation point is shown when the field doesn't exist, or is disabled, in the Fields table schema. In this case, an option to automatically add or enable the nonexistent fields to the Fields table schema is provided. If a field is sent to Sumo that does not exist in the Fields schema or is disabled it is ignored, known as dropped.
- Click Next.
- Configure the source as specified in the
Infobox above, ensuring all required fields are included. - In the Configure section of your respective app, complete the following fields.
- Field Name. If you already have collectors and sources set up, select the configured metadata field name (eg _sourcecategory) or specify other custom metadata (eg: _collector) along with its metadata Field Value.
- Click Next. You will be redirected to the Preview & Done section.
Post-installation
Once your app is installed, it will appear in your Installed Apps folder, and dashboard panels will start to fill automatically.
Each panel slowly fills with data matching the time range query received since the panel was created. Results will not immediately be available but will be updated with full graphs and charts over time.
Use an existing collector and install the app
To set up the source in the existing collector and install the app, do the following:
Next-Gen App: To install or update the app, you must be an account administrator or a user with Manage Apps, Manage Monitors, Manage Fields, Manage Metric Rules, and Manage Collectors capabilities depending upon the different content types part of the app.
- Select App Catalog.
- In the 🔎 Search Apps field, run a search for your desired app, then select it.
- Click Install App.
note
Sometimes this button says Add Integration.
- In the Set Up Collection section of your respective app, select Use an existing Collector.
- From the Select Collector dropdown, select the collector that you want to set up your source with and click Next.
- Configure the source as specified in the
Infobox above, ensuring all required fields are included. - In the Configure section of your respective app, complete the following fields.
- Field Name. If you already have collectors and sources set up, select the configured metadata field name (eg _sourcecategory) or specify other custom metadata (eg: _collector) along with its metadata Field Value.
- Click Next. You will be redirected to the Preview & Done section.
Post-installation
Once your app is installed, it will appear in your Installed Apps folder, and dashboard panels will start to fill automatically.
Each panel slowly fills with data matching the time range query received since the panel was created. Results will not immediately be available but will be updated with full graphs and charts over time.
Use an existing source and install the app
To skip collection and only install the app, do the following:
Next-Gen App: To install or update the app, you must be an account administrator or a user with Manage Apps, Manage Monitors, Manage Fields, Manage Metric Rules, and Manage Collectors capabilities depending upon the different content types part of the app.
- Select App Catalog.
- In the 🔎 Search Apps field, run a search for your desired app, then select it.
- Click Install App.
note
Sometimes this button says Add Integration.
- In the Set Up Collection section of your respective app, select Skip this step and use existing source and click Next.
- In the Configure section of your respective app, complete the following fields.
- Field Name. If you already have collectors and sources set up, select the configured metadata field name (eg _sourcecategory) or specify other custom metadata (eg: _collector) along with its metadata Field Value.
- Click Next. You will be redirected to the Preview & Done section.
Post-installation
Once your app is installed, it will appear in your Installed Apps folder, and dashboard panels will start to fill automatically.
Each panel slowly fills with data matching the time range query received since the panel was created. Results will not immediately be available but will be updated with full graphs and charts over time.
Viewing Palo Alto Cortex XDR dashboards
All dashboards have a set of filters that you can apply to the entire dashboard. Use these filters to drill down and examine the data to a granular level.
- You can change the time range for a dashboard or panel by selecting a predefined interval from a drop-down list, choosing a recently used time range, or specifying custom dates and times. Learn more.
- You can use template variables to drill down and examine the data on a granular level. For more information, see Filtering Dashboards with Template Variables.
- Most Next-Gen apps allow you to provide the scope at the installation time and are comprised of a key (
_sourceCategoryby default) and a default value for this key. Based on your input, the app dashboards will be parameterized with a dashboard variable, allowing you to change the dataset queried by all panels. This eliminates the need to create multiple copies of the same dashboard with different queries.
Alerts Overview
The Palo Alto Cortex XDR - Alerts Overview dashboard provides real-time analysis of the alerts triggered and white-listed. This dashboard offers insights into the alerts based on severity over time, most frequent sources, types of triggered alerts, geo location of all alerts, and alerts originating from high-risk countries. This dashboard provides information on the most frequent actions taken in response to alerts, the top categories of alerts, and a summary of recent alerts for quick reference.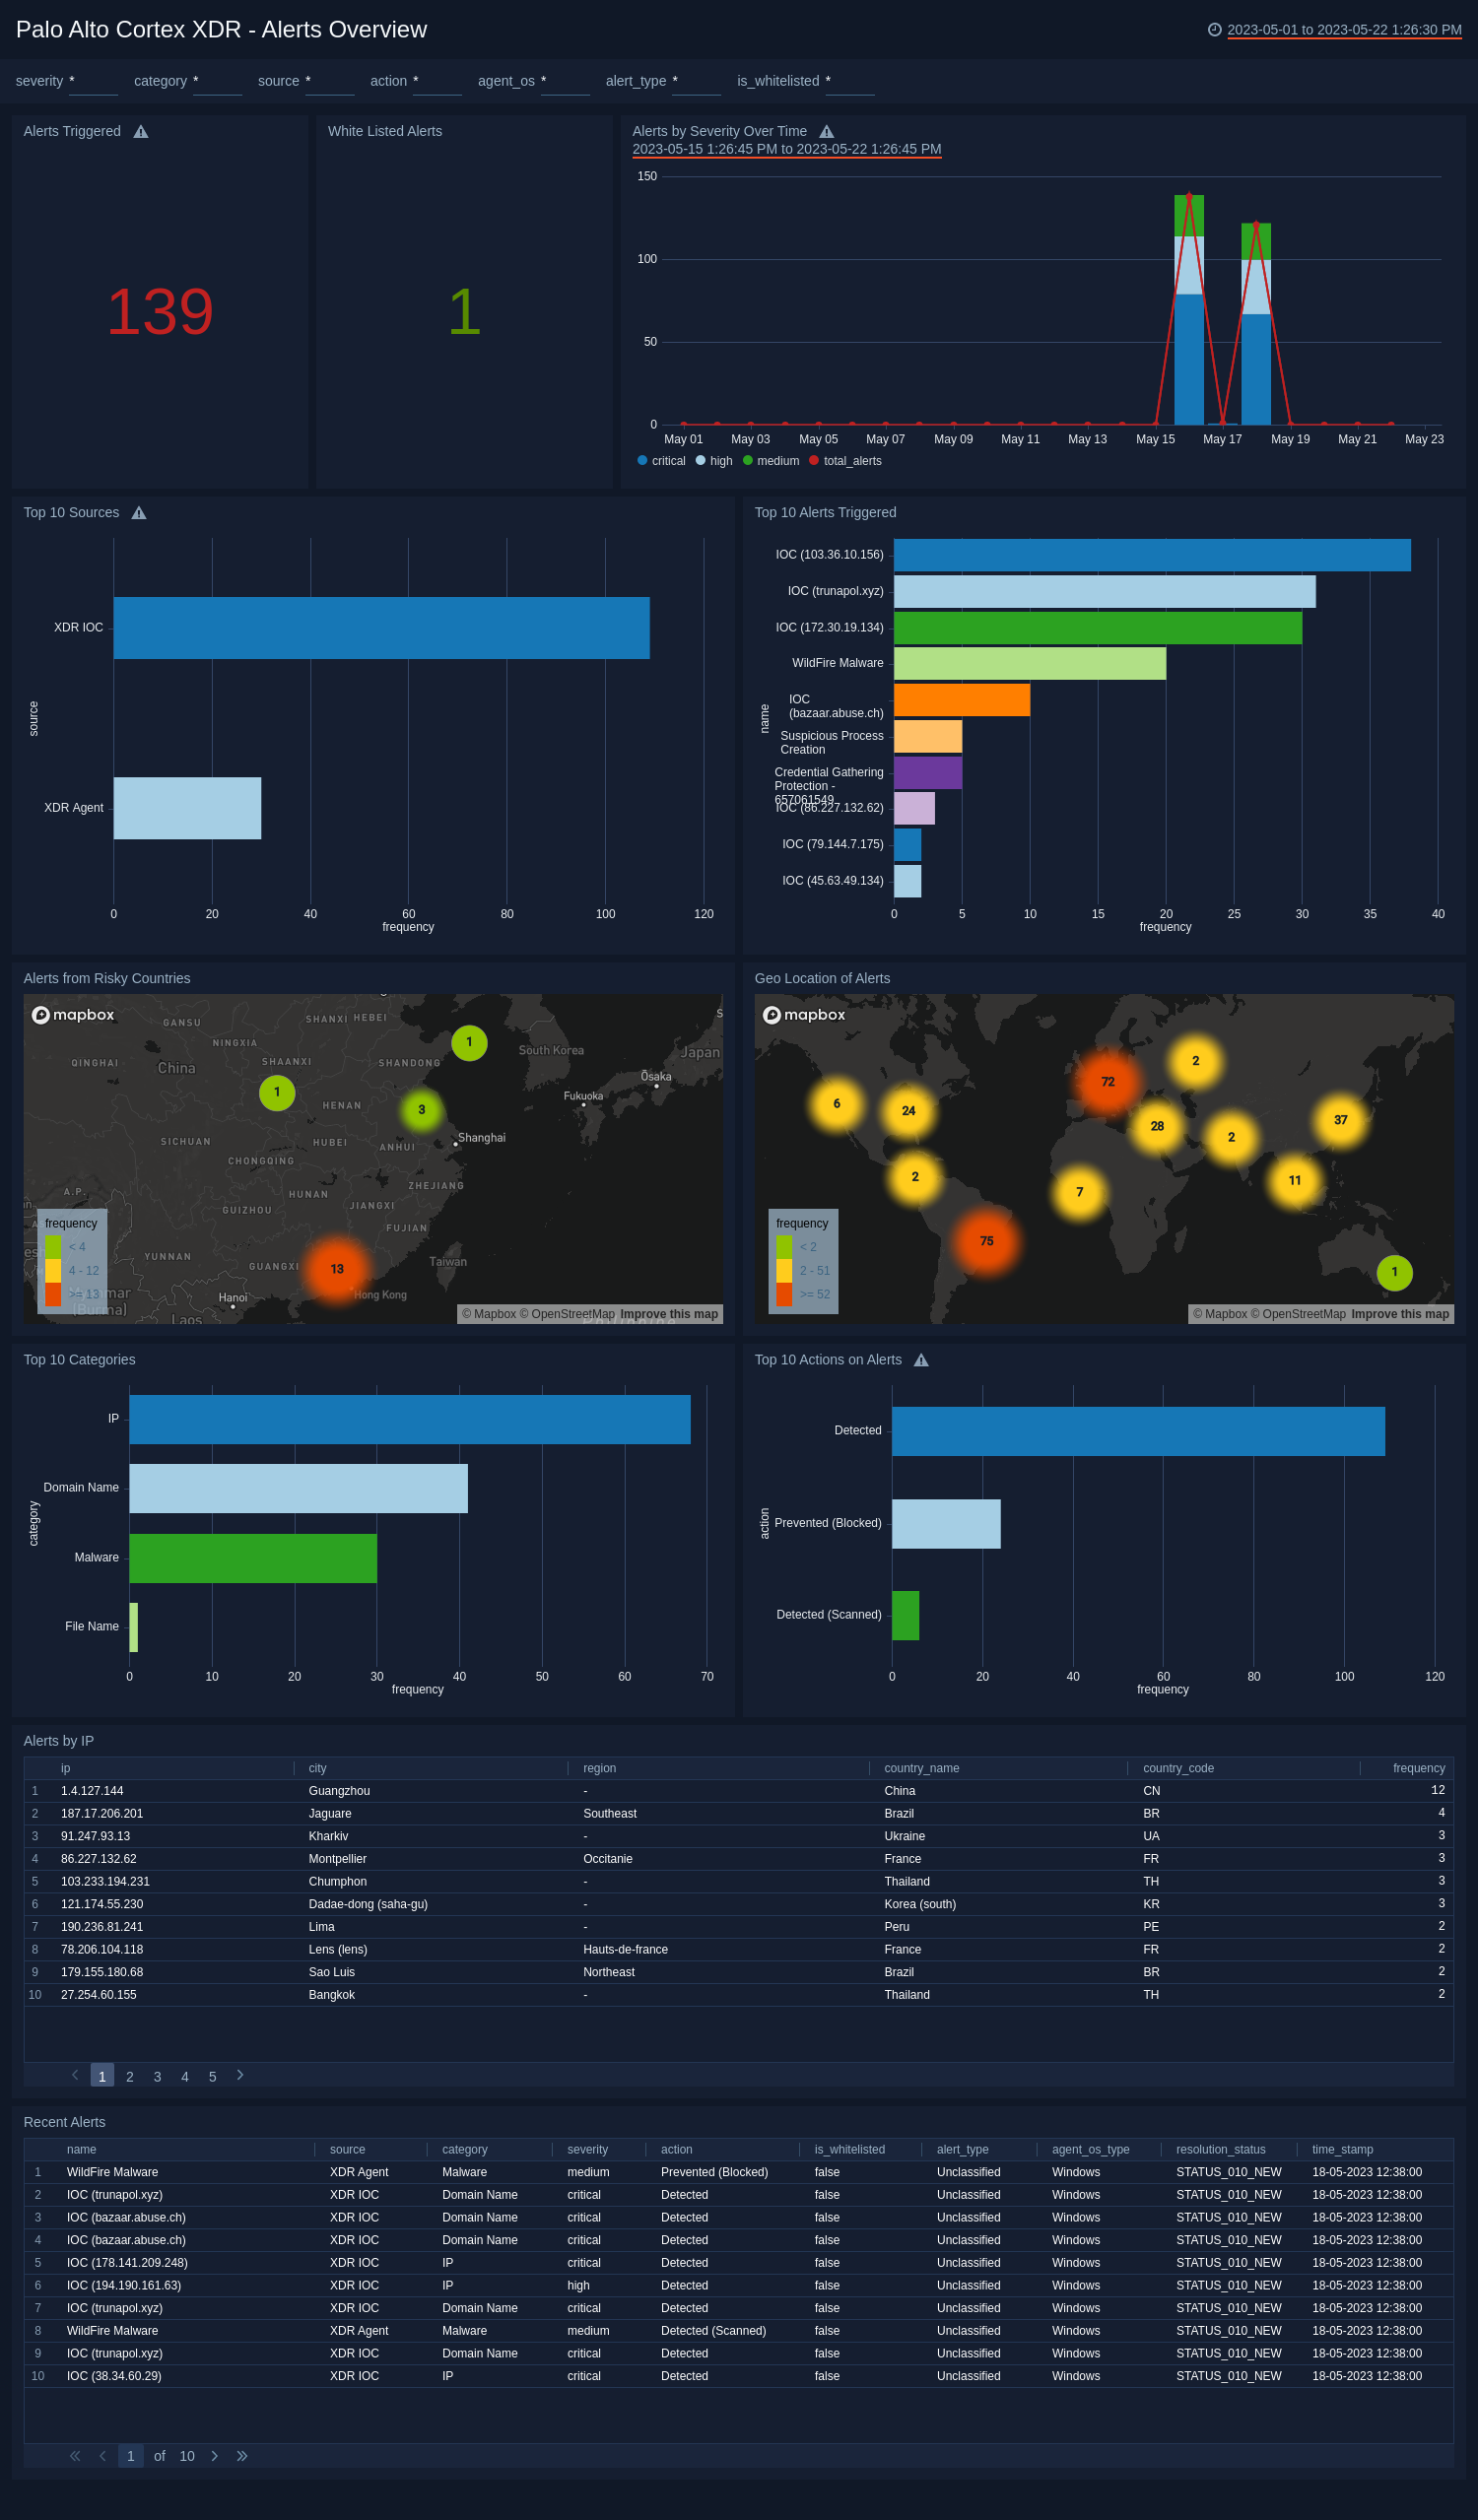
Incidents Overview
The Palo Alto Cortex XDR - Incidents Overview dashboard provides the number of incidents created and disabled. This dashboard offers insights into the incidents based on severity over time and incidents by status. This dashboard also highlights the most frequently assigned users to handle incidents, information about the commonly observed MITRE techniques and tactics utilized, and a summary of recent incidents for quick reference.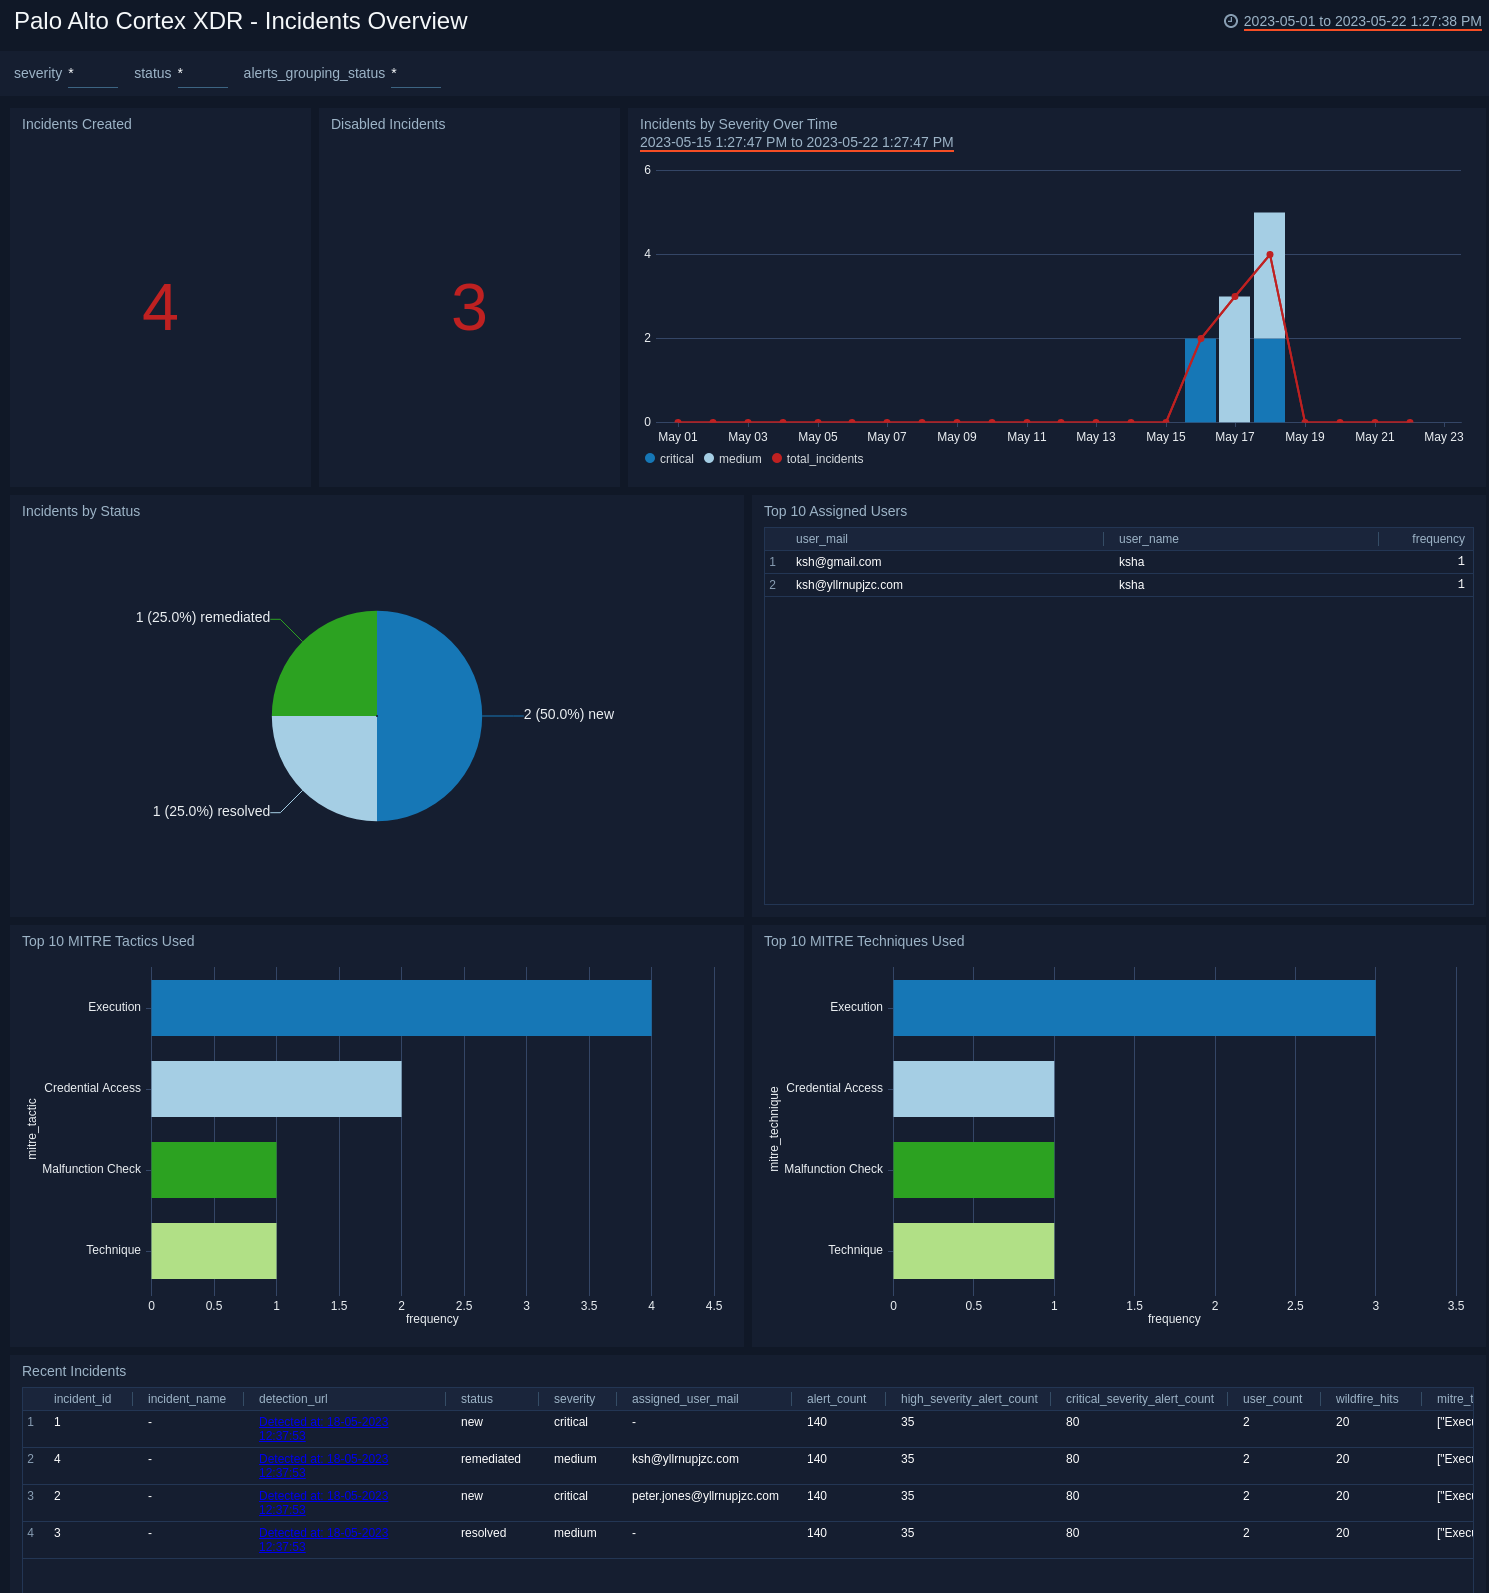
Upgrade/Downgrade the Palo Alto Cortex XDR app (Optional)
To update the app, do the following:
Next-Gen App: To install or update the app, you must be an account administrator or a user with Manage Apps, Manage Monitors, Manage Fields, Manage Metric Rules, and Manage Collectors capabilities depending upon the different content types part of the app.
- Select App Catalog.
- In the Search Apps field, search for and then select your app.
Optionally, you can identify apps that can be upgraded in the Upgrade available section. - To upgrade the app, select Upgrade from the Manage dropdown.
- If the upgrade does not have any configuration or property changes, you will be redirected to the Preview & Done section.
- If the upgrade has any configuration or property changes, you will be redirected to the Setup Data page.
- In the Configure section of your respective app, complete the following fields.
- Field Name. If you already have collectors and sources set up, select the configured metadata field name (eg _sourcecategory) or specify other custom metadata (eg: _collector) along with its metadata Field Value.
- Click Next. You will be redirected to the Preview & Done section.
Post-update
Your upgraded app will be installed in the Installed Apps folder and dashboard panels will start to fill automatically.
See our Release Notes changelog for new updates in the app.
To revert the app to a previous version, do the following:
- Select App Catalog.
- In the Search Apps field, search for and then select your app.
- To version down the app, select Revert to < previous version of your app > from the Manage dropdown.
Uninstalling the Palo Alto Cortex XDR app (Optional)
To uninstall the app, do the following:
- Select App Catalog.
- In the 🔎 Search Apps field, run a search for your desired app, then select it.
- Click Uninstall.