Proofpoint on Demand
Proofpoint on Demand is a cloud-based cybersecurity platform that offers a wide range of services to protect businesses against cyber threats. This includes email security, threat intelligence, information protection, and compliance solutions. The Proofpoint on Demand app for Sumo Logic provides insight into the functioning and effectiveness of your email security policies, allowing you to make informed decisions to improve security posture. This app will further provide information about the encryption status of the communication.
Key features of the Proofpoint on Demand app include:
- Email security monitoring. Monitor message traffic to detect and prevent spam, phishing, and other email-borne threats.
- Compliance monitoring. Monitor email communications for compliance with internal policies and external regulations such as Data Loss Prevention (DLP), Domain-based Message Authentication, Reporting and Conformance (DMARC), and other relevant regulations.
- Incident investigation. Quickly investigate potential security incidents by searching and analyzing email security and compliance data. This includes identifying the source of a security threat and the extent of its impact.
- User behavior monitoring. Monitor behavior related to email communication to identify potential insider threats or unauthorized access.
Log types
This app uses Proofpoint on Demand source to collect the data from Proofpoint on Demand (PoD) Log Service and uses the secure WebSocket (WSS) protocol, which securely stores the required authentication, scheduling, and state tracking information.
Sample log messages
Message log
 {
 "final_module": "access",
 "msg": {
   "normalizedHeader": {},
   "sizeBytes": 819,
   "parsedAddresses": {},
   "lang": "",
   "header": {
     "to": [
       "mailive@knowledgefront.com"
     ],
     "message-id": [
       "<1581095749241195154.24679.9211199633289683320@tx01.kfront.net>"
     ],
     "from": [
       "mailive@knowledgefront.com"
     ],
     "subject": [
       "Mailive! Test - [FSMAILID:gmExdGJvdXBtaDg4dWpzMGI4dDVjcnEw]"
     ]
   }
 },
 "action_dmarc": [],
 "filter": {
   "routeDirection": "outbound",
   "isMsgReinjected": false,
   "verified": {
     "rcpts": [
       "mailive@knowledgefront.com"
     ]
   },
   "durationSecs": 0.058829,
   "isMsgEncrypted": false,
   "routes": [
     "allow_relay"
   ],
   "disposition": "accept",
   "actions": [
     {
       "rule": "pod-maillive",
       "isFinal": true,
       "action": "accept",
       "module": "access"
     }
   ],
   "qid": "017HEgfE030485",
   "suborgs": {
     "rcpts": [],
     "sender": "0"
   },
   "msgSizeBytes": 805,
   "quarantine": {
     "rule": "",
     "folder": "Audit"
   },
   "startTime": "2020-02-07T09:15:49.686439-0800"
 },
 "msgParts": [],
 "action_dkimv": [],
 "guid": "aOH73jx-Jt3cX8BzsgT0mtadA3boGiIG",
 "action_spf": [],
 "connection": {
   "tls": {
     "inbound": {
       "cipherBits": 128,
       "cipher": "ECDHE-RSA-AES128-GCM-SHA256",
       "version": "TLSv1.2"
     }
   },
   "sid": "2xybws990h",
   "protocol": "smtp:smtp",
   "country": "us",
   "helo": "tx01.kfront.net",
   "ip": "69.164.206.119",
   "host": "tx01.kfront.net",
   "resolveStatus": "ok"
 },
 "envelope": {
   "rcpts": [
     "mailive@knowledgefront.com"
   ],
   "from": "mailive@knowledgefront.com",
   "rcptsHashed": [
     "a78455da15dc5a93e0a59189ffe790c7@knowledgefront.com"
   ],
   "fromHashed": "a78455da15dc5a93e0a59189ffe790c7@knowledgefront.com"
 },
 "pps": {
   "agent": "m0072553.ppops.net",
   "cid": "pphosted_prodmgt_hosted",
   "version": "8.14.0.396"
 },
 "ts": "2020-02-07T09:15:49.686439-0800",
 "final_rule": "pod-maillive",
 "final_action": "accept",
 "metadata": {
   "origin": {
     "data": {
       "agent": "m0072553.ppops.net",
       "cid": "pphosted_prodmgt_hosted",
       "version": "8.14.0.396"
     }
   }
 }
}
Sample queries
_sourceCategory="pod_src"
| json "guid","filter.routeDirection","msg.header.from","msg.header.to","filter.disposition","connection.ip","ts","msg.header.subject","msg.header.message-id","final_module","final_rule","action_dmarc","filter.quarantine.folder","filter.isMsgEncrypted","final_action" as guid,route_direction,sender_email,receiver_email,disposition,ip,time_stamp,subject,message_id,final_module,final_rule,action_dmarc,quarantine_folder,is_encrypted,final_action nodrop
| where route_direction matches "{{route_direction}}"
| where final_action matches "{{action}}"
| where disposition matches "{{disposition}}"
| where is_encrypted matches "{{is_encrypted}}"
| where final_rule matches "{{rule}}"
| where final_module matches "{{module}}"
// extracting individual emails from array of emails
| extract field=receiver_email "\"?(?<individual_receiver_email>[\w\s\-@.<>]*)\"?[,\n\]]" multi
| extract field=individual_receiver_email ".@(?<inbound_domain>[a-z0-9-.]*)"
| count_distinct(inbound_domain)
Collection configuration and app installation
Depending on the set up collection method, you can configure and install the app in three ways:
- Create a new collector and install the app. Create a new Sumo Logic Cloud-to-Cloud (C2C) source under a new Sumo Logic Collector and later install the app, or
- Use an existing collector and install the app. Create a new Sumo Logic Cloud-to-Cloud (C2C) source under an existing Sumo Logic Collector and later install the app, or
- Use existing source and install the app. Use your existing configured Sumo Logic Cloud-to-Cloud (C2C) source and install the app.
Use the Cloud-to-Cloud Integration for Proofpoint on Demand to create the source and use the same source category while installing the app. By following these steps, you can ensure that your Proofpoint on Demand app is properly integrated and configured to collect and analyze your Proofpoint on Demand data.
Create a new collector and install the app
To set up collection and install the app, do the following:
Next-Gen App: To install or update the app, you must be an account administrator or a user with Manage Apps, Manage Monitors, Manage Fields, Manage Metric Rules, and Manage Collectors capabilities depending upon the different content types part of the app.
- Select App Catalog.
- In the 🔎 Search Apps field, run a search for your desired app, then select it.
- Click Install App.
note
Sometimes this button says Add Integration.
- In the Set Up Collection section of your respective app, select Create a new Collector.
- Collector Name. Enter a Name to display the Source in the Sumo Logic web application. The description is optional.
- Timezone. Set the default time zone when it is not extracted from the log timestamp. Time zone settings on Sources override a Collector time zone setting.
- (Optional) Metadata. Click the +Add Metadata link to add a custom log Metadata Fields. Define the fields you want to associate, each metadata field needs a name (key) and value.
 A green circle with a checkmark is shown when the field exists and is enabled in the Fields table schema.
 An orange triangle with an exclamation point is shown when the field doesn't exist, or is disabled, in the Fields table schema. In this case, an option to automatically add or enable the nonexistent fields to the Fields table schema is provided. If a field is sent to Sumo that does not exist in the Fields schema or is disabled it is ignored, known as dropped.
- Click Next.
- Configure the source as specified in the
Infobox above, ensuring all required fields are included. - In the Configure section of your respective app, complete the following fields.
- Field Name. If you already have collectors and sources set up, select the configured metadata field name (eg _sourcecategory) or specify other custom metadata (eg: _collector) along with its metadata Field Value.
- Click Next. You will be redirected to the Preview & Done section.
Post-installation
Once your app is installed, it will appear in your Installed Apps folder, and dashboard panels will start to fill automatically.
Each panel slowly fills with data matching the time range query received since the panel was created. Results will not immediately be available but will be updated with full graphs and charts over time.
Use an existing collector and install the app
To set up the source in the existing collector and install the app, do the following:
Next-Gen App: To install or update the app, you must be an account administrator or a user with Manage Apps, Manage Monitors, Manage Fields, Manage Metric Rules, and Manage Collectors capabilities depending upon the different content types part of the app.
- Select App Catalog.
- In the 🔎 Search Apps field, run a search for your desired app, then select it.
- Click Install App.
note
Sometimes this button says Add Integration.
- In the Set Up Collection section of your respective app, select Use an existing Collector.
- From the Select Collector dropdown, select the collector that you want to set up your source with and click Next.
- Configure the source as specified in the
Infobox above, ensuring all required fields are included. - In the Configure section of your respective app, complete the following fields.
- Field Name. If you already have collectors and sources set up, select the configured metadata field name (eg _sourcecategory) or specify other custom metadata (eg: _collector) along with its metadata Field Value.
- Click Next. You will be redirected to the Preview & Done section.
Post-installation
Once your app is installed, it will appear in your Installed Apps folder, and dashboard panels will start to fill automatically.
Each panel slowly fills with data matching the time range query received since the panel was created. Results will not immediately be available but will be updated with full graphs and charts over time.
Use an existing source and install the app
To skip collection and only install the app, do the following:
Next-Gen App: To install or update the app, you must be an account administrator or a user with Manage Apps, Manage Monitors, Manage Fields, Manage Metric Rules, and Manage Collectors capabilities depending upon the different content types part of the app.
- Select App Catalog.
- In the 🔎 Search Apps field, run a search for your desired app, then select it.
- Click Install App.
note
Sometimes this button says Add Integration.
- In the Set Up Collection section of your respective app, select Skip this step and use existing source and click Next.
- In the Configure section of your respective app, complete the following fields.
- Field Name. If you already have collectors and sources set up, select the configured metadata field name (eg _sourcecategory) or specify other custom metadata (eg: _collector) along with its metadata Field Value.
- Click Next. You will be redirected to the Preview & Done section.
Post-installation
Once your app is installed, it will appear in your Installed Apps folder, and dashboard panels will start to fill automatically.
Each panel slowly fills with data matching the time range query received since the panel was created. Results will not immediately be available but will be updated with full graphs and charts over time.
Viewing Proofpoint on Demand dashboards
All dashboards have a set of filters that you can apply to the entire dashboard. Use these filters to drill down and examine the data to a granular level.
- You can change the time range for a dashboard or panel by selecting a predefined interval from a drop-down list, choosing a recently used time range, or specifying custom dates and times. Learn more.
- You can use template variables to drill down and examine the data on a granular level. For more information, see Filtering Dashboards with Template Variables.
- Most Next-Gen apps allow you to provide the scope at the installation time and are comprised of a key (
_sourceCategoryby default) and a default value for this key. Based on your input, the app dashboards will be parameterized with a dashboard variable, allowing you to change the dataset queried by all panels. This eliminates the need to create multiple copies of the same dashboard with different queries.
Message Monitoring
The Proofpoint on Demand - Message Monitoring dashboard offers valuable insights into message traffic, such as the number of distinct sender and receiver domains, geo-locations of senders, and blocked messages. It also tracks trends in the actions taken on messages and provides a list of the top 10 senders and receivers. Leveraging this information gives you a better understanding of the email traffic patterns and takes action to improvise email security posture.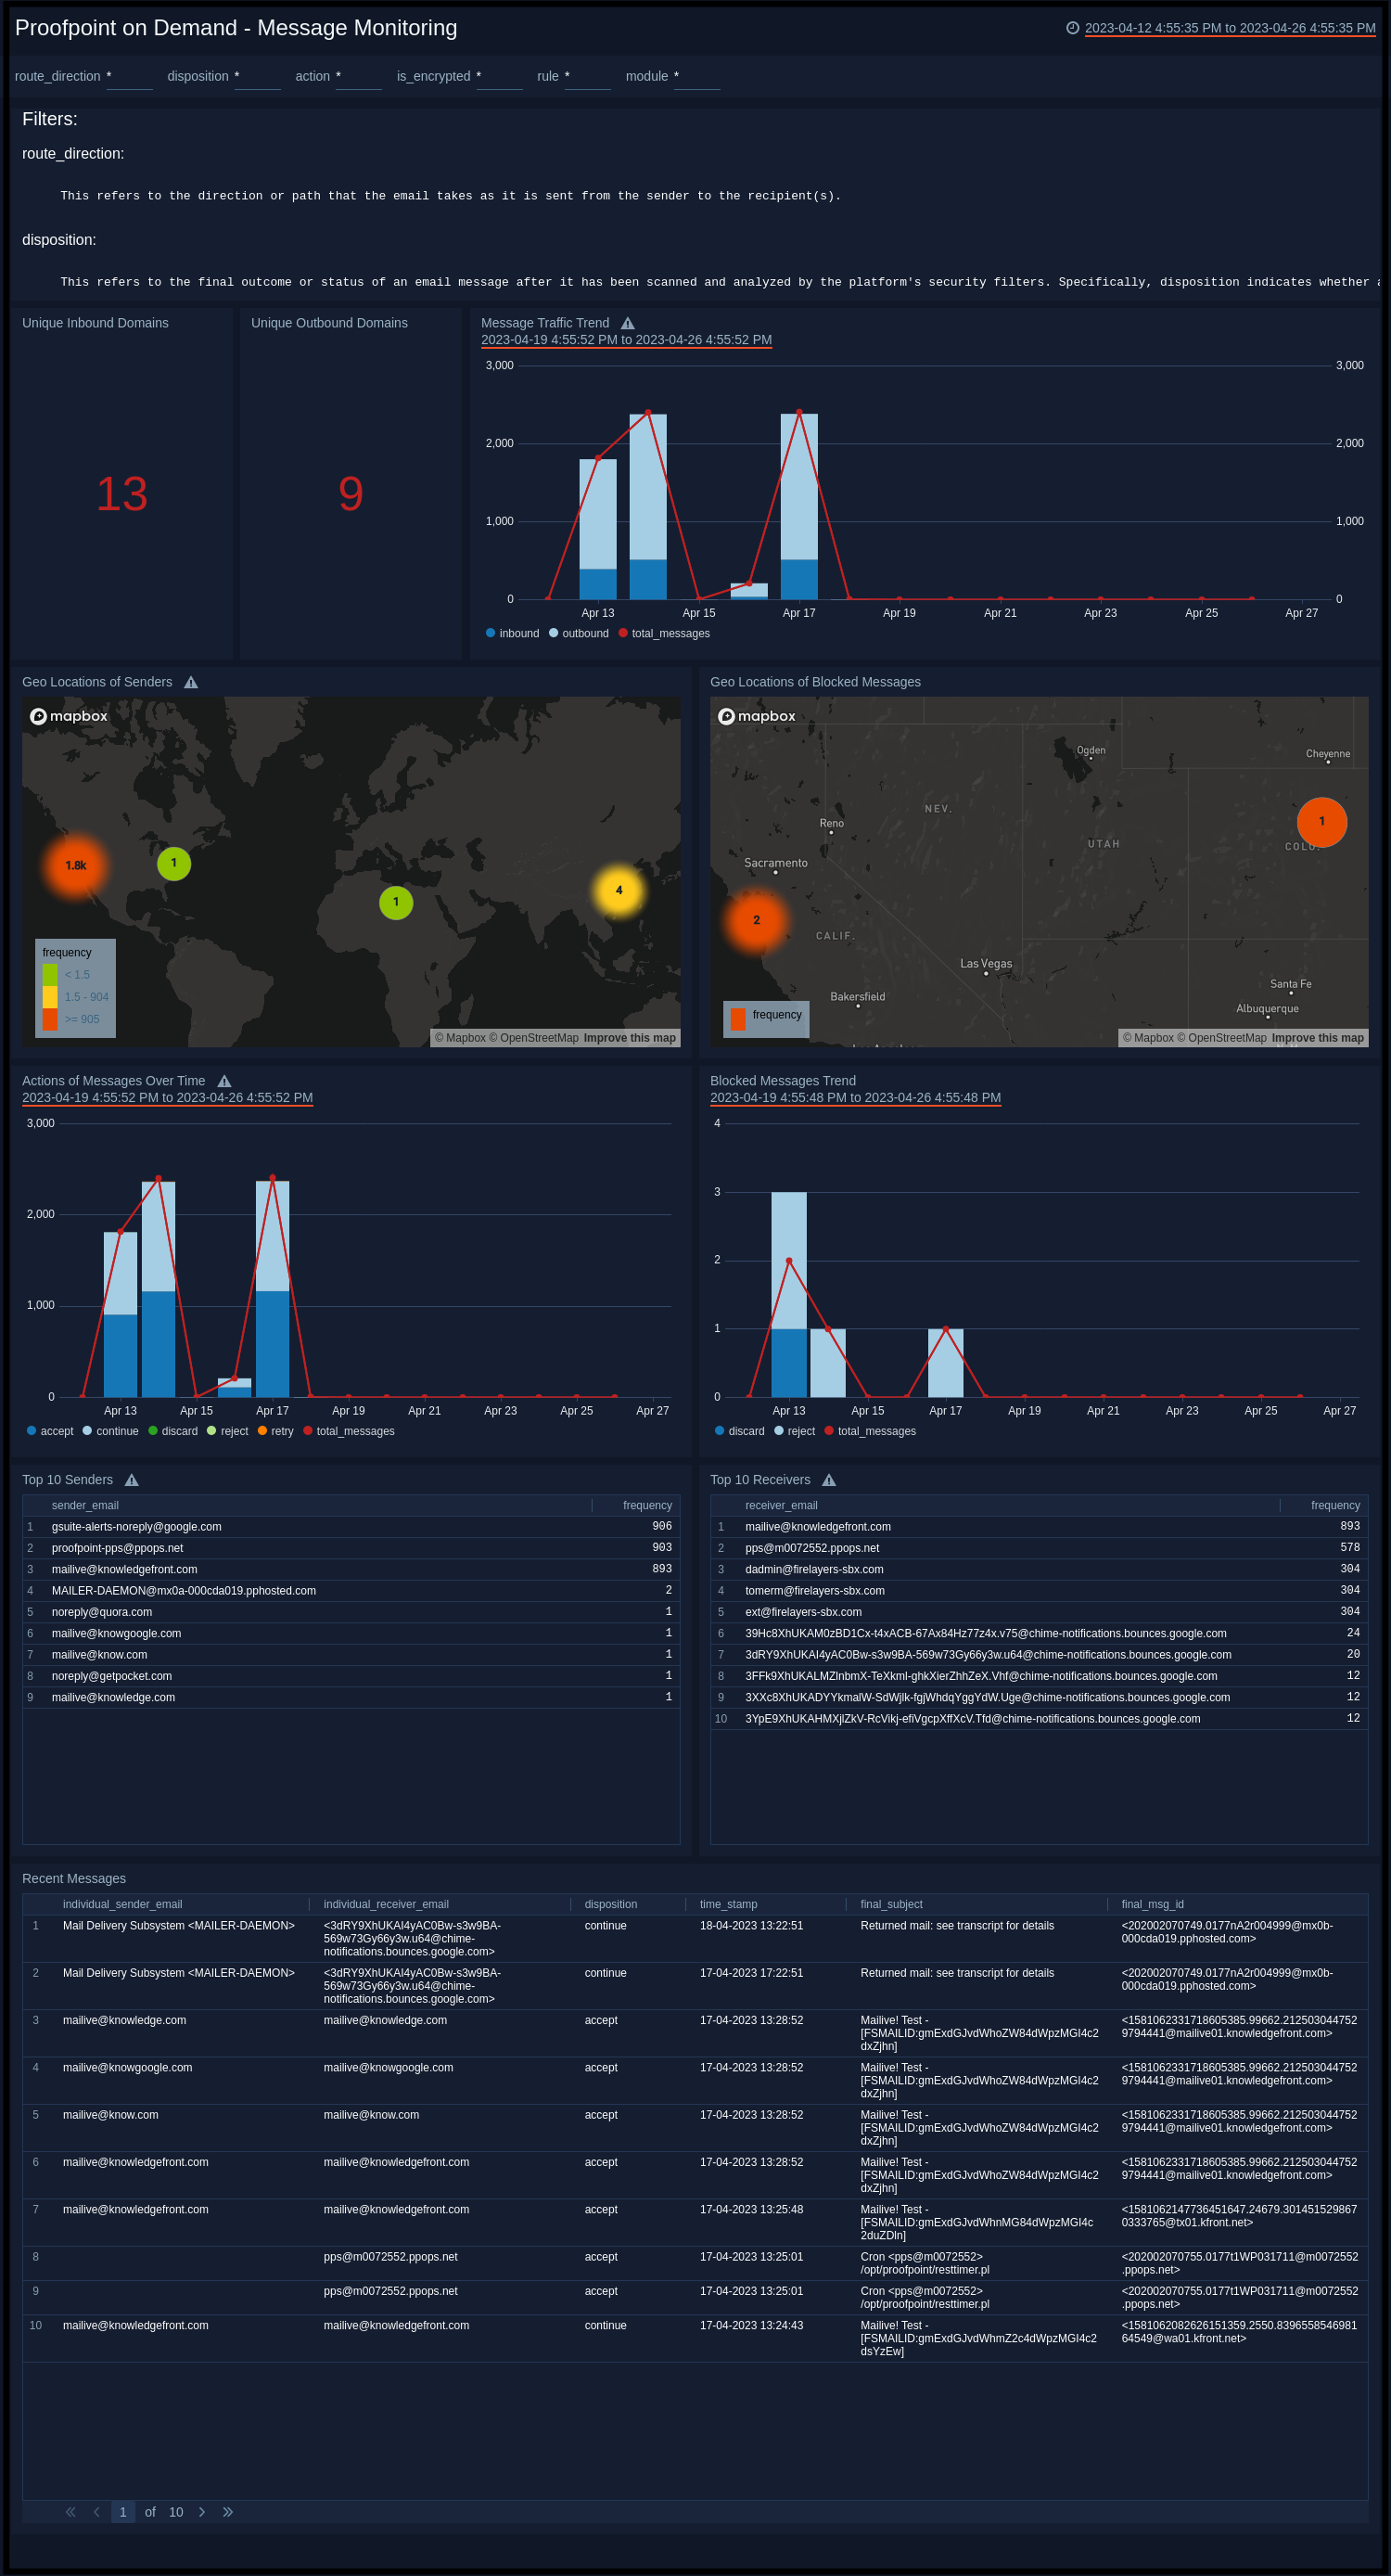
Security Overview
The Proofpoint on Demand - Security Overview dashboard is designed to monitor email communications for compliance with both internal policies and external regulations, such as DLP and DMARC. It includes widgets for geo-location tracking of messages from high-risk countries, a summary of policy results for DMARC, DLP, Anti-Spam and Anti-Virus, and messages in the quarantine folder by category. In addition, the dashboard includes a TLS message trend chart that displays the ratio of encrypted to unencrypted messages, along with insights into the unencrypted sender and receiver domains. Overall, the Security Overview dashboard helps organizations maintain compliance with relevant regulations and policies while also providing valuable insights to improve their email security posture.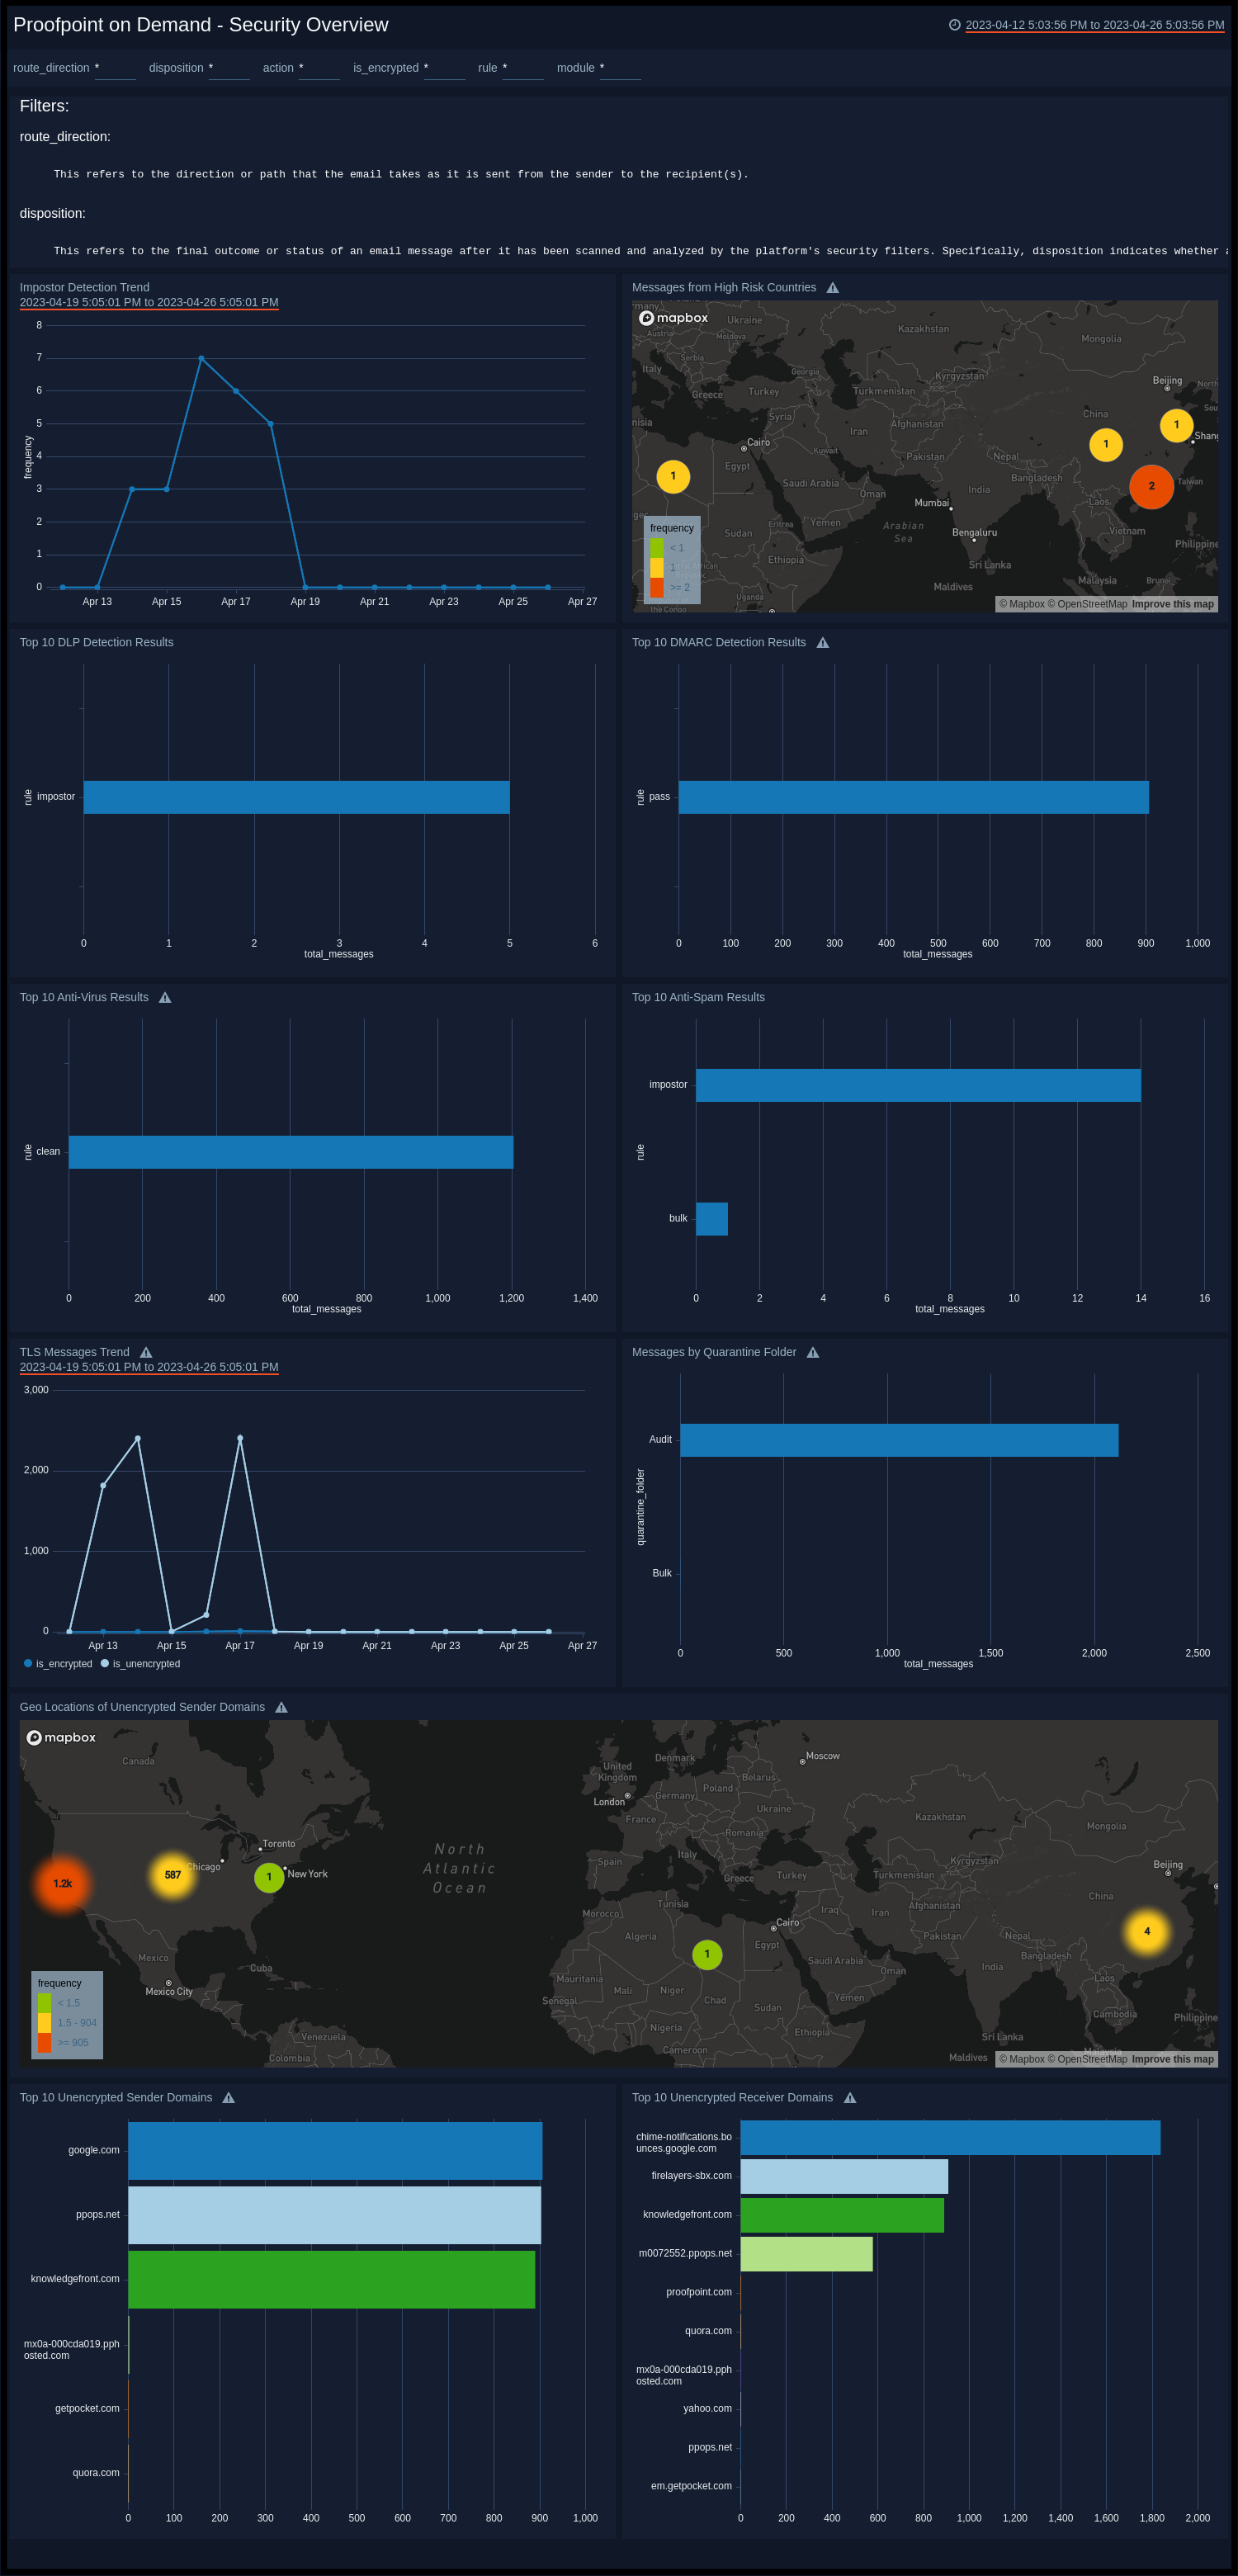
Upgrade/Downgrade the Proofpoint on Demand app (Optional)
To update the app, do the following:
Next-Gen App: To install or update the app, you must be an account administrator or a user with Manage Apps, Manage Monitors, Manage Fields, Manage Metric Rules, and Manage Collectors capabilities depending upon the different content types part of the app.
- Select App Catalog.
- In the Search Apps field, search for and then select your app.
Optionally, you can identify apps that can be upgraded in the Upgrade available section. - To upgrade the app, select Upgrade from the Manage dropdown.
- If the upgrade does not have any configuration or property changes, you will be redirected to the Preview & Done section.
- If the upgrade has any configuration or property changes, you will be redirected to the Setup Data page.
- In the Configure section of your respective app, complete the following fields.
- Field Name. If you already have collectors and sources set up, select the configured metadata field name (eg _sourcecategory) or specify other custom metadata (eg: _collector) along with its metadata Field Value.
- Click Next. You will be redirected to the Preview & Done section.
Post-update
Your upgraded app will be installed in the Installed Apps folder and dashboard panels will start to fill automatically.
See our Release Notes changelog for new updates in the app.
To revert the app to a previous version, do the following:
- Select App Catalog.
- In the Search Apps field, search for and then select your app.
- To version down the app, select Revert to < previous version of your app > from the Manage dropdown.
Uninstalling the Proofpoint on Demand app (Optional)
To uninstall the app, do the following:
- Select App Catalog.
- In the 🔎 Search Apps field, run a search for your desired app, then select it.
- Click Uninstall.