Akamai Security Events
Akamai Security Events app allows you to visualize security events generated on the Akamai platform. The preconfigured dashboards provide insights into attack data, sources of attack, attack queries, geolocation of attack source, context on attack’s HTTP request, and rules triggered by the attack.
Log types
The Akamai Security Events app uses security events generated on the Akamai platform by leveraging the V1 SIEM API and Sumo Logic’s Akamai SIEM API Source.
Sample log messages
Click to view the log message
{
  "type": "akamai_siem",
  "format": "json",
  "version": "1.0",
  "attackData": {
    "rule": "",
    "ruleVersion": "",
    "ruleMessage": "",
    "ruleTag": "",
    "ruleData": "",
    "ruleSelector": "",
    "ruleAction": "",
    "configId": "76756",
    "policyId": "prag_136180",
    "clientIP": "13.29.10.10"
  },
  "httpMessage": {
    "requestId": "2d442db6",
    "start": "1627663284",
    "protocol": "HTTP/1.1",
    "method": "GET",
    "host": "fierce.force.com",
    "port": "80",
    "path": "/",
    "query": "v=999999.9 union all select 0x31303235343830303536,0x31303235343830303536",
    "requestHeaders": {
      "Host": "fierce.force.com",
      "User-Agent": "Mozilla/5.0 (Windows; U; Windows NT 5.1; en-US; rv:1.8.0.7) Gecko/20060909 Firefox/1.5.0.7",
      "Accept": "text/xml,application/xml,application/xhtml xml,text/html;q=0.9,text/plain;q=0.8,image/png,*/*;q=0.",
      "Keep-Alive": "300",
      "Proxy-Connection": "keep-alive",
      "Content-Length": "2"
    },
    "status": "200",
    "bytes": "22726",
    "responseHeaders": "Server%3a%20Apache%2f2.4.29%20(Ubuntu)...tive-Regex-Time%3a%20681%0d%0aAkamai-X-Request-ID%3a%202d442db6%0d%0a"
  },
  "geo": {
    "continent": "NA",
    "country": "US",
    "city": "WESTFORD",
    "regionCode": "MA",
    "asn": "7922"
  }
}
Sample queries
_sourceCategory=<akamai-foo>
| json field=_raw "attackData.clientIP", "attackData.configId", "attackData.policyId", "attackData.ruleAction", "attackData.rule", "attackData.ruleMessage", "attackData.ruleSelector", "attackData.ruleTag", "attackData.ruleVersion", "httpMessage.start", "httpMessage.status" as client_ip, config_id, policy_id, rule_action, rule, rule_message, rule_selector, rule_tag, rule_version, time_epoch, http_response nodrop
| time_epoch * 1000 as time_epoch_ms
|formatDate(toLong(time_epoch_ms), "MM-dd-yyyyHH:mm:ss") as attack_date
| json field=_raw "geo.city", "geo.continent", "geo.country", "geo.regionCode", "geo.asn" as city, continent, country, region_code, asn nodrop
|count by attack_date, client_ip, city, country, rule_action, rule, rule_message, rule_selector, rule_version, config_id, policy_id,http_response
Collection configuration and app installation
Depending on the set up collection method, you can configure and install the app in three ways:
- Create a new collector and install the app. Create a new Sumo Logic Cloud-to-Cloud (C2C) source under a new Sumo Logic Collector and later install the app, or
- Use an existing collector and install the app. Create a new Sumo Logic Cloud-to-Cloud (C2C) source under an existing Sumo Logic Collector and later install the app, or
- Use existing source and install the app. Use your existing configured Sumo Logic Cloud-to-Cloud (C2C) source and install the app.
Use the Cloud-to-Cloud Integration for Akamai Security Events to create the source and use the same source category while installing the app. By following these steps, you can ensure that your Akamai Security Events app is properly integrated and configured to collect and analyze your Akamai Security Events data.
Create a new collector and install the app
To set up collection and install the app, do the following:
Next-Gen App: To install or update the app, you must be an account administrator or a user with Manage Apps, Manage Monitors, Manage Fields, Manage Metric Rules, and Manage Collectors capabilities depending upon the different content types part of the app.
- Select App Catalog.
- In the 🔎 Search Apps field, run a search for your desired app, then select it.
- Click Install App.
note
Sometimes this button says Add Integration.
- In the Set Up Collection section of your respective app, select Create a new Collector.
- Collector Name. Enter a Name to display the Source in the Sumo Logic web application. The description is optional.
- Timezone. Set the default time zone when it is not extracted from the log timestamp. Time zone settings on Sources override a Collector time zone setting.
- (Optional) Metadata. Click the +Add Metadata link to add a custom log Metadata Fields. Define the fields you want to associate, each metadata field needs a name (key) and value.
 A green circle with a checkmark is shown when the field exists and is enabled in the Fields table schema.
 An orange triangle with an exclamation point is shown when the field doesn't exist, or is disabled, in the Fields table schema. In this case, an option to automatically add or enable the nonexistent fields to the Fields table schema is provided. If a field is sent to Sumo that does not exist in the Fields schema or is disabled it is ignored, known as dropped.
- Click Next.
- Configure the source as specified in the
Infobox above, ensuring all required fields are included. - In the Configure section of your respective app, complete the following fields.
- Field Name. If you already have collectors and sources set up, select the configured metadata field name (eg _sourcecategory) or specify other custom metadata (eg: _collector) along with its metadata Field Value.
- Click Next. You will be redirected to the Preview & Done section.
Post-installation
Once your app is installed, it will appear in your Installed Apps folder, and dashboard panels will start to fill automatically.
Each panel slowly fills with data matching the time range query received since the panel was created. Results will not immediately be available but will be updated with full graphs and charts over time.
Use an existing collector and install the app
To set up the source in the existing collector and install the app, do the following:
Next-Gen App: To install or update the app, you must be an account administrator or a user with Manage Apps, Manage Monitors, Manage Fields, Manage Metric Rules, and Manage Collectors capabilities depending upon the different content types part of the app.
- Select App Catalog.
- In the 🔎 Search Apps field, run a search for your desired app, then select it.
- Click Install App.
note
Sometimes this button says Add Integration.
- In the Set Up Collection section of your respective app, select Use an existing Collector.
- From the Select Collector dropdown, select the collector that you want to set up your source with and click Next.
- Configure the source as specified in the
Infobox above, ensuring all required fields are included. - In the Configure section of your respective app, complete the following fields.
- Field Name. If you already have collectors and sources set up, select the configured metadata field name (eg _sourcecategory) or specify other custom metadata (eg: _collector) along with its metadata Field Value.
- Click Next. You will be redirected to the Preview & Done section.
Post-installation
Once your app is installed, it will appear in your Installed Apps folder, and dashboard panels will start to fill automatically.
Each panel slowly fills with data matching the time range query received since the panel was created. Results will not immediately be available but will be updated with full graphs and charts over time.
Use an existing source and install the app
To skip collection and only install the app, do the following:
Next-Gen App: To install or update the app, you must be an account administrator or a user with Manage Apps, Manage Monitors, Manage Fields, Manage Metric Rules, and Manage Collectors capabilities depending upon the different content types part of the app.
- Select App Catalog.
- In the 🔎 Search Apps field, run a search for your desired app, then select it.
- Click Install App.
note
Sometimes this button says Add Integration.
- In the Set Up Collection section of your respective app, select Skip this step and use existing source and click Next.
- In the Configure section of your respective app, complete the following fields.
- Field Name. If you already have collectors and sources set up, select the configured metadata field name (eg _sourcecategory) or specify other custom metadata (eg: _collector) along with its metadata Field Value.
- Click Next. You will be redirected to the Preview & Done section.
Post-installation
Once your app is installed, it will appear in your Installed Apps folder, and dashboard panels will start to fill automatically.
Each panel slowly fills with data matching the time range query received since the panel was created. Results will not immediately be available but will be updated with full graphs and charts over time.
Viewing the Akamai Security Events dashboards
All dashboards have a set of filters that you can apply to the entire dashboard. Use these filters to drill down and examine the data to a granular level.
- You can change the time range for a dashboard or panel by selecting a predefined interval from a drop-down list, choosing a recently used time range, or specifying custom dates and times. Learn more.
- You can use template variables to drill down and examine the data on a granular level. For more information, see Filtering Dashboards with Template Variables.
- Most Next-Gen apps allow you to provide the scope at the installation time and are comprised of a key (
_sourceCategoryby default) and a default value for this key. Based on your input, the app dashboards will be parameterized with a dashboard variable, allowing you to change the dataset queried by all panels. This eliminates the need to create multiple copies of the same dashboard with different queries.
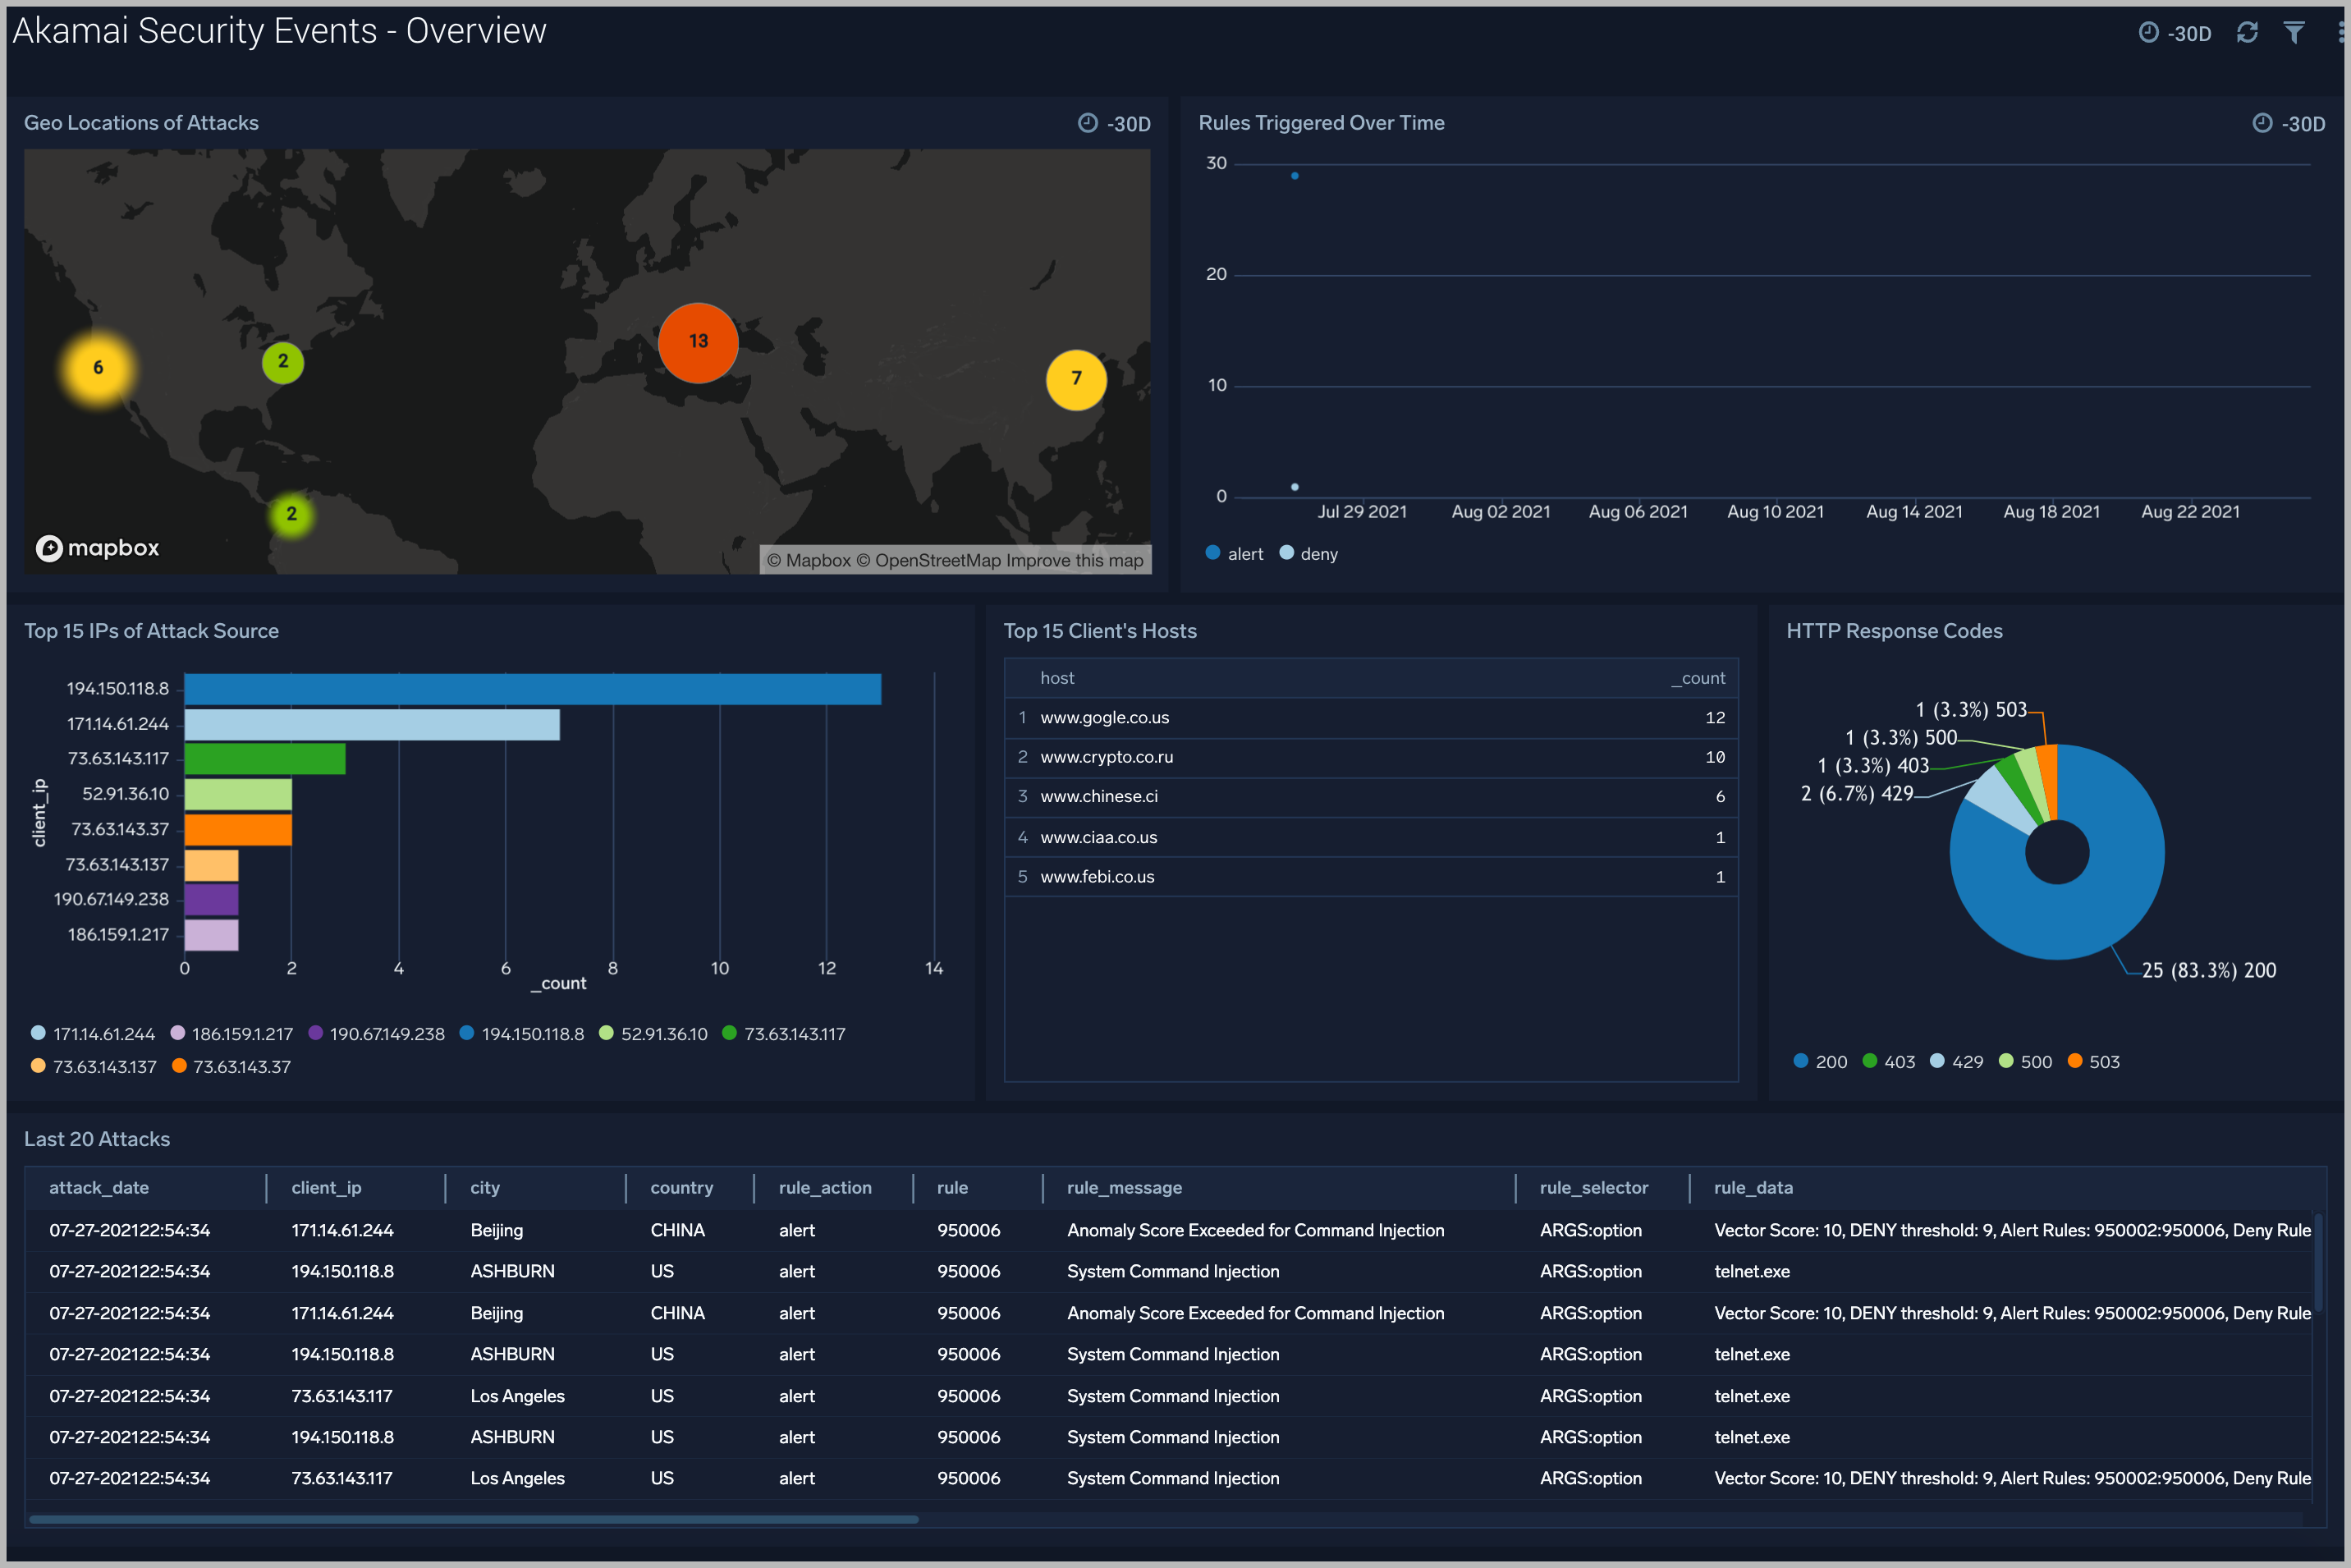
Overview
The Akamai Security Events - Overview dashboard gives you an at-a-glance view of security events generated on the Akamai Platform.
Use this dashboard to:
- Identify IPs of attack.
- Find Geolocation of the attack.
- Analyze summary of last 20 attacks.
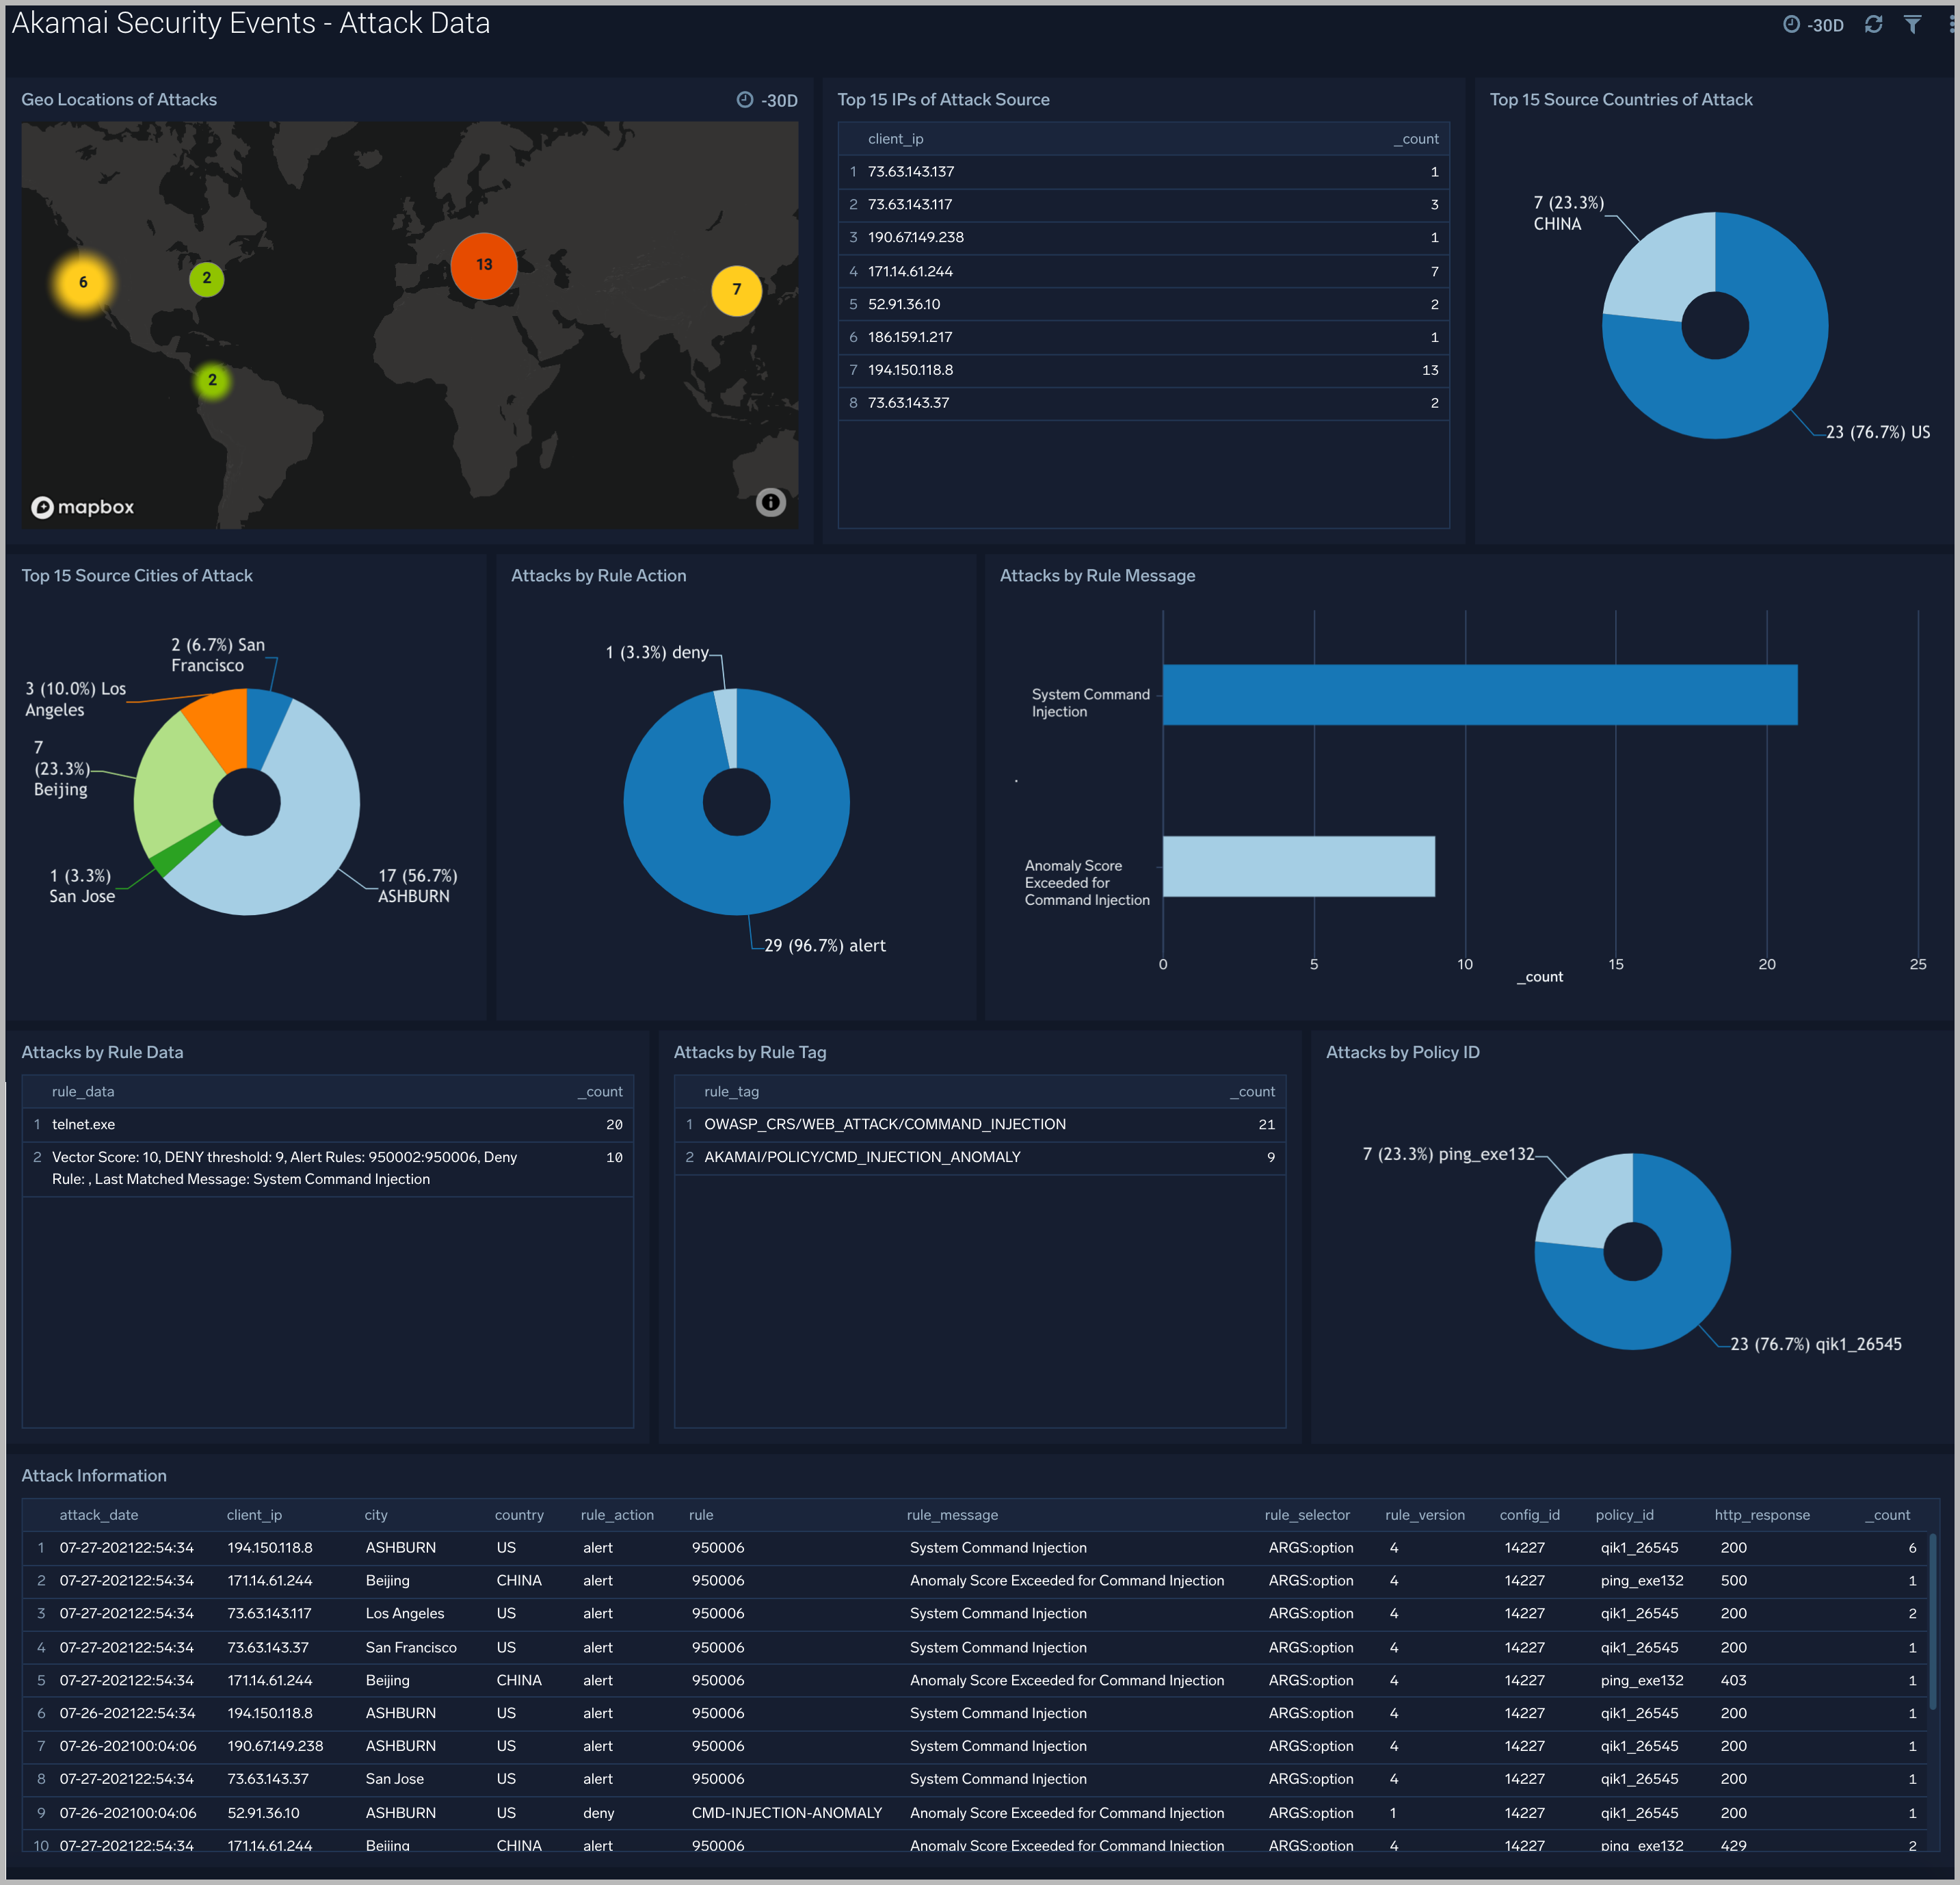
Attack Data
The Akamai Security Events - Attack Data dashboard helps you understand the nature of each attack and its corresponding Rule information.
Use this dashboard to:
- Identify IPs of attack.
- Find top sources of attack.
- Analyze messages reported by each triggered rule.
- Understand the nature of attacks, and contextual information around attacks.
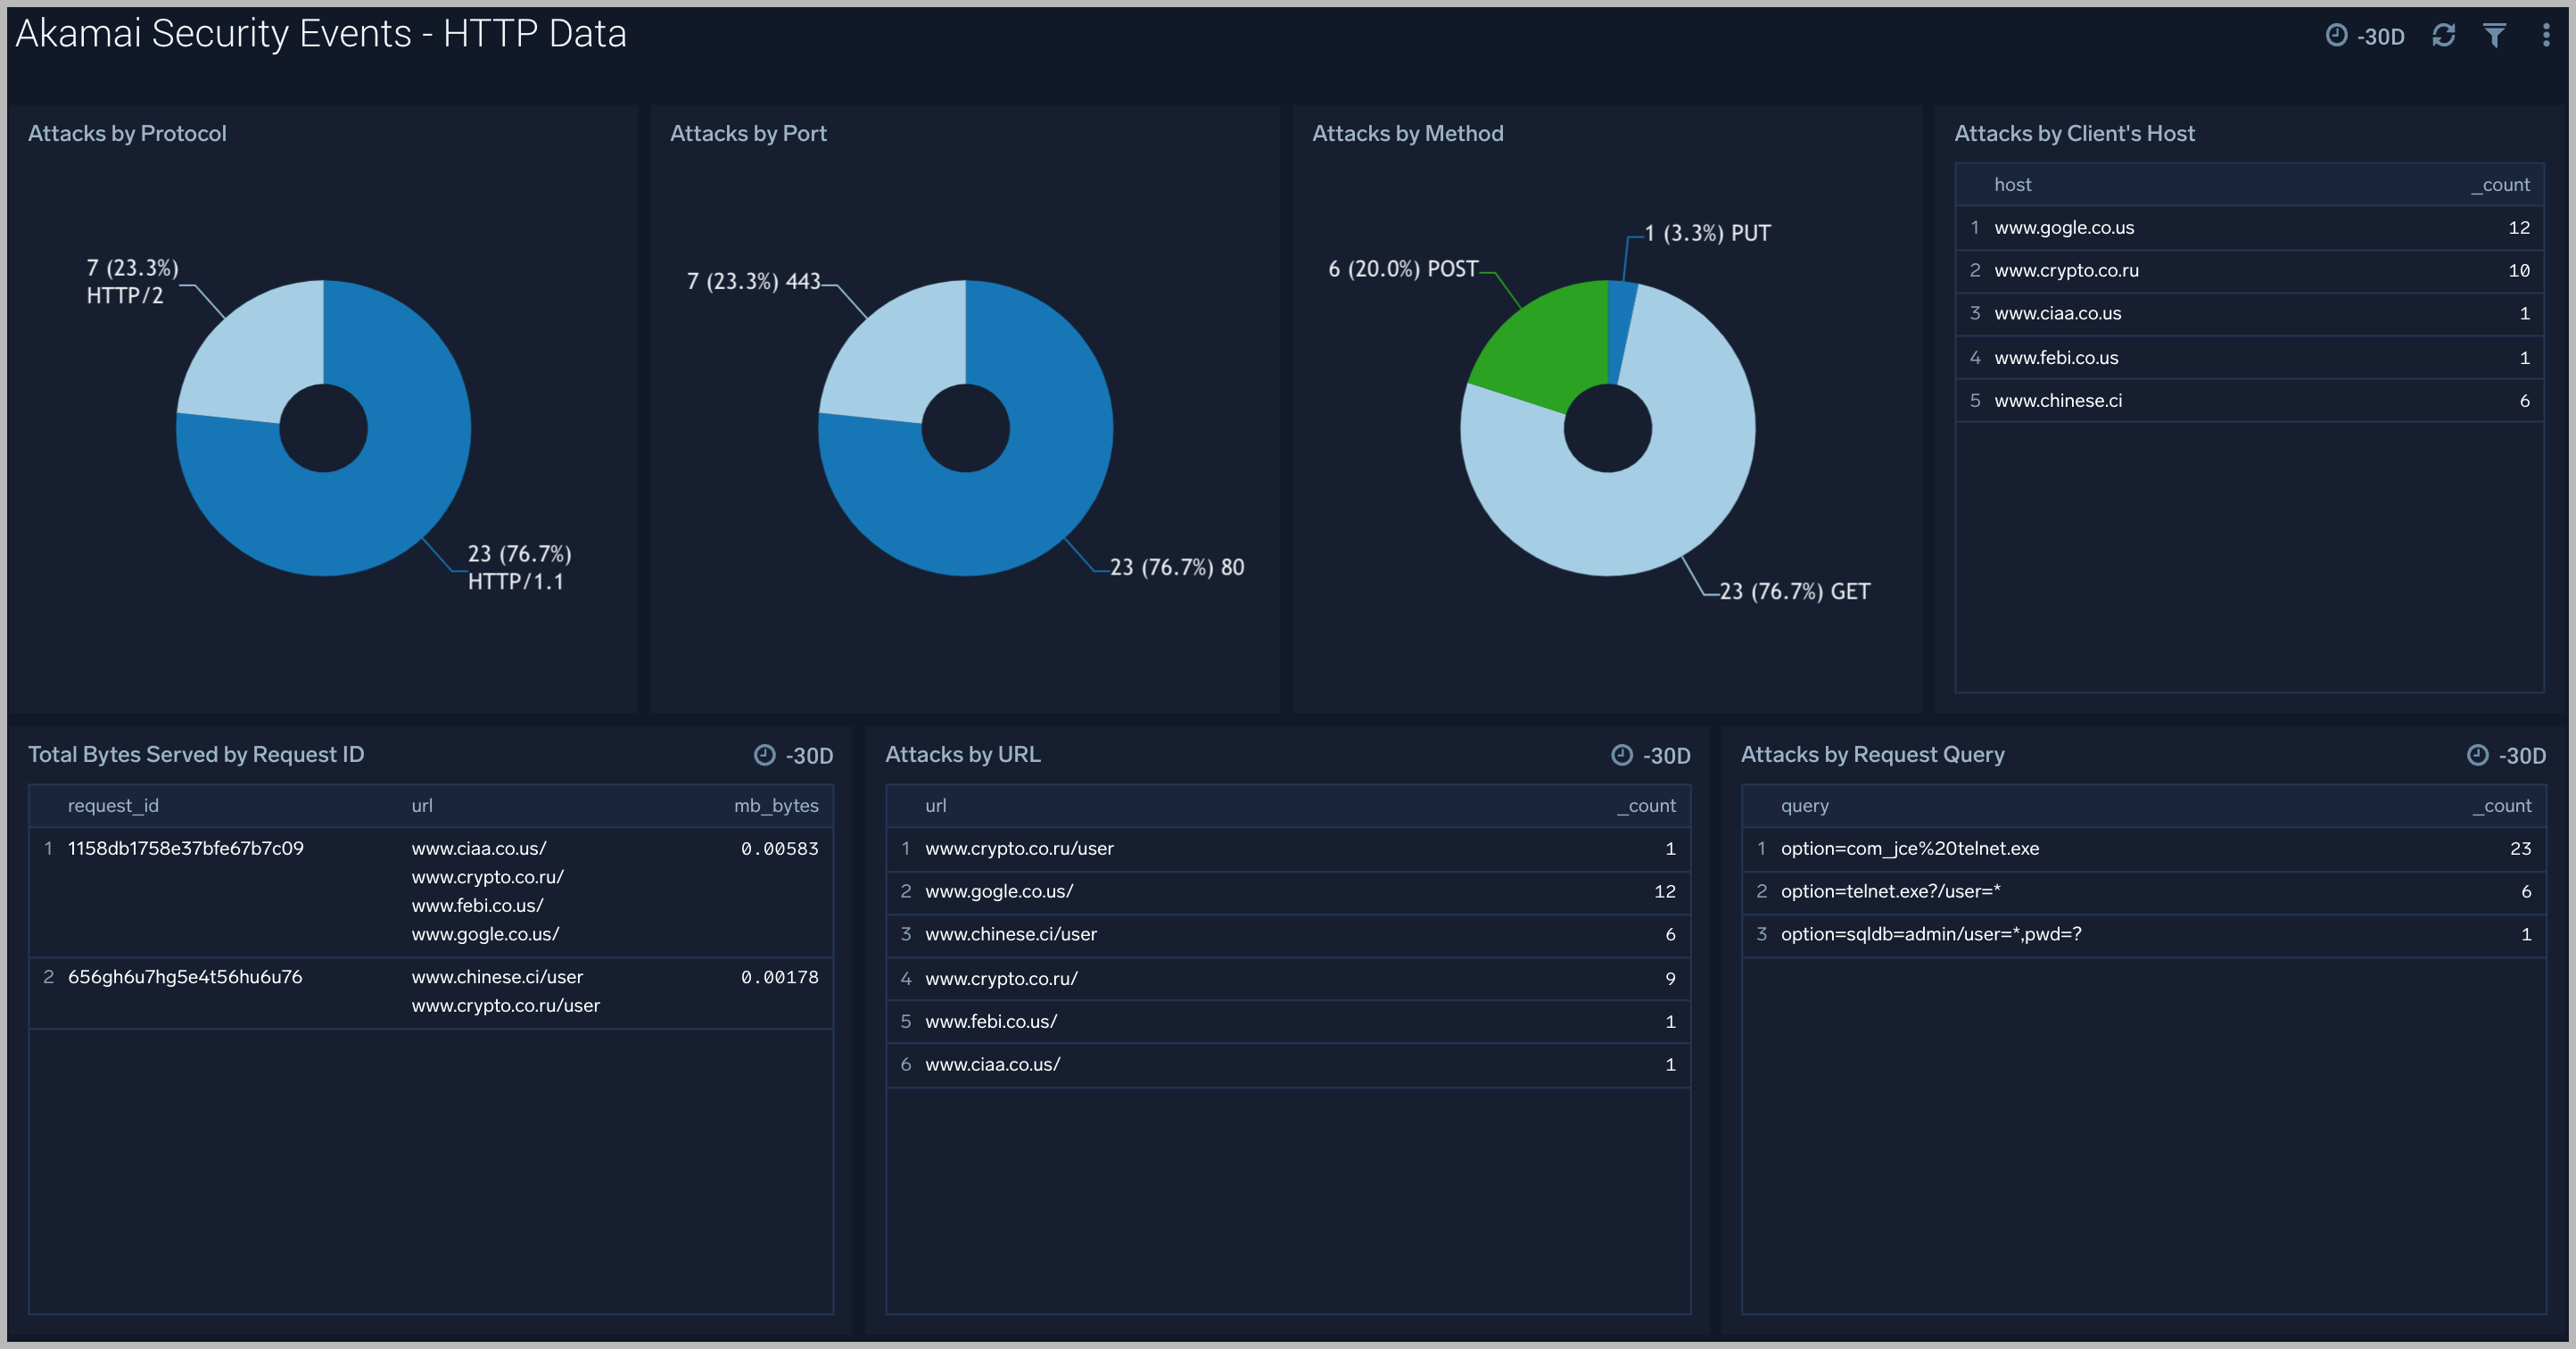
HTTP Data
The Akamai Security Events - HTTP Data dashboard provides context and visualization of attack’s HTTP request.
Use this dashboard to:
- Identify attacks by protocol, port and http method.
- Analyze bytes served during each attack request.
- Find request query which led to the attack.
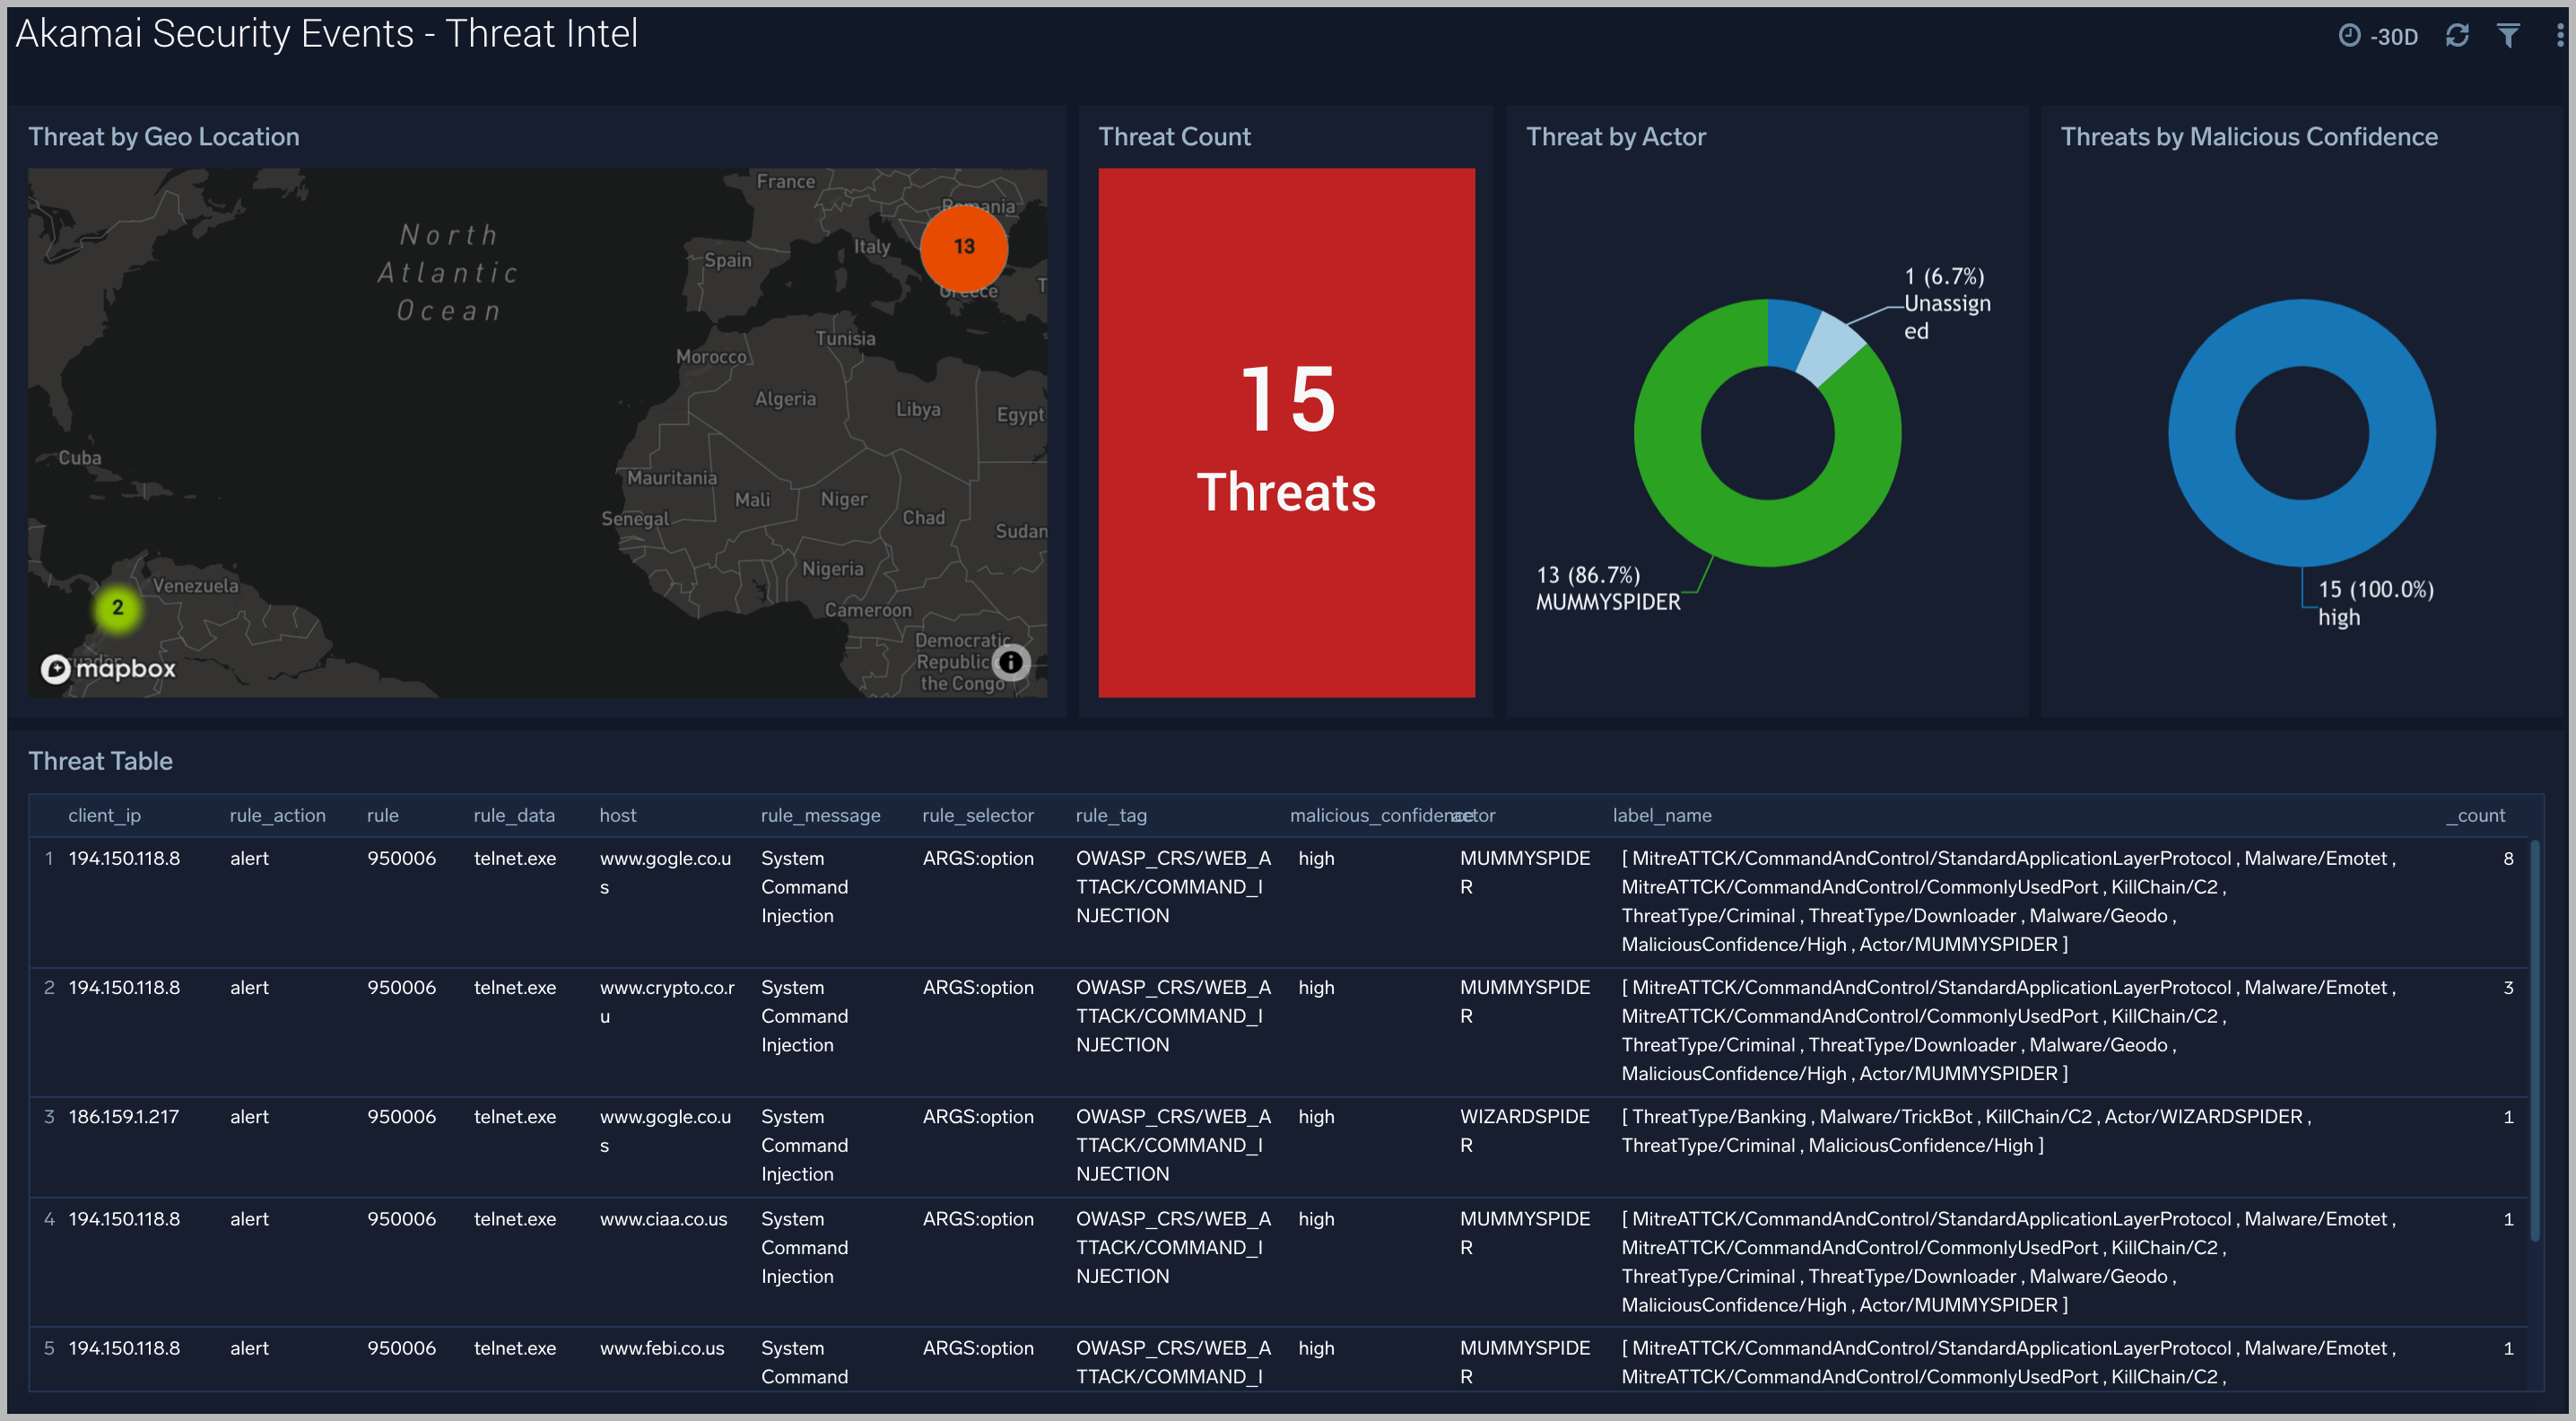
Threat Intel
The Akamai Security Events - Threat Intel dashboard provides an at-a-glance view of threats analyzed using Sumo Logic threat intelligence. Dashboard panels display threat count over a selected time period, geographic locations where threats occurred, source breakdown, actors responsible for threats, severity, and a correlation of IP addresses, method, and status code of threats.
Upgrade/Downgrade the Akamai Security Events app (Optional)
To update the app, do the following:
Next-Gen App: To install or update the app, you must be an account administrator or a user with Manage Apps, Manage Monitors, Manage Fields, Manage Metric Rules, and Manage Collectors capabilities depending upon the different content types part of the app.
- Select App Catalog.
- In the Search Apps field, search for and then select your app.
Optionally, you can identify apps that can be upgraded in the Upgrade available section. - To upgrade the app, select Upgrade from the Manage dropdown.
- If the upgrade does not have any configuration or property changes, you will be redirected to the Preview & Done section.
- If the upgrade has any configuration or property changes, you will be redirected to the Setup Data page.
- In the Configure section of your respective app, complete the following fields.
- Field Name. If you already have collectors and sources set up, select the configured metadata field name (eg _sourcecategory) or specify other custom metadata (eg: _collector) along with its metadata Field Value.
- Click Next. You will be redirected to the Preview & Done section.
Post-update
Your upgraded app will be installed in the Installed Apps folder and dashboard panels will start to fill automatically.
See our Release Notes changelog for new updates in the app.
To revert the app to a previous version, do the following:
- Select App Catalog.
- In the Search Apps field, search for and then select your app.
- To version down the app, select Revert to < previous version of your app > from the Manage dropdown.
Uninstalling the Akamai Security Events app (Optional)
To uninstall the app, do the following:
- Select App Catalog.
- In the 🔎 Search Apps field, run a search for your desired app, then select it.
- Click Uninstall.