Barracuda Web Application Firewall

The Barracuda Web Application Firewall protects your web, mobile and API applications from being compromised, prevents data breaches, ensure protection from web attacks, provide control access and authentication.
The Barracuda WAF App analyzes traffic flowing through the Barracuda WAF and provides pre-configured dashboards that allow you to monitor WAF traffic as well to analyze various types of attacks detected both by Barracuda and Sumo Logic’s own threat intelligence database.
Log types
The Barracuda WAF App uses the following log types:
- System Logs. Events generated by the Barracuda Web Application Firewall system.
- Web Firewall Log. All actions and events on the web firewall. These logs help the administrator to analyze traffic for suspicious activity and fine tune the web firewall policies.
- Access Logs. All web traffic activities. These logs help the administrator obtain information about website traffic and performance.
- Audit Logs. The audit logs record the activity of the users logged in to the GUI of the Barracuda Web Application Firewall. These logs are used for administration purposes.
- Network Firewall Logs. The network traffic passing through the interfaces (WAN, LAN and MGMT) that matches the configured Network ACL rule. These log entries provide information on every packet that is allowed or denied by Barracuda Web Application Firewall based on the Action specified in the ACL rule. This information helps identify where the network traffic originated, its destination, and the action applied.
For more information on Log formats, visit Barracuda Log Types page.
Sample log messages
The following table shows sample log messages for the corresponding log types.
| Log Type | Sample |
|---|---|
| System Log | <129>1 2019-04-19T00:52:58-07:00 WAFNEW 2019-04-19 - 00:52:58.985 -0700 WAFNEW SYS PROCMON ALER 50009 Log storage exceeds 10% |
| Web Firewall Log | <129>1 2019-04-09T03:57:49-07:00 WAFNEW 2019-04-09 - 03:57:49.304 -0700 WAFNEW WF ALER PYTHON_PHP_ATTACKS_MEDIUM_IN_URL 182.69.208.134 50910 10.0.1.90 80 security-policy GLOBAL DENY NONE [type\="python-php-attacks-medium" pattern\="python-cfm-command-substrings" token\="/exec/"] GET 13.234.142.236/dvwa/vulnerabilities/exec/ HTTP "-" "Mozilla/5.0 (Macintosh; Intel Mac OS X 10_14_4) AppleWebKit/537.36 (KHTML, like Gecko) Chrome/73.0.3683.86 Safari/537.36" 182.69.208.134 50910 "-" http://13.234.142.236/dvwa/vulnerabi...ge=include.php 16a01bf34f8-f9a544ae |
| Access Log | <134>1 2019-04-15T15:46:53.460+0530 WAF 2019-04-15 - 15:46:53.460+0530 -0700 WebSite TR 10.1.1.90 80 141.138.107.86 50915 "-" "-" POST HTTPS 202.191.66.53 HTTP/1.0 403 2411 1609 0 22 10.0.2.200 80 0 "-" SERVER DEFAULT PROTECTED VALID /favicon.ico "-" http://www.bing.com/search?q=sumo%20...ox&FORM=IE11SR "-" "Mozilla/5.0 (Windows NT 6.2) AppleWebKit/537.36 (KHTML, like Gecko) Chrome/28.0.1467.0 Safari/537.36" 182.69.208.134 50915 "-" "-" "-" "-" 16a01bf4be9-fca462a6 |
| Audit Log | <13>1 2019-04-16T12:55:10+00:00 ip-10-0-1-200 2019-04-16 - 05:55:10.006 -0700 WAF12 AUDIT sourabh GUI 111.93.54.106 55035 CONFIG 86 config SET user_system_ip Siteminder Session Sync user_system_ip_log "Off" "On" [] |
| Network Firewall Log | <13>1 2019-04-19T06:10:58+00:00 ip-10-0-1-200 2019-04-18 - 23:10:58.647 -0700 WAF12 NF INFO TCP 37.204.127.164 39410 10.0.1.20 22 ALLOW SSH MGMT/LAN/WAN interface traffic:allow |
Sample queries
Sample Query is from Top Clients by Bandwidth panel of the Barracuda WAF - Client Traffic dashboard.
_sourceCategory=Labs/loggen/barracuda " TR "
| parse regex "(?<Unit_Name>[^ ]+) TR(?<Log>.*)"
| split Log delim=' ' extract 4 as Client_Ip, 13 as Bytes_Sent, 2 as Service_Ip, 3 as Service_Port
| round((Bytes_Sent / 1024),2) as Bandwidth
| sum(Bandwidth) as Bandwidth_Consumed_KB by Client_Ip
| sort by Bandwidth_Consumed_KB
| limit 5
Collecting logs for Barracuda WAF app
This section shows you how to configure collection for the Barracuda WAF App to use with the predefined searches and dashboards.
The Barracuda WAF App provides detailed analytics on system, firewall, and network security so you can protect your environment from malicious attacks. Security Analysis dashboards provide insights into the types of attacks, severity, malicious IPs, blocked and allowed content, and attacks by services. Traffic Analysis dashboards provide detailed information on client, server, and service traffic, as well as errors, bandwidth trends, and service performance.
Step 1: Configure a Collector
To create a new Sumo Logic Hosted Collector, perform the steps in Configure a Hosted Collector.
Step 2: Configure a Source
Cloud syslog collection supports Barracuda Firmware version 9.2.1 or later. You must be running Barracuda Firmware version 9.2.1 or greater to use cloud syslog as an export server.
This section shows you how to configure a source for log collection. In this task you specify the Source Category metadata field, which is a fundamental building block for organizing and labeling sources.
To configure a source, do the following:
- Perform the steps in Configure a Cloud Syslog Source. and configure the following Source fields:
- Name. (Required) Enter a name. The description is optional.
- Source Category. (Required) Provide a realistic Source Category for this data type. For example: prod/barracuda/waf. For more information, see Best Practices.
- In the Advanced section, specify the following configurations:
- Enable Timestamp Parsing. True
- Time Zone. Logs are in UTC by default
- Timestamp Format. Auto Detect
- Click Save.
- Copy and paste the token in a secure location. You will need this when you configure Barracuda Cloud Syslog Settings.
Step 3: Configure Logging in Barracuda WAF
This section shows you how to configure logging in Barracuda WAF for use with the preconfigured searches and dashboards of the Sumo Logic App for Barracuda WAF.
To configure logging in Barracuda WAF, do the following:
- Log in to your Barracuda account and go to ADVANCED > Export Logs.
- Go to the Add Export Log Server.
- In the Add Export Log Server window, specify values for the following:
- Name. Enter a name for the SumoLogic service.
- Log Server Type. Select Cloud Syslog Service.
- IP Address or Hostname. Enter the IP address or hostname of the SumoLogic service. For example:
syslog.collection.your_deployment.sumologic.com - Port. Enter the port associated with the IP address of the SumoLogic service. The default Port is 6514.
- Token. Enter the token for Sumo Logic service, such as:
9HFxoa6+lXBmvSM9koPjGzvTaxXDQvJ4POE/ExAMpleTOkenForTAsk3mSEKxPl0Q@41123, where the number41123is the sumo PEN and is included as part of the customer token. - Log Timestamp and Hostname. Click Yes to log the date and time of the event, and the hostname configured in the BASIC > IP Configuration > Domain Configuration section.
- Comment. (Optional) Enter a comment describing the setting.
- Click Add.
- Go to ADVANCED > Export Logs.
- To send all logs to sumologic, in the export log setting, change the settings as shown in the following screenshot.
- Export Log Settings. Every Log should be marked as Enable.
- Export Log Filters. Select the severity as per the Logs that need to send. For example, if set to 5-Notice, then logs with 0-5 are sent to the syslog server i.e, 0-Emergency, 1-Alert, 2-Critical, 3-Error, 4-Warning, 5-Notice
- 0-Emergency: System is unusable (highest priority)
- 1-Alert: Response must be taken immediately
- 2-Critical: Critical conditions
- 3-Error: Error conditions
- 4-Warning: Warning conditions
- 5-Notice: Normal but significant condition
- 6-Information: Informational messages (on ACL configuration changes)
- 7-Debug: Debug level messages (lowest priority)
- Syslog Settings. Keep as default.
- Click Save.
- Go to ADVANCED > Export Logs.
- In the Logs Format tab, make sure every Log format is set to default as the app support Default log formats.
Field Extraction Rules
The following shows field extraction rules for different log formats.
parse regex "(?<Unit_Name>[^ ]+) SYS(?<Log>.*)"
| parse field=log " * * * *" as Module_Name, Log_Level, Event_Id, Log_Details
parse regex "(?<Unit_Name>[^ ]+) WF(?<Log>.*)"
| parse field=Log " * * * * * * * * * * [*] * * * * \"*\" * * * * *" as Severity, Attack_Type, Client_Ip, Client_Port, Service_Ip, Service_Port, Rule, Rule_Type, Action, Follow_Up_Action, Attack_Details, Method, URL, Protocol, Session_Id, User_Agent, Proxy_Ip, Proxy_Port, User, Referrer, UID
parse regex "(?<Unit_Name>[^ ]+) TR(?<Log>.*)"
| parse field=Log " * * * * * * * * * * * * * * * * * * * * * * * * * * * \"*\" * * * * * * *" as Service_Ip, Service_Port, Client_Ip, Client_Port, Login, Cretificate_User, Http_Method, Http_Protocol, Domain, HttpVersion, Response_Code, Bytes_Sent, Bytes_Received, Cache_Hit, Time_Taken, Backend_Server, Backend_Server_Port, Server_Time, Session_Id, Response_Type, Profile_Matched, Protected, WF_Matched, URL, Query_String, Referrer, Cookie, User_Agent, Proxy_ip, Proxy_Port, Authenticated_User, Custom_Header_1, Custom_Header_2, Custom_Header_3, UID
parse regex "(?<Unit_Name>[^ ]+) AUDIT(?<Log>.*)"
| parse field=Log " * * * * * * * * * * * * * *" as Admin_Name, Client_Type, Login_Ip, Login_Port, Transaction_Type, Transaction_Id, Command_Name, Change_Type, Object_Type, Object_Name, Variable_Name, Old_Value, New_Value, Additional_Data
parse regex "(?<Unit_Name>[^ ]+) NF(?<Log>.*)"
| parse field=Log " * * * * * * * * *" as Log_Level, Protocol, Source_Ip, Source_Port, Destination_Ip, Destination_Port, ACL_Policy, ACL_Name, Log_Details
Install the Barracuda WAF app
This section provides instructions for installing the Barracuda WAF App, as well as examples and descriptions for each of the app dashboards.
Now that you have configured log collection for Barracuda WAF, install the Sumo Logic App for Barracuda WAF, and take advantage of predefined Searches and dashboards.
To install the app, do the following:
Next-Gen App: To install or update the app, you must be an account administrator or a user with Manage Apps, Manage Monitors, Manage Fields, Manage Metric Rules, and Manage Collectors capabilities depending upon the different content types part of the app.
- Select App Catalog.
- In the 🔎 Search Apps field, run a search for your desired app, then select it.
- Click Install App.
note
Sometimes this button says Add Integration.
- Click Next in the Setup Data section.
- In the Configure section of your respective app, complete the following fields.
- Field Name. If you already have collectors and sources set up, select the configured metadata field name (eg _sourcecategory) or specify other custom metadata (eg: _collector) along with its metadata Field Value.
- Click Next. You will be redirected to the Preview & Done section.
Post-installation
Once your app is installed, it will appear in your Installed Apps folder, and dashboard panels will start to fill automatically.
Each panel slowly fills with data matching the time range query received since the panel was created. Results will not immediately be available but will be updated with full graphs and charts over time.
Viewing Barracuda WAF dashboards
All dashboards have a set of filters that you can apply to the entire dashboard. Use these filters to drill down and examine the data to a granular level.
- You can change the time range for a dashboard or panel by selecting a predefined interval from a drop-down list, choosing a recently used time range, or specifying custom dates and times. Learn more.
- You can use template variables to drill down and examine the data on a granular level. For more information, see Filtering Dashboards with Template Variables.
- Most Next-Gen apps allow you to provide the scope at the installation time and are comprised of a key (
_sourceCategoryby default) and a default value for this key. Based on your input, the app dashboards will be parameterized with a dashboard variable, allowing you to change the dataset queried by all panels. This eliminates the need to create multiple copies of the same dashboard with different queries.
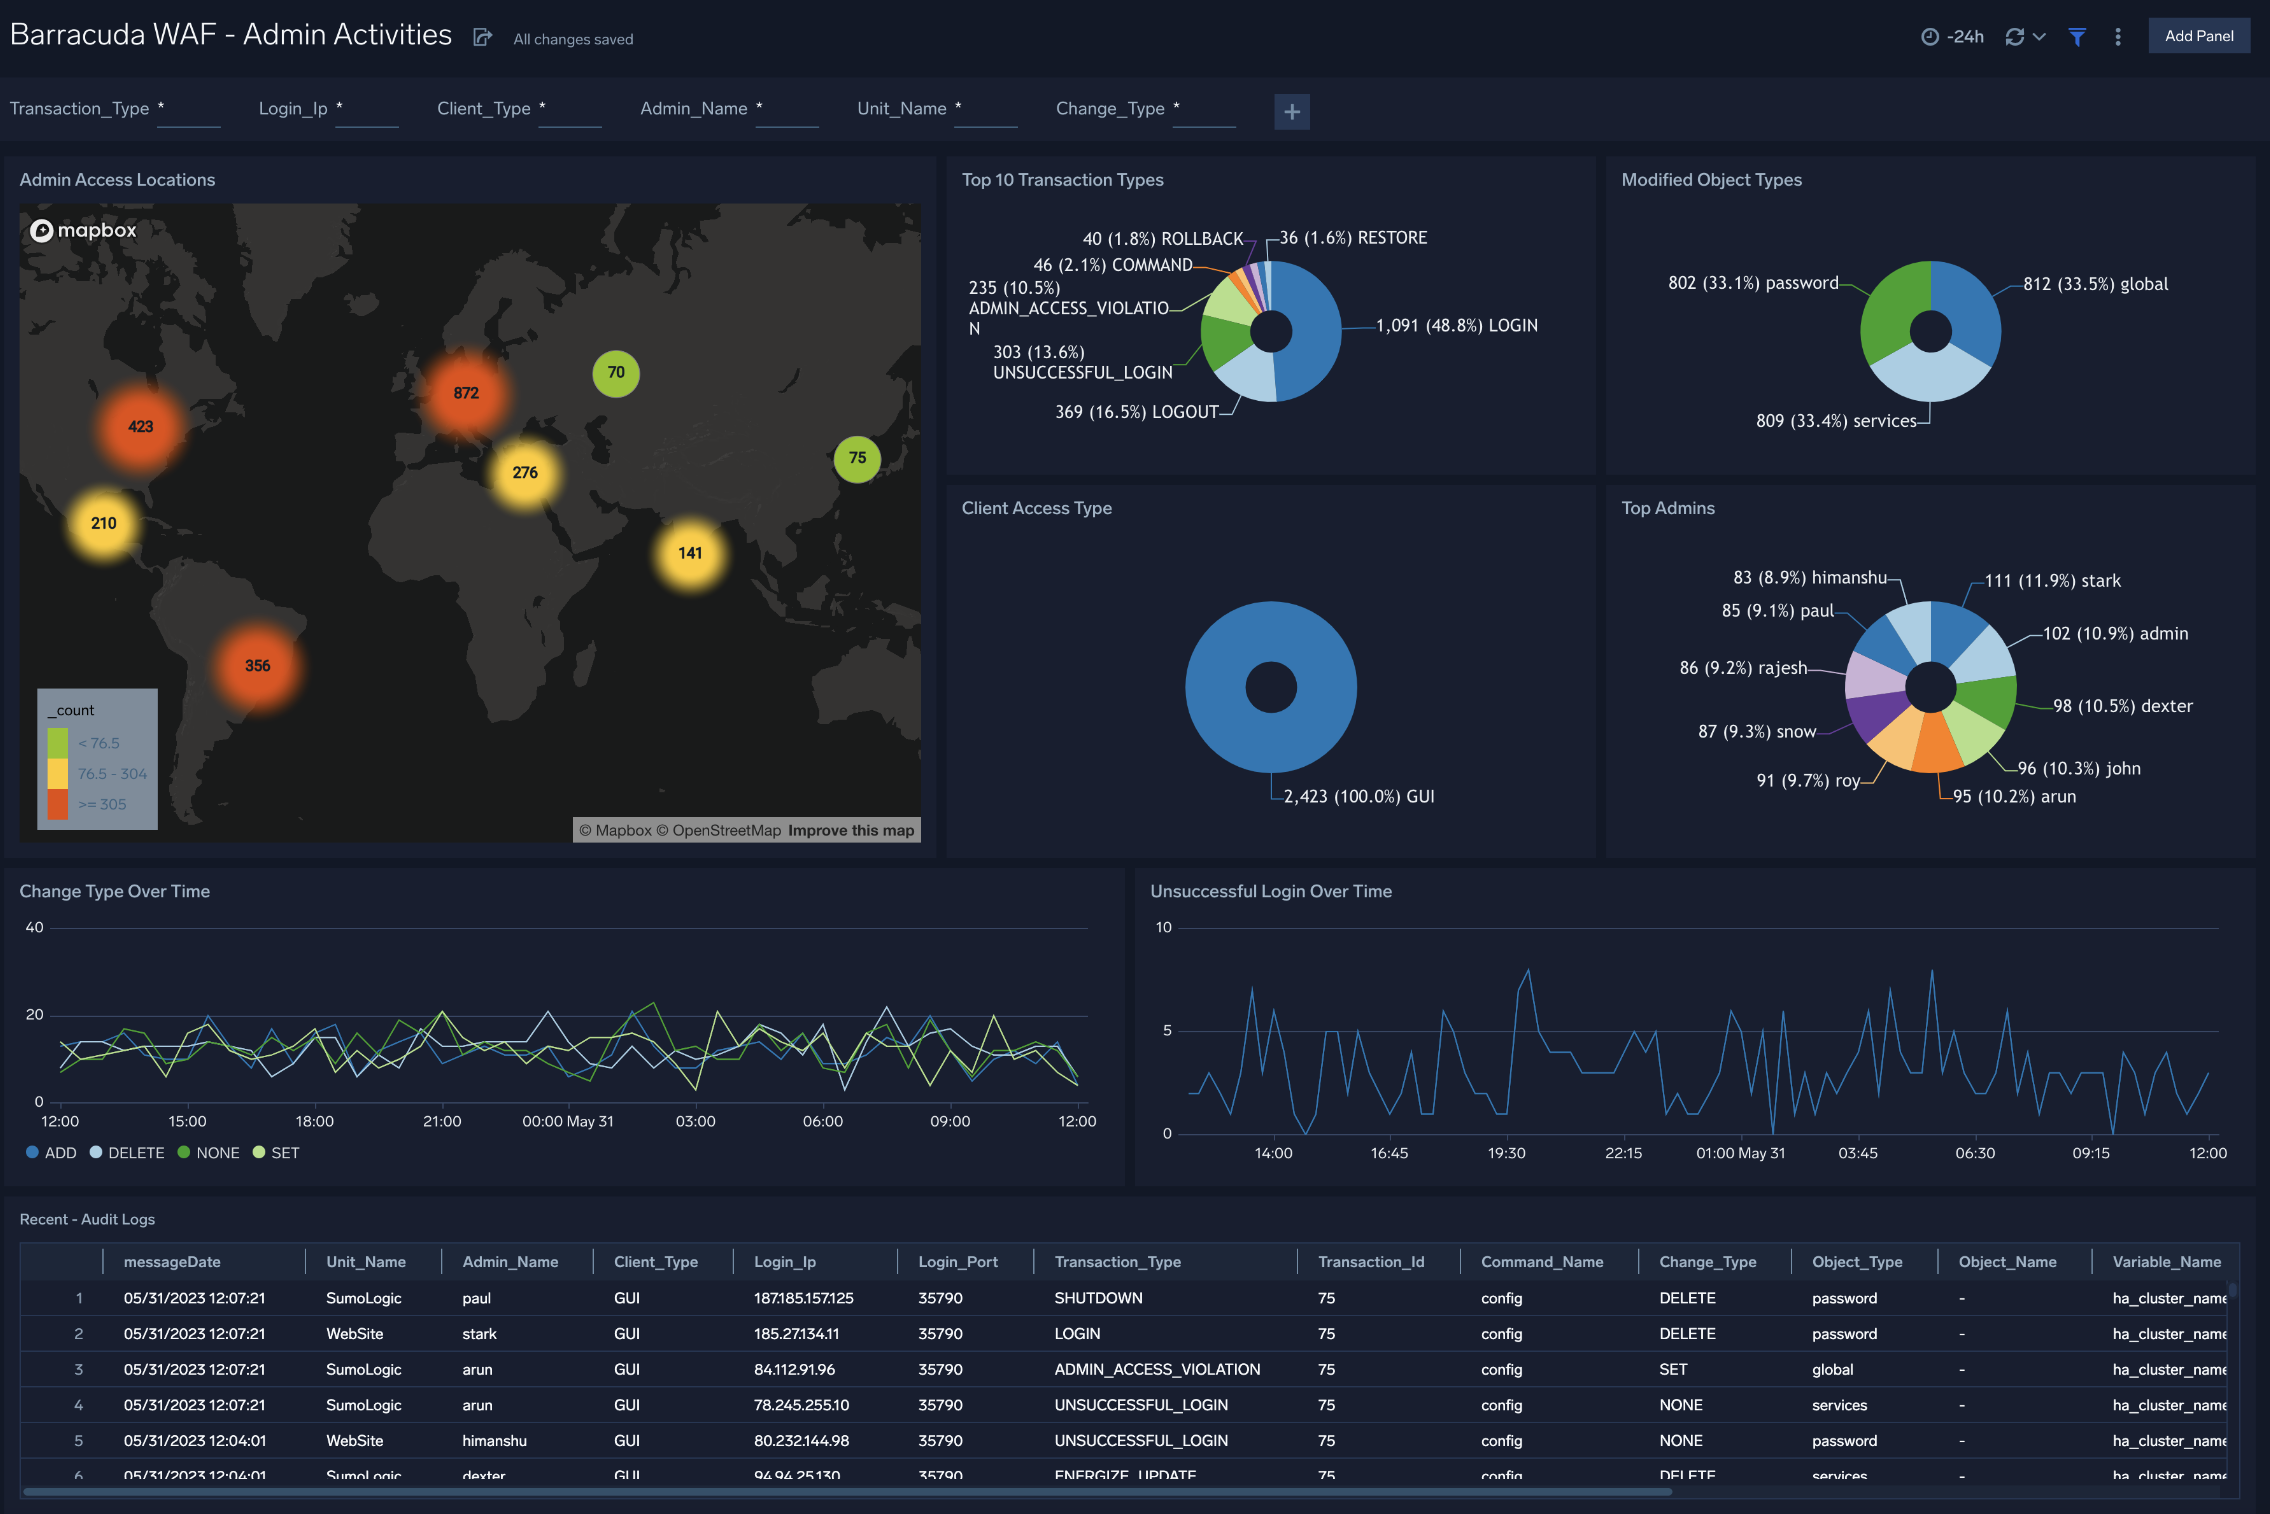
Admin Activities
The Barracuda WAF - Admin Activities dashboard provides insights into all administrative activities performed on the WAF.
Use this dashboard to:
- Make sure admins are accessing WAF units from expected physical locations.
- Monitor admin actions as they relate to transaction types, modified object types, and client access types.
- View trends for unsuccessful logins and change types.
- Drill down into recent audit logs based on search templates.
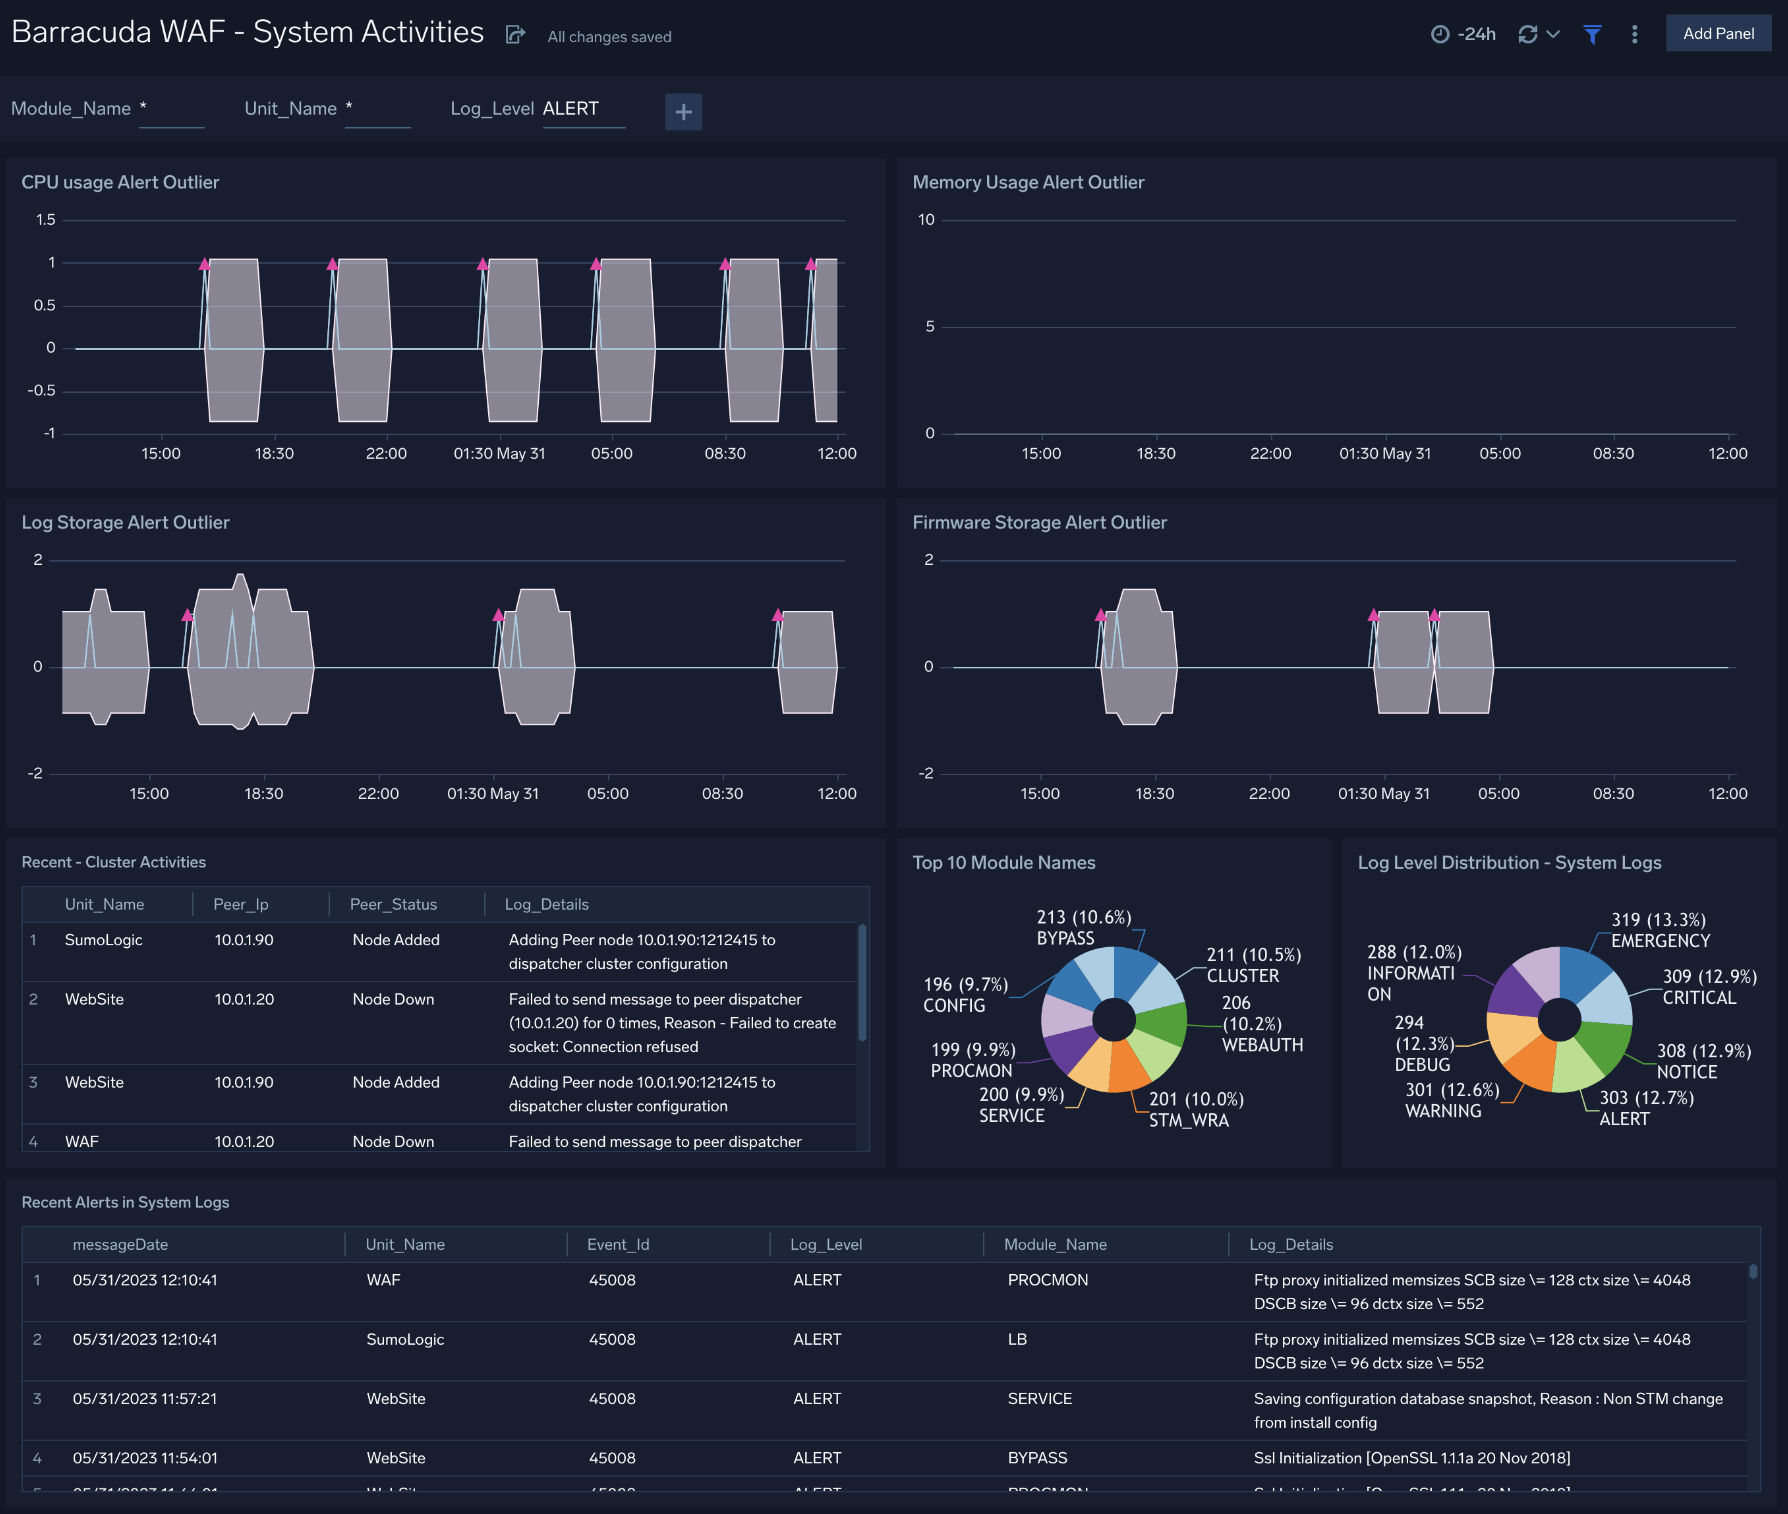
System Activities
The Barracuda WAF - System Activities dashboard provides insights into the performance of WAF units, cluster activities and recent alerts.
Use this dashboard to:
- Review the top modules invoked and monitor log level severity.
- Review recent cluster activities for troubleshooting WAF configuration issues.
- Monitor and take action on recent alerts.
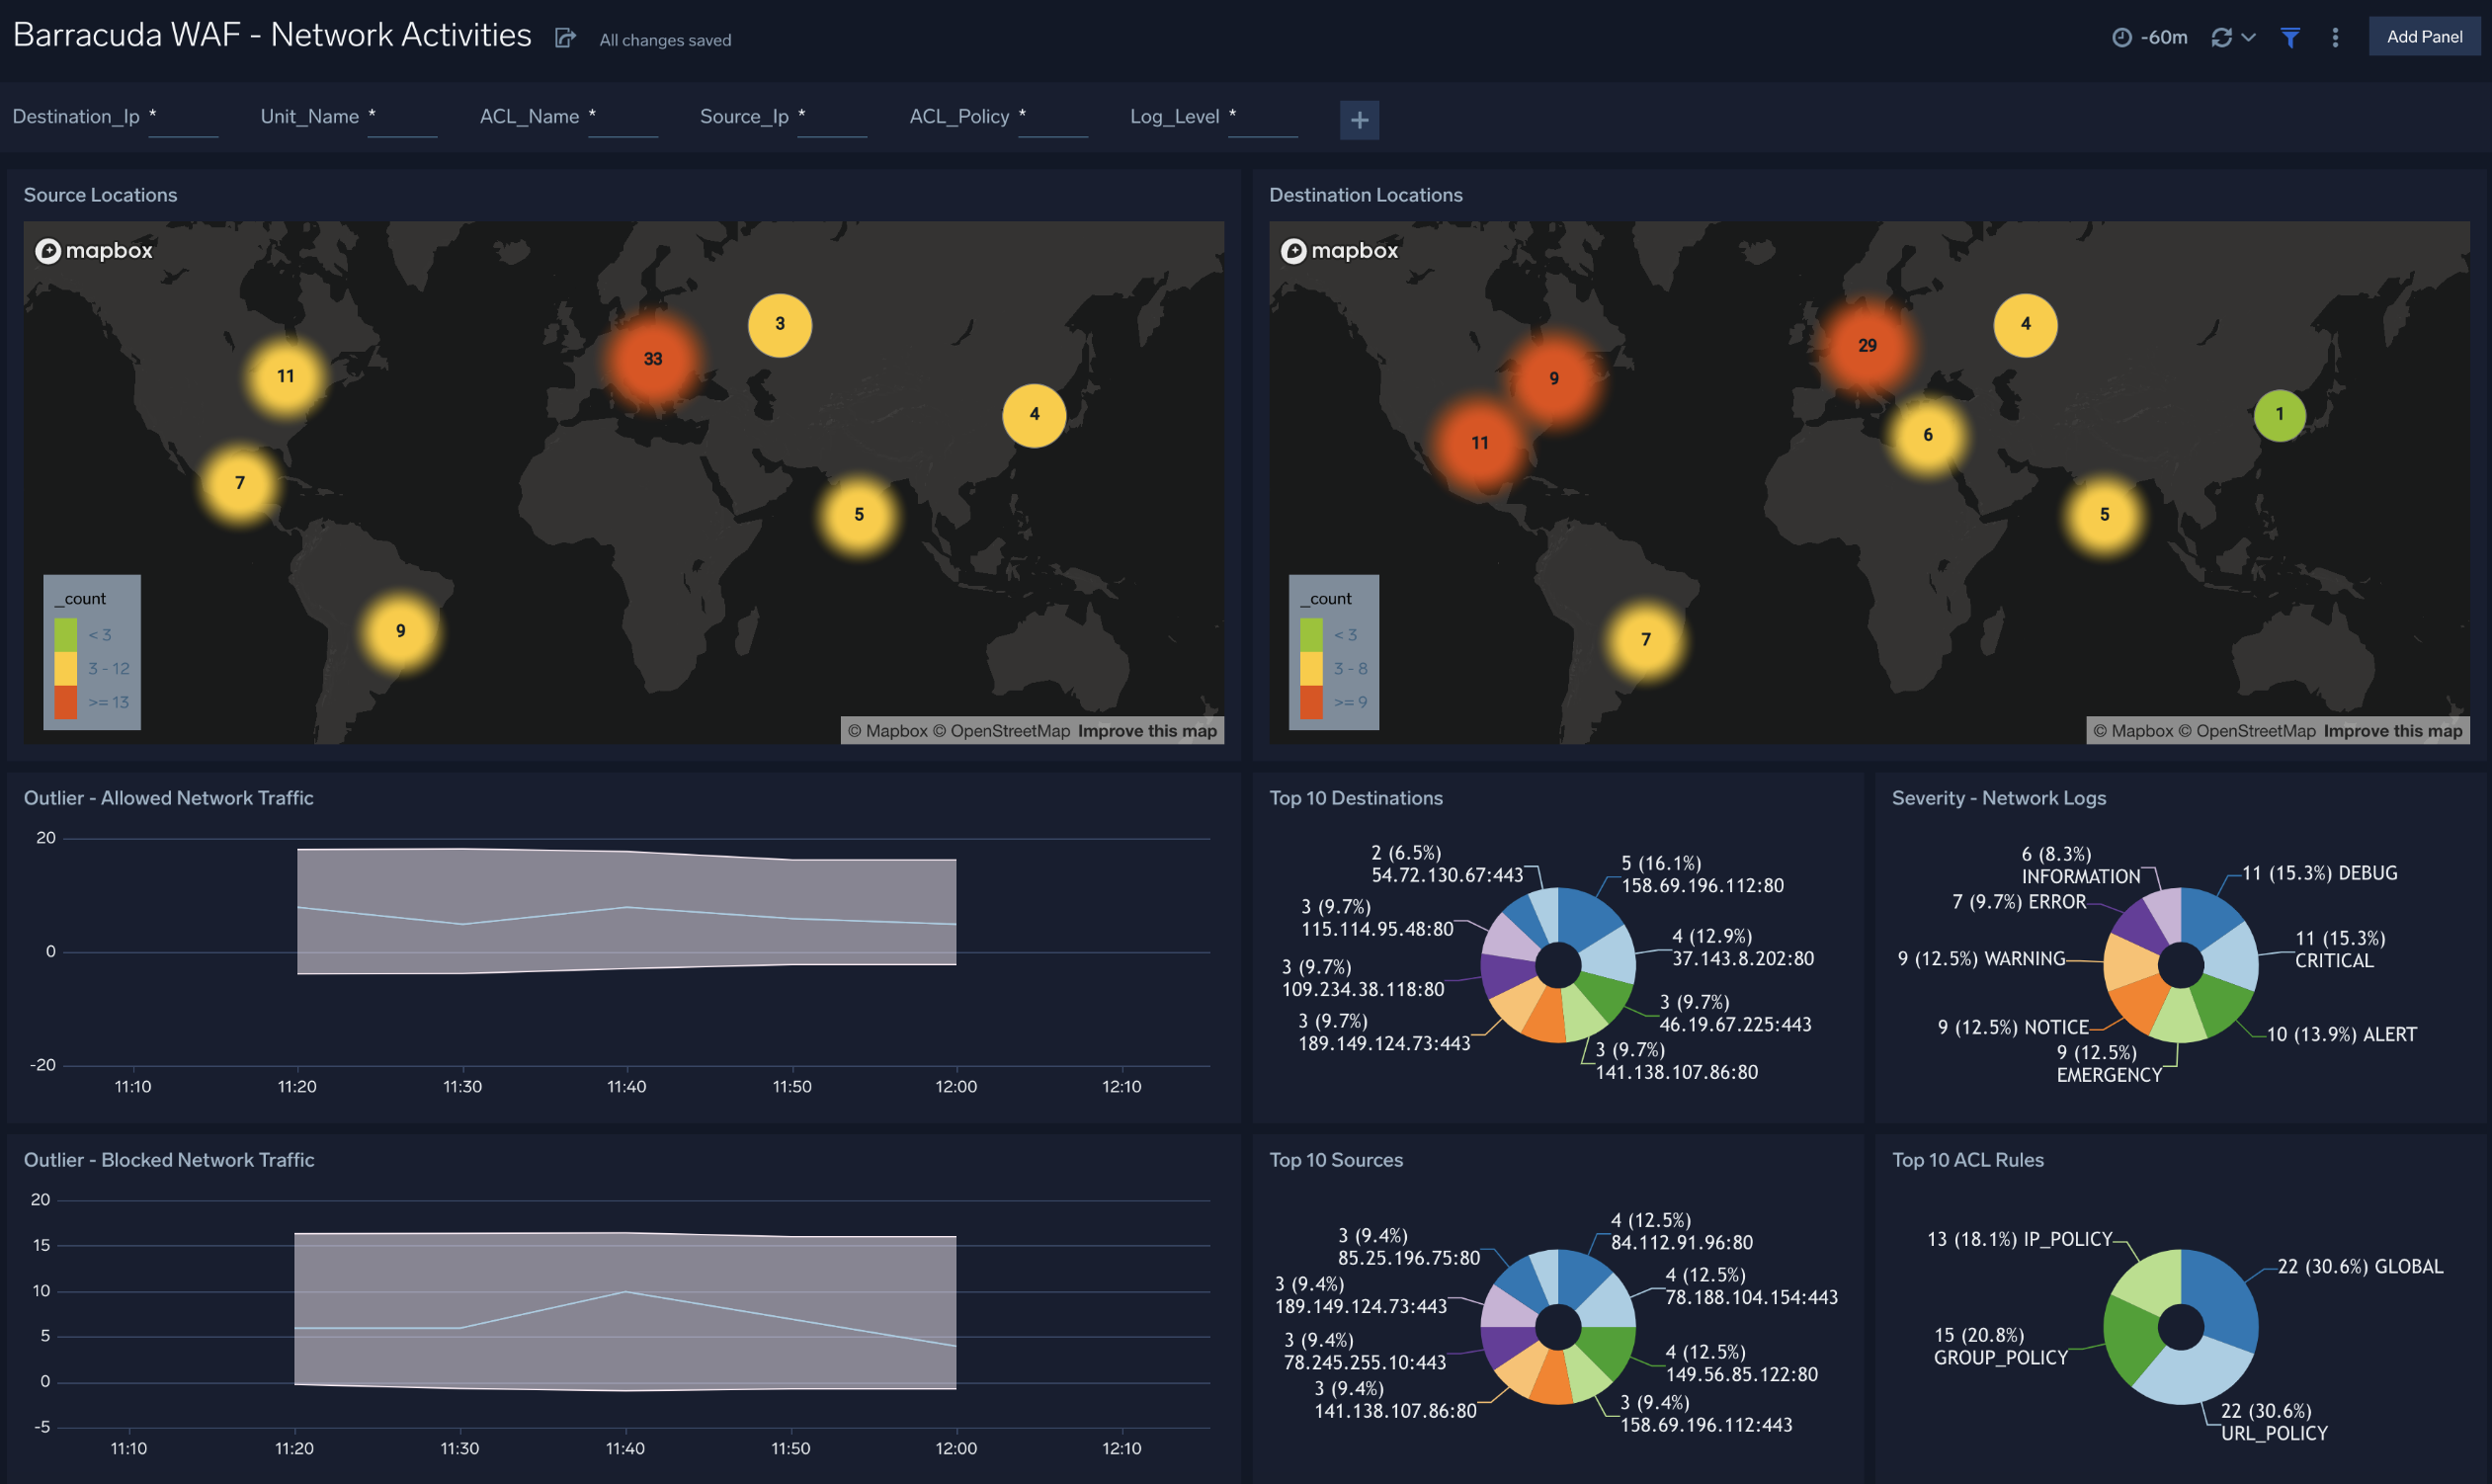
Network Activities
The Barracuda WAF - Network Activities dashboard provides insights into blocked/allowed network traffic, source and destination locations, network log level severity and ACL rules.
Use this dashboard to:
- Monitor source and destination traffic locations.
- Monitor the severity of network log messages and unusual allowed and blocked traffic patterns.
- Monitor the top 10 sources, destinations and ACL rules.
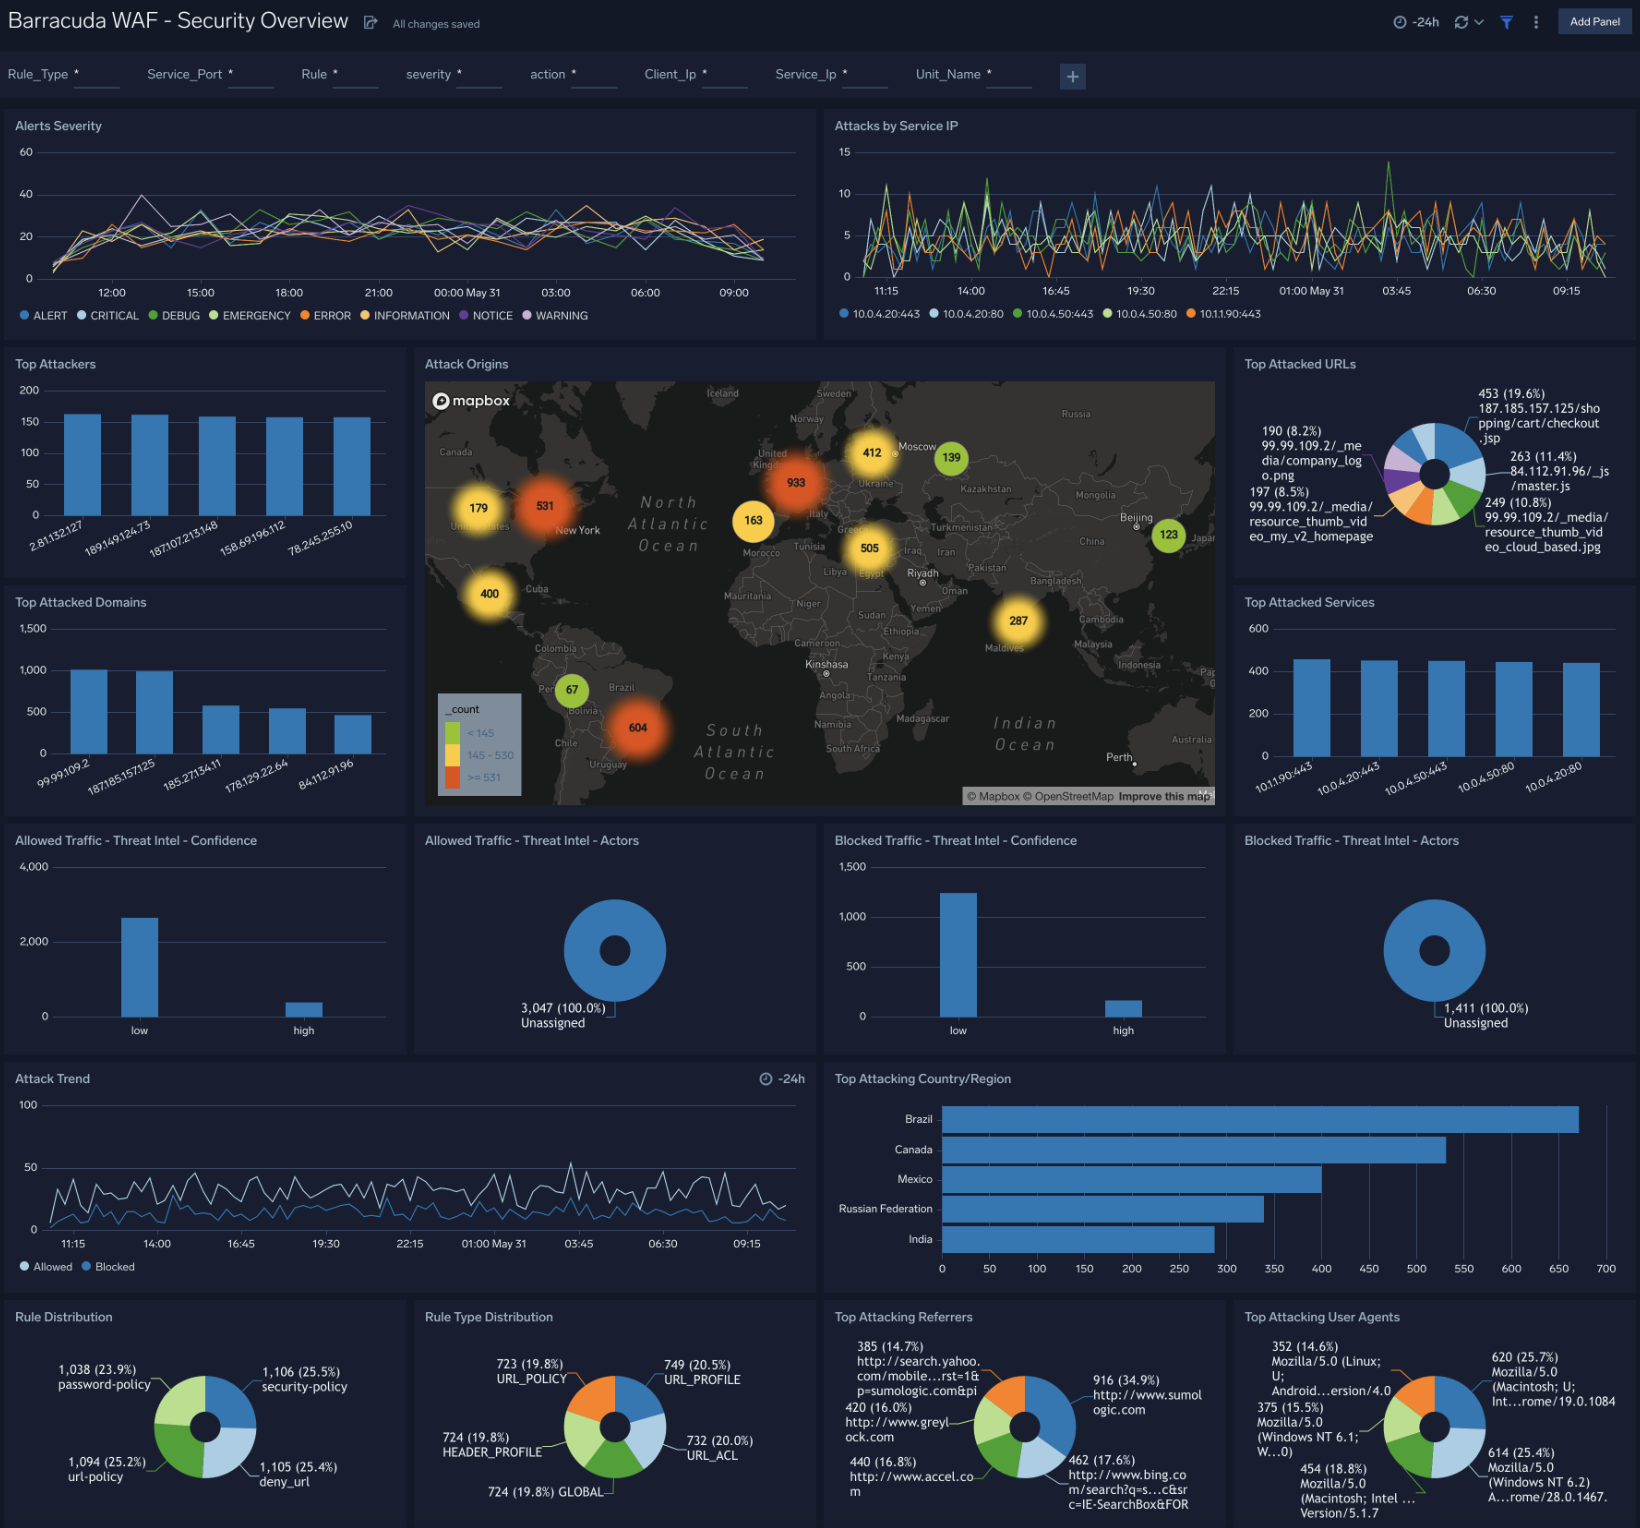
Security Overview
The Barracuda WAF - Security Overview dashboard provides an at-a-glance view of alerts, WAF rules triggered and attacks detected by both Sumo Logic Threat Intel and Barracuda WAF.
Use this dashboard to:
- Get a high-level overview of your WAF security posture by understanding attack vectors and trends and rules triggered.
- Determine which attack types, sources, and WAF rules that need further investigation.
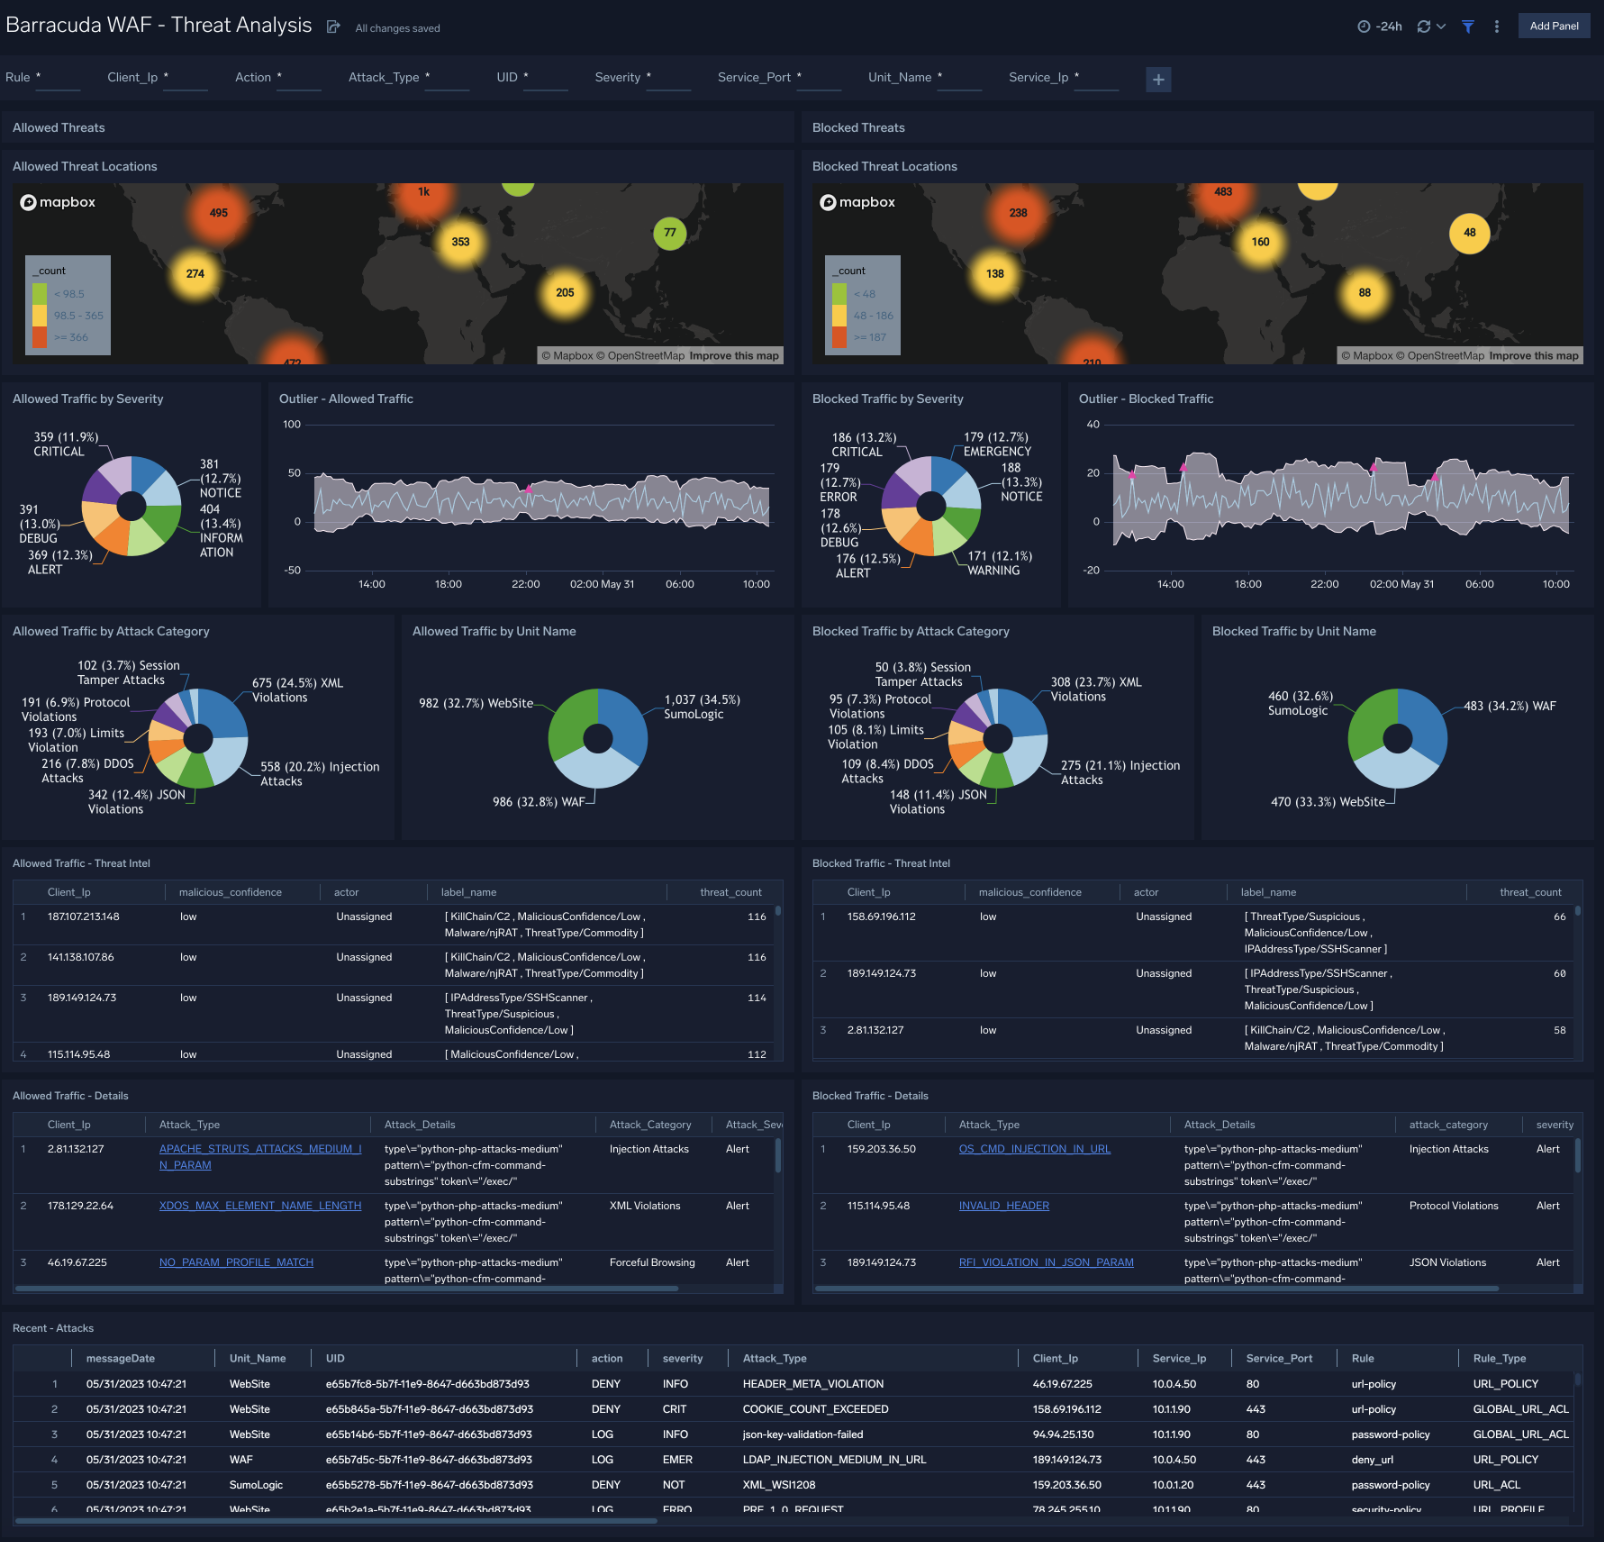
Threat Analysis
The Barracuda WAF - Threat Analysis dashboard provides detailed insights into attacks and rules triggered on the Barracuda WAF.
Use this dashboard to:
- Monitor threats allowed through the WAF and those blocked by the WAF.
- Investigate details of attacks detected by both the WAF and Sumo Logic Threat Intel.
- Fine tune the WAF to prevent future attacks and eliminate false positives.
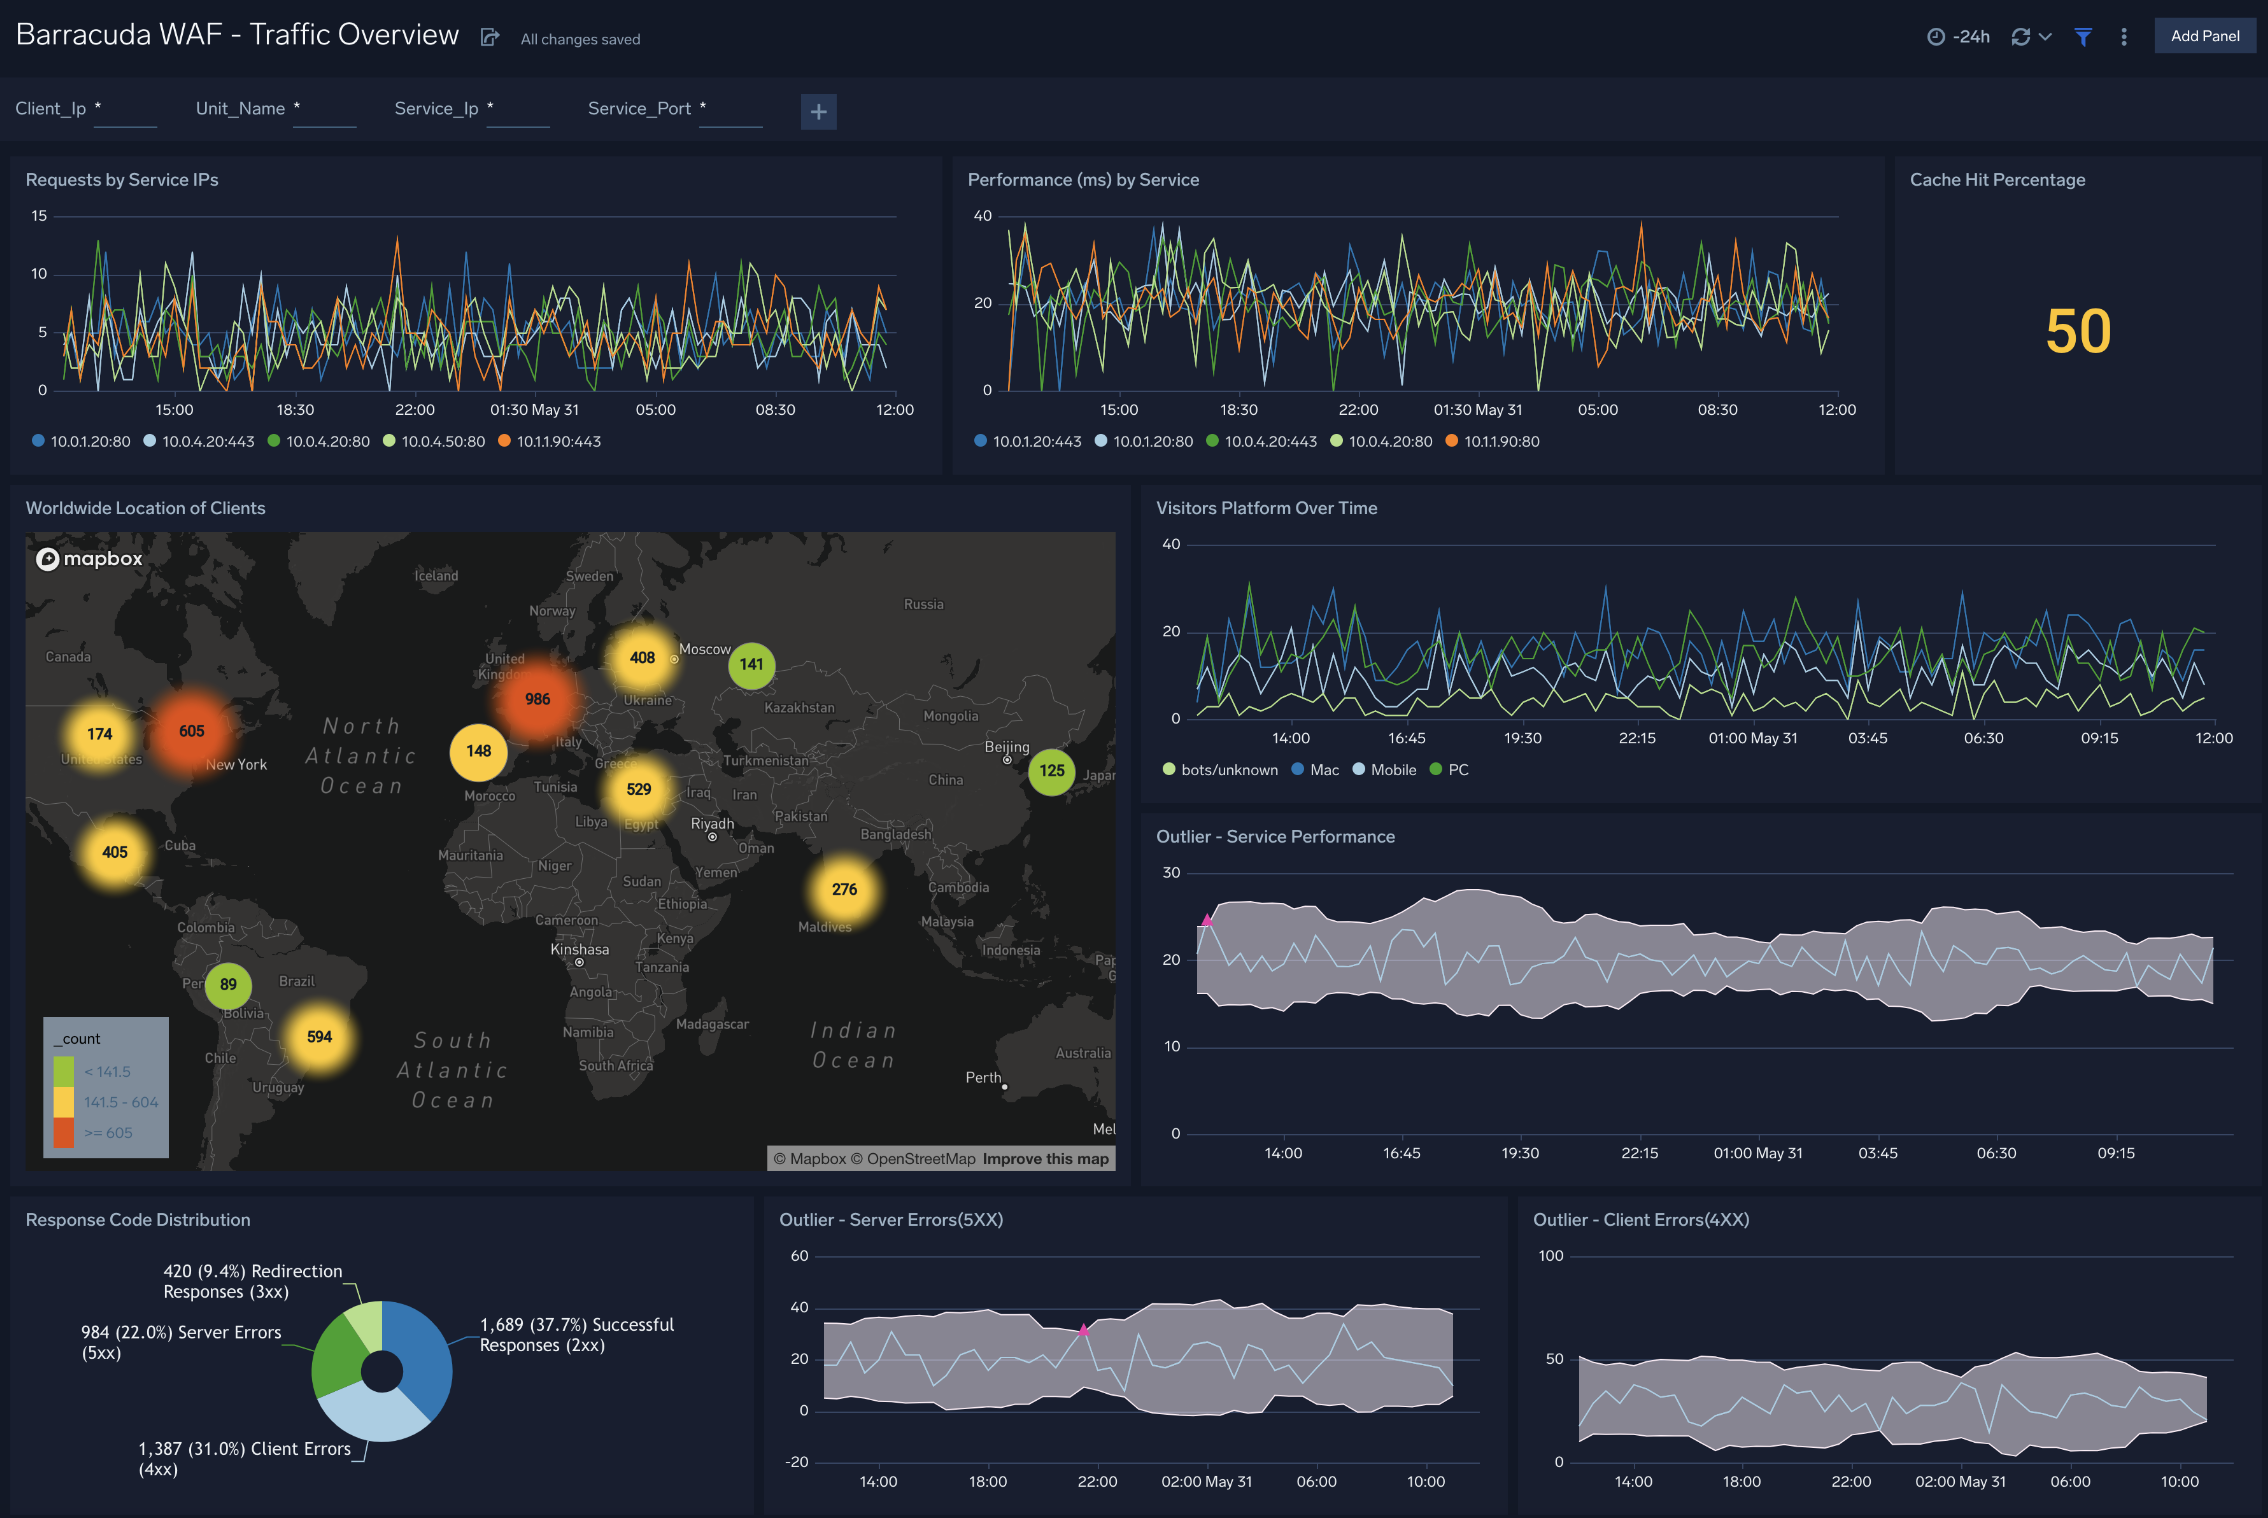
Traffic Overview
The Barracuda WAF - Traffic Overview dashboard provides an at-a-glance view of client geographic locations, performance, cache hit percentage, and unusual behaviors across the number of incoming requests and performance.
Use this dashboard to:
- Monitor requests and performance across services.
- Investigate how to improve performance via cache hit rates.
- Analyze trends for requests and performance by Service IP.
- Monitor client locations.
- Monitor unusual patterns of client/server errors and service performance.
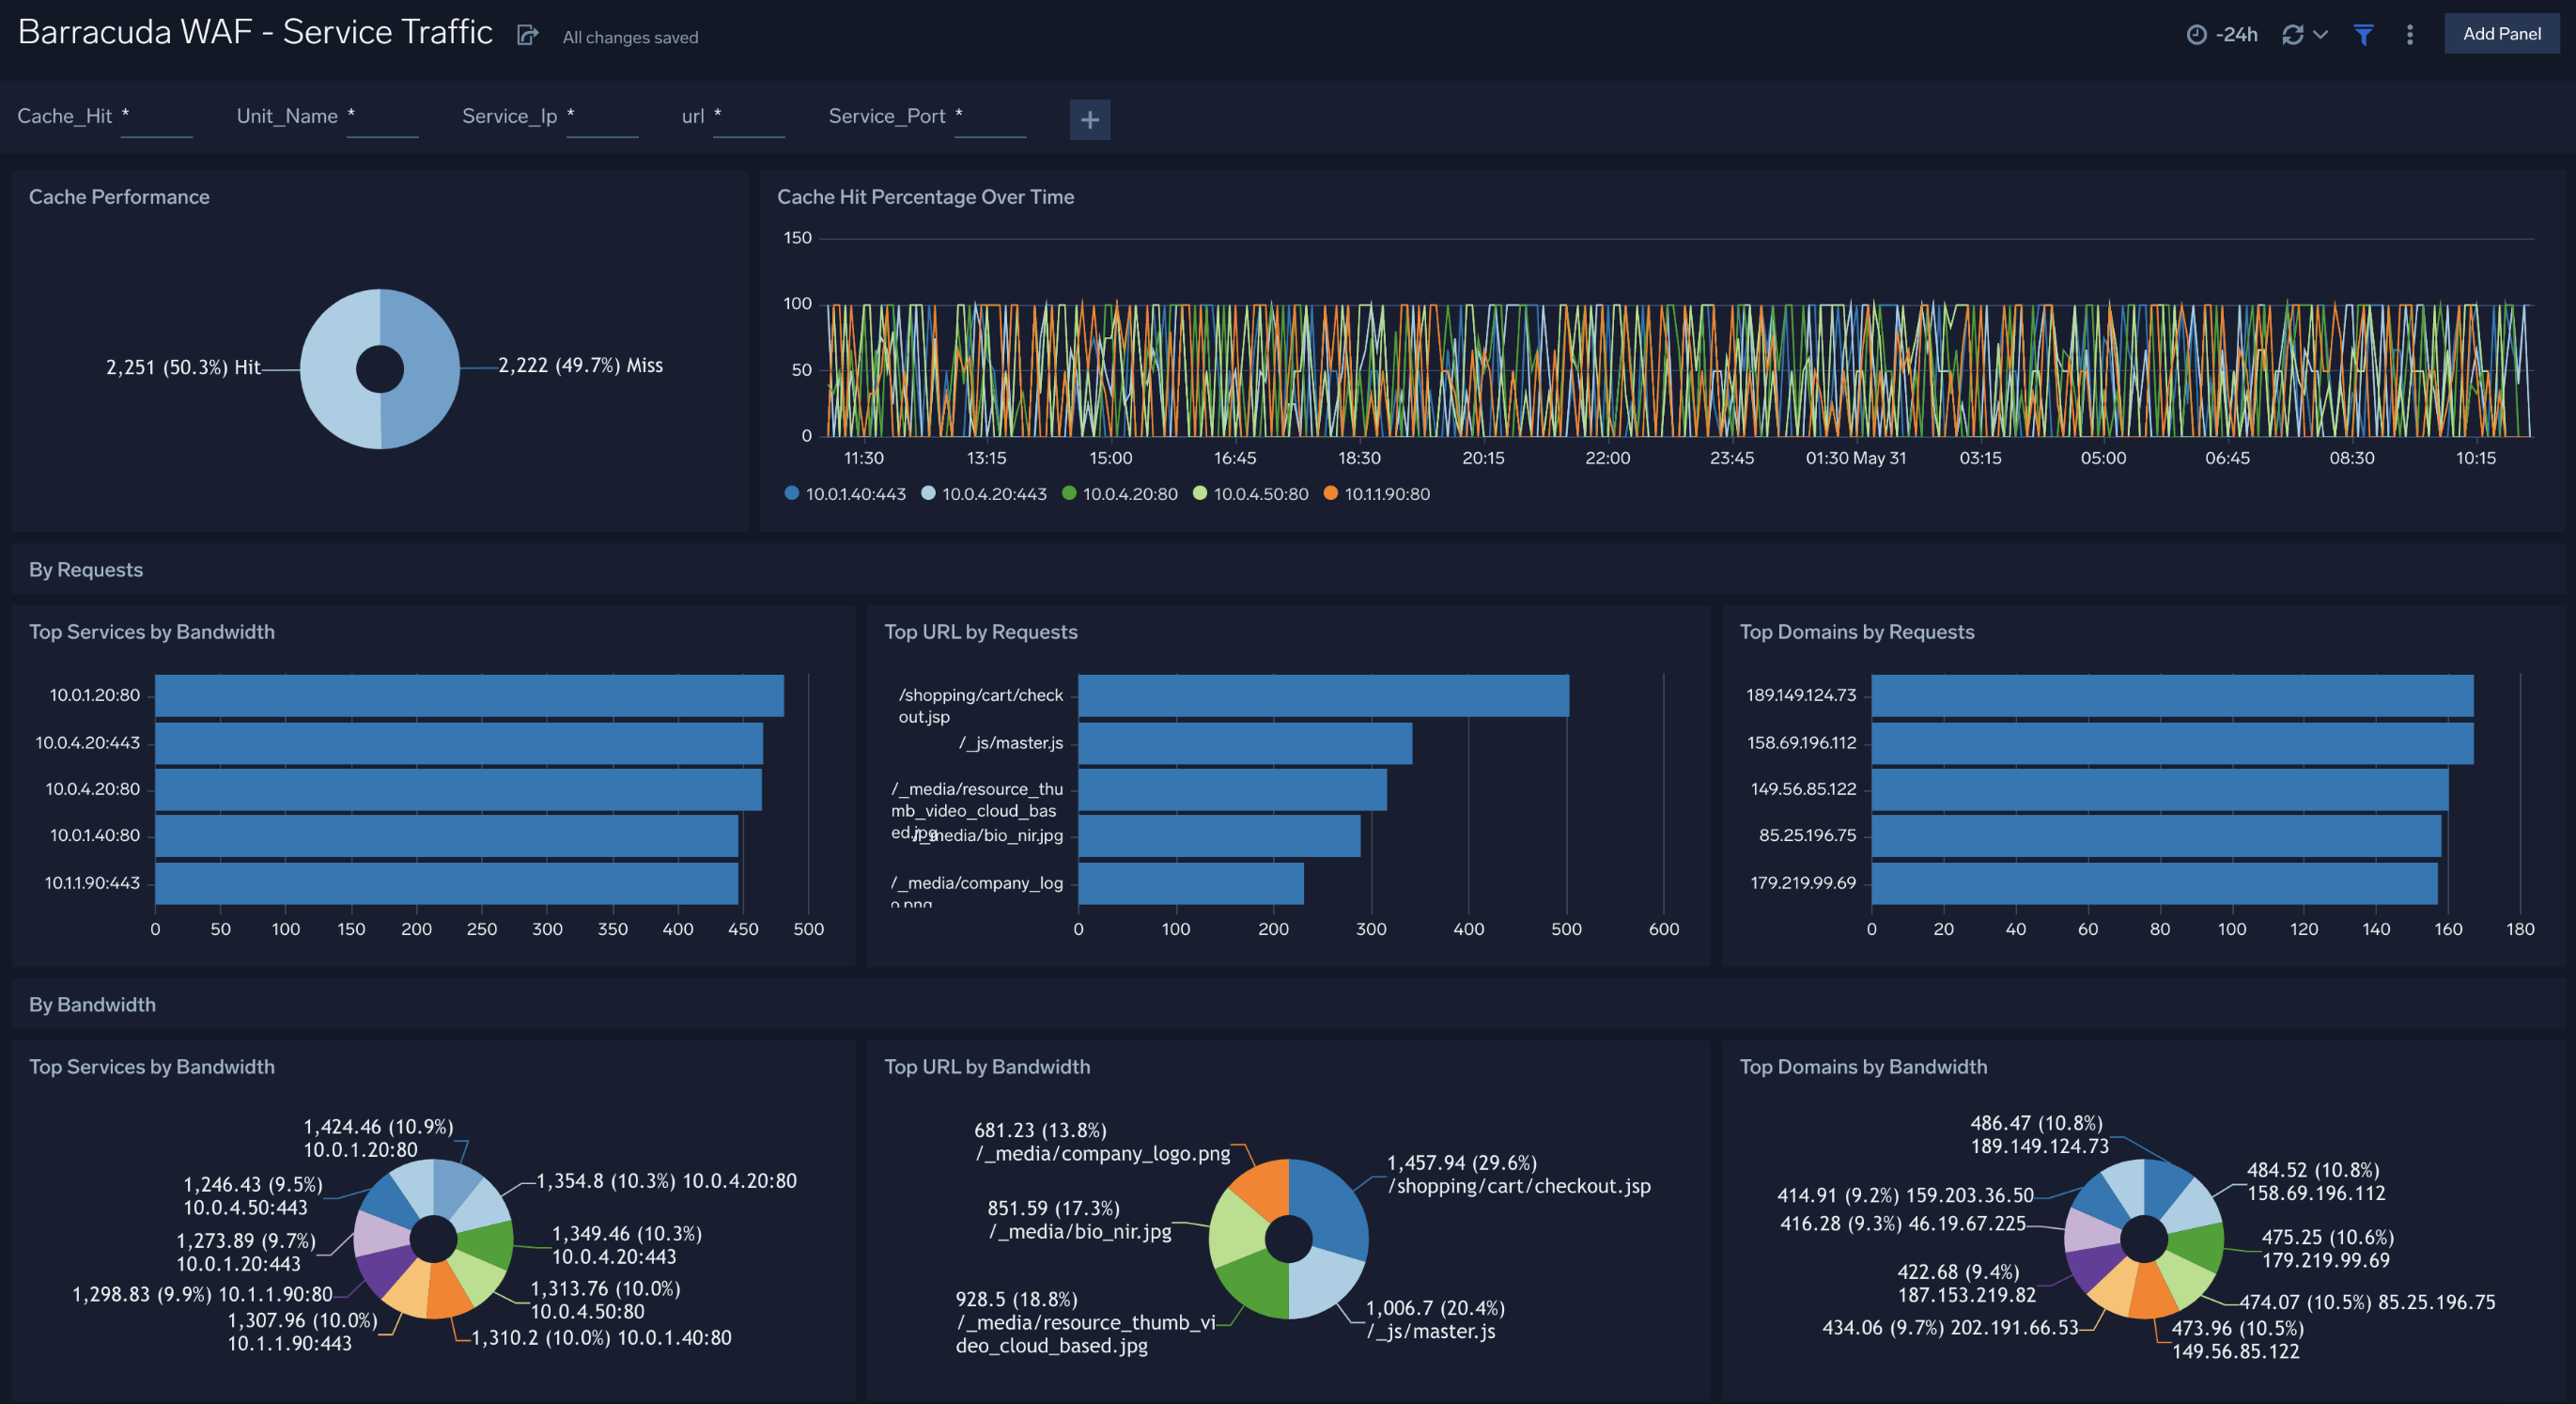
Service Traffic
The Barracuda WAF - Service Traffic dashboard provides provides detailed insight into cache hit performance, request traffic and bandwidth.
Use this dashboard to:
- Monitor trends for cache performance trends.
- Monitor top services, URLs, and domains by both number of requests and bandwidth.
- Improve performance by fine-tuning the cache and other WAF configurations.
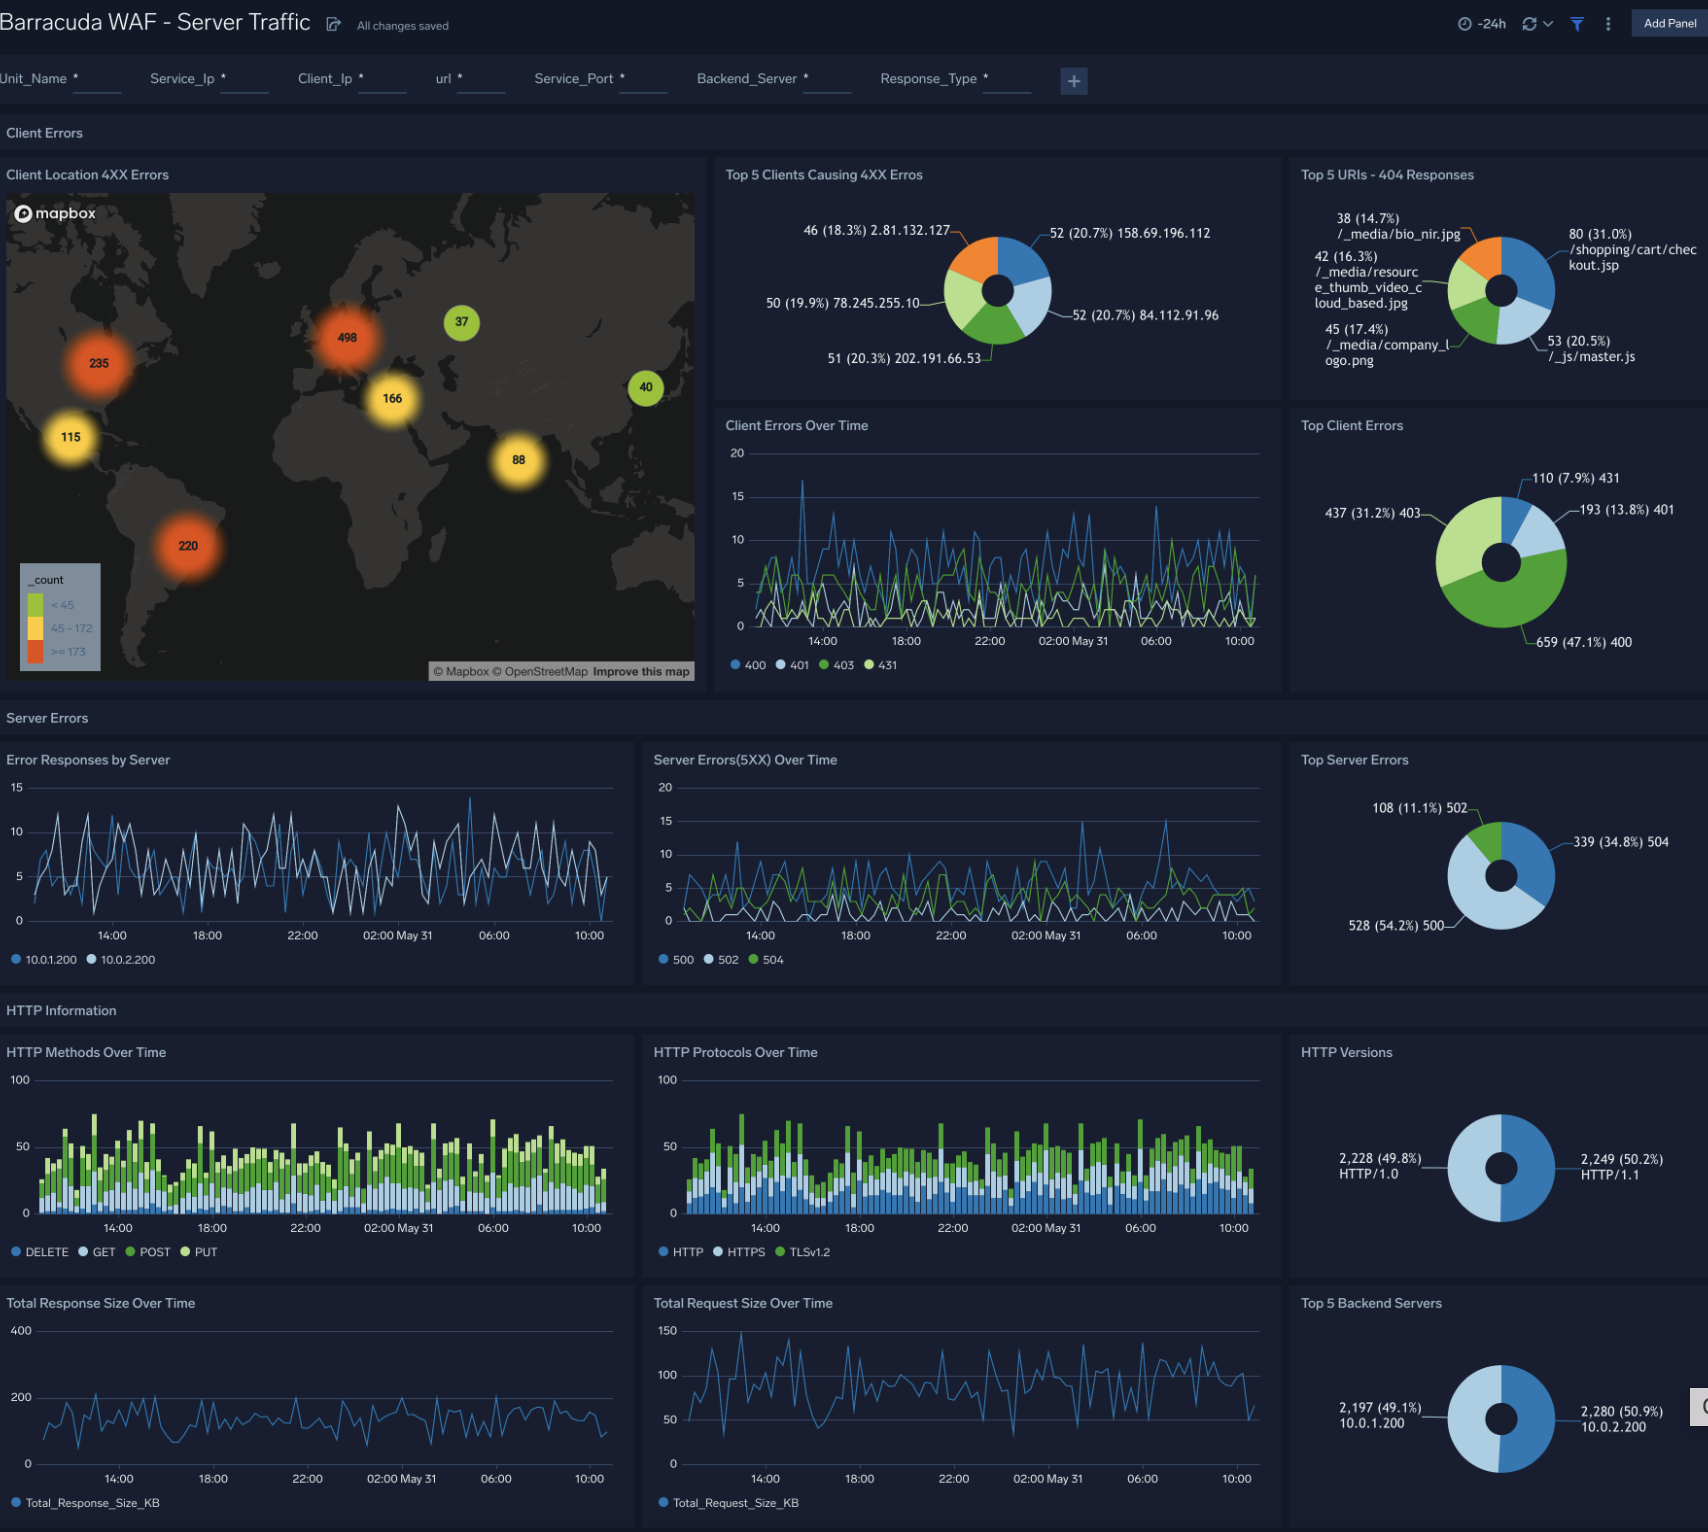
Server Traffic
The Barracuda WAF - Server Traffic dashboard provides a detailed information on server traffic, such as client and server errors, and HTTP request and response information. The dashboard is divided into three parts so you can compare client errors, server errors, and HTTP protocol information.
Use this dashboard to:
- Identify trends across client/server errors, requests and responses.
- Identify which clients and servers are responsible for the most errors and use this information to change the WAF configuration.
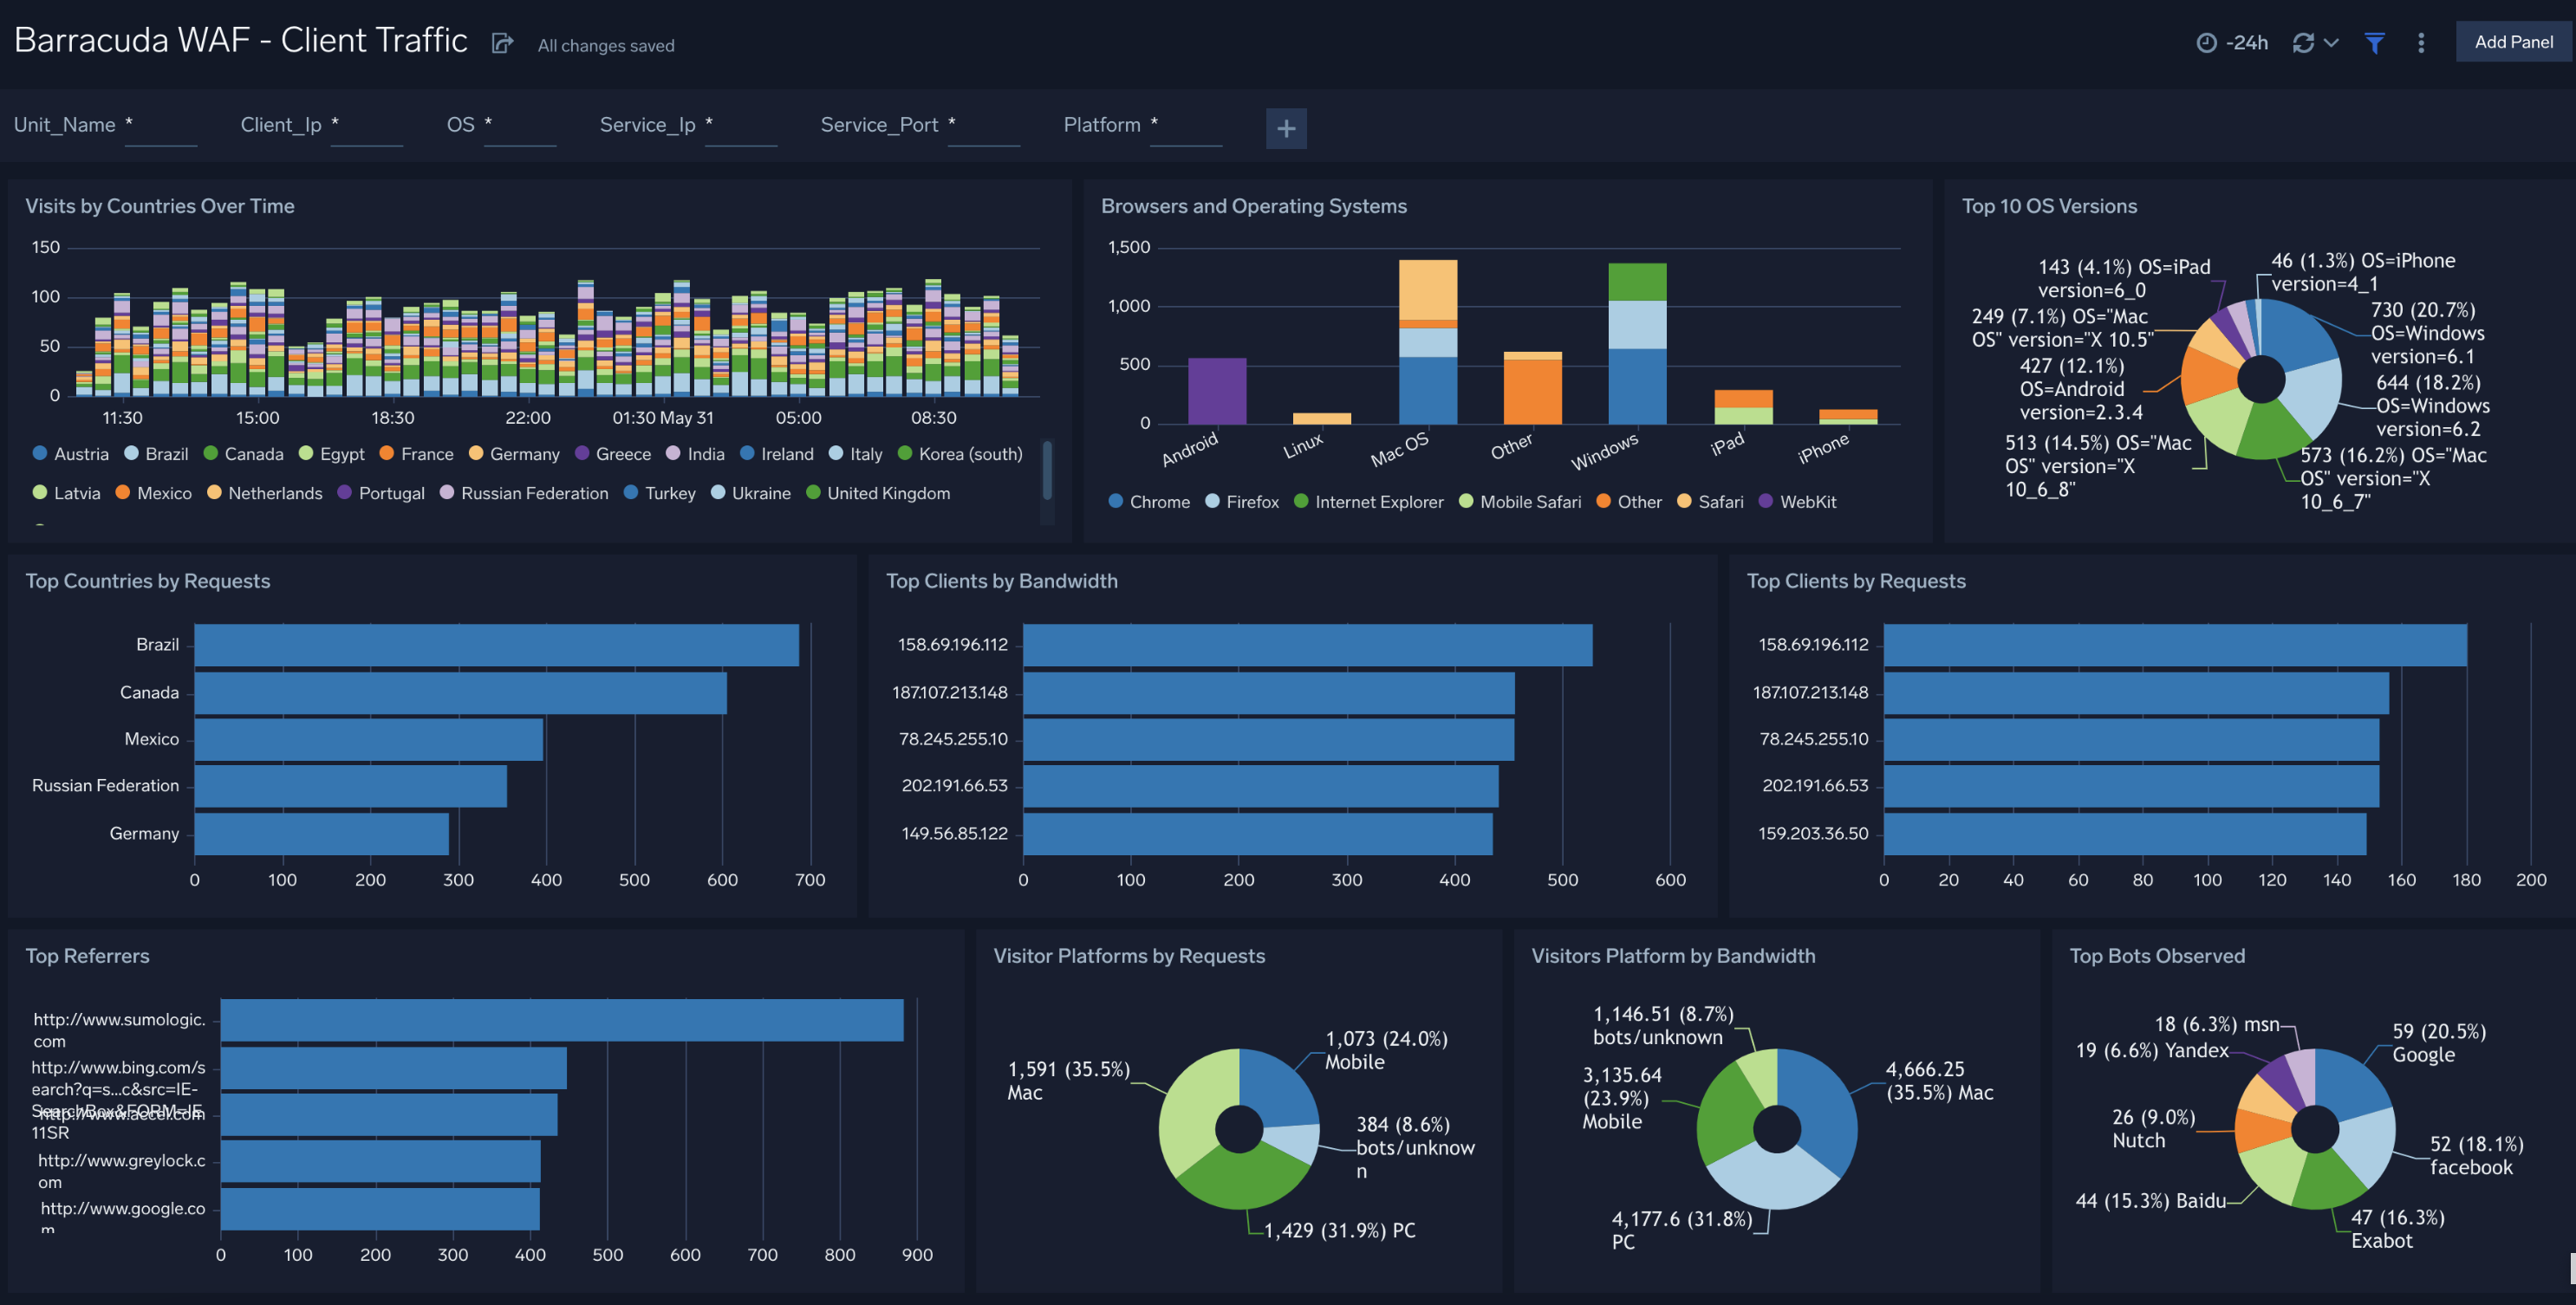
Client Traffic
The Barracuda WAF - Client Traffic dashboard provides detailed information on clients, such as visits by country, user agent, platform, operating system (OS), devices, and top referrers.
Use this dashboard to:
- Monitor incoming web traffic metrics to understand client geographical locations, browsers, and operating systems.
- Determine top clients accessing your web applications and optimize WAF configurations as needed.
Upgrade/Downgrade the Barracuda WAF app (Optional)
To update the app, do the following:
Next-Gen App: To install or update the app, you must be an account administrator or a user with Manage Apps, Manage Monitors, Manage Fields, Manage Metric Rules, and Manage Collectors capabilities depending upon the different content types part of the app.
- Select App Catalog.
- In the Search Apps field, search for and then select your app.
Optionally, you can identify apps that can be upgraded in the Upgrade available section. - To upgrade the app, select Upgrade from the Manage dropdown.
- If the upgrade does not have any configuration or property changes, you will be redirected to the Preview & Done section.
- If the upgrade has any configuration or property changes, you will be redirected to the Setup Data page.
- In the Configure section of your respective app, complete the following fields.
- Field Name. If you already have collectors and sources set up, select the configured metadata field name (eg _sourcecategory) or specify other custom metadata (eg: _collector) along with its metadata Field Value.
- Click Next. You will be redirected to the Preview & Done section.
Post-update
Your upgraded app will be installed in the Installed Apps folder and dashboard panels will start to fill automatically.
See our Release Notes changelog for new updates in the app.
To revert the app to a previous version, do the following:
- Select App Catalog.
- In the Search Apps field, search for and then select your app.
- To version down the app, select Revert to < previous version of your app > from the Manage dropdown.
Uninstalling the Barracuda WAF app (Optional)
To uninstall the app, do the following:
- Select App Catalog.
- In the 🔎 Search Apps field, run a search for your desired app, then select it.
- Click Uninstall.