Cisco Meraki

The Cisco Meraki app provides a single-pane-of-glass for monitoring and troubleshooting network security, end-to-end performance, switch port management, and device management of your Cisco Meraki wireless infrastructure management platform.
Log types
The Cisco Meraki app is dependent on the following logs:
- flows
- urls
- events
- security_events
- air_marshal_events
For more information on log types, see these topics in Cisco Meraki documentation:
- Event Types and Log Samples
- MS Event Log Entries and Definitions
- Navigating the Event Logs
- Syslog Server Overview and Configuration
Sample log messages
<134>1 1563249630.774247467 remote_DC1_appliance security_event ids_alerted signature=1:41944:2 priority=1 timestamp=TIMESTAMPEPOCH.647461
dhost=74:86:7A:D9:D7:AA direction=ingress protocol=tcp/ip src=23.6.199.123:80 dst=10.1.10.51:56938 message: BROWSER-IE
Microsoft Edge scripting engine security bypass css attempt
2019-07-16 04:00:30 Local0.Info 172.40.20.177 1 1561036264.565291108 australia_sydney security_event security_filtering_file_scanned
url=http://tlu123.dl123.delivery.mp.microsoft.com/filestreamingservice/files/36ec4eb7-46dd-4aeb-990e-b6d32f7ed567?P1=1561036860&
P2=402&P3=2&P4=Zj3qRDR5CbzfWlP8BuYg%2bUlTon0XE774ExEEquiawstLAJ2%2bQm3OoWLcwz3HBt8qp3r3buVRVoT5BQcUCcNlXw%3d%3d src=172.16.10.98:64160
dst=200.188.210.42:180 mac=20:1C:BC:B2:0F:20 name='' sha256=093e4fc218b27e58e2fede7b8cb044d48d66995ae785bbc186a9df5ae08ca4f7
disposition=malicious action=block
<134>1 1563249910.949155659 AP_firstfloor urls src=10.1.10.113:54877 dst=10.1.10.209:1400 mac=13:0C:AC:B2:0F:11
agent='Spotify/110600113 OSX/0 (MacBookAir7,2)' request: GET http://10.1.10.209:1400/spotifyzc?action=getInfo

<134>1 1563261310.844330465 india_headoffice1 urls src=10.1.10.133:49305 dst=172.200.0.42:443 mac=13:0C:AC:B2:0F:11
request: UNKNOWN https://appswaldo-pa.clients6.google.com/...
<134>1 1563246850.048798929 Head_office_Appliance flows allow src=192.168.254.135 dst=192.168.254.7 mac=E8:E8:B7:35:4A:C2
protocol=udp sport=33787 dport=35

<134>1 1563262452.817053535 Reception_Bad_ flows deny src=10.20.41.19 dst=192.168.0.219 mac=19:EC:C5:7A:B2:2D protocol=tcp
sport=61822 dport=8080
<134>1 1563262058.692773343 AP_secondfloor airmarshal_events type=ssid_spoofing_detected ssid='Sumo-Guest' vap='10'
bssid='9A:69:66:99:66:9A' src='64:92:49:26:99:64' dst='00:00:48:04:00:1F' channel='36' rssi='32' fc_type='0' fc_subtype='8'

<134>1 1563260410.364008273 AP_firstfloor airmarshal_events type=rogue_ssid_detected ssid='Library' bssid='B2:60:F1:71:81:FD'
src='B2:60:F1:71:81:FD' dst='FF:FF:FF:FF:FF:FF' wired_mac='90:60:FF:71:81:FD' vlan_id='0' channel='2' rssi='55' fc_type='0'
fc_subtype='8'
2019-07-16 05:00:10 Local0.Info 172.33.222.111 1 1563253210.652261509 Head_office_Appliance events type=vpn_registry_change
vpn_type='site-to-site' connectivity='true'

2019-07-16 05:00:10 Local0.Info 172.33.222.111 1 1563253210.025977456 main_branch_appliance events type=vpn_connectivity_change
vpn_type='site-to-site' peer_contact='108.176.1.238:57357' peer_ident='449bc8f664862e11df74de400df333df' connectivity='false'

2019-07-16 07:27:37 Local0.Info 172.33.222.111 1 1563262057.262021278 HQ_Switch1 events Power supply Q2AS-95FW-7776 was inserted
into slot 1
Sample queries
The following query is from the High Severity Threats panel of the Cisco Meraki - Overview dashboard.
_sourceCategory=*meraki* "security_event"
| parse regex " (?<name>\S*?)\s(?<msg_type>urls|flows|events|ids-alerts|security_event|airmarshal_events?)\s+"
| parse "security_event * signature=* priority=* timestamp=* dhost=* direction=* protocol=* src=*:* dst=*:* message: *" as type, signature, priority, timestamp, dhost, direction, protocol, src_ip, src_port, dest_ip, dest_port, msg nodrop
| parse "security_event * name='*' sha256=* disposition=* action=*" as type, name2, sha256, disposition, action nodrop
| parse "security_event * url=* src=*:* dst=*:* mac=* name='*' sha256=* disposition=* action=*" as type, url, src_ip, src_port, dest_ip, dest_port, mac, name2, sha256, disposition, action nodrop
| where priority="1" and msg_type="security_event"
| if (priority="1", "High", if (priority="2", "medium", if (priority="3", "Low", if (priority="4", "Very Low", priority)))) as priority
| count as threatCount
Collecting logs for the Cisco Meraki app
This section provides instructions for configuring log collection for the Cisco Meraki app, as well as log and query examples.
Configure Log Collection
In this task, you configure an installed collector with a Syslog source that acts as a Syslog server to receive logs and events from Cisco Meraki.
- Configure an Installed Collector.
- Add a Syslog source to the installed collector:
- Name. (Required) A name is required.
- Description. Optional.
- Protocol. UDP or TCP. Choose the protocol you configured in Cisco Meraki for Syslog forwarding.
- Port. Port number. Choose the port you configured in Cisco Meraki for Syslog forwarding.
- Source Category. (Required) Provide a realistic Source Category for this data type. For example: prod/ciscomeraki. For more information, see Best Practices.
- Click Save.
Configure Log Forwarding
On the Cisco Meraki platform, you can configure the export of syslog events under Network-wide > General > Reporting > Syslog Servers. The following task is an example of how to configure forwarding for syslog IDS/IPS events.
To configure forwarding for syslog IDS/IPS events, do the following:
- On the Cisco Meraki platform, navigate to Network-wide > General > Reporting.
- Add the IDS alerts syslog role.
For more information on configuring log forwarding from Cisco Meraki, see the Cisco Meraki documentation.
Installing the Cisco Meraki app
To install the app, do the following:
Next-Gen App: To install or update the app, you must be an account administrator or a user with Manage Apps, Manage Monitors, Manage Fields, Manage Metric Rules, and Manage Collectors capabilities depending upon the different content types part of the app.
- Select App Catalog.
- In the 🔎 Search Apps field, run a search for your desired app, then select it.
- Click Install App.
note
Sometimes this button says Add Integration.
- Click Next in the Setup Data section.
- In the Configure section of your respective app, complete the following fields.
- Field Name. If you already have collectors and sources set up, select the configured metadata field name (eg _sourcecategory) or specify other custom metadata (eg: _collector) along with its metadata Field Value.
- Click Next. You will be redirected to the Preview & Done section.
Post-installation
Once your app is installed, it will appear in your Installed Apps folder, and dashboard panels will start to fill automatically.
Each panel slowly fills with data matching the time range query received since the panel was created. Results will not immediately be available but will be updated with full graphs and charts over time.
Viewing Cisco Meraki dashboards
All dashboards have a set of filters that you can apply to the entire dashboard. Use these filters to drill down and examine the data to a granular level.
- You can change the time range for a dashboard or panel by selecting a predefined interval from a drop-down list, choosing a recently used time range, or specifying custom dates and times. Learn more.
- You can use template variables to drill down and examine the data on a granular level. For more information, see Filtering Dashboards with Template Variables.
- Most Next-Gen apps allow you to provide the scope at the installation time and are comprised of a key (
_sourceCategoryby default) and a default value for this key. Based on your input, the app dashboards will be parameterized with a dashboard variable, allowing you to change the dataset queried by all panels. This eliminates the need to create multiple copies of the same dashboard with different queries.
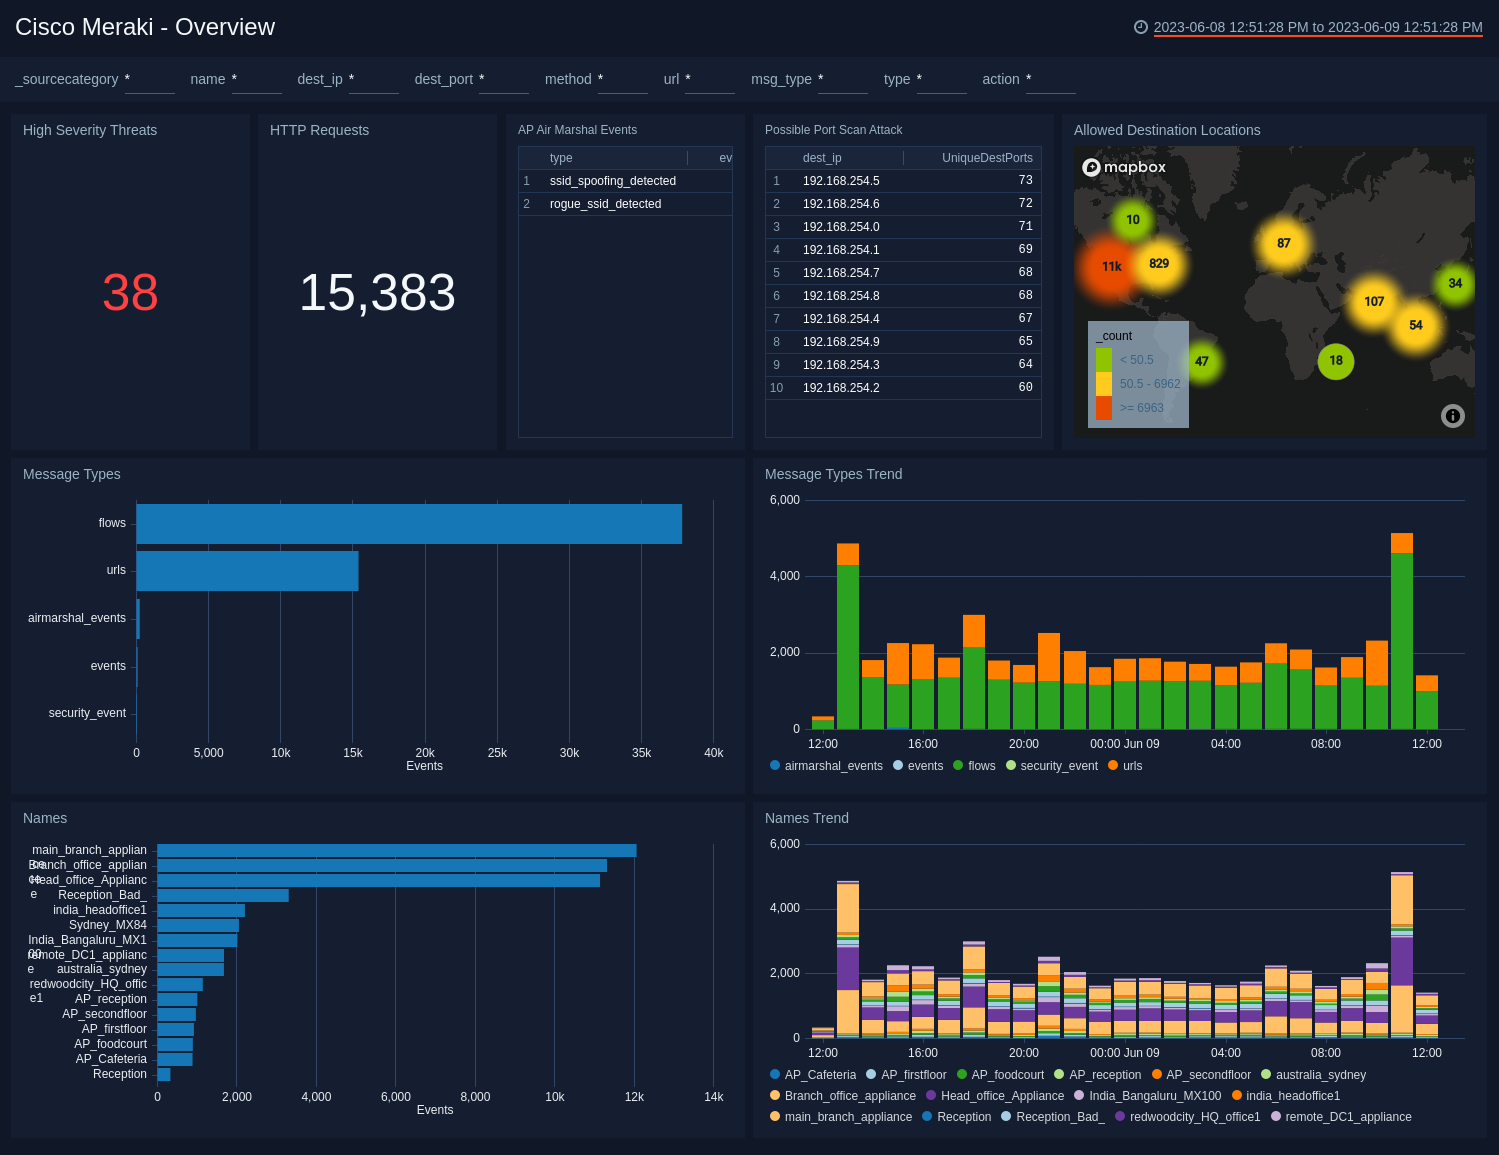
Overview
The Cisco Meraki - Overview dashboard provides a high-level view of high severity threats, port scan attacks, HTTP requests, and Air Marshall events in your environment. Panels also display overviews for message types and trends, as well as device names and trends.
Use this dashboard to:
- Monitor the number high severity threats and scan attacks.
- Identify trends across messages and appliance names.
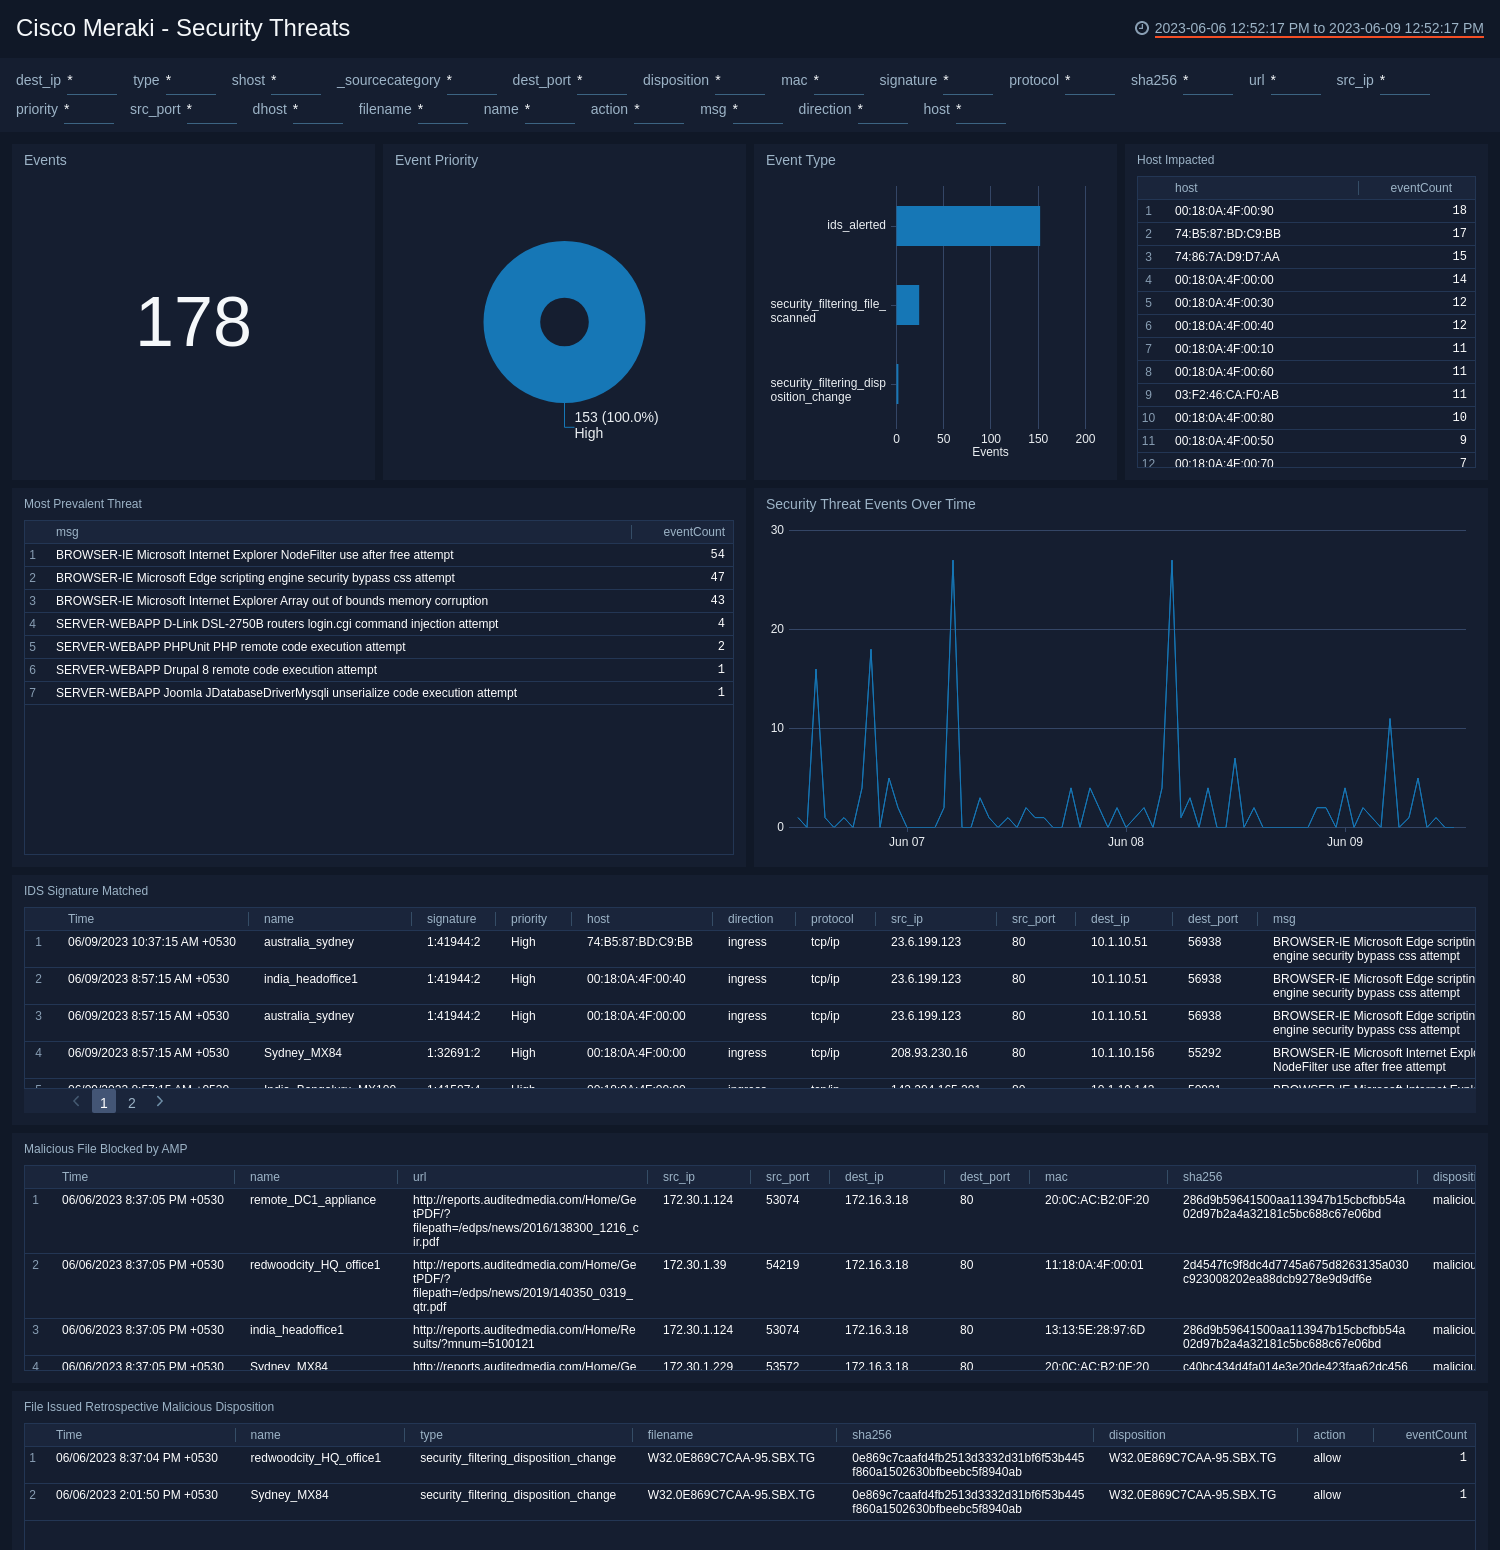
Security Threats
The Cisco Meraki - Security Threats dashboard provides a high-level view of events, event priority and type, security threat event trends, and hosts that have been impacted. The panels also show detailed information on IDS signatures that were matched, malicious files that were blocked, and files that were deemed malicious after further investigation.
Use this dashboard to:
- Determine the hosts or systems impacted by various threats and intrusion activities that have been identified and resolved.
- Monitor files that are blocked by anti-malware protection from various sources and destinations, to understand where the threats are coming from.
- Identify the most prevalent threats that could have a high impact on your environment.
- Monitor when, where, and what actions are taken with configured policies in your environment and optimize your policies accordingly.
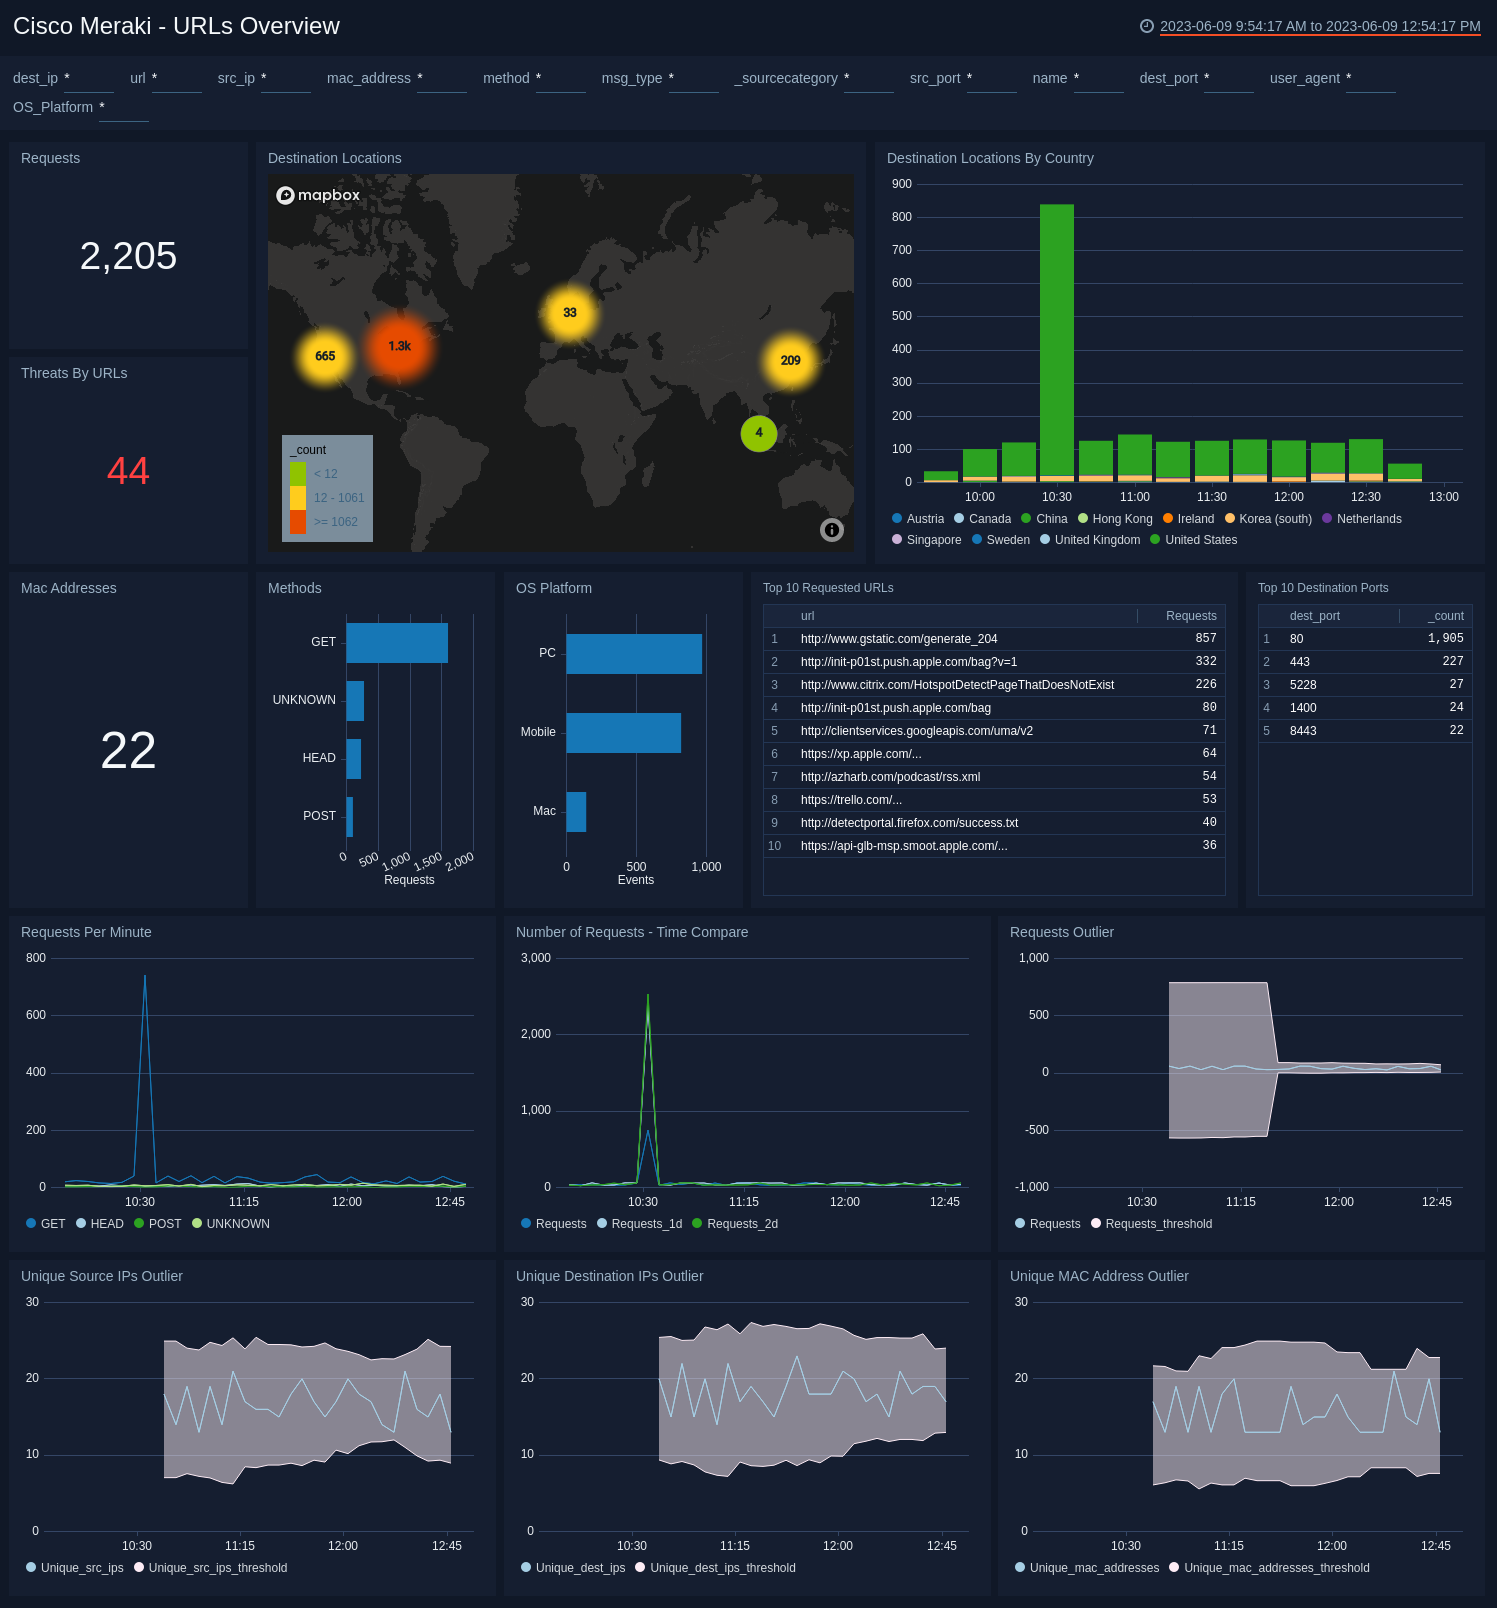
URLs Overview
The Cisco Meraki - URLs Overview dashboard provides a high-level view of requests made, destination locations, and threats by URLs. The panels also display information on mac addresses, methods, OS platforms used, the top requested URLs and destination ports. Graphs for outlier trends and comparison graphs provide insights that enable proactive troubleshooting and root cause resolution.
Use this dashboard to:
- Monitor the load on your network by looking at the rate of all requests and rates based on specific types of HTTP methods. This allows you to anticipate resource needs and allocate them accordingly.
- Monitor request trends and outliers in requests.
- Identify how you are acquiring devices with MAC Address outliers or client IP addresses, and compare this data with positive and negative outliers.
- Monitor destination IP address outliers to check for sudden changes in user behavior and destination location traffic.
- Monitor destinations visited by users of your network.
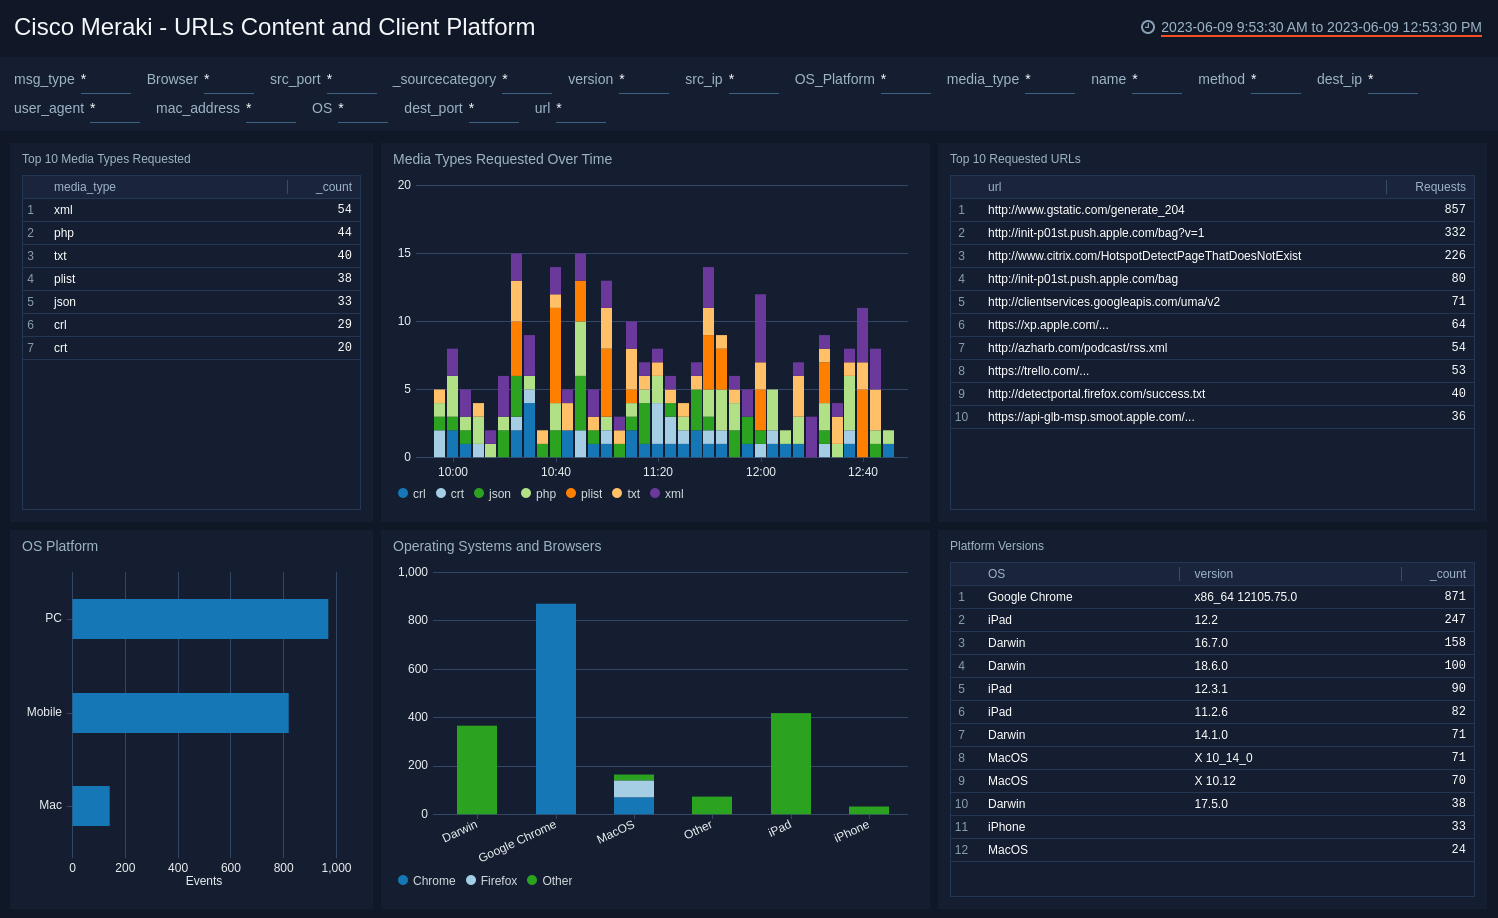
URLs Content and Client Platform
The Cisco Meraki - URLs Content and Client Platform dashboard provides information on the top media types that are requested in your environment, trends on media types that are requested over time, and the top requested URLs. The panels also display information on the OS platforms used, the browsers used on the various operating systems, and the platform versions used.
Use this dashboard to:
- Monitor operating systems (OS) for desktop and mobile devices, as well as browser information available in user agents, to understand how IT should best support your users.
- Determine which sites, pages, and file types are the most popular with your users, and develop policies accordingly.
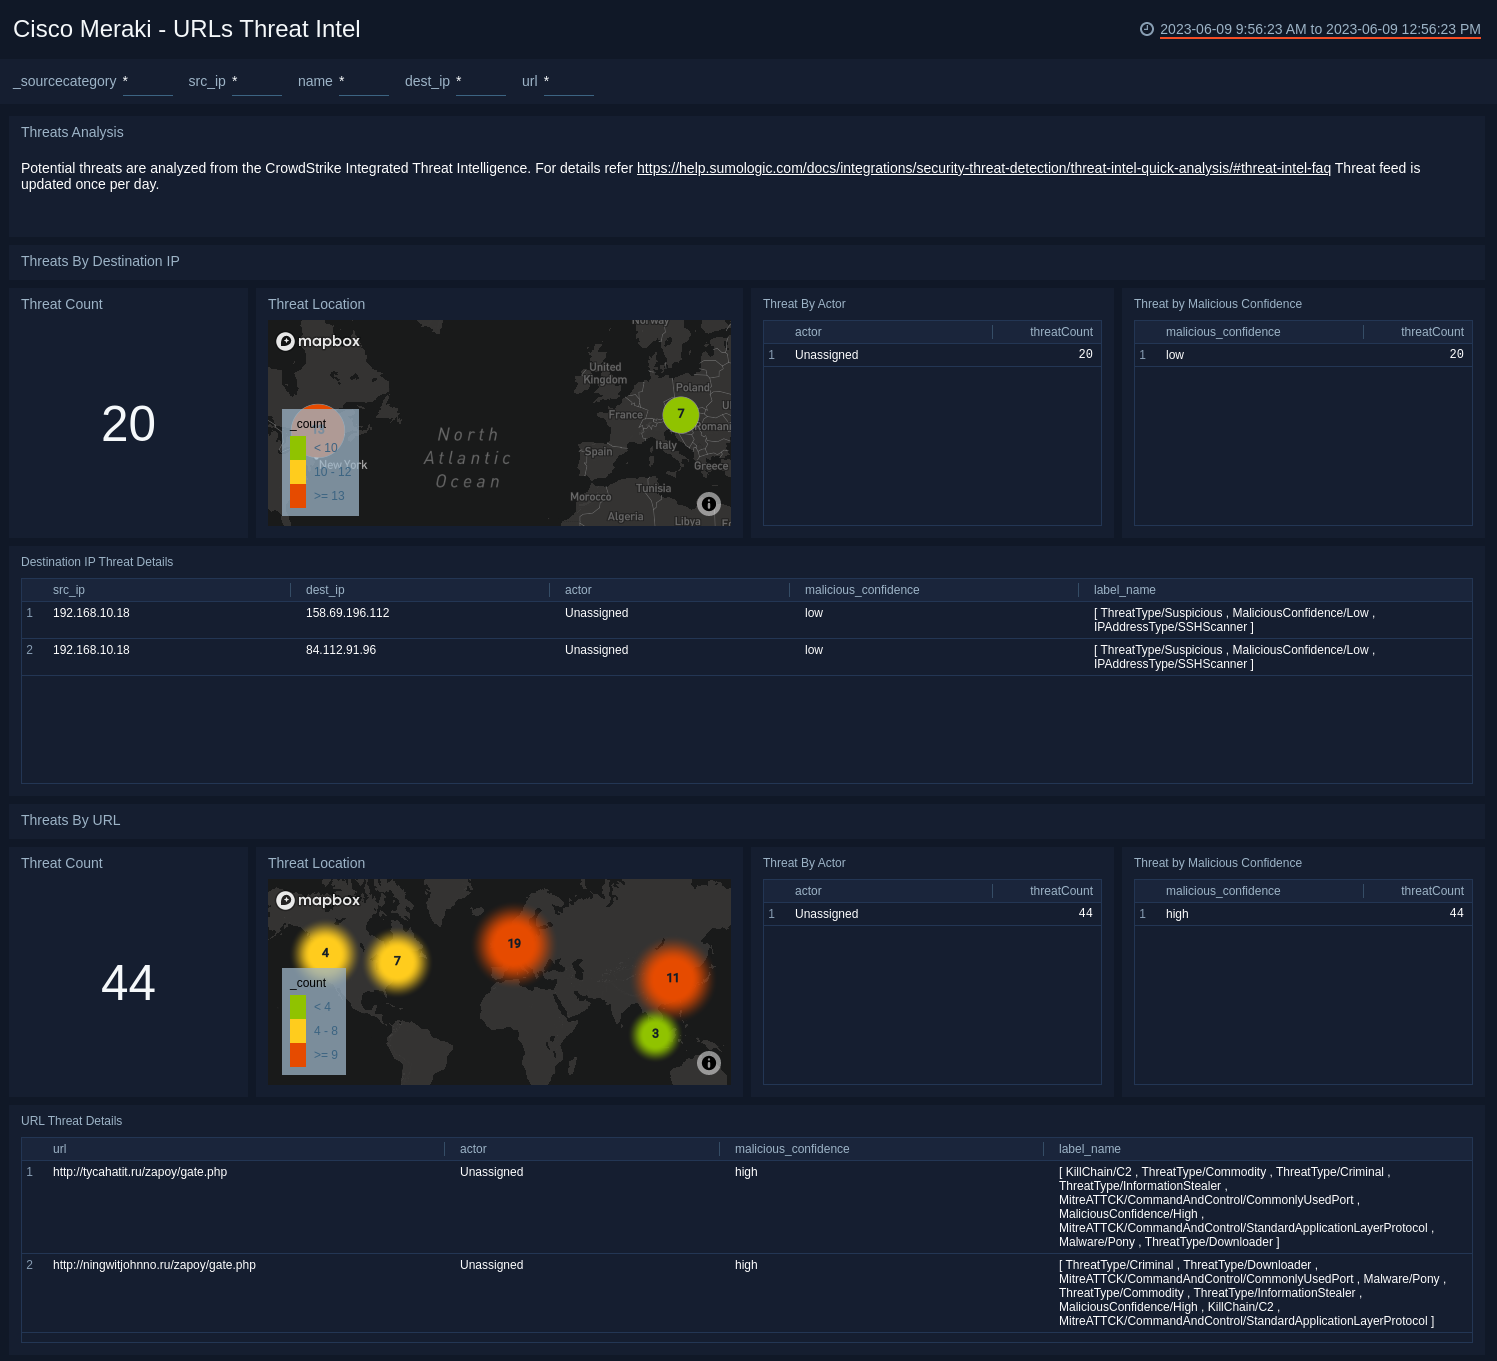
URLs Threat Intel
The Cisco Meraki - URLs Threat Intel dashboard provides a high-level view of the number of threats, their geographic locations, threats by actor, the malicious confidence, and details on IP destinations. The panels also show the number of threats by URL, their geographic locations, threats by actor, the malicious confidence, and the details on the URL threats.
Use this dashboard to:
- Identify and remediate potential threats and indicators of compromises to your network.
- Monitor whether users are accessing web pages or destination IP addresses that have been tagged as malicious by Sumo Logic Threat Intel.
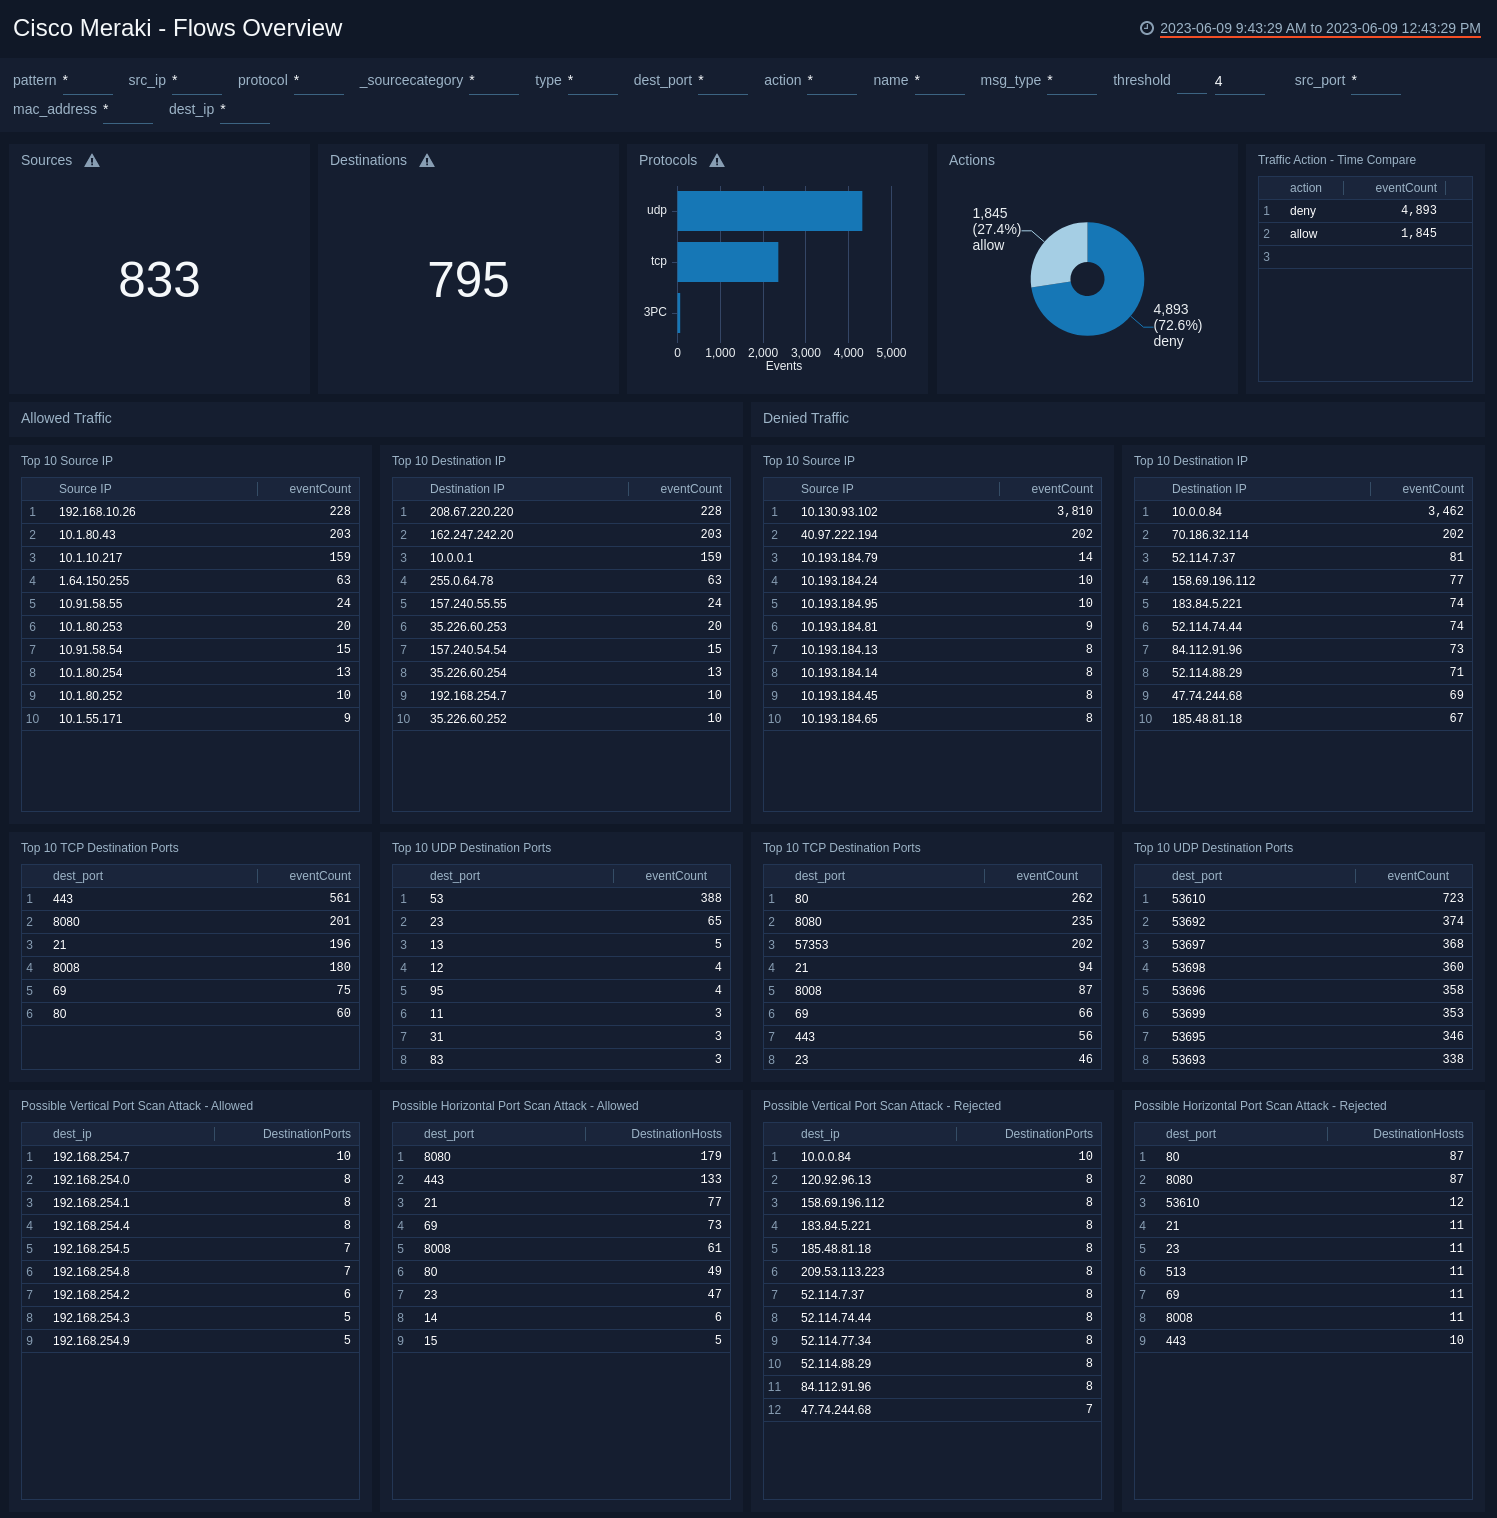
Flows Overview
The Cisco Meraki - Flows Overview dashboard provides a high-level view of traffic sources, destinations, protocols, and traffic action time comparisons. The panels also show detailed information on the top source IPs, destination ports, and possible port scan attacks for both allowed and denied traffic.
Use this dashboard to:
- Monitor network traffic that’s been allowed and rejected.
- Monitor the activity of TCP and UDP ports to identify possible port scan attacks, both horizontal and vertical.
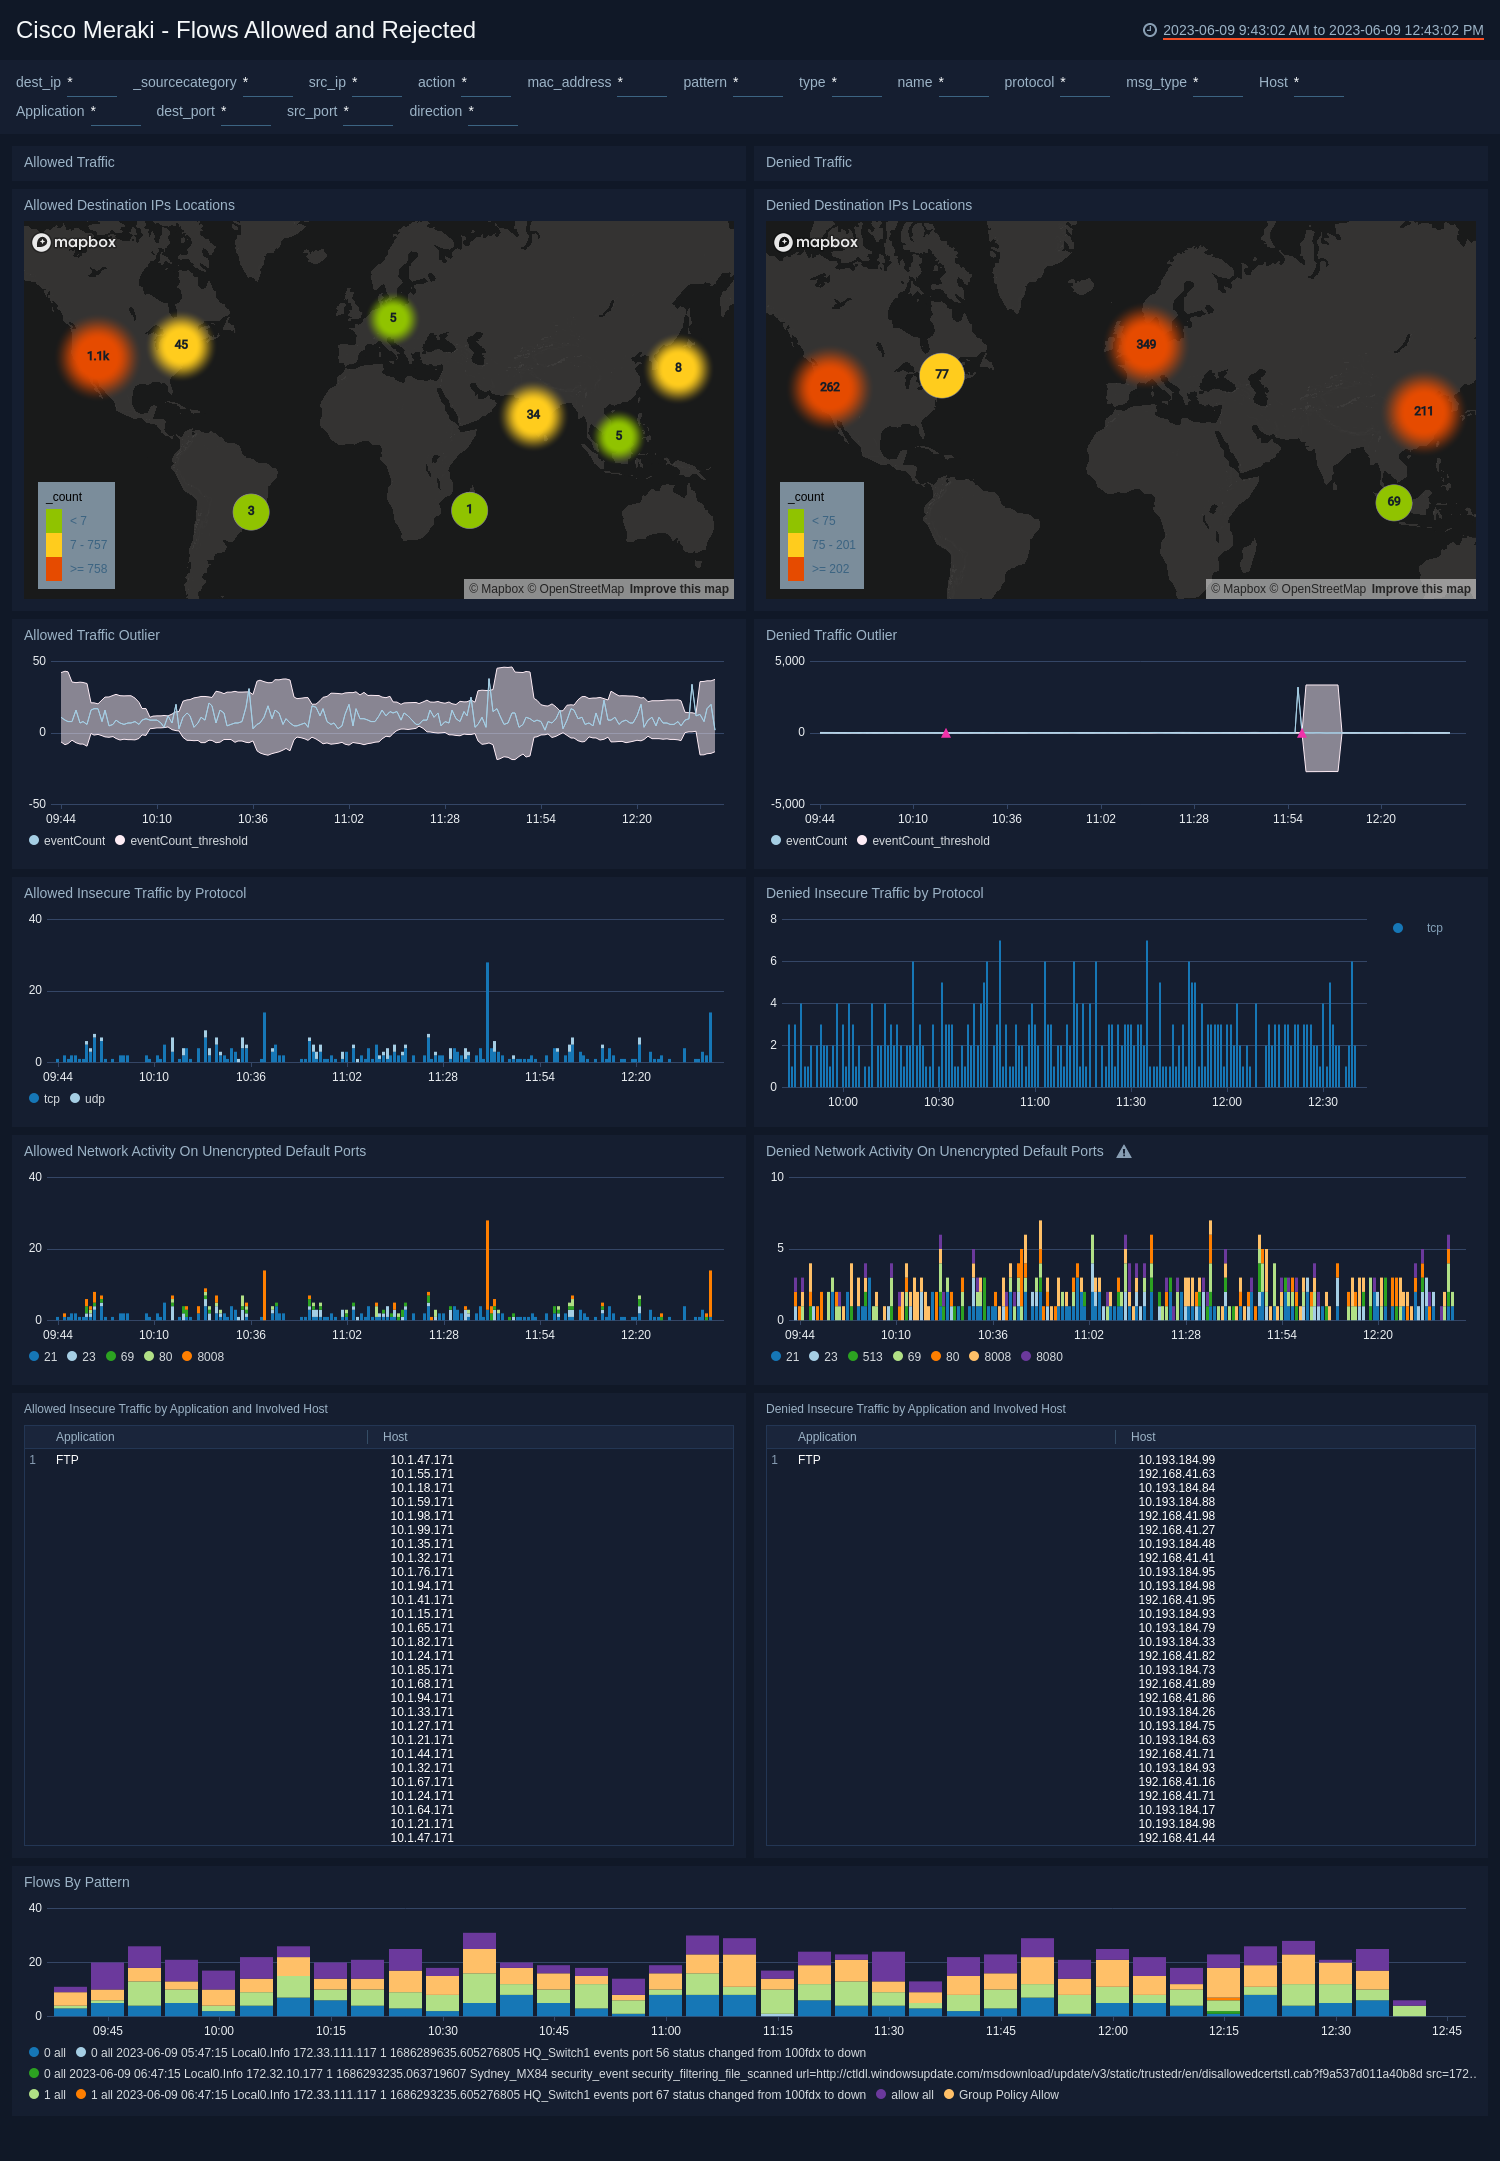
Flows Allowed and Rejected
The Cisco Meraki - Flows Allowed and Rejected dashboard provides a high-level view of the geographic locations and outlier graphs for allowed and denied traffic. Panels also show allowed and denied insecure traffic by protocol, allowed insecure traffic by application and host, allowed network activity on unencrypted ports, and a graph of flows by pattern.
Use this dashboard to:
- Detect sudden changes in allowed or rejected traffic in the outlier panels.
- Identify systems and hosts involved in insecure data transit over insecure connections and port protocols like ftp, telnet, http, and rlogin. You can also identify successful and rejected network connections for insecure connections.
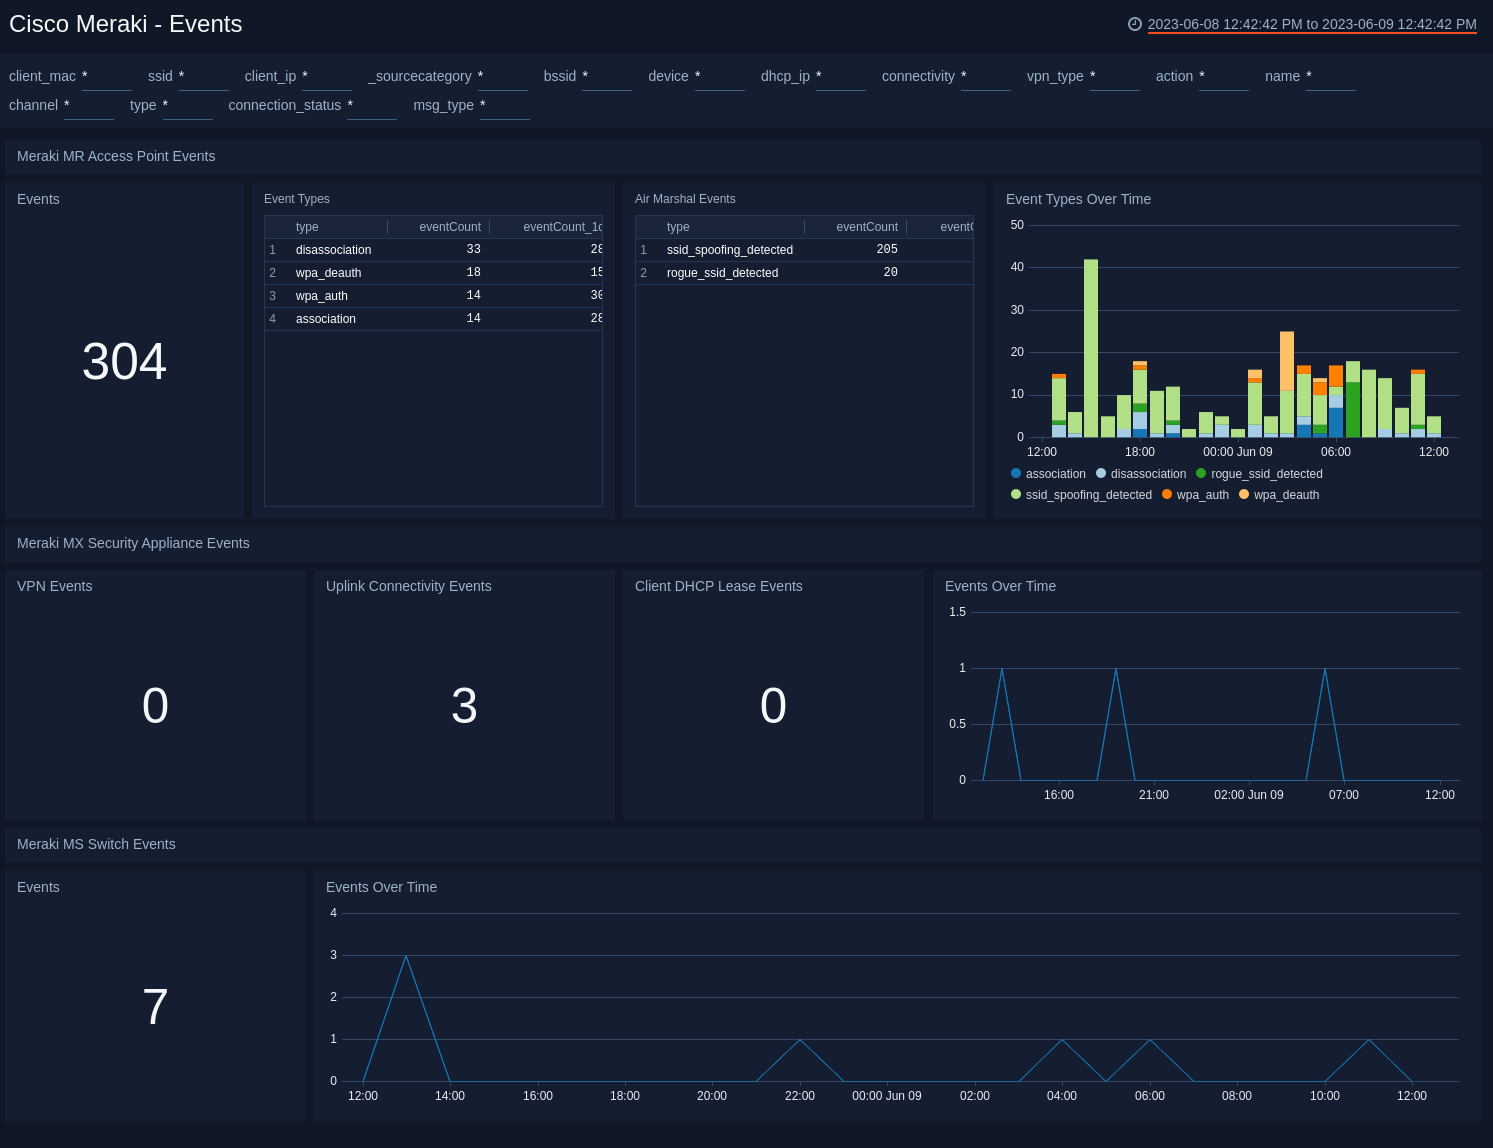
Events
The Cisco Meraki - Events dashboard provides a high-level view of events for MR access points, MX security appliances, and MS switches. Panels display information on the number of events, event types, Air Marshall events, connectivity, client DHCP events, and trend graphs of events over time.
Use this dashboard to:
- Monitor access point activities, such as association, disassociation, authentication, deauthentication, packet floods, rogue SSIDs, and SSID Spoofing activities. For details, see the following Cisco Meraki documentation.
- Monitor VPN connectivity and uplink connectivity changes, as well as client DHCP lease details with MX Security Appliances. For details, see Cisco Meraki documentation.
- Monitor switching events from Meraki MS Switches. For details, see Cisco Meraki documentation.
Upgrade/Downgrade the Cisco Meraki app (Optional)
To update the app, do the following:
Next-Gen App: To install or update the app, you must be an account administrator or a user with Manage Apps, Manage Monitors, Manage Fields, Manage Metric Rules, and Manage Collectors capabilities depending upon the different content types part of the app.
- Select App Catalog.
- In the Search Apps field, search for and then select your app.
Optionally, you can identify apps that can be upgraded in the Upgrade available section. - To upgrade the app, select Upgrade from the Manage dropdown.
- If the upgrade does not have any configuration or property changes, you will be redirected to the Preview & Done section.
- If the upgrade has any configuration or property changes, you will be redirected to the Setup Data page.
- In the Configure section of your respective app, complete the following fields.
- Field Name. If you already have collectors and sources set up, select the configured metadata field name (eg _sourcecategory) or specify other custom metadata (eg: _collector) along with its metadata Field Value.
- Click Next. You will be redirected to the Preview & Done section.
Post-update
Your upgraded app will be installed in the Installed Apps folder and dashboard panels will start to fill automatically.
See our Release Notes changelog for new updates in the app.
To revert the app to a previous version, do the following:
- Select App Catalog.
- In the Search Apps field, search for and then select your app.
- To version down the app, select Revert to < previous version of your app > from the Manage dropdown.
Uninstalling the Cisco Meraki app (Optional)
To uninstall the app, do the following:
- Select App Catalog.
- In the 🔎 Search Apps field, run a search for your desired app, then select it.
- Click Uninstall.