CloudPassage Halo

The CloudPassage Halo app helps you detect security violations and look for threats across your complex infrastructure, through the analysis of massive volumes of Halo event data. CloudPassage’s Halo platform records over eighty different types of security events about your Halo-managed infrastructure, whether you deploy into public cloud environments or your private data center. These events deliver information about your infrastructure and include critical security alerts for firewall changes, access changes, configuration changes, and file integrity changes, and more.
You can leverage the security visibility provided by CloudPassage's Halo platform with Sumo Logic’s correlation and visualization capabilities to deliver a security reporting and analysis tool. This app enables security operators and administrators to correlate security events across their Halo-managed infrastructure.
Collecting logs for the CloudPassage Halo app
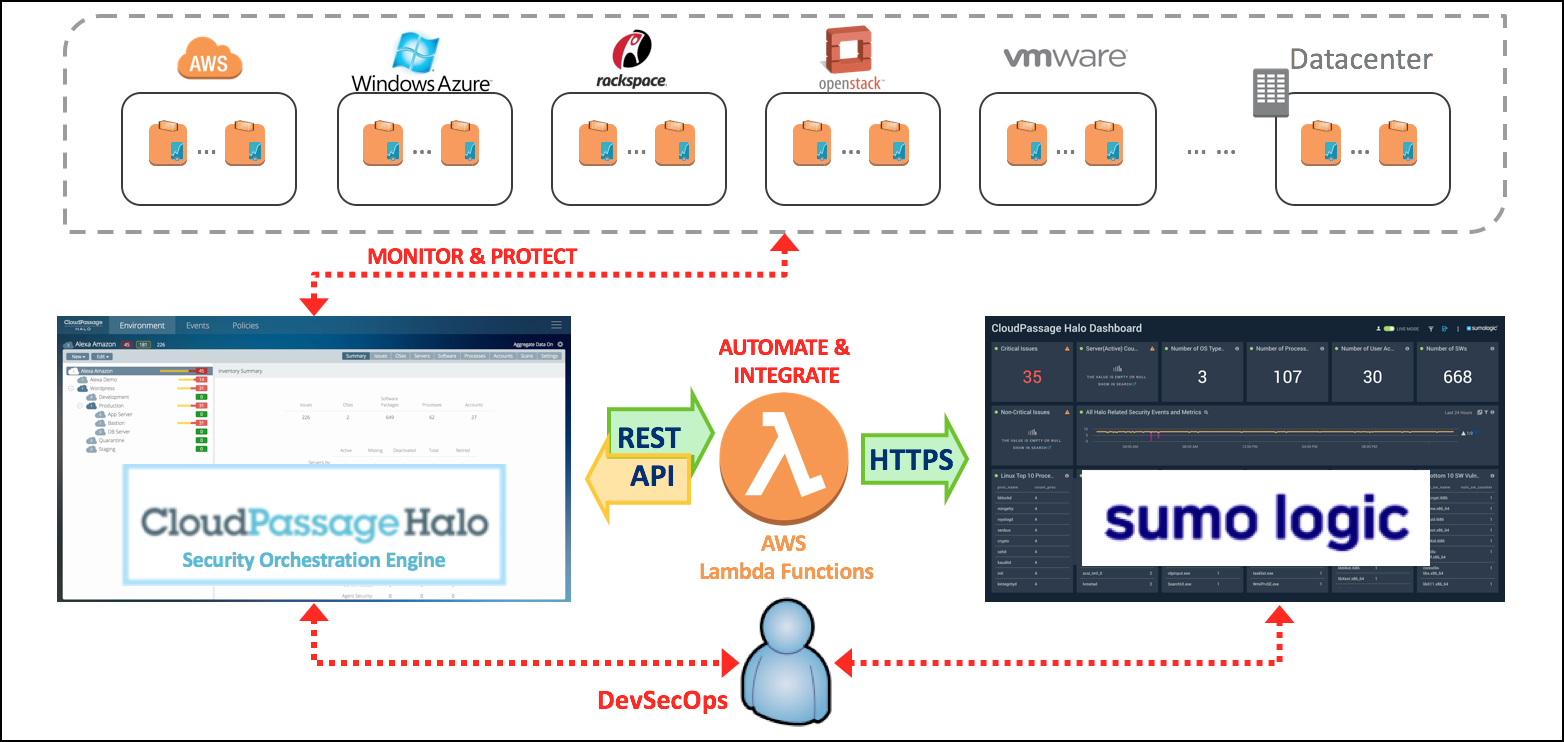
The CloudPassage Halo app uses the Halo REST API and AWS Lambda to collect Halo events.
To collect CloudPassage Halo logs for Sumo Logic you need to configure:
- Two Sumo Logic hosted collectors.
- Two Lambda functions to call Halo’s REST APIs and forward Halo events to Sumo Logic.

Sumo Logic Collector Configuration
If this is the first time you are creating an HTTPS collector, review how to create an HTTP source. Then, follow the instructions on how to create a collector.
Create the collector
- Classic UI. In the main Sumo Logic menu, select Manage Data > Collection > Collection.
New UI. In the Sumo Logic top menu select Configuration, and then under Data Collection select Collection. You can also click the Go To... menu at the top of the screen and select Collection. - Click Hosted Collector.
- In Add Hosted Collector enter:
- Name. Halo_Lambda_Ingestor.
- Description. Halo Events Collector.
- Category. CP_Halo.
- And click Save.
- Click OK to add a source to your collector.
- Select HTTP as the source type.
- Enter the information as below for Halo Security Events.
- Name. CP_Halo_Workload_Security_Events_Collector.
- Description. Halo Security Events Collector.
- Source Host. CP_Halo.
- Source Category. halo/workload/security/events
- Click Save. Be sure to note the endpoint URL provided for this collection. You will need it later.
- Create a second source.
- Click Hosted Collector.
- Select HTTP as the source type.
- Enter the information as below for Halo Metric Events.
- Name. CP_Halo_Metrics_Collector.
- Description. Halo key metrics collector.
- Source Host. CP_Halo.
- Source Category. halo/metrics.
- When you are done, you should have two collections CP_Halo_Metrics_Collector and CP_Halo_Workload_Security_Events_Collector set up under a single collector Halo_Lambda_Ingestor.
CloudPassage Halo
You will need your CloudPassage login to set up CloudPassage Halo.
To set up CloudPassage Halo, do the following:
- Use the official CloudPassage documentation to set up CloudPassage. You will need your CloudPassage login.
- Follow the instructions on how to create a read-only API key for the app.
AWS Configuration
If this is the first time you are using the SQS, it is strongly recommended to go through Quick start with SQS first.
SQS (Simple Queue Service). This queue stores one message at any given time. It contains “the last time (in Zulu format)” the script ran to collect the events from Halo. The message is then deleted and new one (with the current time in Zulu format) is added into the queue.
The queue is automatically created the first time you run the Halo_events_to_SumoLogic Lambda code.
Lambda Functions
If this is the first time you are using the Lambda, it is strongly recommended to go through Quick start with Lambda first.
Recommended configuration
Download the Python code from the following two zip file links:
- Halo_events_to_SumoLogic.zip. Python Lambda code to collect Halo events and forward them to Sumo Logic. This Python Lambda code would use Halo’s API to collect the security events reported by the agents installed in your workloads. It takes the “last time” the Lambda code ran from the SQS. Then initiate API call(s) to request any events that has been reported between the “last time” the Lambda code ran and the current time. It uses the SQS to store the “last time” the event was collected.
- Halo_metrics_to_SumoLogic.zip. Python Lambda code to collect Halo metrics and forward them to Sumo Logic. This Python Lambda code would use Halo’s API to collect the key stats from your Halo account.
Configure AWS Lambda for Halo_events_to_SumoLogic
Sample policy: Be sure to use the proper permission level.
- Configure Lambda.
- Click Blank Function.
- Click Next.
- Fill in Configure Function with:
- Name. halo_events_to_sumologic.
- Runtime. Python 2.7.
- Change Code entry Type to Upload a .ZIP file. And upload the Halo_events_to_SumoLogic.zip file. Then enter in the environment variables with proper values (refer to the steps above).
- Fill in the information to match the screenshot below. Enter halo_events_to_sumologic.lambda_handler for Handler. Then select “Create a custom role” for Role.
- Fill in the information to match the screenshot below. Select “Choose a new IAM Role” for IAM Role and lambda_basic_execution for Role Name.
- Change the Timeout to 4 minutes under Advanced Settings.
- Verify all the information is entered correctly. Then click Create Function to proceed. The screenshot does not have values for the Environment Variables. But you should have entered it with your information.
- Now we need to create an IAM role. Select IAM.
- Select lamda_basic_execution role that was created in the previous step.
- Select AmazonSQSFullAccess and AWSLambdaBasicExecutionRole for the policies. If you don’t have these policies, refer to the AWS manual and next few steps to create them.
- Here is the sample policy for the AmazonSQSFullAccess. Make sure you change the permission to meet your security requirements. Sample policy: Use a proper permission level. Below is a sample.
{
  "Version": "2012-10-17",
  "Statement": [
    {
      "Action": [
        "sqs:*”
      ],
       "Effect": "Allow",
       "Resource": "*"
       }
   ]
}
- Here is the sample policy for AWSLambdaBasicExecutionRole. Make sure you change the permission to meet your security requirements.
{
    "Version": "2012-10-17",
    "Statement": [{
        "Effect": "Allow",
        "Action": [
            "logs:CreateLogGroup",
            "logs:CreateLogStream",
            "logs:PutLogEvents"
        ],
        "Resource": "*"
    }]
}
- Let’s test the Lambda code. Click on Test and then Save and test to start the code.
- If it is configured properly, it should create the SQS queue for you. And the outcome should look something similar to below. Result should show you the time in Zulu format and Log Output should include [create_queue].
- If you check the SQS dashboard, you will see the new queue, last_time_scan, has been created for you automatically.
- Let's create a trigger for our Lambda code. I want this code to run every 5 minutes. Select Triggers from the tab. Then click Add trigger.
- Then click on the blank square to bring out the pulldown menu. Select CloudWatch Events - Schedule.
- Fill in the information and make sure you set the Schedule expression as rate(5 minutes).
- A successfully configured trigger will have a success message and appear similar to the trigger below.
- You are done for the first Lambda code! You can follow the same steps to configure Lambda for Halo_metrics_to_SumoLogic.
Installing the CloudPassage Halo app
To install the app, do the following:
Next-Gen App: To install or update the app, you must be an account administrator or a user with Manage Apps, Manage Monitors, Manage Fields, Manage Metric Rules, and Manage Collectors capabilities depending upon the different content types part of the app.
- Select App Catalog.
- In the 🔎 Search Apps field, run a search for your desired app, then select it.
- Click Install App.
note
Sometimes this button says Add Integration.
- Click Next in the Setup Data section.
- In the Configure section of your respective app, complete the following fields.
- Field Name. If you already have collectors and sources set up, select the configured metadata field name (eg _sourcecategory) or specify other custom metadata (eg: _collector) along with its metadata Field Value.
- Click Next. You will be redirected to the Preview & Done section.
Post-installation
Once your app is installed, it will appear in your Installed Apps folder, and dashboard panels will start to fill automatically.
Each panel slowly fills with data matching the time range query received since the panel was created. Results will not immediately be available but will be updated with full graphs and charts over time.
Viewing CloudPassage Halo dashboards
All dashboards have a set of filters that you can apply to the entire dashboard. Use these filters to drill down and examine the data to a granular level.
- You can change the time range for a dashboard or panel by selecting a predefined interval from a drop-down list, choosing a recently used time range, or specifying custom dates and times. Learn more.
- You can use template variables to drill down and examine the data on a granular level. For more information, see Filtering Dashboards with Template Variables.
- Most Next-Gen apps allow you to provide the scope at the installation time and are comprised of a key (
_sourceCategoryby default) and a default value for this key. Based on your input, the app dashboards will be parameterized with a dashboard variable, allowing you to change the dataset queried by all panels. This eliminates the need to create multiple copies of the same dashboard with different queries.
Overview
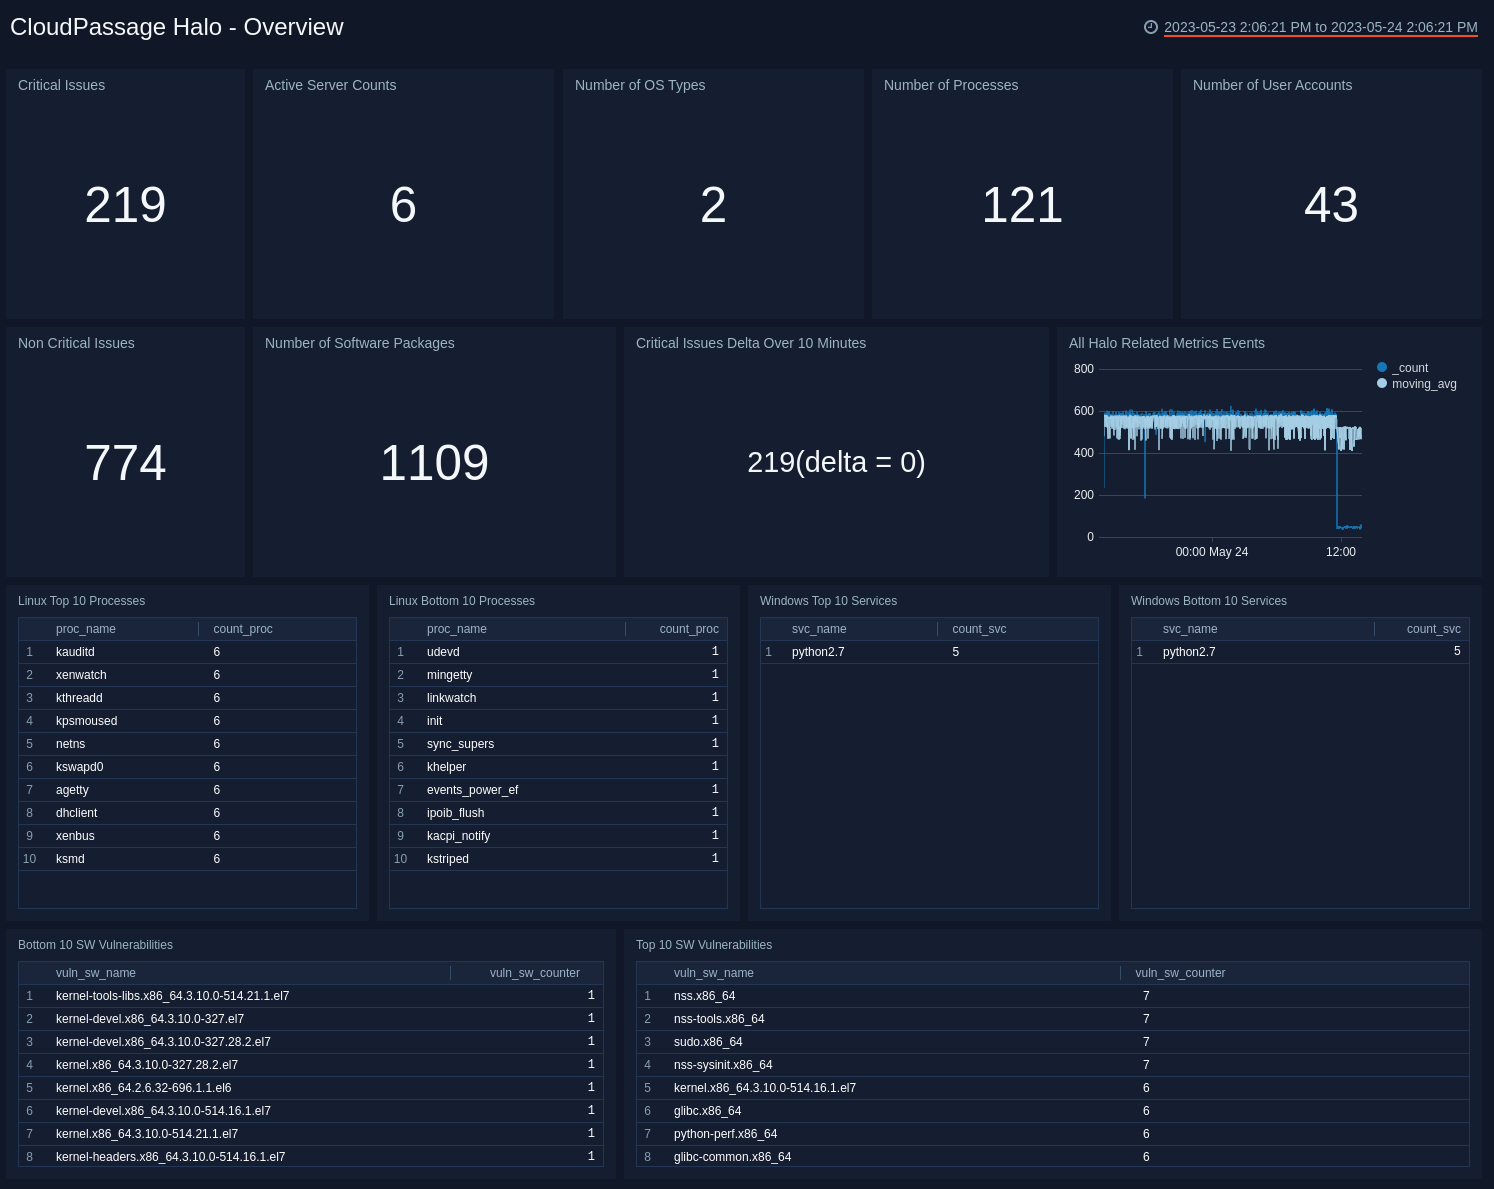
View counts of key information for you system as well as top and bottom 10 processes for Linux, top and bottom 10 services for Windows, and top and bottom 10 software vulnerabilities found by CloudPassage Halo.
- Critical Issues / Non-Critical Issues. Number of critical and non-critical issues (Single Number Panel with 15min time range).
- Severity(Active) Count. Number of active workloads (Single Number Panel with 15min time range)
- Number of OS Types. Number of OS types found from each and every workloads managed by Halo (Single Number Panel with 15min time range)
- Number of Processes. Number of processes found from each and every workloads managed by Halo (Single Number Panel with 15min time range)
- Number of User Accounts. Number of user accounts found from each and every workloads managed by Halo (Single Number Panel with 15min time range.
- Number of SWs. Number of SW packages found from each and every workloads managed by Halo (Single Number Panel with 15min time range)
- Halo Related Security Events and Metrics. This is a line graphs for Halo related events and metrics from the account (Line graph with running average with 24hrs time range)
- Top 10 Linux Processes / Bottom 10 Linux Processes. Top & Bottom 10 Linux processes found from the workloads managed by Halo (Table panel with 7min time range)
- Top 10 Windows Services / Bottom 10 Windows Services. Top & Bottom 10 Windows services found from the workloads managed by Halo (Table panel with 7min time range
- Top 10 SW Vulnerabilities / Bottom 10 SW Vulnerabilities. Top & Bottom 10 software vulnerabilities found from the workloads managed by Halo (Table panel with 7min time range)

Critical Events
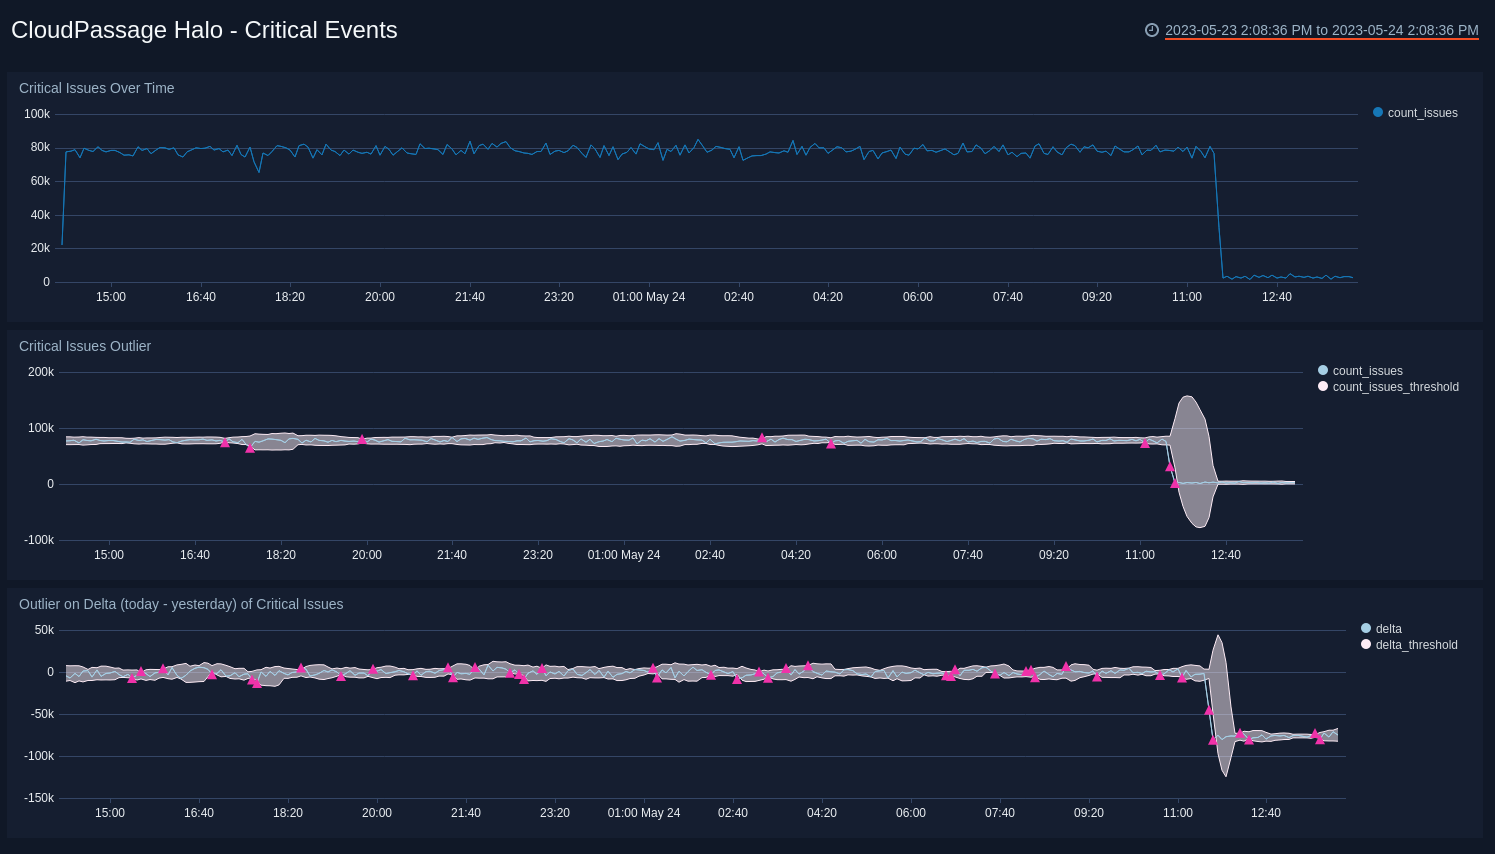
View critical issues for the last 24 hours, outliers for the critical issues threshold during that time, and compare today's critical issues and outliers with the previous day.
- Critical Issues Over Time. View a count of critical issues over the last 24 hours, timesliced by every 5 minutes.
- Critical Issues Outlier. View outliers outside the established threshold for critical issues over the last 24 hours, timesliced by every 5 minutes.
- Outlier on Delta (today - yesterday) of Critical Issues. View the outlier difference between the count of issues today and yesterday

Upgrade/Downgrade the CloudPassage Halo app (Optional)
To update the app, do the following:
Next-Gen App: To install or update the app, you must be an account administrator or a user with Manage Apps, Manage Monitors, Manage Fields, Manage Metric Rules, and Manage Collectors capabilities depending upon the different content types part of the app.
- Select App Catalog.
- In the Search Apps field, search for and then select your app.
Optionally, you can identify apps that can be upgraded in the Upgrade available section. - To upgrade the app, select Upgrade from the Manage dropdown.
- If the upgrade does not have any configuration or property changes, you will be redirected to the Preview & Done section.
- If the upgrade has any configuration or property changes, you will be redirected to the Setup Data page.
- In the Configure section of your respective app, complete the following fields.
- Field Name. If you already have collectors and sources set up, select the configured metadata field name (eg _sourcecategory) or specify other custom metadata (eg: _collector) along with its metadata Field Value.
- Click Next. You will be redirected to the Preview & Done section.
Post-update
Your upgraded app will be installed in the Installed Apps folder and dashboard panels will start to fill automatically.
See our Release Notes changelog for new updates in the app.
To revert the app to a previous version, do the following:
- Select App Catalog.
- In the Search Apps field, search for and then select your app.
- To version down the app, select Revert to < previous version of your app > from the Manage dropdown.
Uninstalling the CloudPassage Halo app (Optional)
To uninstall the app, do the following:
- Select App Catalog.
- In the 🔎 Search Apps field, run a search for your desired app, then select it.
- Click Uninstall.