CrowdStrike Falcon Endpoint Protection
The CrowdStrike Falcon Endpoint Protection app provides visibility into the security posture of your endpoints as analyzed by the CrowdStrike Falcon Endpoint Protection platform. The app allows you to analyze indicators of compromise (IOCs) by affected users, tactic, technique, and objective, and identify hosts on your network with the highest malware detections. The dashboards in this app help identify threats and incidents, from which you can drill down to investigate further.
The CrowdStrike Falcon Endpoint Protection Platform is a cloud-native framework that protects endpoints to stop breaches and improve performance with the robust power of the cloud combined with an intelligent, lightweight endpoint agent.
This version of the CrowdStrike Falcon Endpoint Protection app and its collection process has been tested with SIEM Connector Version 2.1.0+001-siem-release-2.1.0.
Log types
The CrowdStrike Falcon Endpoint Protection app uses the following log types:
- Detection Event
- Authentication Event
- Detection Status Update Event
For more information on Events, please refer to the CrowdStrike Falcon Endpoint Protection Streaming API Event Dictionary.
Sample log messages
For more information on Events, refer to the Streaming API Event Dictionary.
Detection Event
{
    "metadata": {
        "customerIDString": “xxxxxxxxxxxxxxxxxxxxxxxxxxxxxx",
        "offset": 14947764,
        "eventType": "DetectionSummaryEvent",
        "eventCreationTime": 1536846439000,
        "version": "1.0"
    },
    "event": {
        "ProcessStartTime": 1536846339,
        "ProcessEndTime": 0,
        "ProcessId": 38684386611,
        "ParentProcessId": 38682494050,
        "ComputerName": "CS-SE-EZ64",
        "UserName": "demo",
        "DetectName": "Process Terminated",
        "DetectDescription": "Terminated a process related to the deletion of backups, which is often indicative of ransomware activity.",
        "Severity": 4,
        "SeverityName": "High",
        "FileName": "explorer.exe",
        "FilePath": "\\Device\\HarddiskVolume1\\Windows",
        "CommandLine": "C:\\Windows\\Explorer.EXE",
        "SHA256String": "6a671b92a69755de6fd063fcbe4ba926d83b49f78c42dbaeed8cdb6bbc57576a",
        "MD5String": "ac4c51eb24aa95b77f705ab159189e24",
        "MachineDomain": "CS-SE-EZ64",
        "FalconHostLink": "<a href="https://falcon.crowdstrike.com/activity/detections/detail/ec86abd353824e96765ecbe18eb4f0b4/38655257584?_cid=xxxxxxxxxxxxxxxxxx">https://falcon.crowdstrike.com/activity...xxxxxxxxxxxxxx</a>",
        "SensorId": "ec86abd353824e96765ecbe18eb4f0b4",
        "DetectId": "ldt:ec86abd353824e96765ecbe18eb4f0b4:38655257584",
        "LocalIP": "xx.xx.xx.xx",
        "MACAddress": "xx-xx-xx-xx-xx",
        "Tactic": "Malware",
        "Technique": "Ransomware",
        "Objective": "Falcon Detection Method",
        "PatternDispositionDescription": "Prevention, process killed.",
        "PatternDispositionValue": 16,
        "PatternDispositionFlags": {
            "Indicator": false,
            "Detect": false,
            "InddetMask": false,
            "SensorOnly": false,
            "Rooting": false,
            "KillProcess": true,
            "KillSubProcess": false,
            "QuarantineMachine": false,
            "QuarantineFile": false,
            "PolicyDisabled": false,
            "KillParent": false,
            "OperationBlocked": false,
            "ProcessBlocked": false
        }
    }
}
Authentication Event
{
  "event": {
    "AuditKeyValues": [
      {
        "Key": "target_name",
        "ValueString": "user@example.com"
      }
    ],
    "OperationName": "activateUser",
    "ServiceName": "CrowdStrike Authentication",
    "Success": true,
    "UserId": "user@example.com",
    "UserIp": "192.0.2.100",
    "UTCTimestamp": 1452711518
  },
  "metadata": {
    "customerIDString": "0123456789ABCDEFGHIJKLMNOPQRSTUV",
    "eventType": "AuthActivityAuditEvent",
    "eventCreationTime": 1480375833,
    "offset": 80960
  }
}NOPQRSTUV","eventType":"AuthActivityAuditEvent","eventCreationTime":1480375833,"offset":80960}}
Detection Status Update
{
    "metadata": {
        "customerIDString": "0123456789ABCDEFGHIJKLMNOPQRSTUV",
        "offset": 11049003,
        "eventType": "UserActivityAuditEvent",
        "eventCreationTime": 1479770848
    },
    "event": {
        "UserId": "user@example.com",
        "UserIp": "",
        "OperationName": "detection_update",
        "ServiceName": "detections",
        "AuditKeyValues": [
            {
                "Key": "detection_id",
                "ValueString": "ldt:b60f82cf1aa342f47363bf3b6bfb6b7d:123456356541"
            },
            {
                "Key": "new_state",
                "ValueString": "in_progress"
            },
            {
                "Key": "assigned_to",
                "ValueString": "Knightley"
            },
            {
                "Key": "assigned_to_uid",
                "ValueString": "user@example.com"
            }
        ],
        "UTCTimestamp": 1479770848
    }
}
Sample queries
This section provides query examples for each event type.
_sourceCategory=*Crowdstrike*  DetectionSummaryEvent
| json "metadata.eventType", "metadata.customerIDString", "metadata.eventCreationTime" as event_type, customer_id, event_time
| formatDate(fromMillis(event_time), "MM/dd/yyyy HH:mm:ss:SSS") as event_time
| where event_type="DetectionSummaryEvent"
| json "event.Tactic","event.Technique", "event.Objective", "event.ComputerName", "event.UserName", "event.DetectId", "event.DetectDescription", "event.Severity", "event.SeverityName", "event.FileName", "event.FilePath", "event.CommandLine", "event.MD5String", "event.SHA1String", "event.MachineDomain" , "event.FalconHostLink", "event.IOCType", "event.IOCValue", "event.LocalIP", "event.MACAddress" as tactic, technique, objective, computer_name, user_name, detect_id, detect_desc, severity, severity_name, file_name, file_path, cmd_line, md5_string, sha1_string, machine_domain, falconHost_link, IOC_Ttype, IOC_value, local_ip, mac_address
| timeslice 1d
| count_distinct (detect_id) by _timeslice, severity_name
| fillmissing timeslice(1d)
| transpose row _timeslice column severity_name
_sourceCategory=*Crowdstrike*  AuthActivityAuditEvent (userAuthenticate or twoFactorAuthenticate)
| json "metadata.eventType", "metadata.customerIDString", "metadata.eventCreationTime" as event_type, customer_id, event_time
| formatDate(fromMillis(event_time), "MM/dd/yyyy HH:mm:ss:SSS") as event_time
| json "event.UserId", "event.UserIp", "event.OperationName", "event.ServiceName", "event.Success", "event.UTCTimestamp" as src_user, user_ip, operation_name, service_name, success, operation_time
| formatDate(fromMillis(operation_time), "MM/dd/yyyy HH:mm:ss:SSS") as operation_time
| where success="true"
| count by operation_time, operation_name, src_user, user_ip
_sourceCategory=*Crowdstrike*  UserActivityAuditEvent
| json "metadata.eventType", "metadata.customerIDString", "metadata.eventCreationTime" as event_type, customer_id, event_time
| formatDate(fromMillis(event_time), "MM/dd/yyyy HH:mm:ss:SSS") as event_time
| where event_type="UserActivityAuditEvent"
| json "event.OperationName",  "event.UserId", "event.UserIp", "event.ServiceName", "event.AuditKeyValues" as operation_name, user_id, src_user, service_name, audit_values
| count by operation_name
| sort by _count
Collection configuration and app installation
Depending on the set up collection method, you can configure and install the app in three ways:
- Create a new collector and install the app. Create a new Sumo Logic Cloud-to-Cloud (C2C) source under a new Sumo Logic Collector and later install the app, or
- Use an existing collector and install the app. Create a new Sumo Logic Cloud-to-Cloud (C2C) source under an existing Sumo Logic Collector and later install the app, or
- Use existing source and install the app. Use your existing configured Sumo Logic Cloud-to-Cloud (C2C) source and install the app.
Use the Cloud-to-Cloud Integration for CrowdStrike to create the source and use the same source category while installing the app. By following these steps, you can ensure that your CrowdStrike app is properly integrated and configured to collect and analyze your CrowdStrike data.
Create a new collector and install the app
To set up collection and install the app, do the following:
Next-Gen App: To install or update the app, you must be an account administrator or a user with Manage Apps, Manage Monitors, Manage Fields, Manage Metric Rules, and Manage Collectors capabilities depending upon the different content types part of the app.
- Select App Catalog.
- In the 🔎 Search Apps field, run a search for your desired app, then select it.
- Click Install App.
note
Sometimes this button says Add Integration.
- In the Set Up Collection section of your respective app, select Create a new Collector.
- Collector Name. Enter a Name to display the Source in the Sumo Logic web application. The description is optional.
- Timezone. Set the default time zone when it is not extracted from the log timestamp. Time zone settings on Sources override a Collector time zone setting.
- (Optional) Metadata. Click the +Add Metadata link to add a custom log Metadata Fields. Define the fields you want to associate, each metadata field needs a name (key) and value.
 A green circle with a checkmark is shown when the field exists and is enabled in the Fields table schema.
 An orange triangle with an exclamation point is shown when the field doesn't exist, or is disabled, in the Fields table schema. In this case, an option to automatically add or enable the nonexistent fields to the Fields table schema is provided. If a field is sent to Sumo that does not exist in the Fields schema or is disabled it is ignored, known as dropped.
- Click Next.
- Configure the source as specified in the
Infobox above, ensuring all required fields are included. - In the Configure section of your respective app, complete the following fields.
- Field Name. If you already have collectors and sources set up, select the configured metadata field name (eg _sourcecategory) or specify other custom metadata (eg: _collector) along with its metadata Field Value.
- Click Next. You will be redirected to the Preview & Done section.
Post-installation
Once your app is installed, it will appear in your Installed Apps folder, and dashboard panels will start to fill automatically.
Each panel slowly fills with data matching the time range query received since the panel was created. Results will not immediately be available but will be updated with full graphs and charts over time.
Use an existing collector and install the app
To set up the source in the existing collector and install the app, do the following:
Next-Gen App: To install or update the app, you must be an account administrator or a user with Manage Apps, Manage Monitors, Manage Fields, Manage Metric Rules, and Manage Collectors capabilities depending upon the different content types part of the app.
- Select App Catalog.
- In the 🔎 Search Apps field, run a search for your desired app, then select it.
- Click Install App.
note
Sometimes this button says Add Integration.
- In the Set Up Collection section of your respective app, select Use an existing Collector.
- From the Select Collector dropdown, select the collector that you want to set up your source with and click Next.
- Configure the source as specified in the
Infobox above, ensuring all required fields are included. - In the Configure section of your respective app, complete the following fields.
- Field Name. If you already have collectors and sources set up, select the configured metadata field name (eg _sourcecategory) or specify other custom metadata (eg: _collector) along with its metadata Field Value.
- Click Next. You will be redirected to the Preview & Done section.
Post-installation
Once your app is installed, it will appear in your Installed Apps folder, and dashboard panels will start to fill automatically.
Each panel slowly fills with data matching the time range query received since the panel was created. Results will not immediately be available but will be updated with full graphs and charts over time.
Use an existing source and install the app
To skip collection and only install the app, do the following:
Next-Gen App: To install or update the app, you must be an account administrator or a user with Manage Apps, Manage Monitors, Manage Fields, Manage Metric Rules, and Manage Collectors capabilities depending upon the different content types part of the app.
- Select App Catalog.
- In the 🔎 Search Apps field, run a search for your desired app, then select it.
- Click Install App.
note
Sometimes this button says Add Integration.
- In the Set Up Collection section of your respective app, select Skip this step and use existing source and click Next.
- In the Configure section of your respective app, complete the following fields.
- Field Name. If you already have collectors and sources set up, select the configured metadata field name (eg _sourcecategory) or specify other custom metadata (eg: _collector) along with its metadata Field Value.
- Click Next. You will be redirected to the Preview & Done section.
Post-installation
Once your app is installed, it will appear in your Installed Apps folder, and dashboard panels will start to fill automatically.
Each panel slowly fills with data matching the time range query received since the panel was created. Results will not immediately be available but will be updated with full graphs and charts over time.
Viewing CrowdStrike Falcon Endpoint Protection dashboards
All dashboards have a set of filters that you can apply to the entire dashboard. Use these filters to drill down and examine the data to a granular level.
- You can change the time range for a dashboard or panel by selecting a predefined interval from a drop-down list, choosing a recently used time range, or specifying custom dates and times. Learn more.
- You can use template variables to drill down and examine the data on a granular level. For more information, see Filtering Dashboards with Template Variables.
- Most Next-Gen apps allow you to provide the scope at the installation time and are comprised of a key (
_sourceCategoryby default) and a default value for this key. Based on your input, the app dashboards will be parameterized with a dashboard variable, allowing you to change the dataset queried by all panels. This eliminates the need to create multiple copies of the same dashboard with different queries.
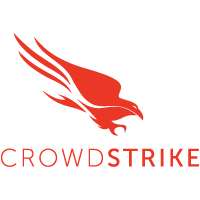
Overview
The CrowdStrike Falcon - Overview dashboard provides high-level visibility into the state of endpoints that are managed by the CrowdStrike Falcon platform. Panels provide insights into events, detections, authentications, and detection status updates for overall security posture and analysis of user activities.
Use this dashboard to:
- Understand the overall security posture of your environment as analyzed by CrowdStrike Falcon deployed in your network.
- Analyze user activities within the Falcon Console.
- Review all detection updates.
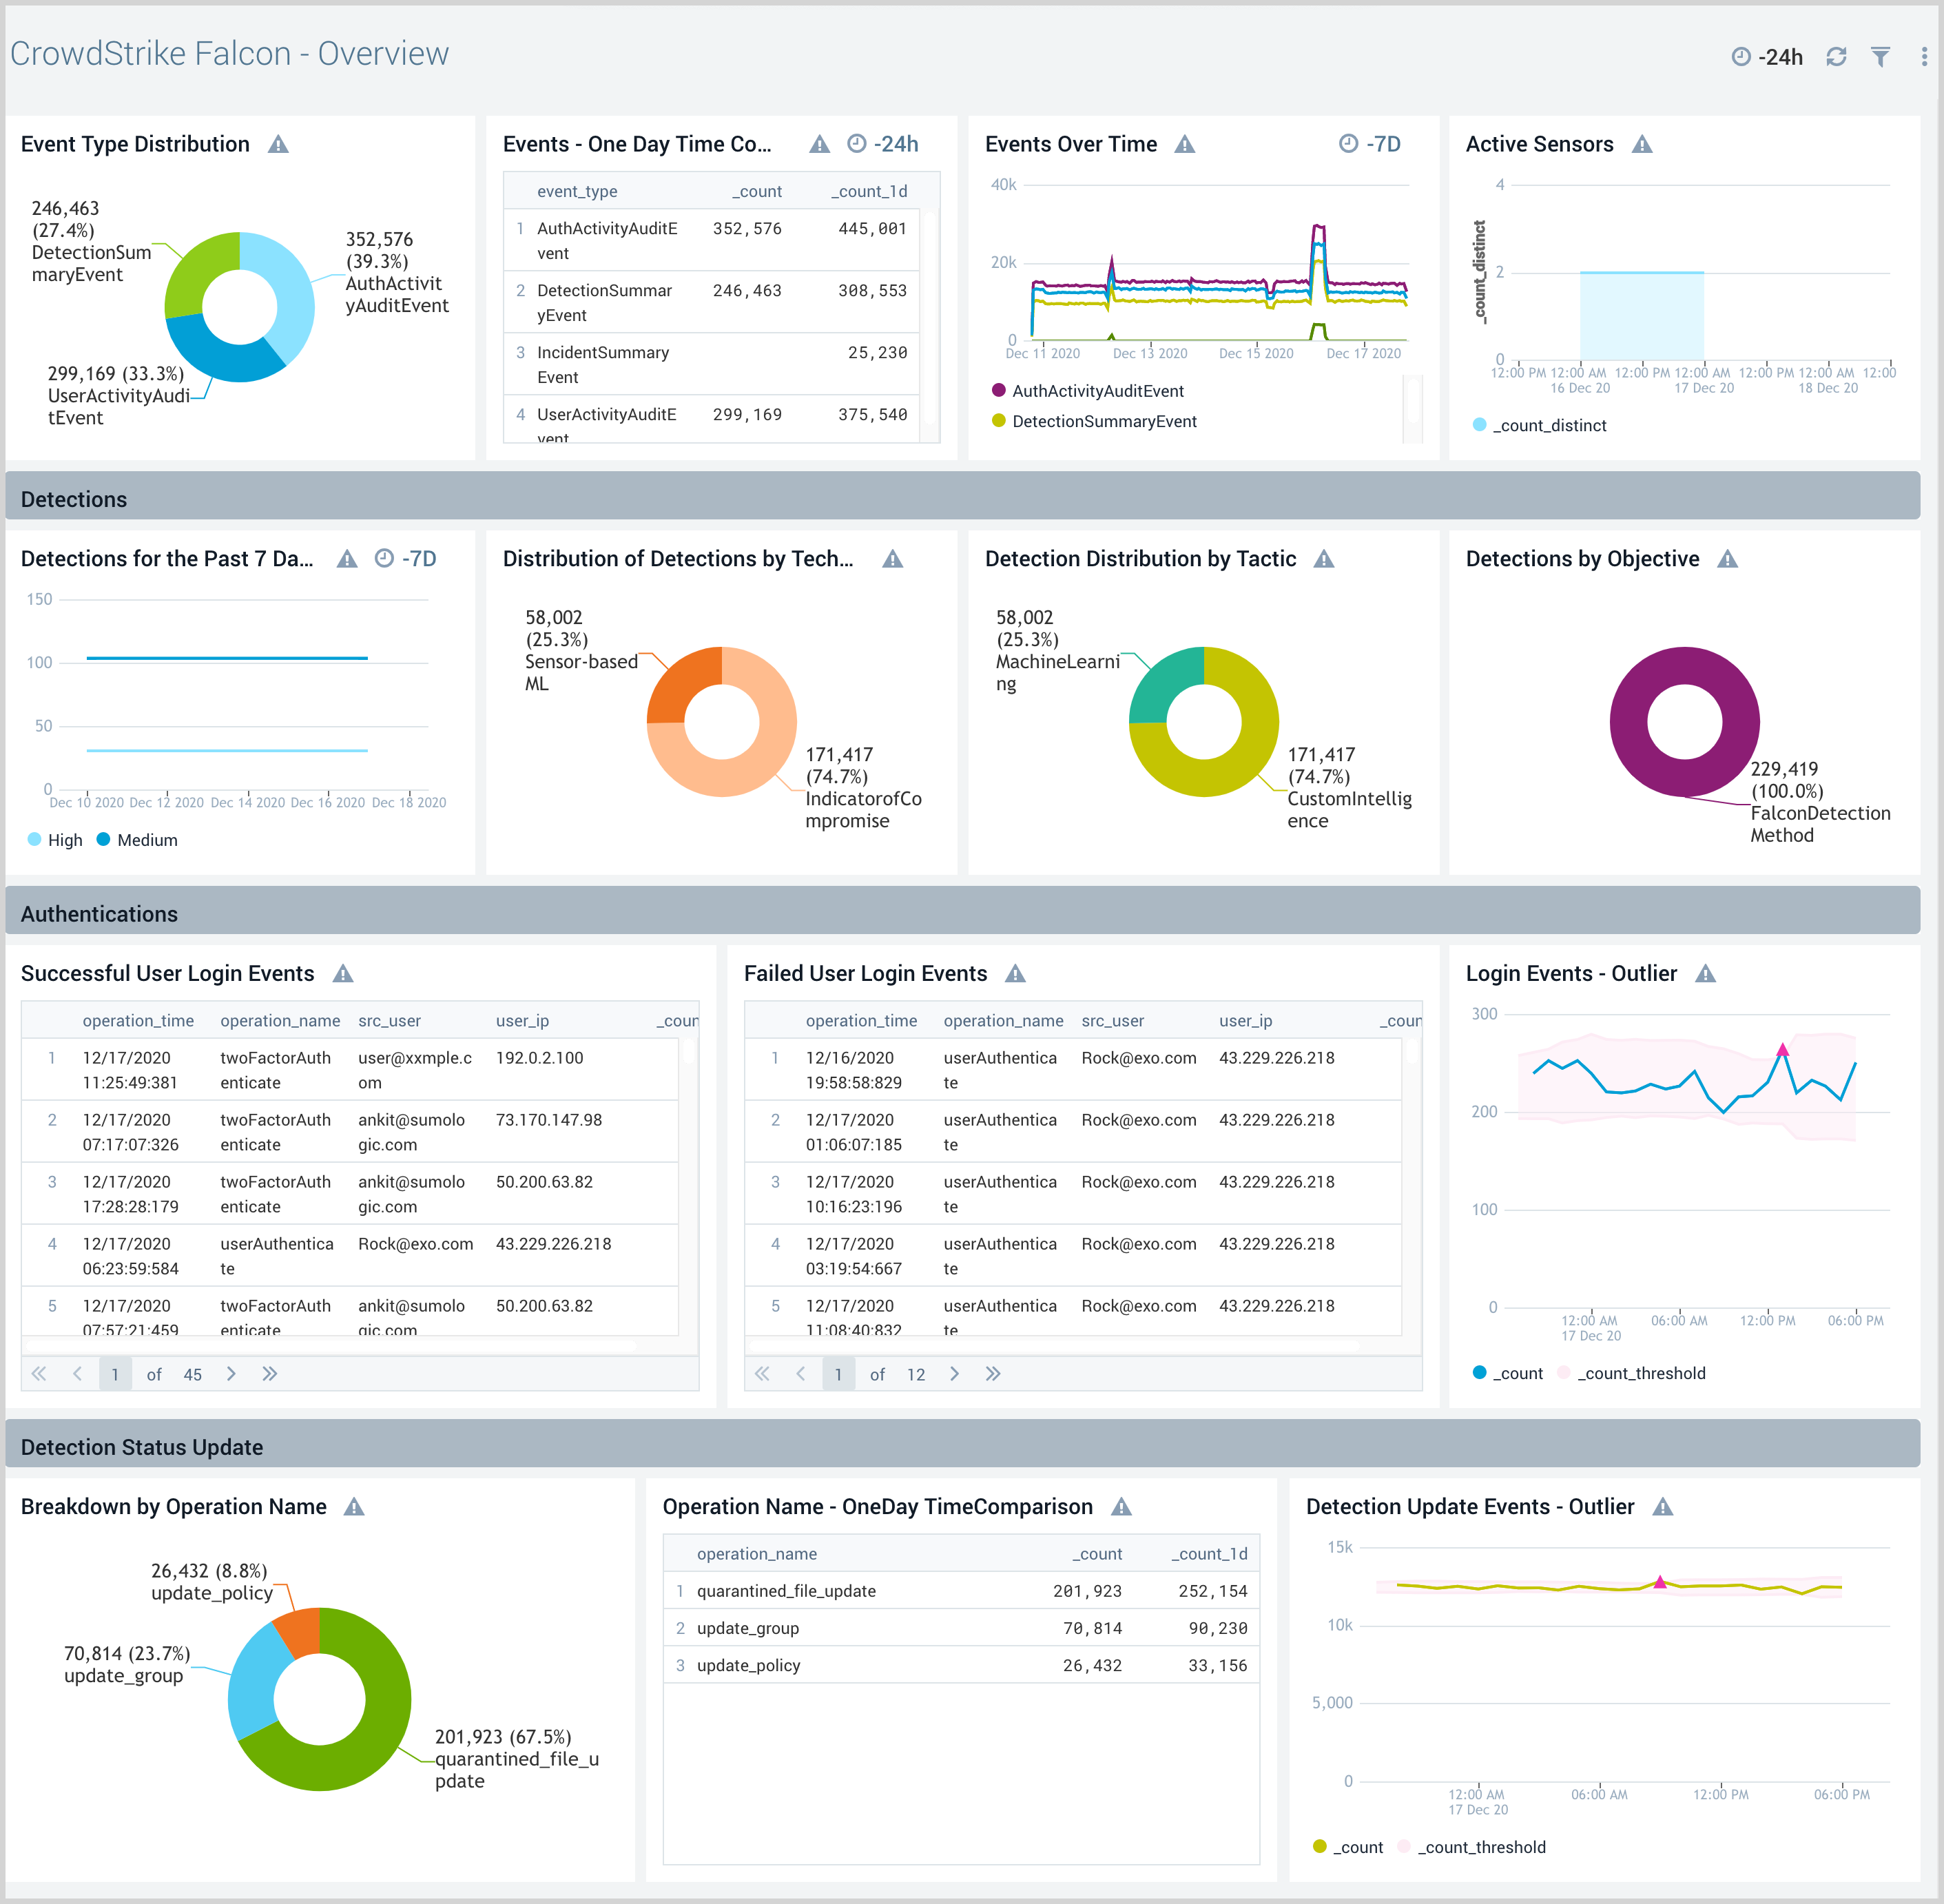
Authentication
The CrowdStrike Falcon - Authentication dashboard provides visibility into authentication-related user activities and their geographic locations. Panels also display detailed information for authentication comparisons and trends, requested auth secrets, 2-factor authentication, API client events, and failed events.
Use this dashboard to:
- Analyze user activities within your Falcon Console and the geographic location of the users responsible for these activities.
- Identify failed authentication events, user logins with and without 2-factor authentication.
- Detect OAuth2 API key access events.
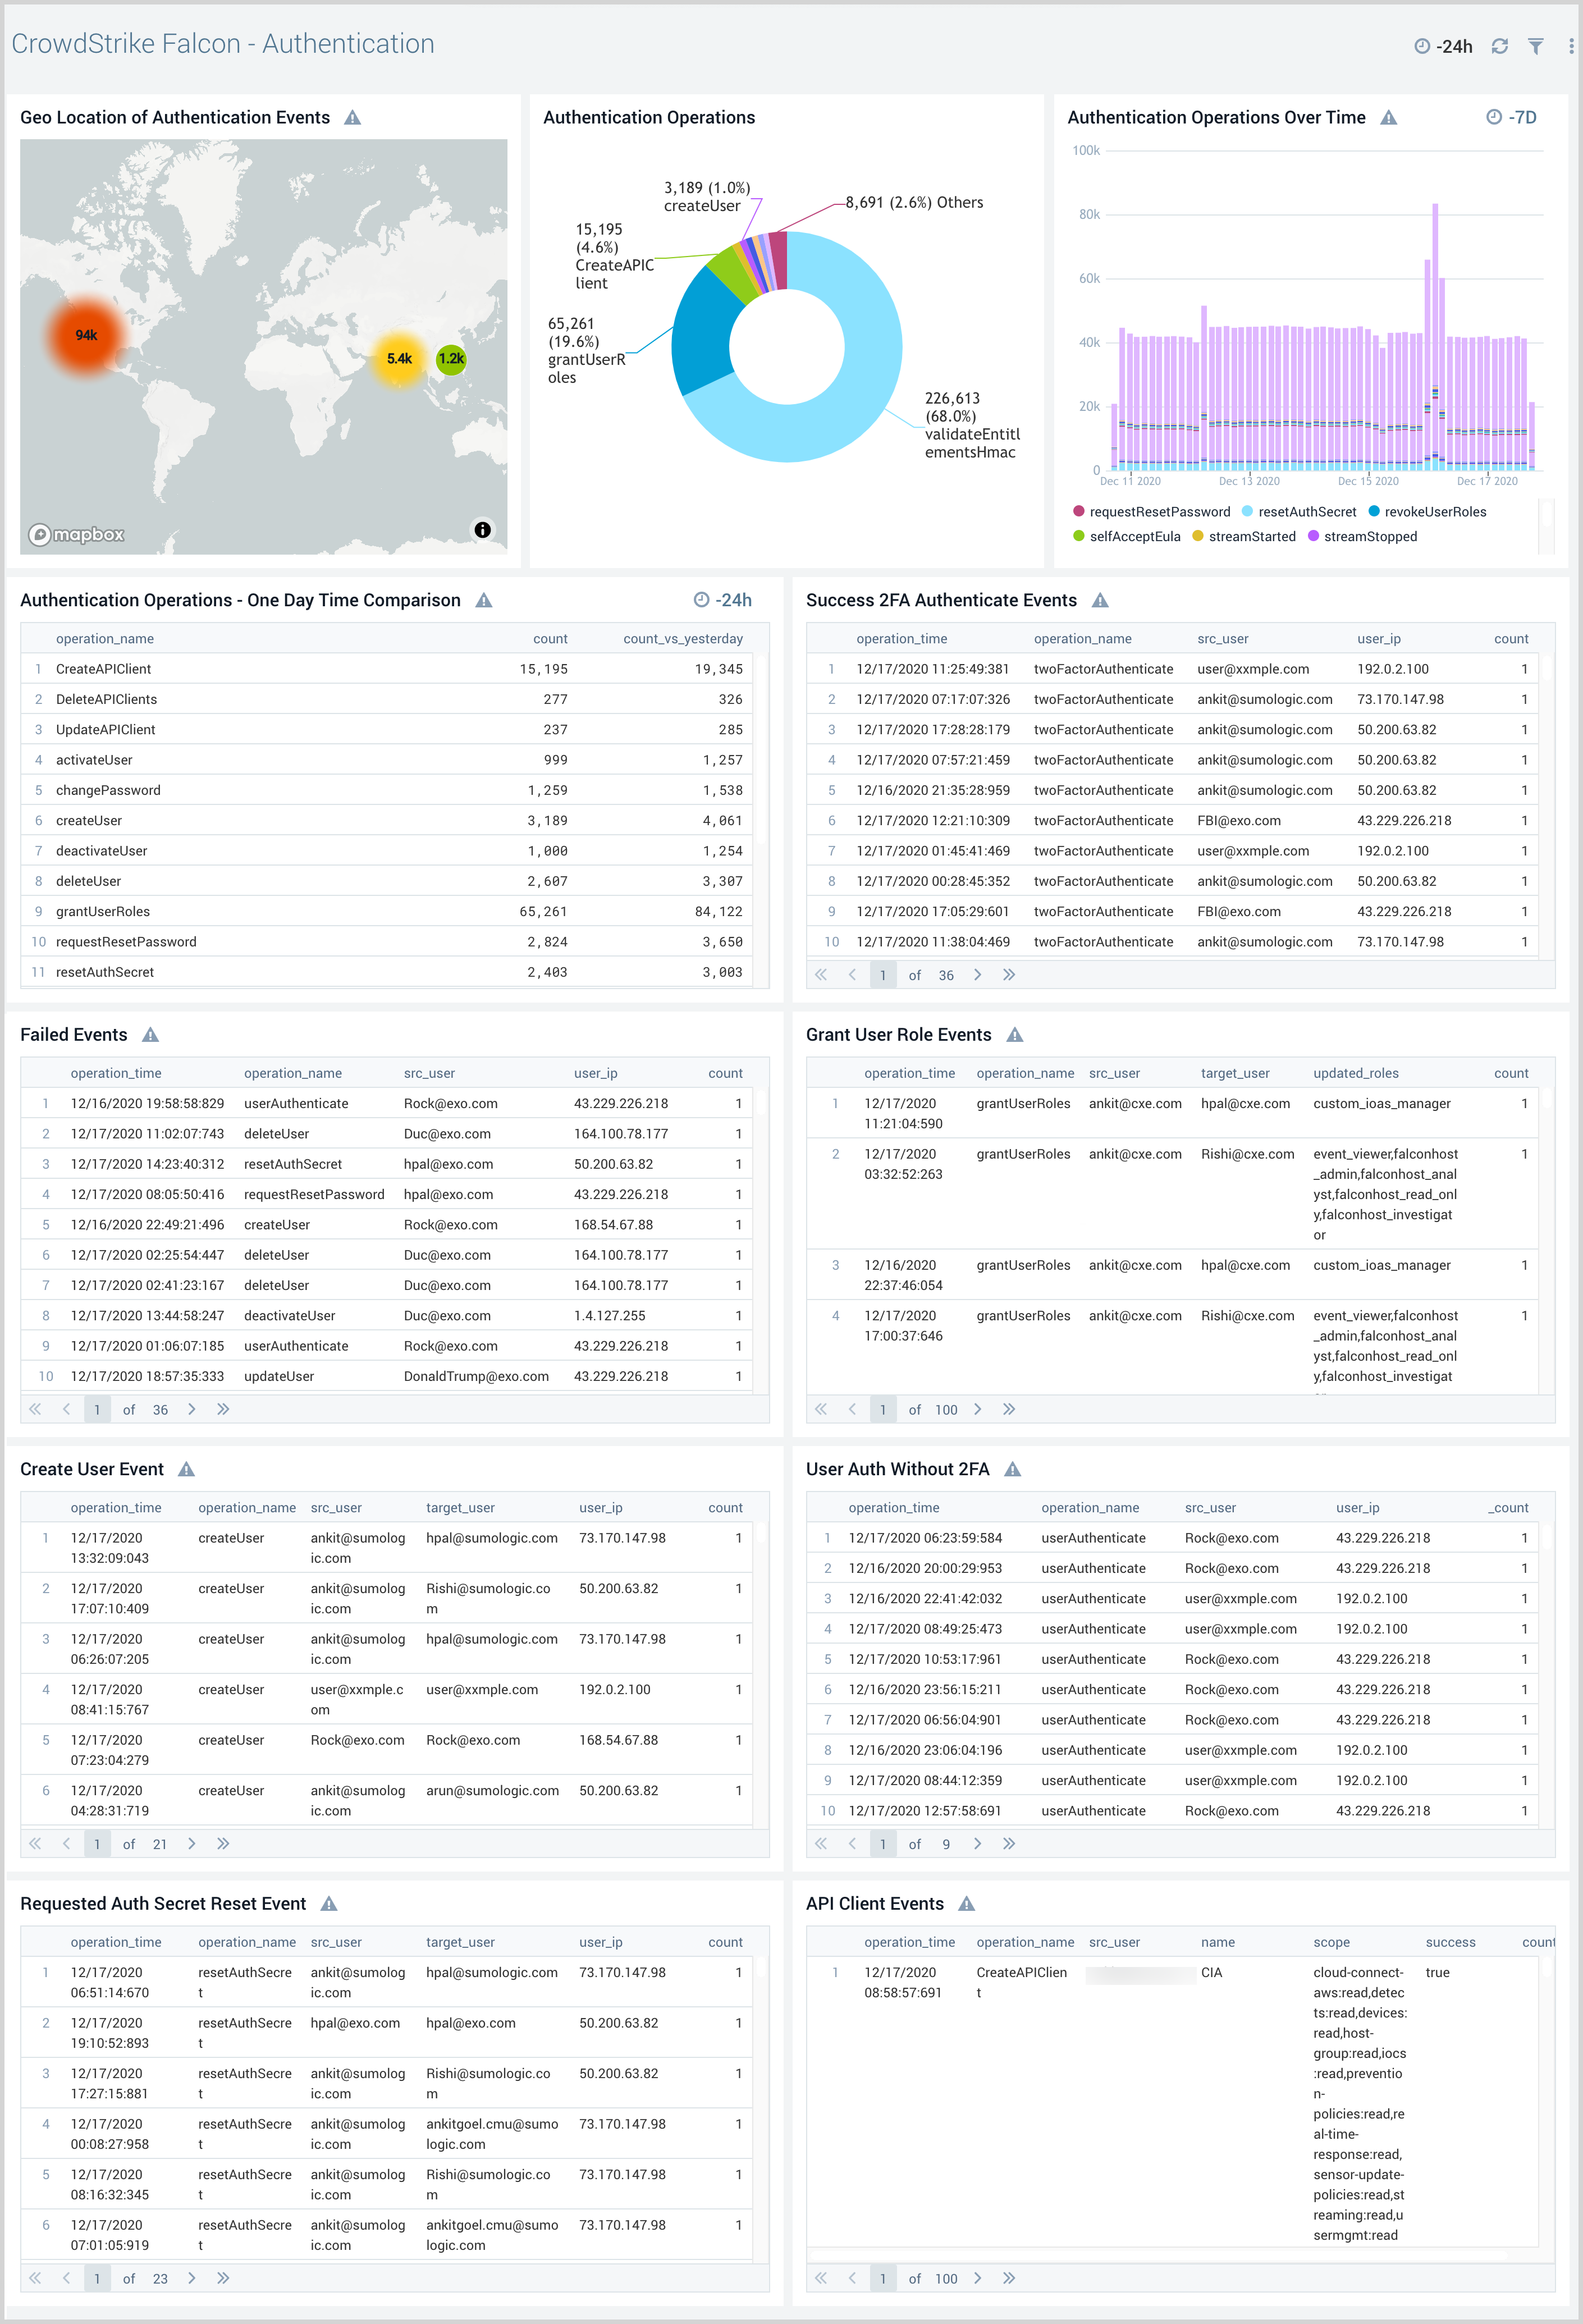
Detections
The CrowdStrike Falcon - Detections dashboard provides visibility into malicious behavior in your environment, where you can analyze group detections, discover blocked detections, and analyze detection trends by type. Panels also display a detailed analysis of detected malware and help quickly identify hosts with the most detected malware.
Use this dashboard to:
- Investigate malicious behavior across your endpoints.
- Analyze group detections by users, tactic, technique, and objective.
- Discover trending IOCs in your network.
- Identify malicious attempts that were blocked by CrowdStrike Falcon.
- Review detailed analysis of malware detected in the Detection Summary panel.
- Find hosts in your network with the most detected malware. Use pre-built links to go to the Falcon Console, so as to assign detection events and take action.
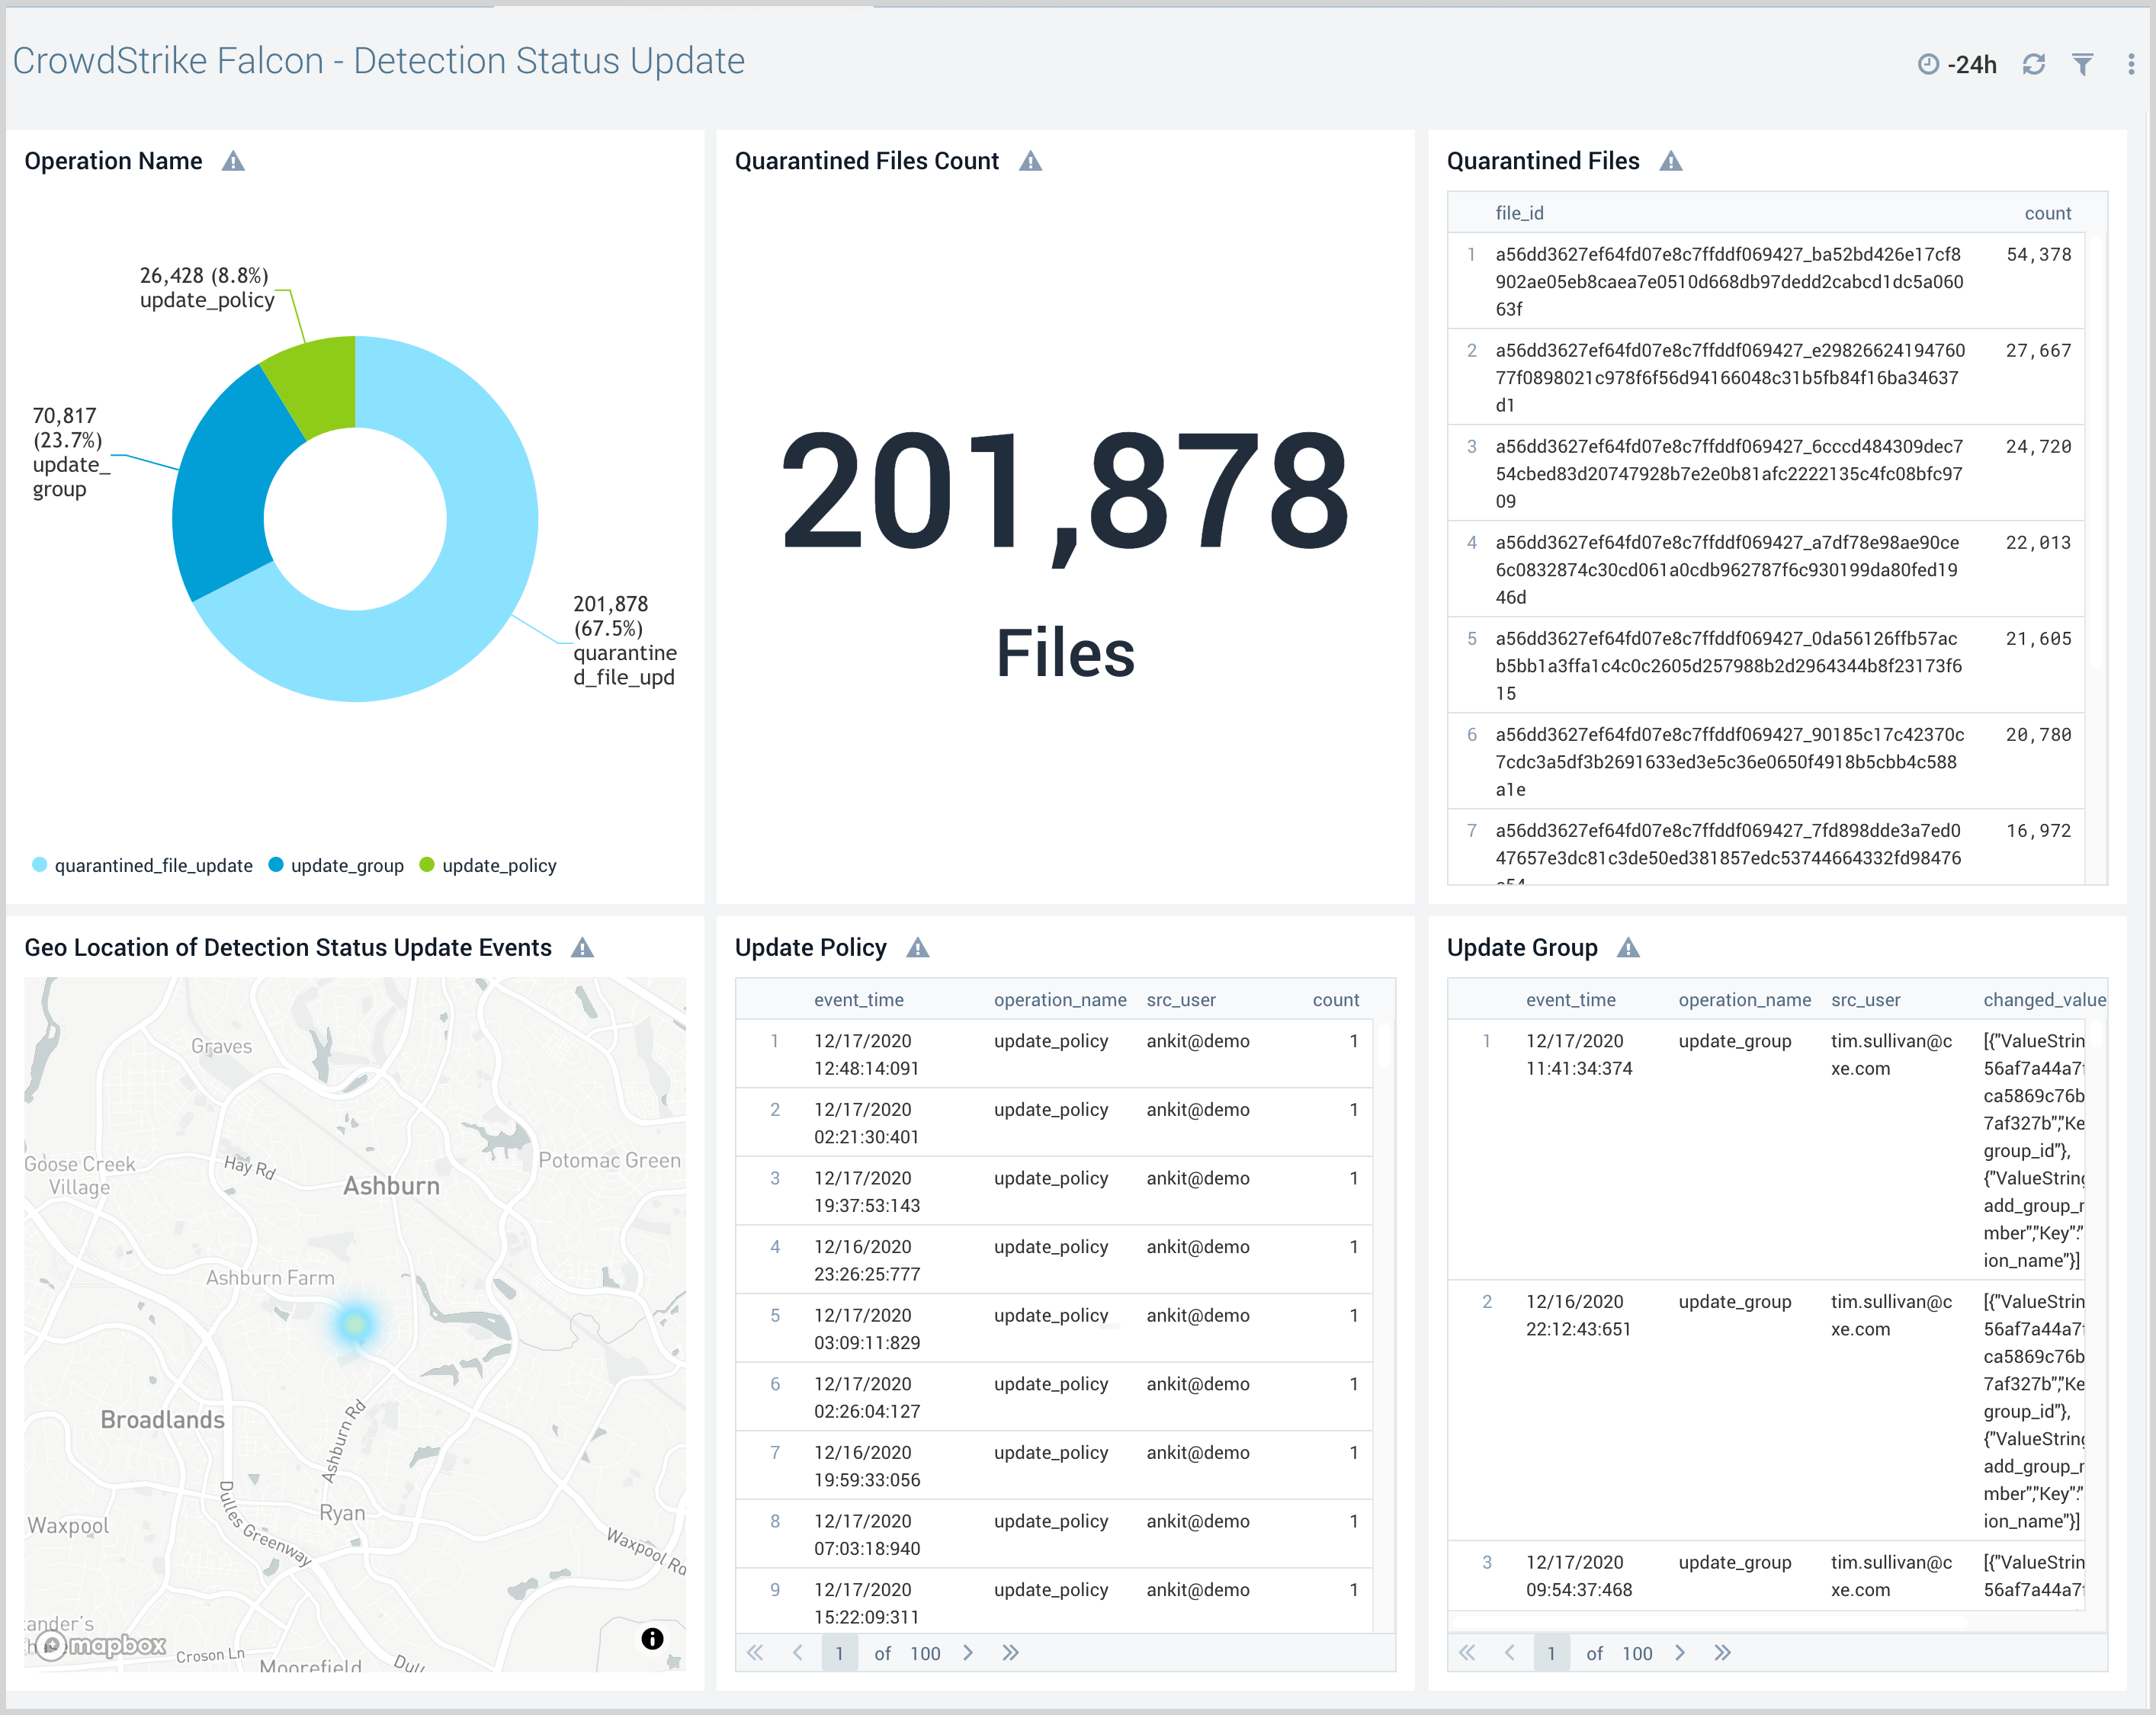
Detection Status Update
The CrowdStrike Falcon - Detection Status Update dashboard provides high-level and detailed insights into the status of severity event detection in your CrowdStrike environment. Panels display event geographic locations, event classification by operation, details on quarantined files, and updates on policies and groups.
Use this dashboard to:
- Find and analyze any updates to malware detections by CrowdStrike Falcon users.
- Identify quarantined files.
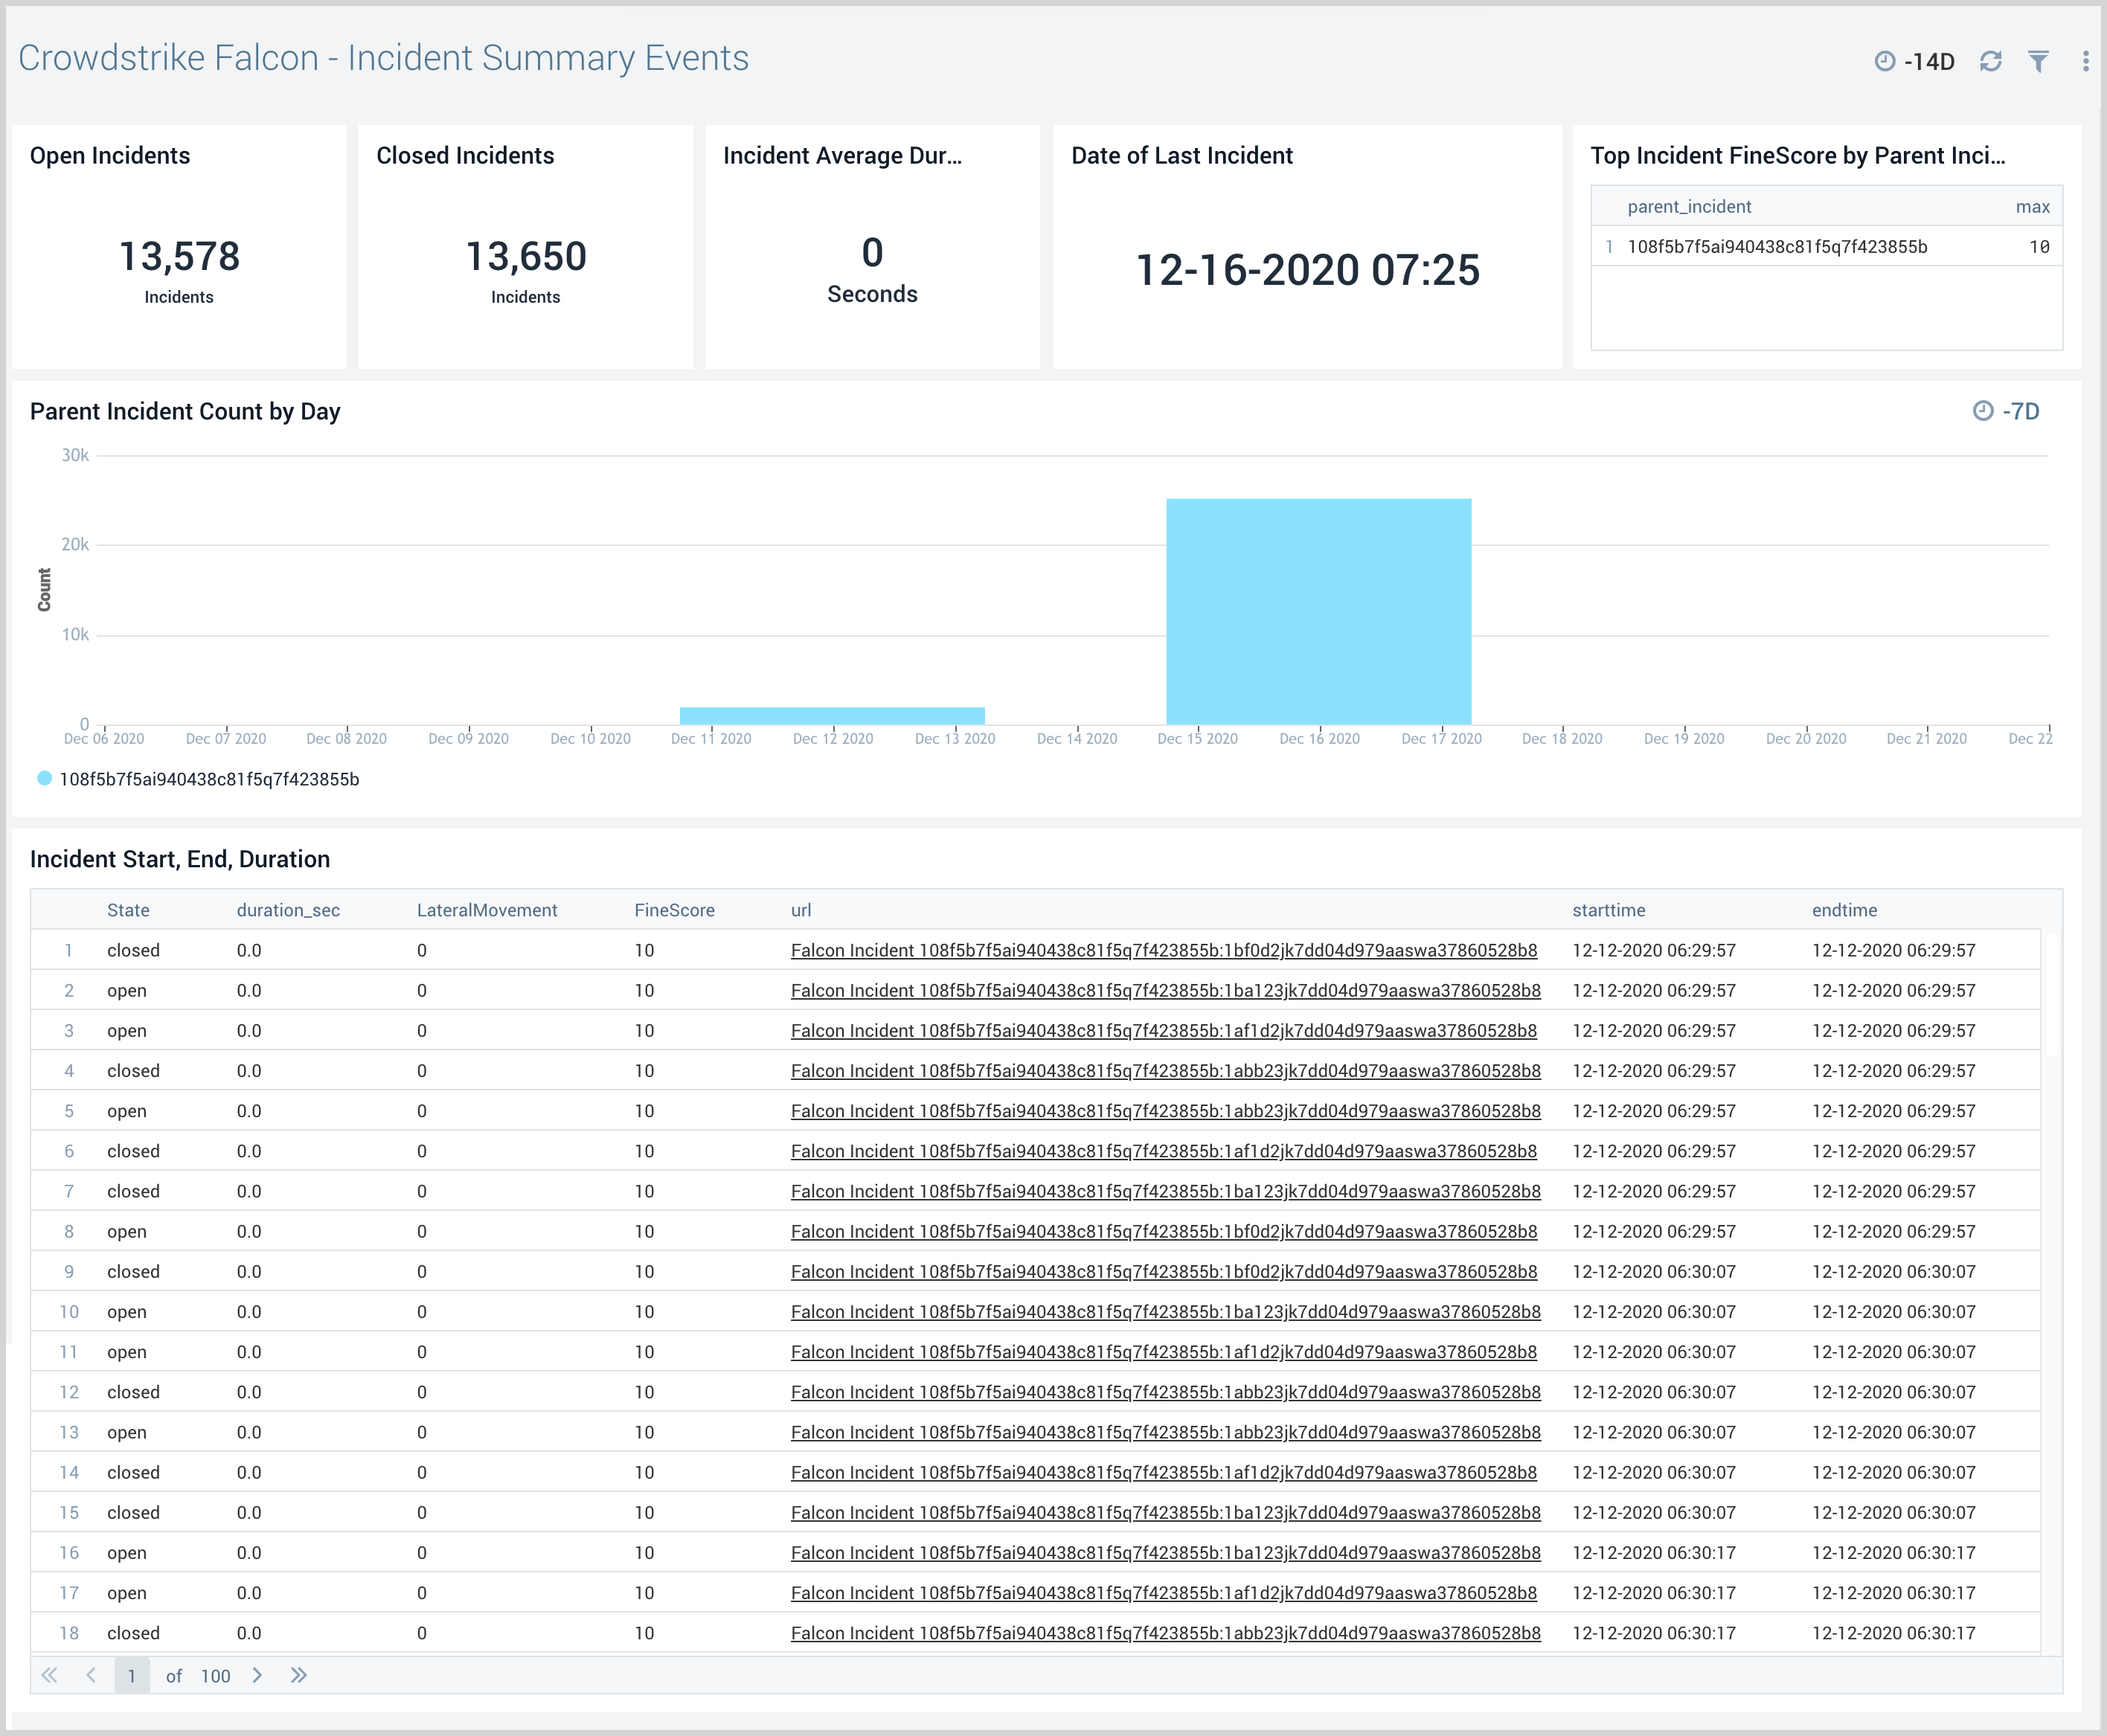
Incident Summary Events
30
The CrowdStrike - Falcon - Incident Summary Events dashboard provides visibility into Falcon incidents, event trends, and risk.
Use this dashboard to:
- Get an overview of incidents created and their risk.
- Identify unexpected events related to incidents by examining trends.
- Drill-down to the details of an incident using pre-built links in the CrowdStrike Falcon Console.
Upgrade/Downgrade the CrowdStrike Falcon Endpoint Protection app (Optional)
To update the app, do the following:
Next-Gen App: To install or update the app, you must be an account administrator or a user with Manage Apps, Manage Monitors, Manage Fields, Manage Metric Rules, and Manage Collectors capabilities depending upon the different content types part of the app.
- Select App Catalog.
- In the Search Apps field, search for and then select your app.
Optionally, you can identify apps that can be upgraded in the Upgrade available section. - To upgrade the app, select Upgrade from the Manage dropdown.
- If the upgrade does not have any configuration or property changes, you will be redirected to the Preview & Done section.
- If the upgrade has any configuration or property changes, you will be redirected to the Setup Data page.
- In the Configure section of your respective app, complete the following fields.
- Field Name. If you already have collectors and sources set up, select the configured metadata field name (eg _sourcecategory) or specify other custom metadata (eg: _collector) along with its metadata Field Value.
- Click Next. You will be redirected to the Preview & Done section.
Post-update
Your upgraded app will be installed in the Installed Apps folder and dashboard panels will start to fill automatically.
See our Release Notes changelog for new updates in the app.
To revert the app to a previous version, do the following:
- Select App Catalog.
- In the Search Apps field, search for and then select your app.
- To version down the app, select Revert to < previous version of your app > from the Manage dropdown.
Uninstalling the CrowdStrike Falcon Endpoint Protection app (Optional)
To uninstall the app, do the following:
- Select App Catalog.
- In the 🔎 Search Apps field, run a search for your desired app, then select it.
- Click Uninstall.