F5 BIG-IP Local Traffic Manager

The F5 - BIG-IP Local Traffic Manager (LTM) app helps you optimize and secure network traffic patterns coming into your data center using the F5 BIG-IP platform.
The Sumo Logic app for F5 - BIG-IP Local Traffic Manager (LTM) helps you optimize and secure network traffic patterns coming into your data center using the F5 BIG-IP platform. This app analyzes traffic flowing through the F5 Local Traffic Manager (LTM) and automatically detects threats using Sumo Logic Threat Intel. The Sumo Logic app for F5 - BIG-IP LTM provides pre-configured dashboards that allow you to monitor traffic details by application, facility, pool, active and non-responding hosts, connections, and logins. It also reports LTM CPU, disk usage, and outliers in LTM activities and traffic patterns.
Log types
The F5 - BIG-IP Local Traffic Manager (LTM) app uses event logs with payloads, as described in this document.
Sample log messages
{
    "event_source":"request_logging",
    "event_timestamp":"2019-01-01:01:01.000Z",
    "hostname":"hostname",
    "client_ip":"192.0.2.42",
    "server_ip":"",
    "http_method":"GET",
    "http_uri":"/",
    "virtual_name":"/Common/app.app/app_vs",
    "tenant":"Common",
    "application":"app.app",
    "telemetryEventCategory": "LTM"
}
Sample queries
The following query sample is from the F5 - BIG-IP LTM - Overview Dashboard, Pool Status panel.
_sourceCategory=f5/bigip/ltm  systemInfo
| json field=_raw "telemetryEventCategory"  as telemetryEventCategory
| json field=_raw "virtualServers"
| parse regex field=virtualServers "name\"\:\"(?<virtualServer_name>[\S]+?)\"" multi
| parse regex field=virtualServers "enabledState\"\:\"(?<enabledState>[\S]+?)\"" multi
| parse regex field=virtualServers "application\"\:\"(?<application>[\S]+?)\"" multi
| parse regex field=virtualServers "availabilityState\"\:\"(?<availabilityState>[\S]+?)\"" multi
| parse regex field=virtualServers "tenant\"\:\"(?<tenant>[\S]+?)\"" multi
| parse regex field=virtualServers "pool\"\:\"(?<pool>[\S]+?)\"" multi
| parse regex field=virtualServers "destination\"\:\"(?<destination>[\S]+?)\"" multi
| parse regex field=virtualServers "clientside.curConns\"\:(?<current_connections>[\S]+?)\," multi
| parse regex field=virtualServers "clientside.bitsOut\"\:(?<client_bits_out>[\S]+?)\," multi
| count by virtualServer_name, pool, application, enabledState, availabilityState
Collecting logs for the F5 - BIG-IP LTM app
This section provides instructions for collecting logs for the F5 - BIG-IP LTM App, as well as a sample log message and query sample.
Collection overview
The following image provides a high-level view of the F5 - BIG-IP LTM collection process using the Telemetry Streaming.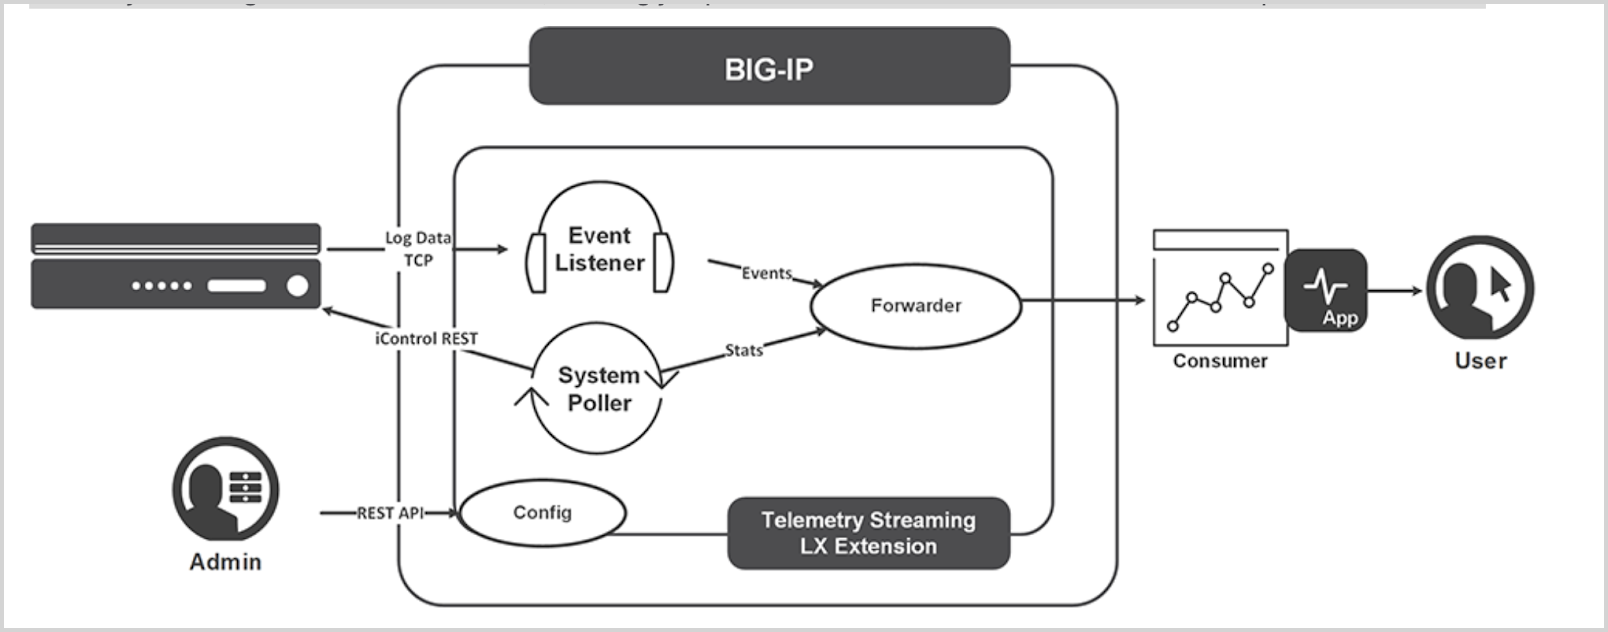
Telemetry Streaming (TS) is a software RPM file. Installing it on BIG-IP enables you to declaratively aggregate, normalize, and forward statistics and events from the BIG-IP to a consumer application by posting a single TS JSON declaration to TS’s declarative REST API endpoint.
Telemetry Streaming uses a declarative model, meaning you provide a JSON declaration rather than a set of imperative commands. For more information on Telemetry Streaming, see here.
Configure log collection for the F5 - BIG-IP LTM app
Prerequisite
- Install AS3 RPM. The Application Services 3 (AS3) extension is a mechanism for declaratively configuring application-specific resources on a BIG-IP system. This involves posting a JSON declaration to the system’s API endpoint,
https://< BIG-IP>/mgmt/shared/appsvcs/declare. - Install Telemetry Streaming RPM (download from here).
- Login to F5 (user admin, password from the above output), navigate to the Main tab, iApps > Package Management LX > Import.
- Select the downloaded file and click Upload to upload Telemetry Streaming RPM. For more information on installing TS RPM, see here.
- Enable AVR. To enable the AVR, follow the steps below:
- Go to System > Resource Provisioning.
- Enable Application Visibility and Reporting (AVR)
- Click Submit.
Collection Setup
Perform the following tasks to configure log collection for the F5 - BIG-IP LTM App.
Step 1: Create a Sumo Logic Hosted Collector
- Configure a Hosted Collector in Sumo Logic using these instructions.
- Add an HTTP source, configuring the Source Category with the string f5 in it (e.g., “f5/ltm”). Make a note of the URL for the HTTP source, as you will need it in the following steps. The URL for our example is:
https://collectors.us2.sumologic.com/receiver/v1/http/test-endpoint.
Step 2: Use AS3 Declarative language to define a logging profile on BIG-IP
Download AS3Listener.json from here, and we will use it to define the logging profile on BIG IP.
Use the following curl command to set logging profile at BIG-IP. Replace BIG-IP PWD, BIG-IP IP, and PORT in the following command:
curl -k --user admin:<BIG-IP PWD> -H "Accept: application/json" -H "Content-Type:application/json" -X POST -d@AS3Listener.json https://<BIG-IP IP>:<PORT>/mgmt/shared/appsvcs/declare | python -m json.tool
Step 3: Sumo Logic Consumer Set up using Telemetry
Download the Sumo Logic sumo.json here, and replace SUMOLOGIC_HOST and SUMOLOGIC_SECRET_KEY with values from Sumo Logic HTTP URL created in step 1.
Example: For the Sumo Logic HTTP URL https://collectors.us2.sumologic.com/receiver/v1/http/test-endpoint, the above values are as follows:
SUMOLOGIC_HOST.collectors.us2.sumologic.comSUMOLOGIC_SECRET_KEY.test-endpoint
Now, using telemetry, we will define a Sumo Logic sink. This will enable us to forward statistics and events from the BIG-IP to Sumo Logic. Use the following curl command and replace BIG-IP PWD, BIG-IP IP, and PORT.
curl -k --user admin:<BIGIP PWD> -H "Accept: application/json" -H "Content-Type:application/json" -X POST -d@sumo.json https://<BIG-IP IP>:<PORT>3/mgmt/shared/telemetry/declare | python -m json.tool
Contact F5 support team if the above curl commands return an error.
Step 4: Associate logging profiles with virtual servers
To begin collecting telemetry, the logging profiles (LTM and ASM) created by AS3 in step 2 need to be assigned to the BIG-IP virtual server(s).
Follow the below steps to associate LTM logging profile:
- From the BIG-IP console UI, navigate to Local Traffic > Virtual Servers > Virtual Server List.

- Select and open the virtual server(s) to update their properties. In the Configuration dropdown, change the virtual server configuration setting from Basic to Advanced to expose the logging properties.

- In the Request Logging Profile, select the previously created LTM logging profile to the virtual server(s).

- Click Update to save the changes.
Follow the below steps to associate ASM logging profile:
- After assigning the LTM logging profile to the virtual server, navigate to the Security tab and select Policies to access the virtual server’s security policy settings.

- In the Log Profile, enable logging and assign the previously created ASM logging profile.

- Click Update to save the configuration changes.
Installing the F5 - BIG-IP LTM app
To install the app, do the following:
Next-Gen App: To install or update the app, you must be an account administrator or a user with Manage Apps, Manage Monitors, Manage Fields, Manage Metric Rules, and Manage Collectors capabilities depending upon the different content types part of the app.
- Select App Catalog.
- In the 🔎 Search Apps field, run a search for your desired app, then select it.
- Click Install App.
note
Sometimes this button says Add Integration.
- Click Next in the Setup Data section.
- In the Configure section of your respective app, complete the following fields.
- Field Name. If you already have collectors and sources set up, select the configured metadata field name (eg _sourcecategory) or specify other custom metadata (eg: _collector) along with its metadata Field Value.
- Click Next. You will be redirected to the Preview & Done section.
Post-installation
Once your app is installed, it will appear in your Installed Apps folder, and dashboard panels will start to fill automatically.
Each panel slowly fills with data matching the time range query received since the panel was created. Results will not immediately be available but will be updated with full graphs and charts over time.
Viewing F5 - BIG-IP LTM dashboards
All dashboards have a set of filters that you can apply to the entire dashboard. Use these filters to drill down and examine the data to a granular level.
- You can change the time range for a dashboard or panel by selecting a predefined interval from a drop-down list, choosing a recently used time range, or specifying custom dates and times. Learn more.
- You can use template variables to drill down and examine the data on a granular level. For more information, see Filtering Dashboards with Template Variables.
- Most Next-Gen apps allow you to provide the scope at the installation time and are comprised of a key (
_sourceCategoryby default) and a default value for this key. Based on your input, the app dashboards will be parameterized with a dashboard variable, allowing you to change the dataset queried by all panels. This eliminates the need to create multiple copies of the same dashboard with different queries.
Overview
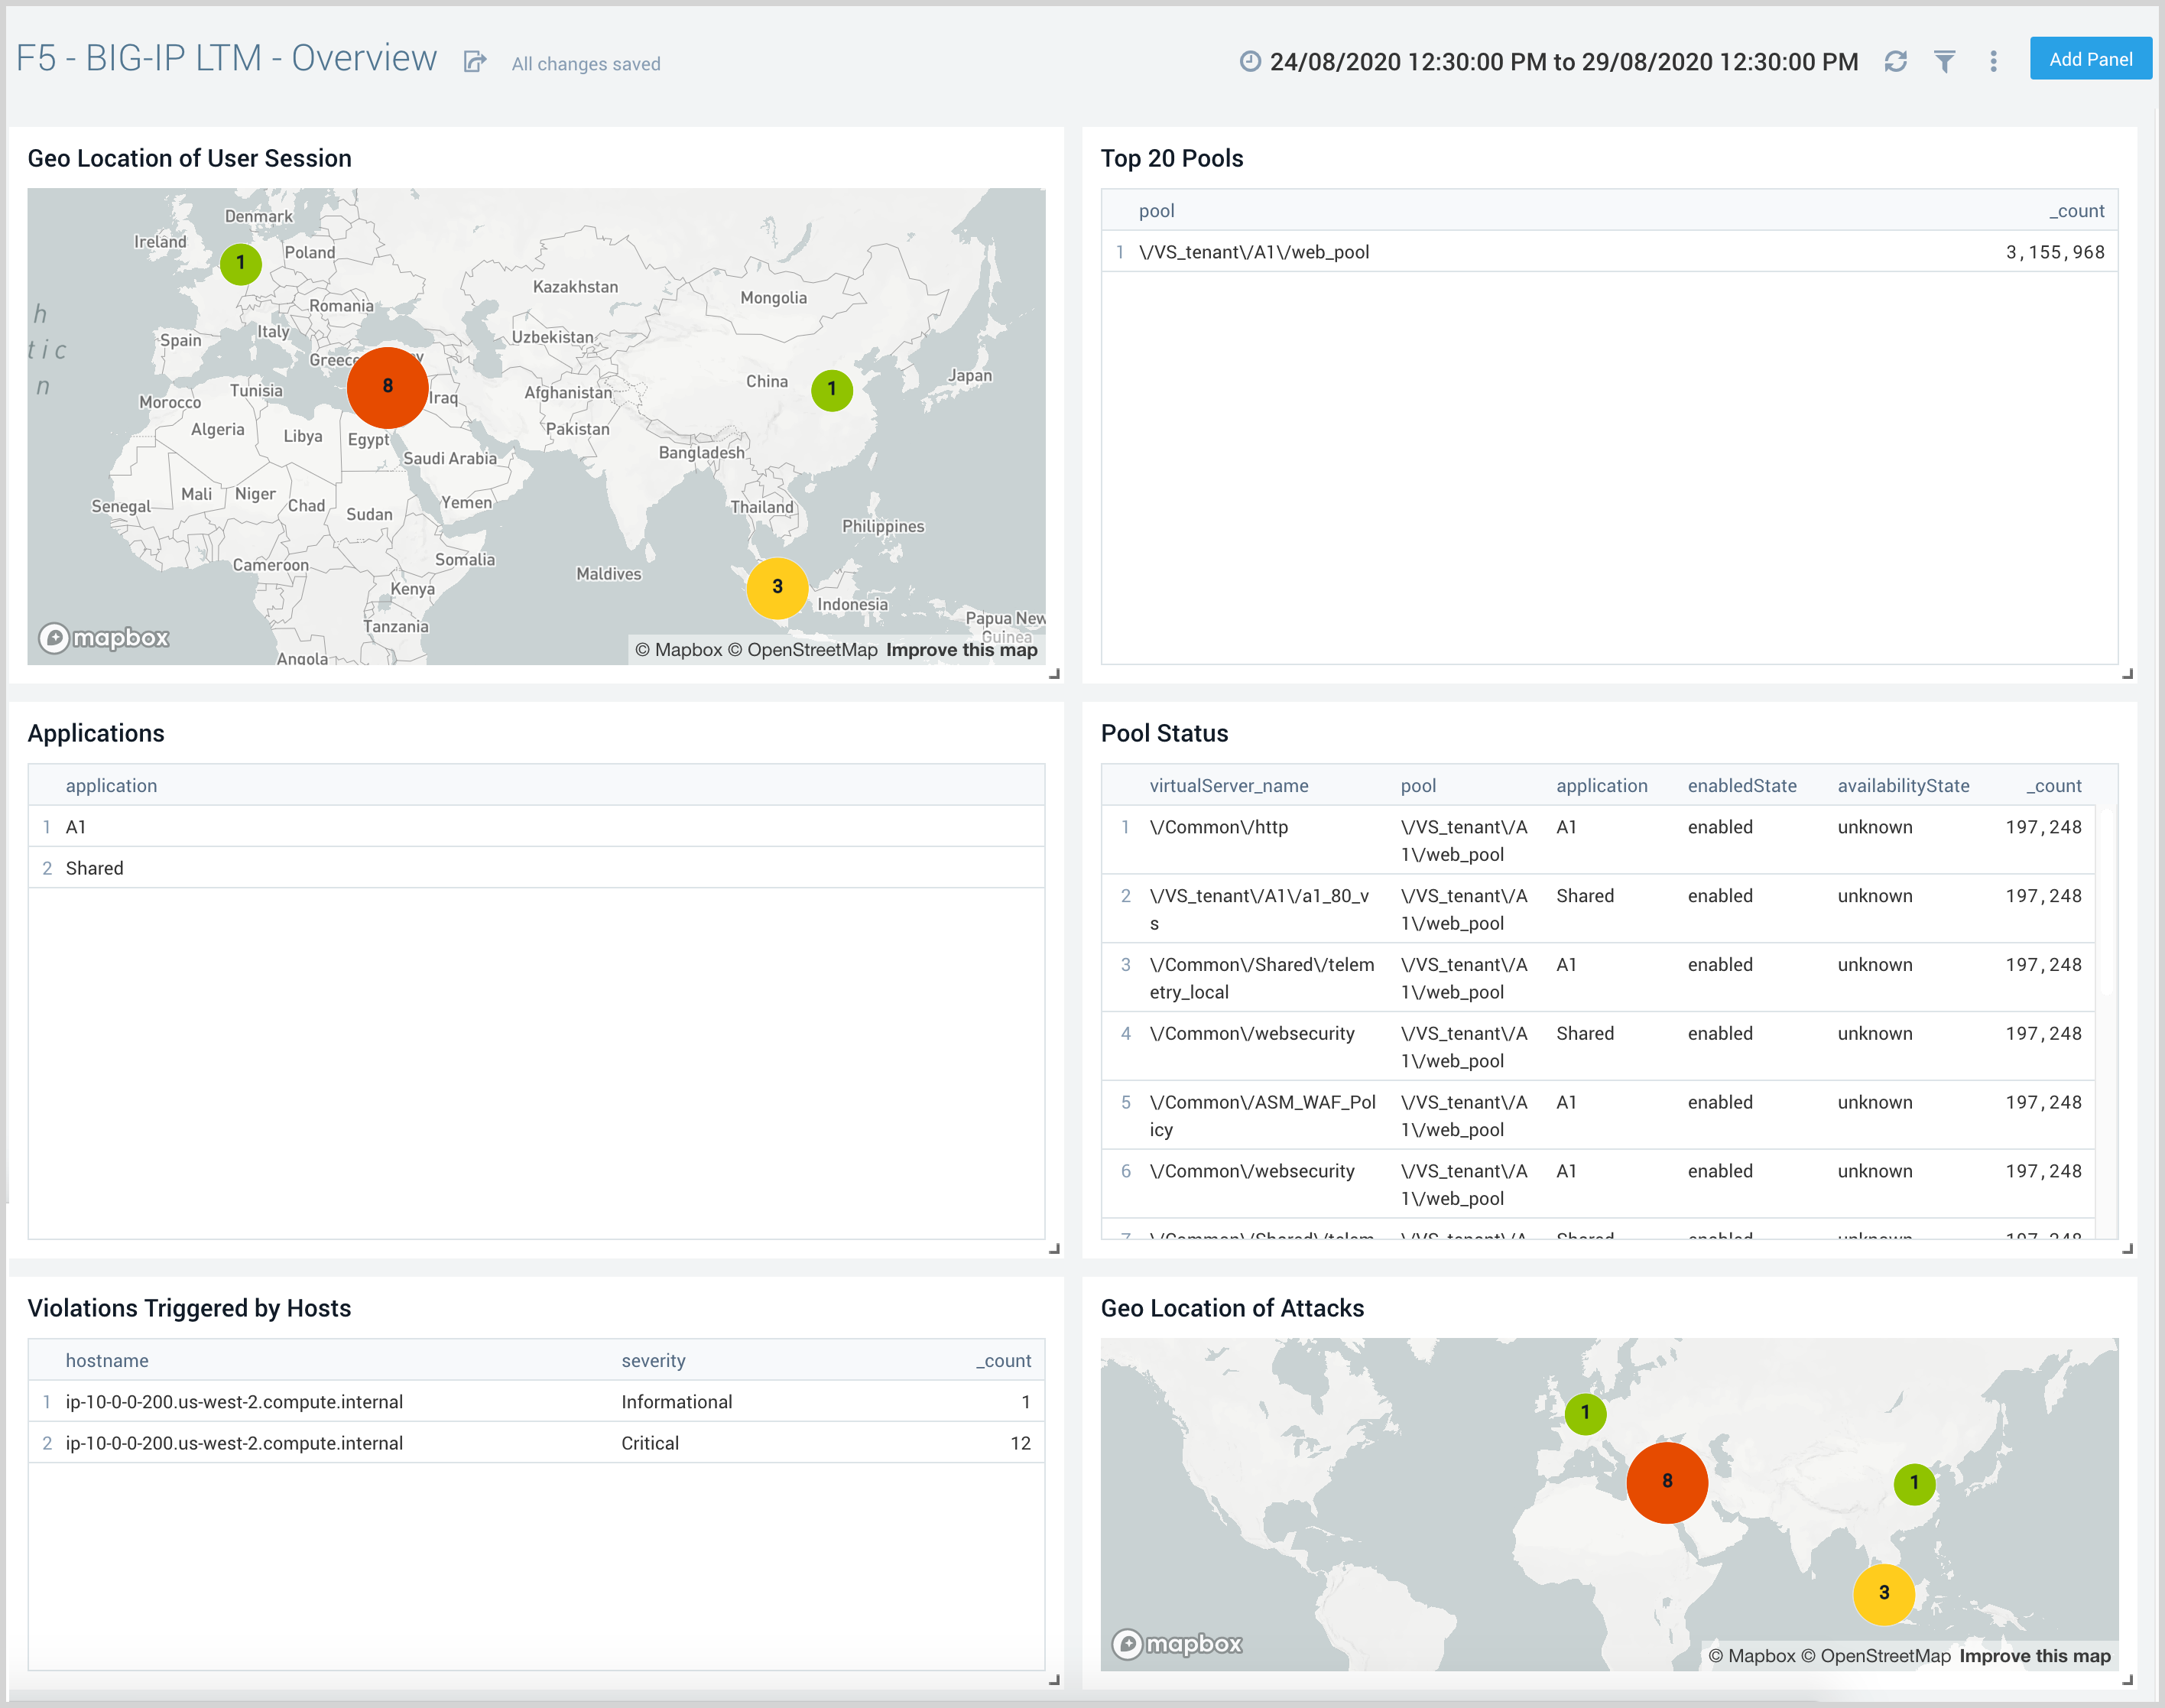
The F5 - BIG-IP LTM - Overview dashboard provides details on the network traffic for applications, pools, and its status. It also provides information about violations triggered and their geo-location.
Use this dashboard to:
- View geographic locations of incoming client requests.
- Get a high-level view of top pools, pool status, and pool names by the application.
- Review applications responsible for network traffic, their facilities, as well as profiles per virtual server by the application.
Threat Analysis
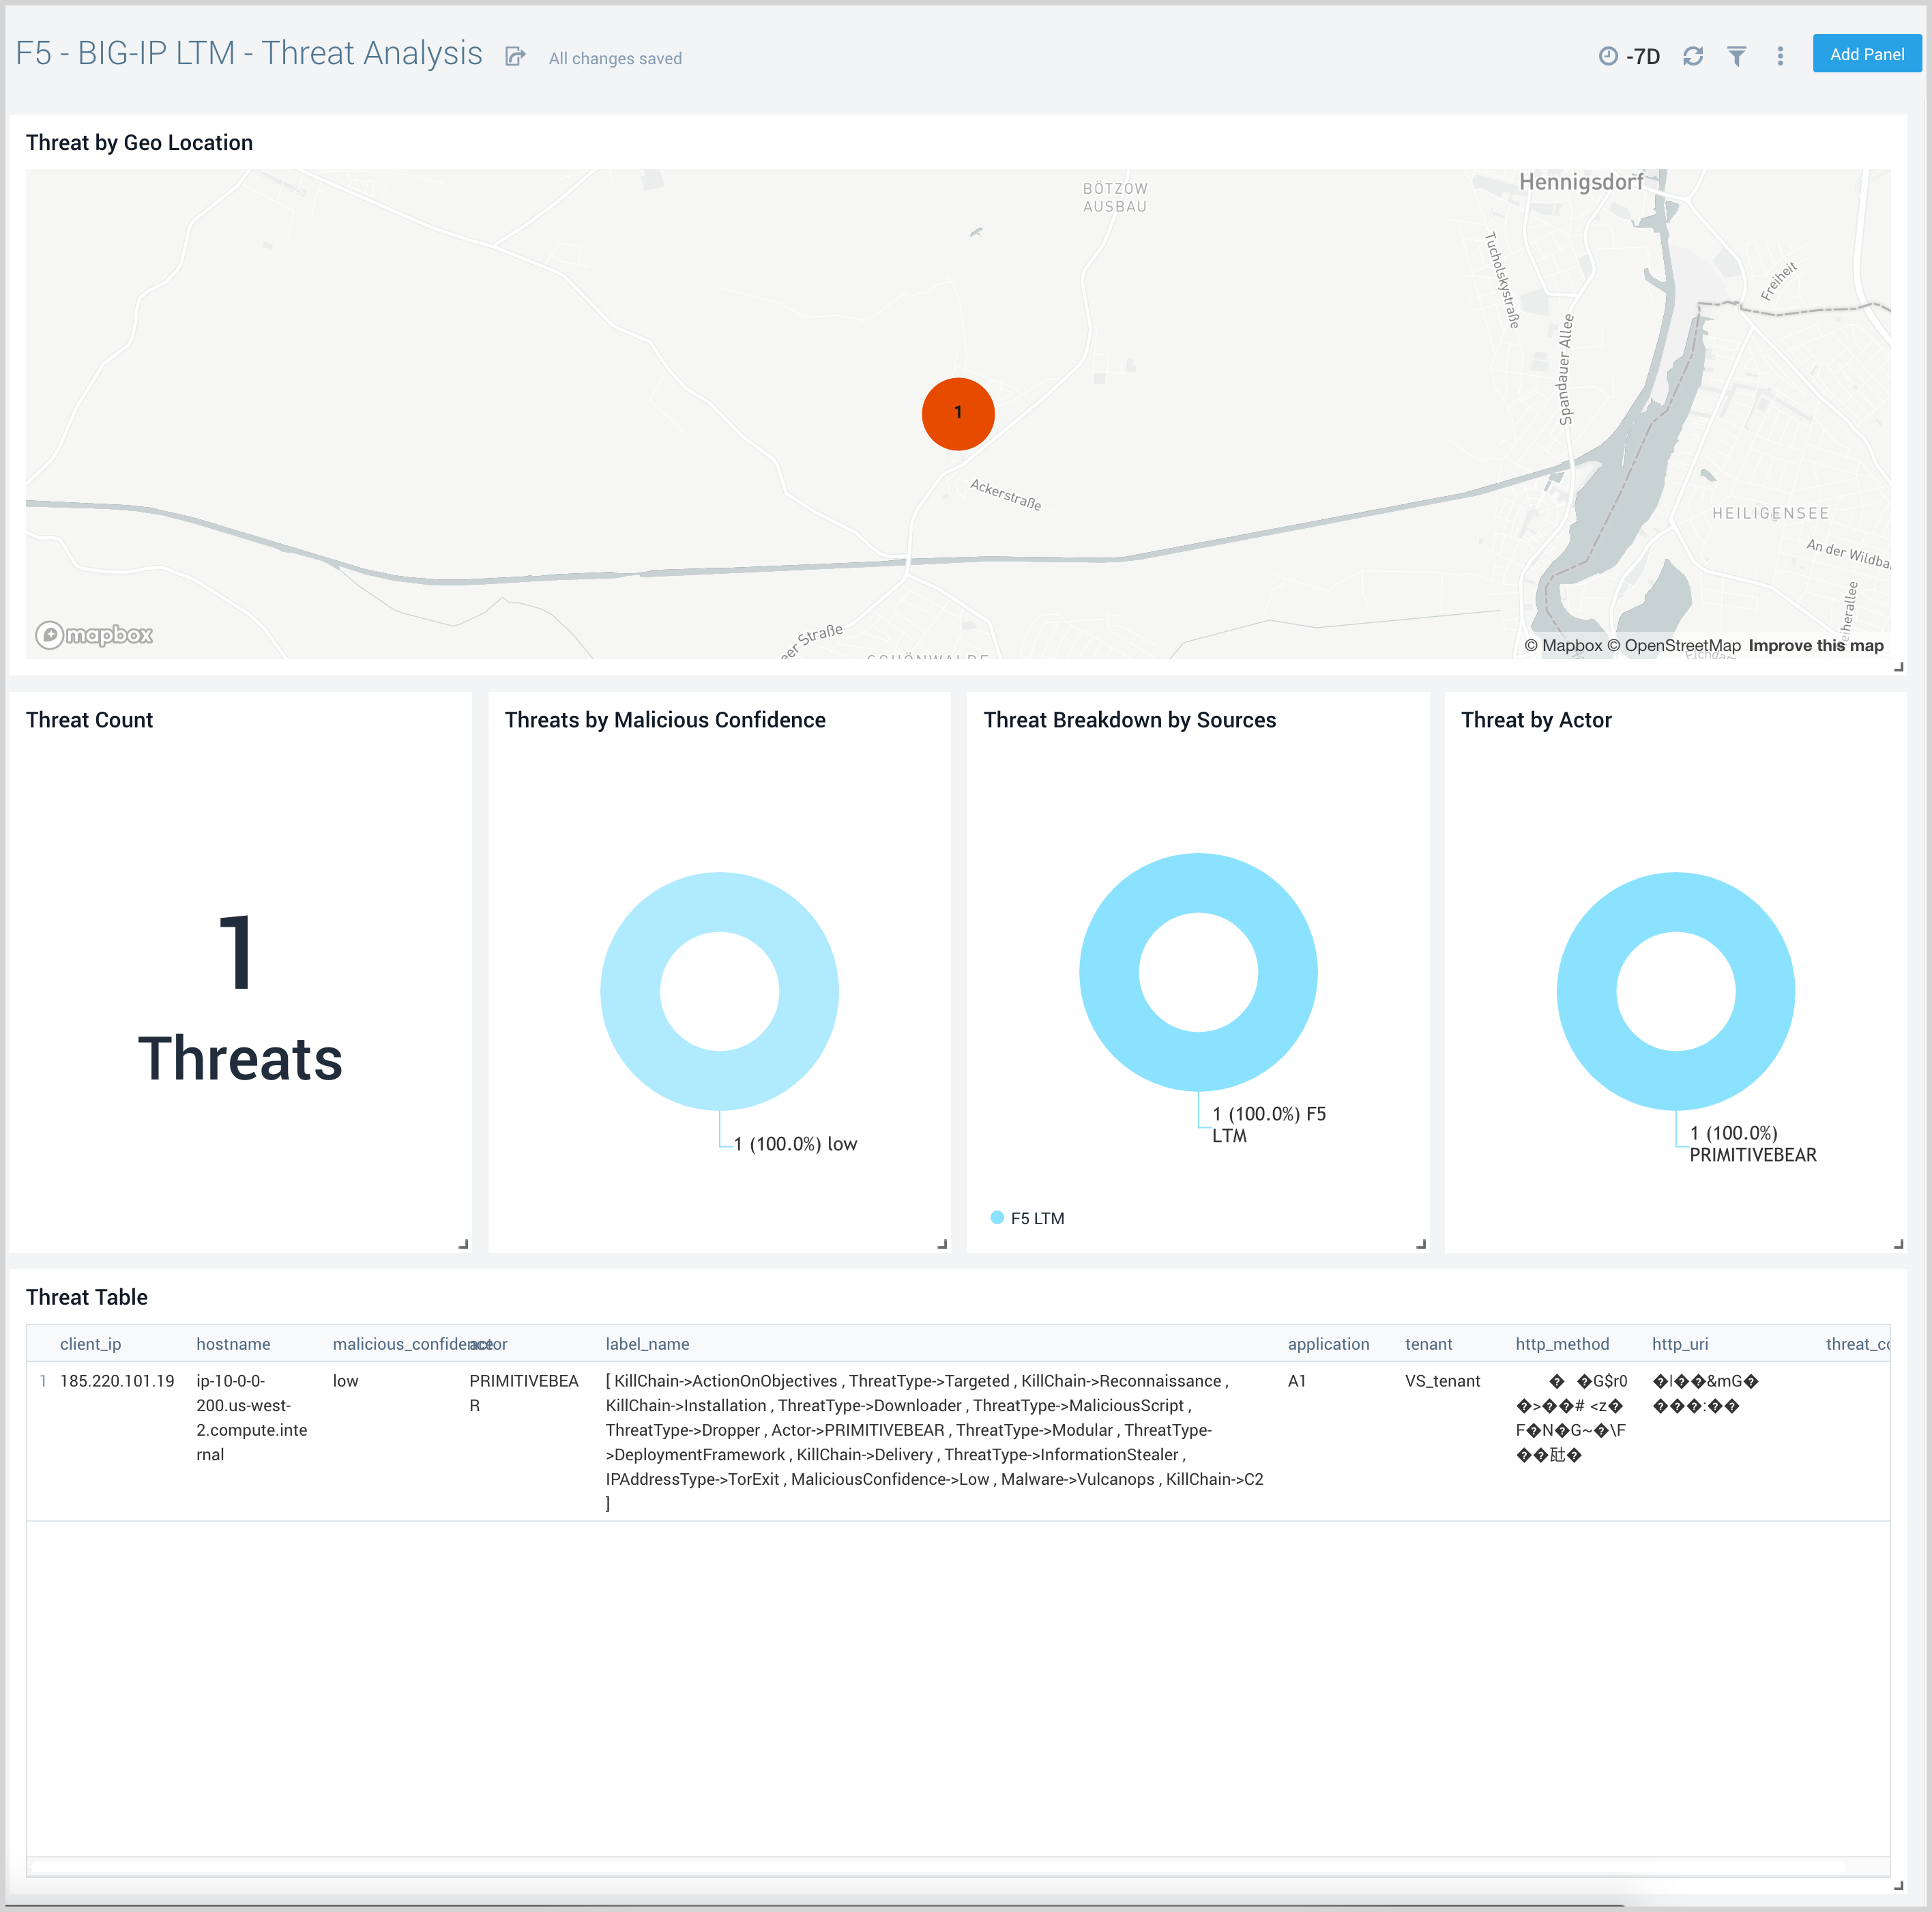
the F5 - BIG-IP LTM - Threat Analysis dashboard provides an overview of the number of threats, their geographic location, and a breakdown by source using the Threat Intel app. This dashboard also provides details on the severity of threats, as well as the network, user name, and country of origin.
Use this dashboard to:
- Review details on potential threats and IOCs for incoming requests to F5 LTM.
- See the frequency of IP threats by actor, log source, and malicious confidence.
- View trends over time.
Metrics and Connections
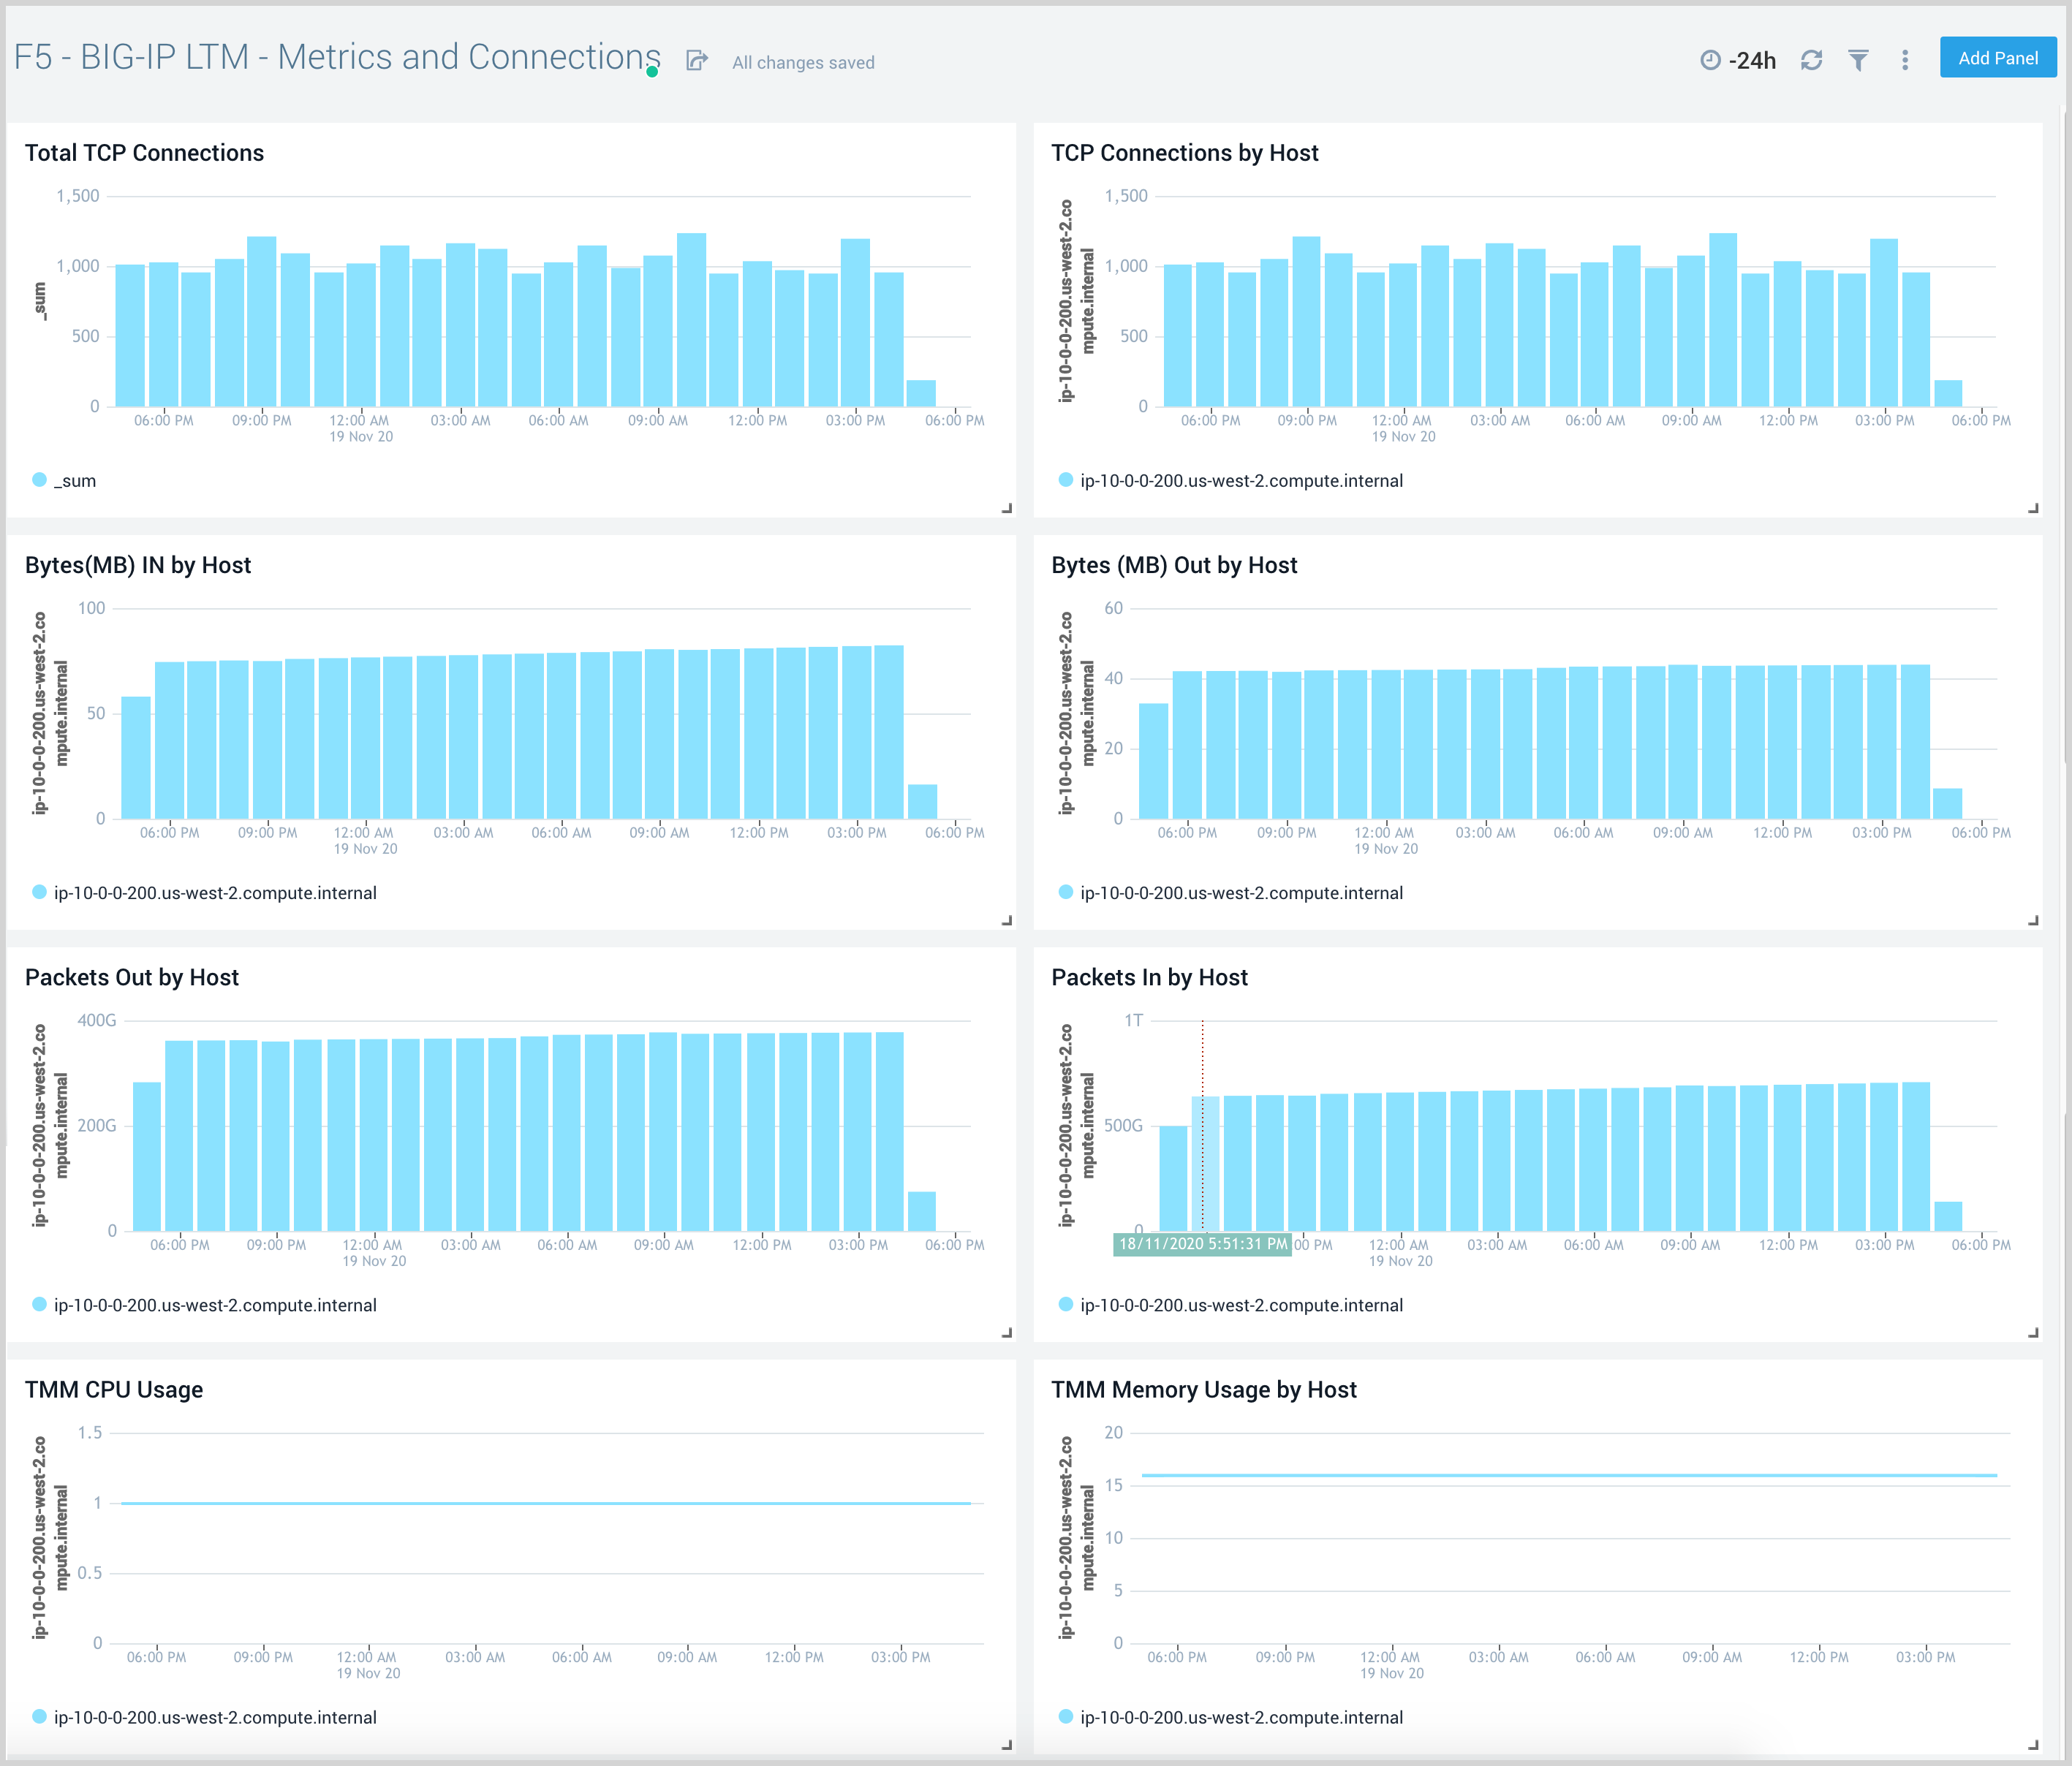
The F5 - BIG-IP LTM - Metrics and Connections dashboard provides an at-a-glance view of TCP connections, network traffic by host, and Traffic Manager resource usage.
Use this dashboard to:
- Review details of incoming TCP connection requests.
- Get a high-level analysis of network traffic.
- Get an overview of CPU and memory usage.
- Drill down for a view granular metrics by host using the Host filter.
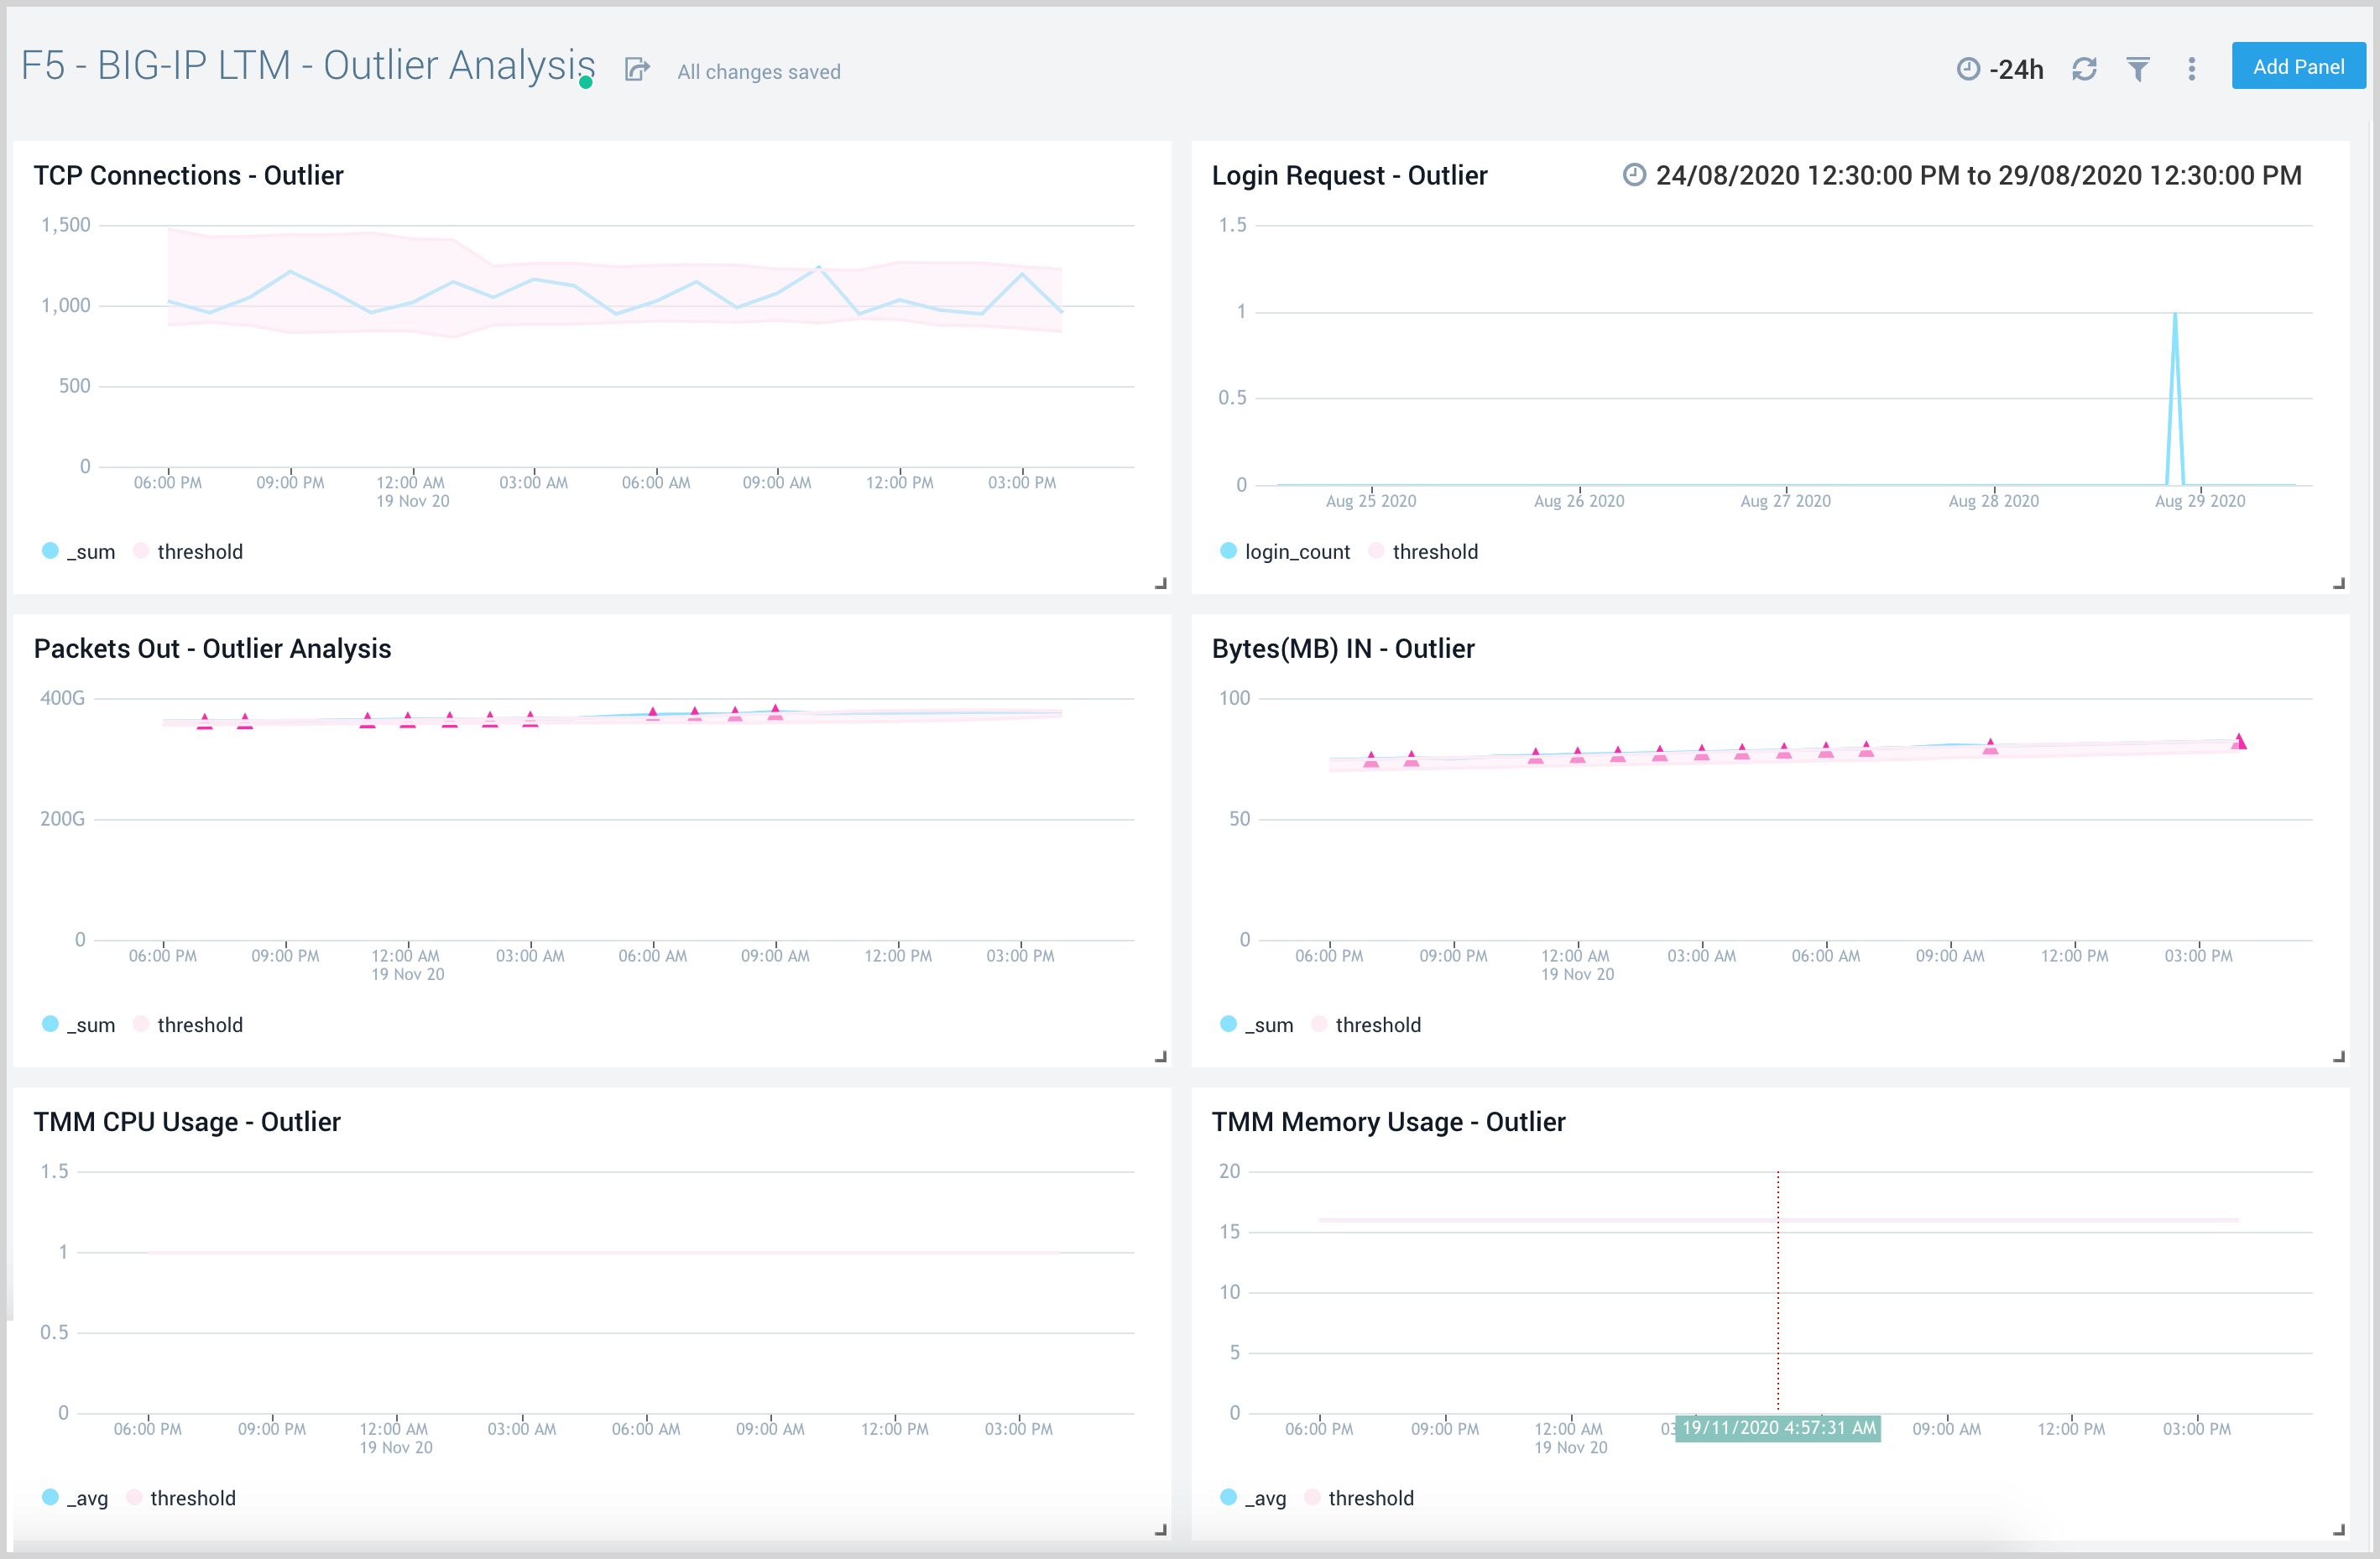
Outlier Analysis
The F5 - BIG-IP LTM - Outlier Analysis dashboard provides an at-a-glance view of TCP connection and login request outliers, along with network traffic and Traffic Manager resource usage.
Use this dashboard to find any outliers in your incoming traffic, CPU, and memory usage.
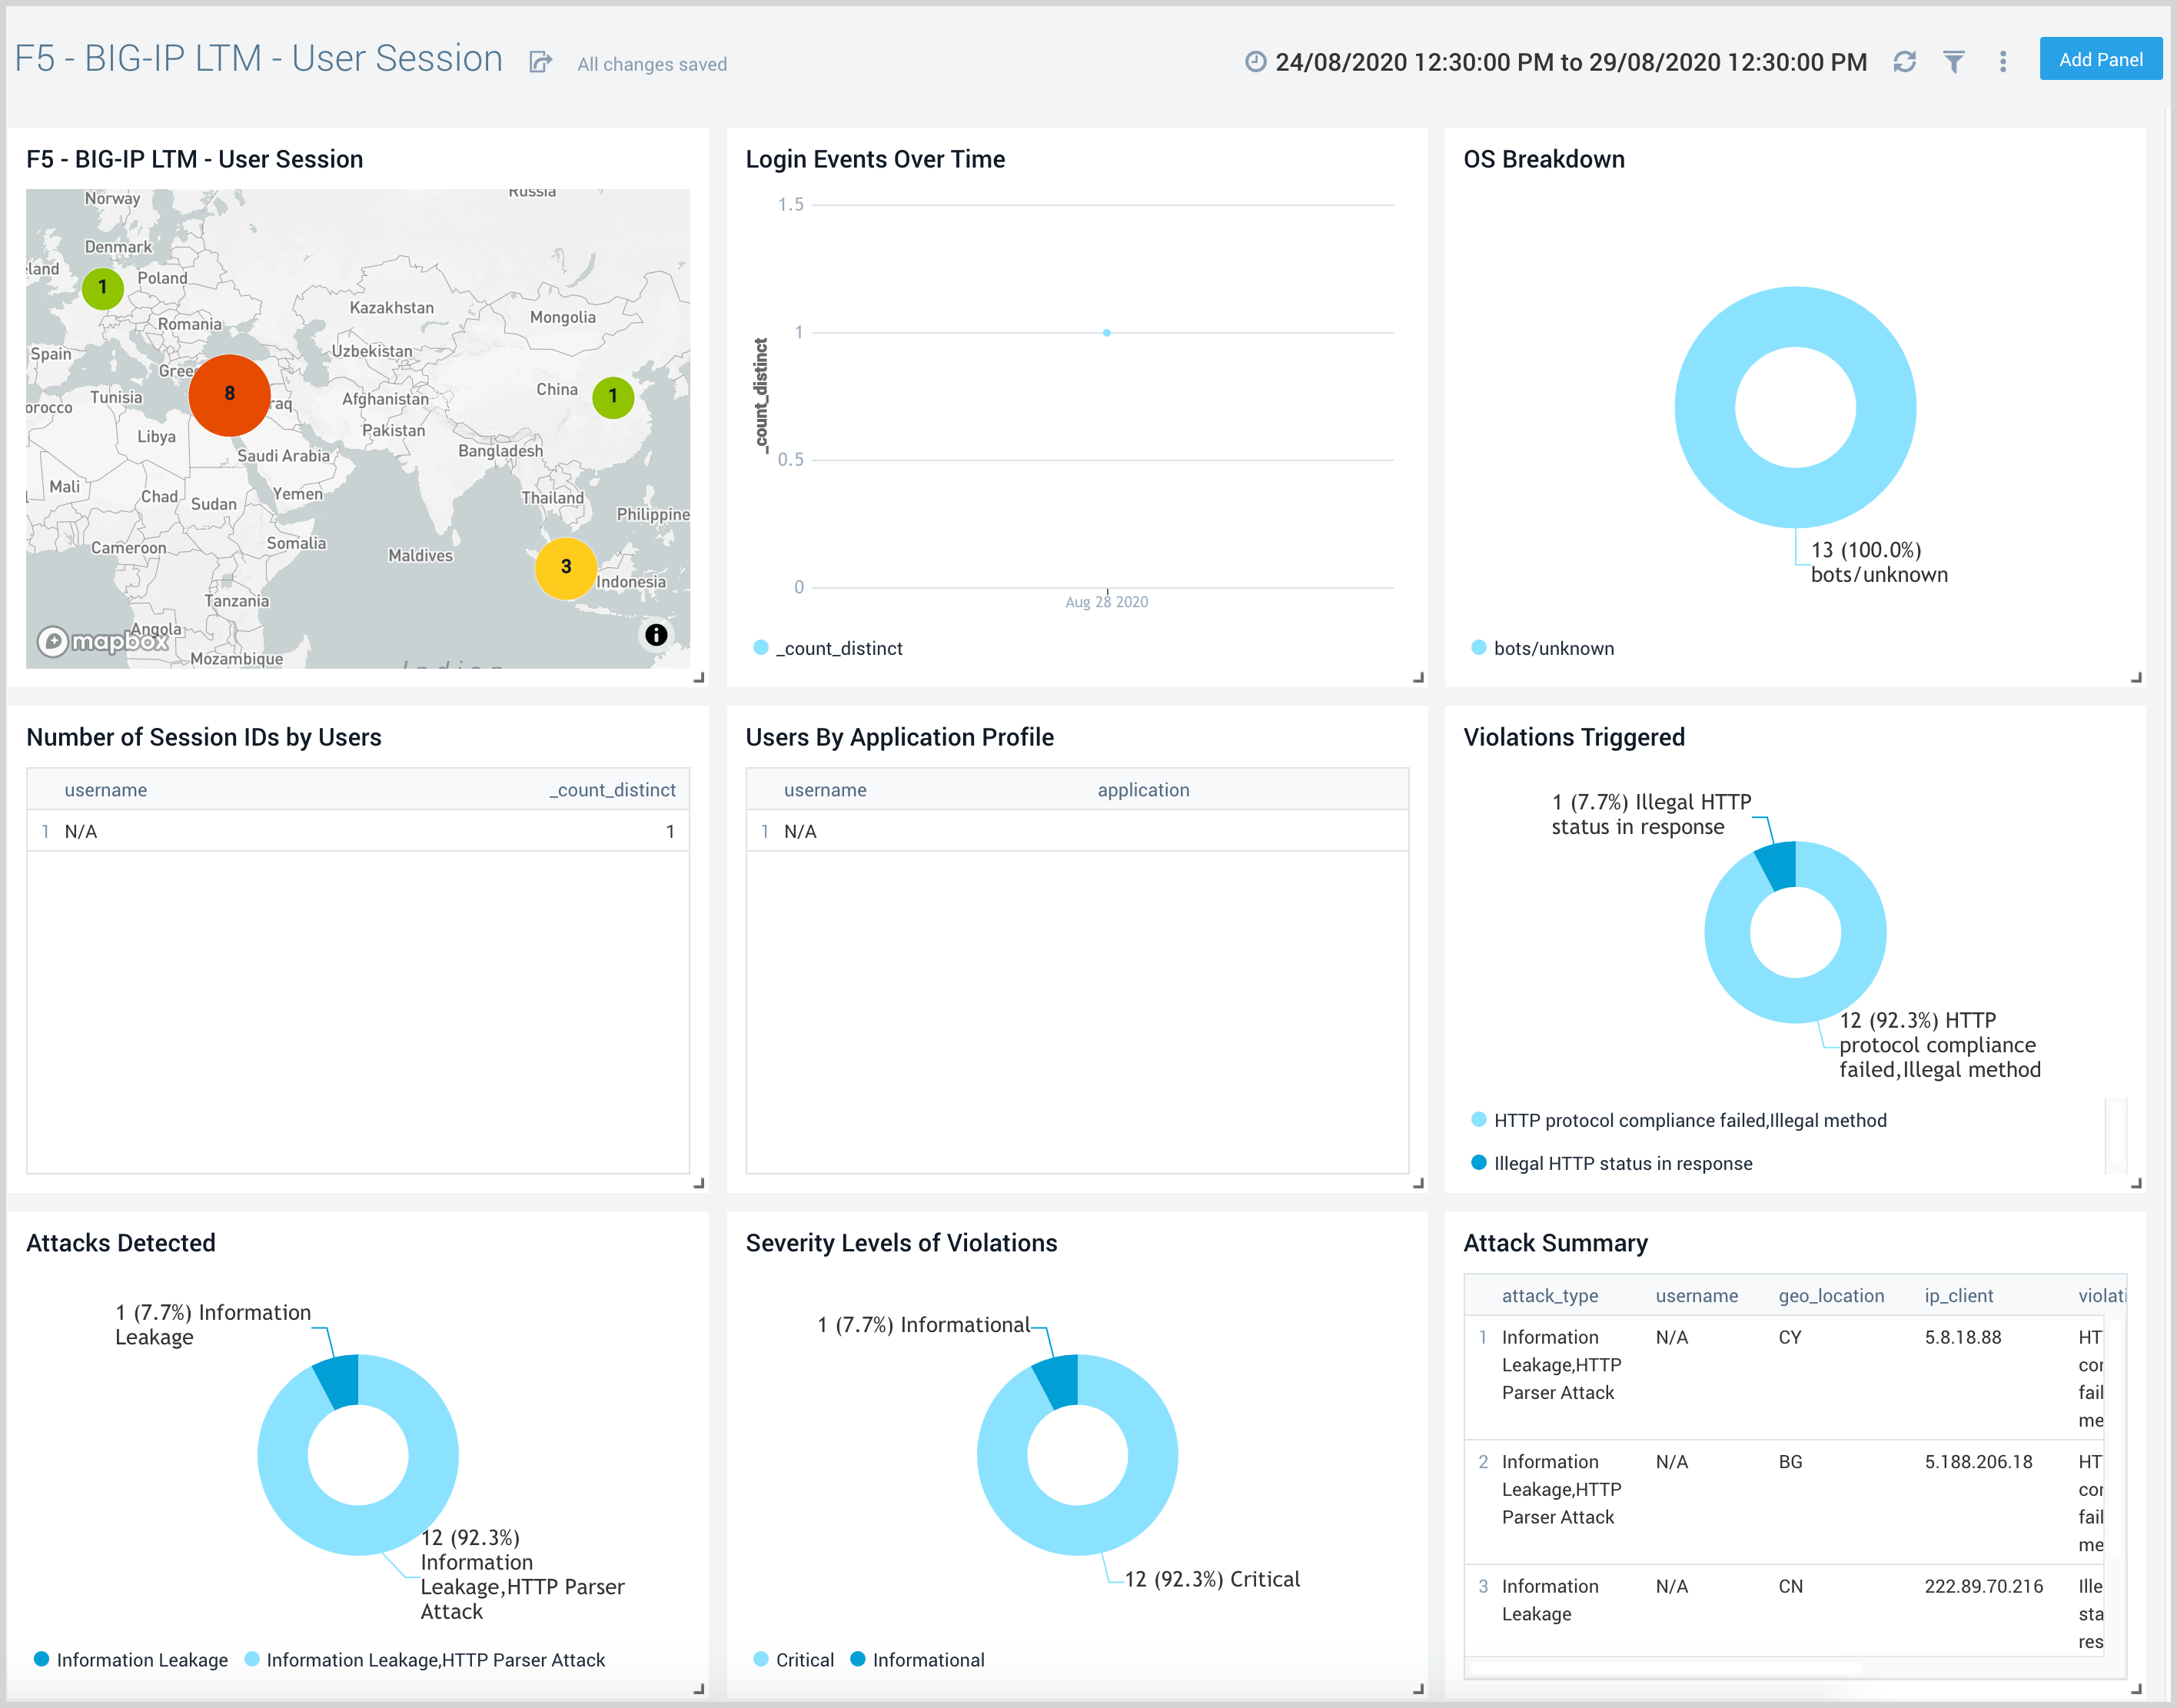
User Session Events
The F5 - BIG-IP LTM - User Session Events dashboard provides an at-a-glance view of user activity and their geographic location. This dashboard also provides information on login trends, operating systems used, user session IDs, and users by their application profile.
Use this dashboard to:
- View the geographic location of active users.
- Review information on browsers and platforms used, and network traffic details.
- Review user requests and application access by users.
Upgrade/Downgrade the F5 - BIG-IP LTM app (Optional)
To update the app, do the following:
Next-Gen App: To install or update the app, you must be an account administrator or a user with Manage Apps, Manage Monitors, Manage Fields, Manage Metric Rules, and Manage Collectors capabilities depending upon the different content types part of the app.
- Select App Catalog.
- In the Search Apps field, search for and then select your app.
Optionally, you can identify apps that can be upgraded in the Upgrade available section. - To upgrade the app, select Upgrade from the Manage dropdown.
- If the upgrade does not have any configuration or property changes, you will be redirected to the Preview & Done section.
- If the upgrade has any configuration or property changes, you will be redirected to the Setup Data page.
- In the Configure section of your respective app, complete the following fields.
- Field Name. If you already have collectors and sources set up, select the configured metadata field name (eg _sourcecategory) or specify other custom metadata (eg: _collector) along with its metadata Field Value.
- Click Next. You will be redirected to the Preview & Done section.
Post-update
Your upgraded app will be installed in the Installed Apps folder and dashboard panels will start to fill automatically.
See our Release Notes changelog for new updates in the app.
To revert the app to a previous version, do the following:
- Select App Catalog.
- In the Search Apps field, search for and then select your app.
- To version down the app, select Revert to < previous version of your app > from the Manage dropdown.
Uninstalling the F5 - BIG-IP LTM app (Optional)
To uninstall the app, do the following:
- Select App Catalog.
- In the 🔎 Search Apps field, run a search for your desired app, then select it.
- Click Uninstall.