Imperva Incapsula

Imperva Incapsula is a cloud-based application delivery service that includes web security, DDoS protection, CDN, and load balancing.
The Sumo Logic app for Imperva Incapsula - Web Application Firewall (WAF) helps you monitor your web application protection service. The preconfigured dashboards provide insights on the threat alerts events.
Log types
The Imperva Incapsula - Web Application Firewall app uses security and access logs. For more details, see here.
Sample queries
| parse "fileId=* " as ID nodrop
| parse "src=* " as main_client_ip nodrop
| parse "caIP=* " as additional_client_ip nodrop
| parse "requestClientApplication=* cs2" as user_agent nodrop
| parse "request=* " as URL nodrop
| parse "tag=* " as ref_id nodrop
| parse "ccode=* " as country_code nodrop
| parse "cicode=* " as City nodrop
| parse "ccode=[*] " as country_code nodrop
| parse "app=* " as Protocol nodrop
| parse "deviceExternalId=* " as request_id nodrop
| parse "ref=* " as Referrer nodrop
| parse "requestMethod=* " as Method nodrop
| parse "cn1=* " as http_status_code nodrop
| parse "xff=* " as X_Forwarded_For nodrop
| parse "in=* " as content_length nodrop
| parse "suid=* " as account_id nodrop
| parse "Customer=* " as account_name nodrop
| parse "siteid=* " as site_id nodrop
| parse "sourceServiceName=* " as site_name nodrop
| parse "act=* " as request_result nodrop
| parse "postbody=* " as post_body nodrop
| parse "start=* " as request_start_time nodrop
| parse "sip=* " as server_ip nodrop
| parse "spt=* " as server_port nodrop
| parse "qstr=* " as query_string nodrop
| parse "cs1=* " as captcha_support nodrop
| parse "cs2=* cs2" as js_support nodrop
| parse "cs3=* cs3" as cookies_support nodrop
| parse "cs4=* cs4" as visitor_id nodrop
| parse "cs5=* cs5" as Debug nodrop
| parse "cs6=* cs6" as client_app
| parse "cs7=* cs7" as Latitude nodrop
| parse "cs8=* cs8" as Longitude nodrop
| parse "cs9=* cs9" as rule_name nodrop
| parse "filePermission=* " as attack_id nodrop
| parse "fileType=* " as attack_type nodrop
| parse "dproc=* cs6" as browser_type nodrop
_sourceCategory="Incapsula"
| parse "SIEMintegration|1|1|*|" as policy_type
| parse "sourceServiceName=* " as site_name
| count by policy_type
| top 10 policy_type by _count
Collecting logs for the Imperva-Incapsula WAF app
This section provides instructions on configuring log collection for the Imperva - Incapsula Web Application Firewall app, as well as query samples.
Set up log integration in Imperva Incapsula
To configure log integration, do the following:
- Log into your my.incapsula.com account.
- On the sidebar, click Logs > Log Setup.
- Connection. Select Amazon S3.
- Next, fill in your credentials:
- Your S3 Access key, Secret key, and Path, where path is the location of the folder where you want to store the logs. Enter the path in the following format:
<Amazon S3 bucket name>/<log folder>. For example: MyBucket/MyIncapsulaLogFolder. - Click Test connection to perform a full testing cycle in which a test file will be transferred to your designated folder. The test file does not contain real data, and will be removed by Incapsula when the transfer is complete.
- Your S3 Access key, Secret key, and Path, where path is the location of the folder where you want to store the logs. Enter the path in the following format:
- Configure the additional options:
- Format. Select the format for the log files: CEF
- Compress logs. By default, log files are compressed. Clear this option to keep the logs uncompressed.
For detailed instructions, see here.
Set up in Sumo Logic
To configure log collection for Sumo Logic, do the following:
- Add a Sumo Logic Hosted Collector
- Configure Amazon S3 Source.
Installing the Imperva-Incapsula WAF app
To install the app, do the following:
Next-Gen App: To install or update the app, you must be an account administrator or a user with Manage Apps, Manage Monitors, Manage Fields, Manage Metric Rules, and Manage Collectors capabilities depending upon the different content types part of the app.
- Select App Catalog.
- In the 🔎 Search Apps field, run a search for your desired app, then select it.
- Click Install App.
note
Sometimes this button says Add Integration.
- Click Next in the Setup Data section.
- In the Configure section of your respective app, complete the following fields.
- Field Name. If you already have collectors and sources set up, select the configured metadata field name (eg _sourcecategory) or specify other custom metadata (eg: _collector) along with its metadata Field Value.
- Click Next. You will be redirected to the Preview & Done section.
Post-installation
Once your app is installed, it will appear in your Installed Apps folder, and dashboard panels will start to fill automatically.
Each panel slowly fills with data matching the time range query received since the panel was created. Results will not immediately be available but will be updated with full graphs and charts over time.
Viewing Imperva-Incapsula WAF dashboards
All dashboards have a set of filters that you can apply to the entire dashboard. Use these filters to drill down and examine the data to a granular level.
- You can change the time range for a dashboard or panel by selecting a predefined interval from a drop-down list, choosing a recently used time range, or specifying custom dates and times. Learn more.
- You can use template variables to drill down and examine the data on a granular level. For more information, see Filtering Dashboards with Template Variables.
- Most Next-Gen apps allow you to provide the scope at the installation time and are comprised of a key (
_sourceCategoryby default) and a default value for this key. Based on your input, the app dashboards will be parameterized with a dashboard variable, allowing you to change the dataset queried by all panels. This eliminates the need to create multiple copies of the same dashboard with different queries.
Overview
See the overview of your WAF service including the source IP address, client app, user agent, country, ADR rules, and policy type.
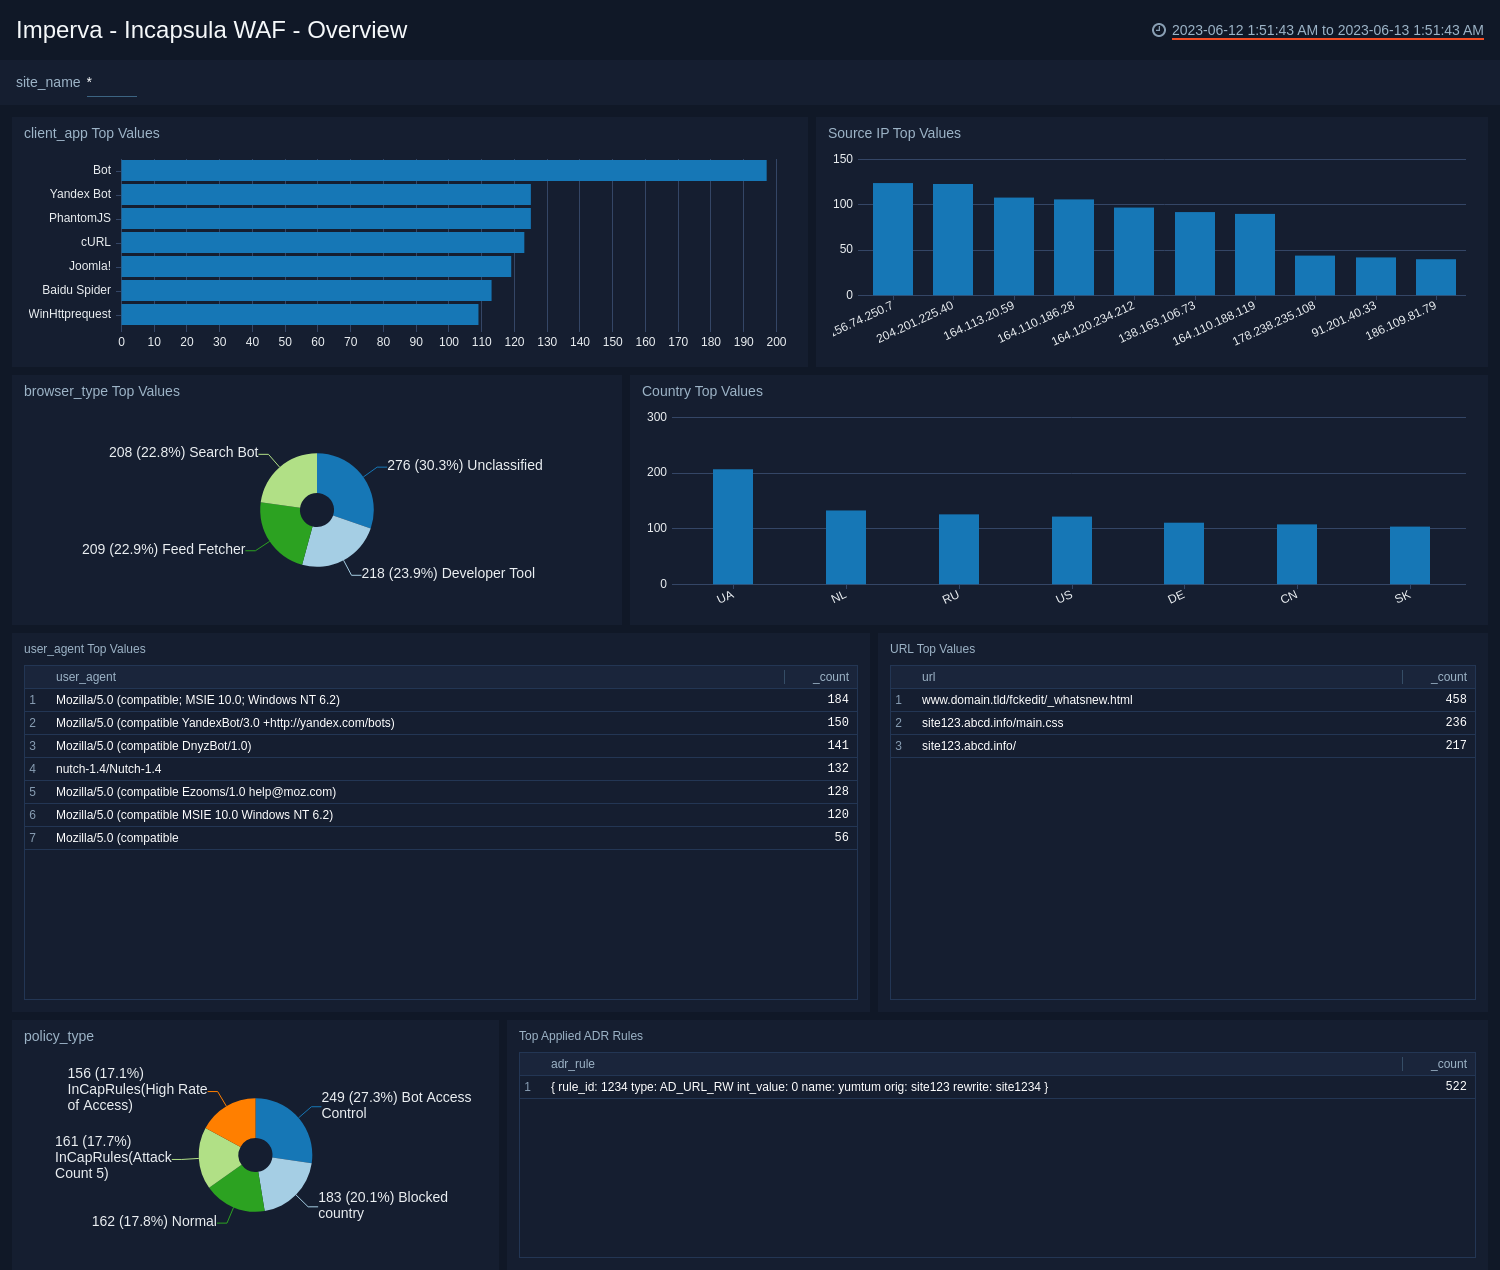
Client App Top Values. See the top 10 client apps by count in the last 14 days on a bar chart.
Source IP Top Values. See the top 10 source IP addresses by count in the last 14 days on a column chart.
Browser Type Top Values. See the top 10 browser types by count in the last 14 days on a pie chart.
Country Top Values. See the top 10 countries by count in the last 14 days on a column chart.
User Agent Top Values. See the top 10 user agents by count in the last 14 days displayed in a table.
URL Top Values. See the top 10 URLs by count in the last 14 days displayed in a table.
Policy Type. See the count and percentage of policy types in the last 14 days on a pie chart.
Top Applied ADR Rules. See the top 10 applied ADR rules by count in the last 14 days displayed in a table.
Blocked Countries
See the details of blocked countries in your WAF service including the source IP address, browser type, top countries, and user agent.
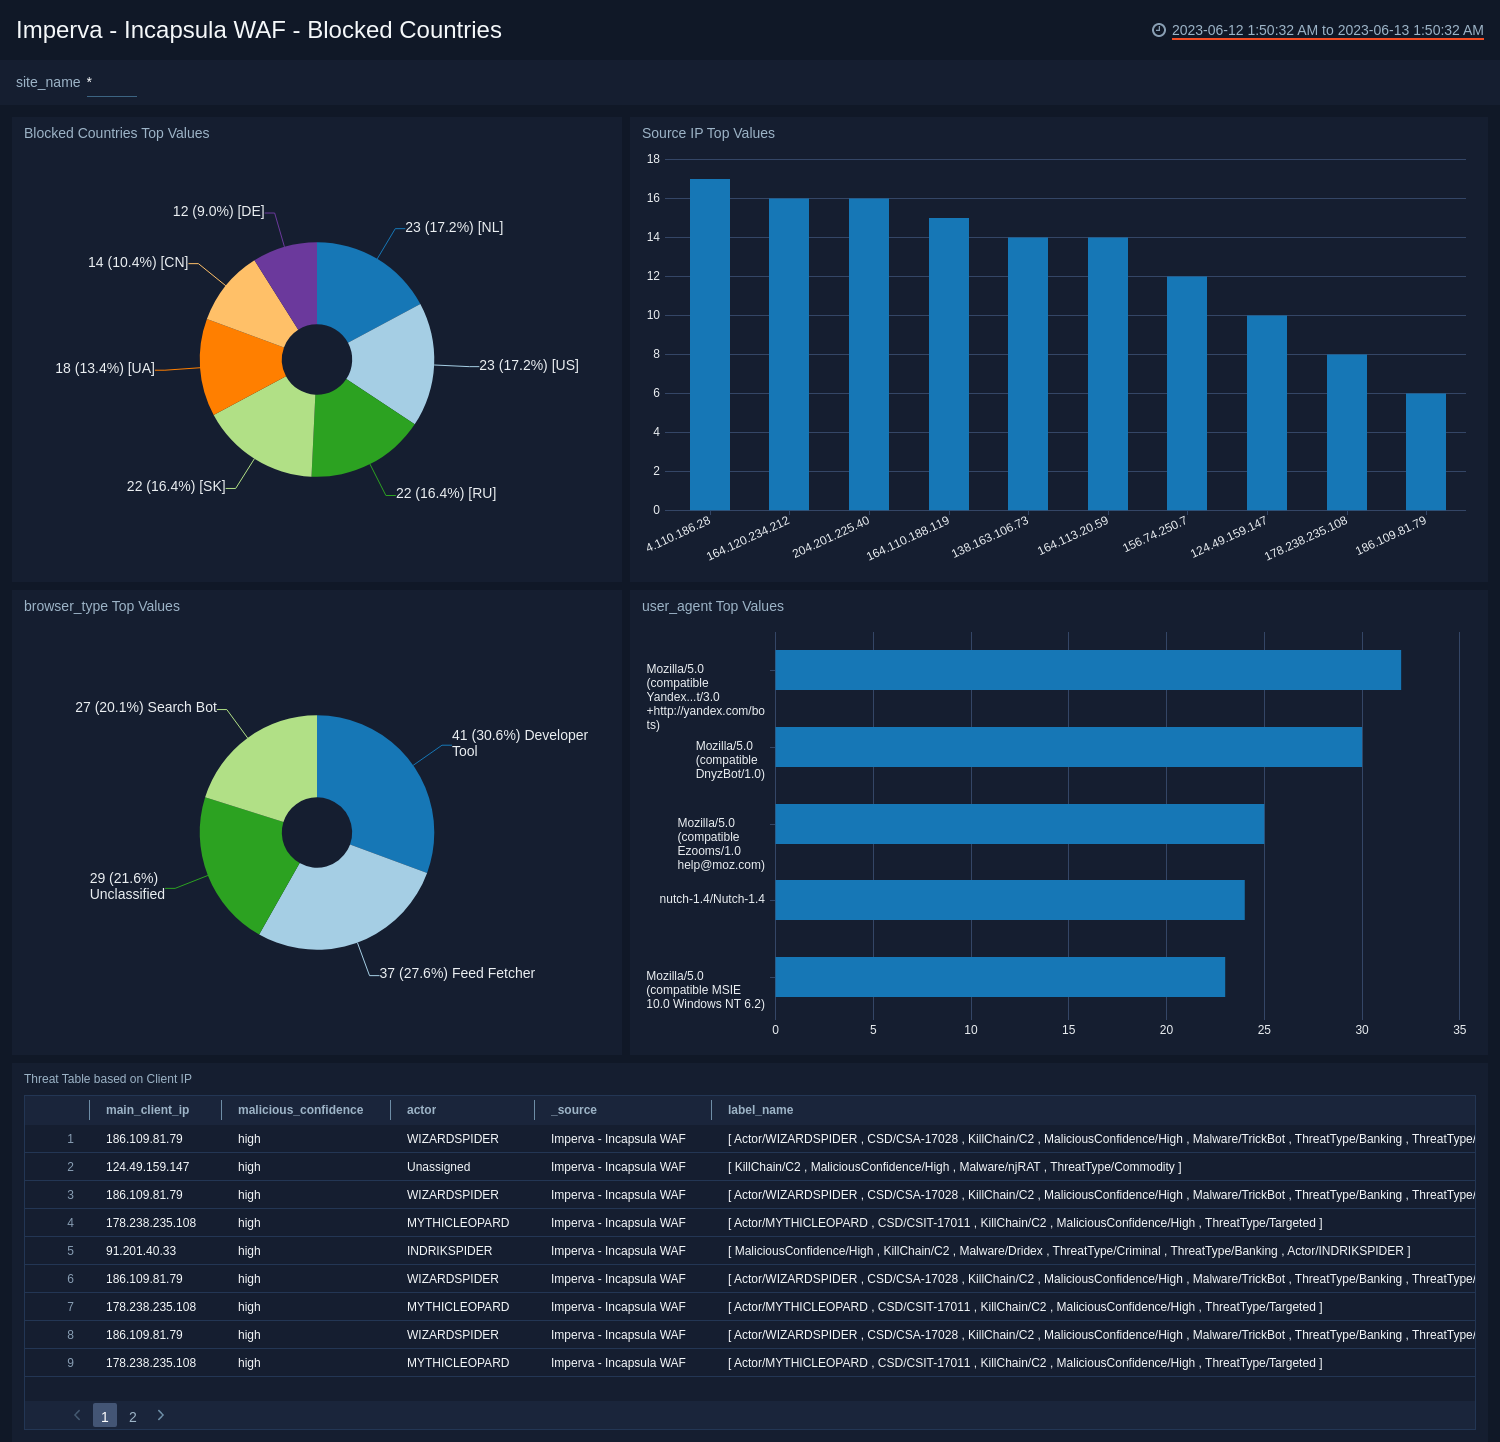
Blocked Countries Top Values. See the top 10 blocked countries by count in the last 14 days on a pie chart.
Source IP Top Values. See the top 10 source IP addresses by count in the last 14 days on a column chart.
Browser Type Top Values. See the top 10 browser types by count in the last 14 days on a pie chart.
User Agent Top Values. See the top 10 user agents by count in the last 14 days displayed in a table.
Threat Table based on Client IP. See the details of threats in the last 24 hours based on client IP address including the main client IP address, malicious confidence, actor, source, label name, browser type, attack type, rule name, country code, server IP, server port , client app, method, post body, URL, user agent, and count, displayed in a table.
BOT - Access Control
See the details of BOT access control in your WAF service including the city, country, browser type, source IP address, and user agent.
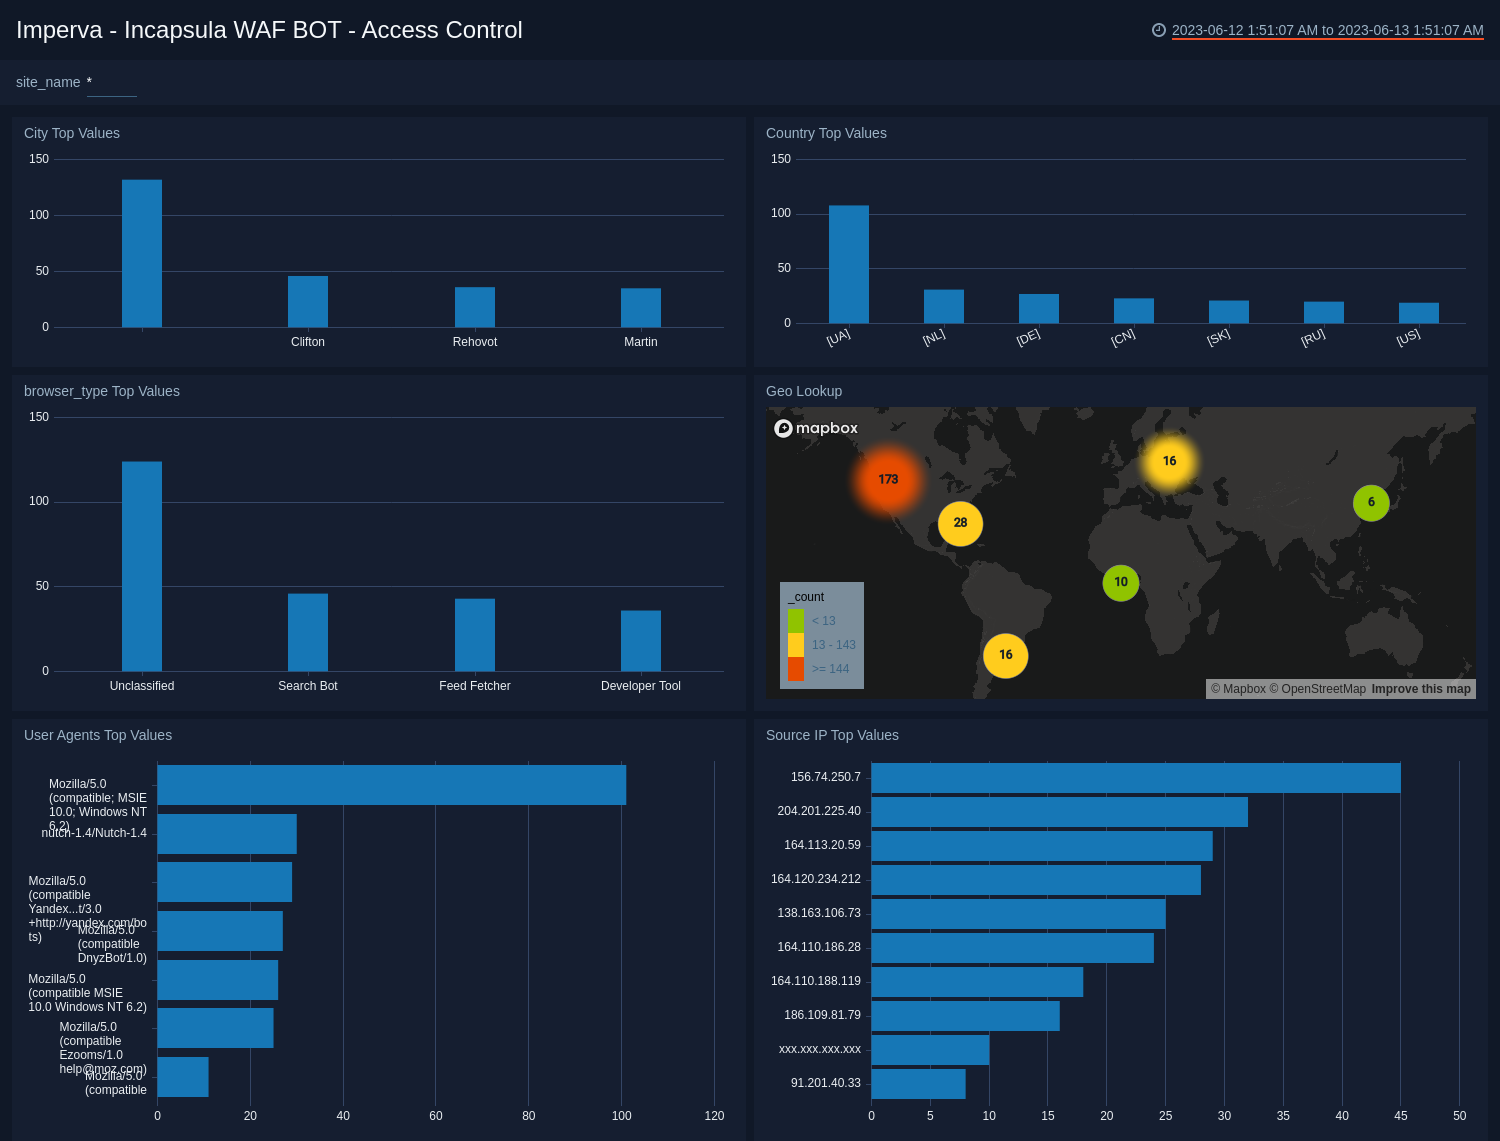
City Top Values. See the top 10 cities by count in the last 14 days on a column chart.
Country Top Values. See the top 10 countries by count in the last 14 days on a column chart.
Browser Type Top Values. See the top 10 browser types by count in the last 14 days on a column chart.
Geo Lookup. See the count and location of BOT access controls in the last 14 days on a world map.
User Agents Top Values. See the top 10 user agents by count in the last 14 days on a bar chart.
Source IP Top Values. See the top 10 source IP addresses by count in the last 14 days on a bar chart.
Upgrade/Downgrade the Imperva-Incapsula WAF app (Optional)
To update the app, do the following:
Next-Gen App: To install or update the app, you must be an account administrator or a user with Manage Apps, Manage Monitors, Manage Fields, Manage Metric Rules, and Manage Collectors capabilities depending upon the different content types part of the app.
- Select App Catalog.
- In the Search Apps field, search for and then select your app.
Optionally, you can identify apps that can be upgraded in the Upgrade available section. - To upgrade the app, select Upgrade from the Manage dropdown.
- If the upgrade does not have any configuration or property changes, you will be redirected to the Preview & Done section.
- If the upgrade has any configuration or property changes, you will be redirected to the Setup Data page.
- In the Configure section of your respective app, complete the following fields.
- Field Name. If you already have collectors and sources set up, select the configured metadata field name (eg _sourcecategory) or specify other custom metadata (eg: _collector) along with its metadata Field Value.
- Click Next. You will be redirected to the Preview & Done section.
Post-update
Your upgraded app will be installed in the Installed Apps folder and dashboard panels will start to fill automatically.
See our Release Notes changelog for new updates in the app.
To revert the app to a previous version, do the following:
- Select App Catalog.
- In the Search Apps field, search for and then select your app.
- To version down the app, select Revert to < previous version of your app > from the Manage dropdown.
Uninstalling the Imperva-Incapsula WAF app (Optional)
To uninstall the app, do the following:
- Select App Catalog.
- In the 🔎 Search Apps field, run a search for your desired app, then select it.
- Click Uninstall.