Netskope

The Netskope app provides visibility into the security posture of your applications and helps you determine the overall usage of software and SaaS applications.
Netskope is a Cloud Access Security Broker (CASB) hosted in the cloud. The Netskope product is primarily used for enforcing security policies for cloud-based resources, such as Box and Microsoft Office 365. Customers purchase a CASB to address cloud service risks, enforce security policies, and comply with regulations, even when cloud services are beyond their perimeter and out of their direct control.
Log types
The Netskope app provides a collector source for pulling all the events and alerts from Netskope in real-time via API calls and ingests them into the Sumo Logic platform through our Hosted collector.
For more information on Netskope, refer to the Netskope documentation.
Sample log message
Click to expand
{
           "dstip": "74.125.239.150",
           "dst_location": "Mountain View",
           "app": "Google Gmail",
           "_insertion_epoch_timestamp": 1547391690,
           "site": "Google Gmail",
           "src_location": "Pomerol",
           "organization_unit": "",
           "object_type": "Mail",
           "id": 3764,
           "app_session_id": 4252577042,
           "category": "Webmail",
           "dst_region": "California",
           "userkey": "Tanja.Barton@kkrlogistics.com",
           "dst_country": "US",
           "src_zipcode": "33500",
           "ur_normalized": "tanja.barton@kkrlogistics.com",
           "type": "nspolicy",
           "object": "Welcome Novak Dimitrov",
           "srcip": "77.194.46.1",
           "dst_latitude": 37.405991,
           "timestamp": 1547400222,
           "src_region": "Gironde",
           "dst_longitude": -122.078514,
           "alert": "no",
           "to_user": "ns-india@microsoft.com, hrglobal@microsoft.com",
           "user": "Tanja.Barton@kkrlogistics.com",
           "from_user": "bloomberg@bloomberg.com",
           "device": "Windows PC",
           "org": "kkrlogistics.com",
           "src_country": "FR",
           "traffic_type": "CloudApp",
           "dst_zipcode": "N/A",
           "count": 2,
           "src_latitude": 44.9333,
           "url": "https://mail.google.com/",
           "page_id": 2641483218,
           "sv": "unknown",
           "ccl": "excellent",
           "cci": 92,
           "activity": "Send",
           "userip": "127.0.0.1",
           "src_longitude": -0.2,
           "_id": "5df996d5b66a9ea963e812ce",
           "os": "Windows 8",
           "browser": "Internet Explorer",
           "appcategory": "Webmail"
}
Sample queries
The following query sample was is from the Total Sessions panel of the Application Overview Dashboard.
_sourceCategory="netskope_events" "no" "nspolicy"
| json "_id", "alert", "type", "srcip", "dstip", "appcategory", "app", "os", "user", "device",
"acked", "site", "timestamp", "ccl", "activity", "browser", "object", "object_type", "from_user",
"to_user", "app_session_id" as alert_id, is_alert, type, src_ip, dest_ip, appcategory, app, os,
user, device, acked, site, timestamp, ccl, activity, browser, object, object_type, from_user,
to_user, app_session_id  nodrop
| where is_alert="no" and type="nspolicy"
| count by app_session_id
| count
Collection configuration and app installation
Depending on the set up collection method, you can configure and install the app in three ways:
- Create a new collector and install the app. Create a new Sumo Logic Cloud-to-Cloud (C2C) source under a new Sumo Logic Collector and later install the app, or
- Use an existing collector and install the app. Create a new Sumo Logic Cloud-to-Cloud (C2C) source under an existing Sumo Logic Collector and later install the app, or
- Use existing source and install the app. Use your existing configured Sumo Logic Cloud-to-Cloud (C2C) source and install the app.
Use the Cloud-to-Cloud Integration for Netskope to create the source and use the same source category while installing the app. By following these steps, you can ensure that your Netskope app is properly integrated and configured to collect and analyze your Netskope data.
Create a new collector and install the app
To set up collection and install the app, do the following:
Next-Gen App: To install or update the app, you must be an account administrator or a user with Manage Apps, Manage Monitors, Manage Fields, Manage Metric Rules, and Manage Collectors capabilities depending upon the different content types part of the app.
- Select App Catalog.
- In the 🔎 Search Apps field, run a search for your desired app, then select it.
- Click Install App.
note
Sometimes this button says Add Integration.
- In the Set Up Collection section of your respective app, select Create a new Collector.
- Collector Name. Enter a Name to display the Source in the Sumo Logic web application. The description is optional.
- Timezone. Set the default time zone when it is not extracted from the log timestamp. Time zone settings on Sources override a Collector time zone setting.
- (Optional) Metadata. Click the +Add Metadata link to add a custom log Metadata Fields. Define the fields you want to associate, each metadata field needs a name (key) and value.
 A green circle with a checkmark is shown when the field exists and is enabled in the Fields table schema.
 An orange triangle with an exclamation point is shown when the field doesn't exist, or is disabled, in the Fields table schema. In this case, an option to automatically add or enable the nonexistent fields to the Fields table schema is provided. If a field is sent to Sumo that does not exist in the Fields schema or is disabled it is ignored, known as dropped.
- Click Next.
- Configure the source as specified in the
Infobox above, ensuring all required fields are included. - In the Configure section of your respective app, complete the following fields.
- Field Name. If you already have collectors and sources set up, select the configured metadata field name (eg _sourcecategory) or specify other custom metadata (eg: _collector) along with its metadata Field Value.
- Click Next. You will be redirected to the Preview & Done section.
Post-installation
Once your app is installed, it will appear in your Installed Apps folder, and dashboard panels will start to fill automatically.
Each panel slowly fills with data matching the time range query received since the panel was created. Results will not immediately be available but will be updated with full graphs and charts over time.
Use an existing collector and install the app
To set up the source in the existing collector and install the app, do the following:
Next-Gen App: To install or update the app, you must be an account administrator or a user with Manage Apps, Manage Monitors, Manage Fields, Manage Metric Rules, and Manage Collectors capabilities depending upon the different content types part of the app.
- Select App Catalog.
- In the 🔎 Search Apps field, run a search for your desired app, then select it.
- Click Install App.
note
Sometimes this button says Add Integration.
- In the Set Up Collection section of your respective app, select Use an existing Collector.
- From the Select Collector dropdown, select the collector that you want to set up your source with and click Next.
- Configure the source as specified in the
Infobox above, ensuring all required fields are included. - In the Configure section of your respective app, complete the following fields.
- Field Name. If you already have collectors and sources set up, select the configured metadata field name (eg _sourcecategory) or specify other custom metadata (eg: _collector) along with its metadata Field Value.
- Click Next. You will be redirected to the Preview & Done section.
Post-installation
Once your app is installed, it will appear in your Installed Apps folder, and dashboard panels will start to fill automatically.
Each panel slowly fills with data matching the time range query received since the panel was created. Results will not immediately be available but will be updated with full graphs and charts over time.
Use an existing source and install the app
To skip collection and only install the app, do the following:
Next-Gen App: To install or update the app, you must be an account administrator or a user with Manage Apps, Manage Monitors, Manage Fields, Manage Metric Rules, and Manage Collectors capabilities depending upon the different content types part of the app.
- Select App Catalog.
- In the 🔎 Search Apps field, run a search for your desired app, then select it.
- Click Install App.
note
Sometimes this button says Add Integration.
- In the Set Up Collection section of your respective app, select Skip this step and use existing source and click Next.
- In the Configure section of your respective app, complete the following fields.
- Field Name. If you already have collectors and sources set up, select the configured metadata field name (eg _sourcecategory) or specify other custom metadata (eg: _collector) along with its metadata Field Value.
- Click Next. You will be redirected to the Preview & Done section.
Post-installation
Once your app is installed, it will appear in your Installed Apps folder, and dashboard panels will start to fill automatically.
Each panel slowly fills with data matching the time range query received since the panel was created. Results will not immediately be available but will be updated with full graphs and charts over time.
Viewing the Netskope dashboards
The Netskope dashboards are grouped by their component in the following two category folders:
- Application Usage
- Security Alerts
All dashboards have a set of filters that you can apply to the entire dashboard. Use these filters to drill down and examine the data to a granular level.
- You can change the time range for a dashboard or panel by selecting a predefined interval from a drop-down list, choosing a recently used time range, or specifying custom dates and times. Learn more.
- You can use template variables to drill down and examine the data on a granular level. For more information, see Filtering Dashboards with Template Variables.
- Most Next-Gen apps allow you to provide the scope at the installation time and are comprised of a key (
_sourceCategoryby default) and a default value for this key. Based on your input, the app dashboards will be parameterized with a dashboard variable, allowing you to change the dataset queried by all panels. This eliminates the need to create multiple copies of the same dashboard with different queries.
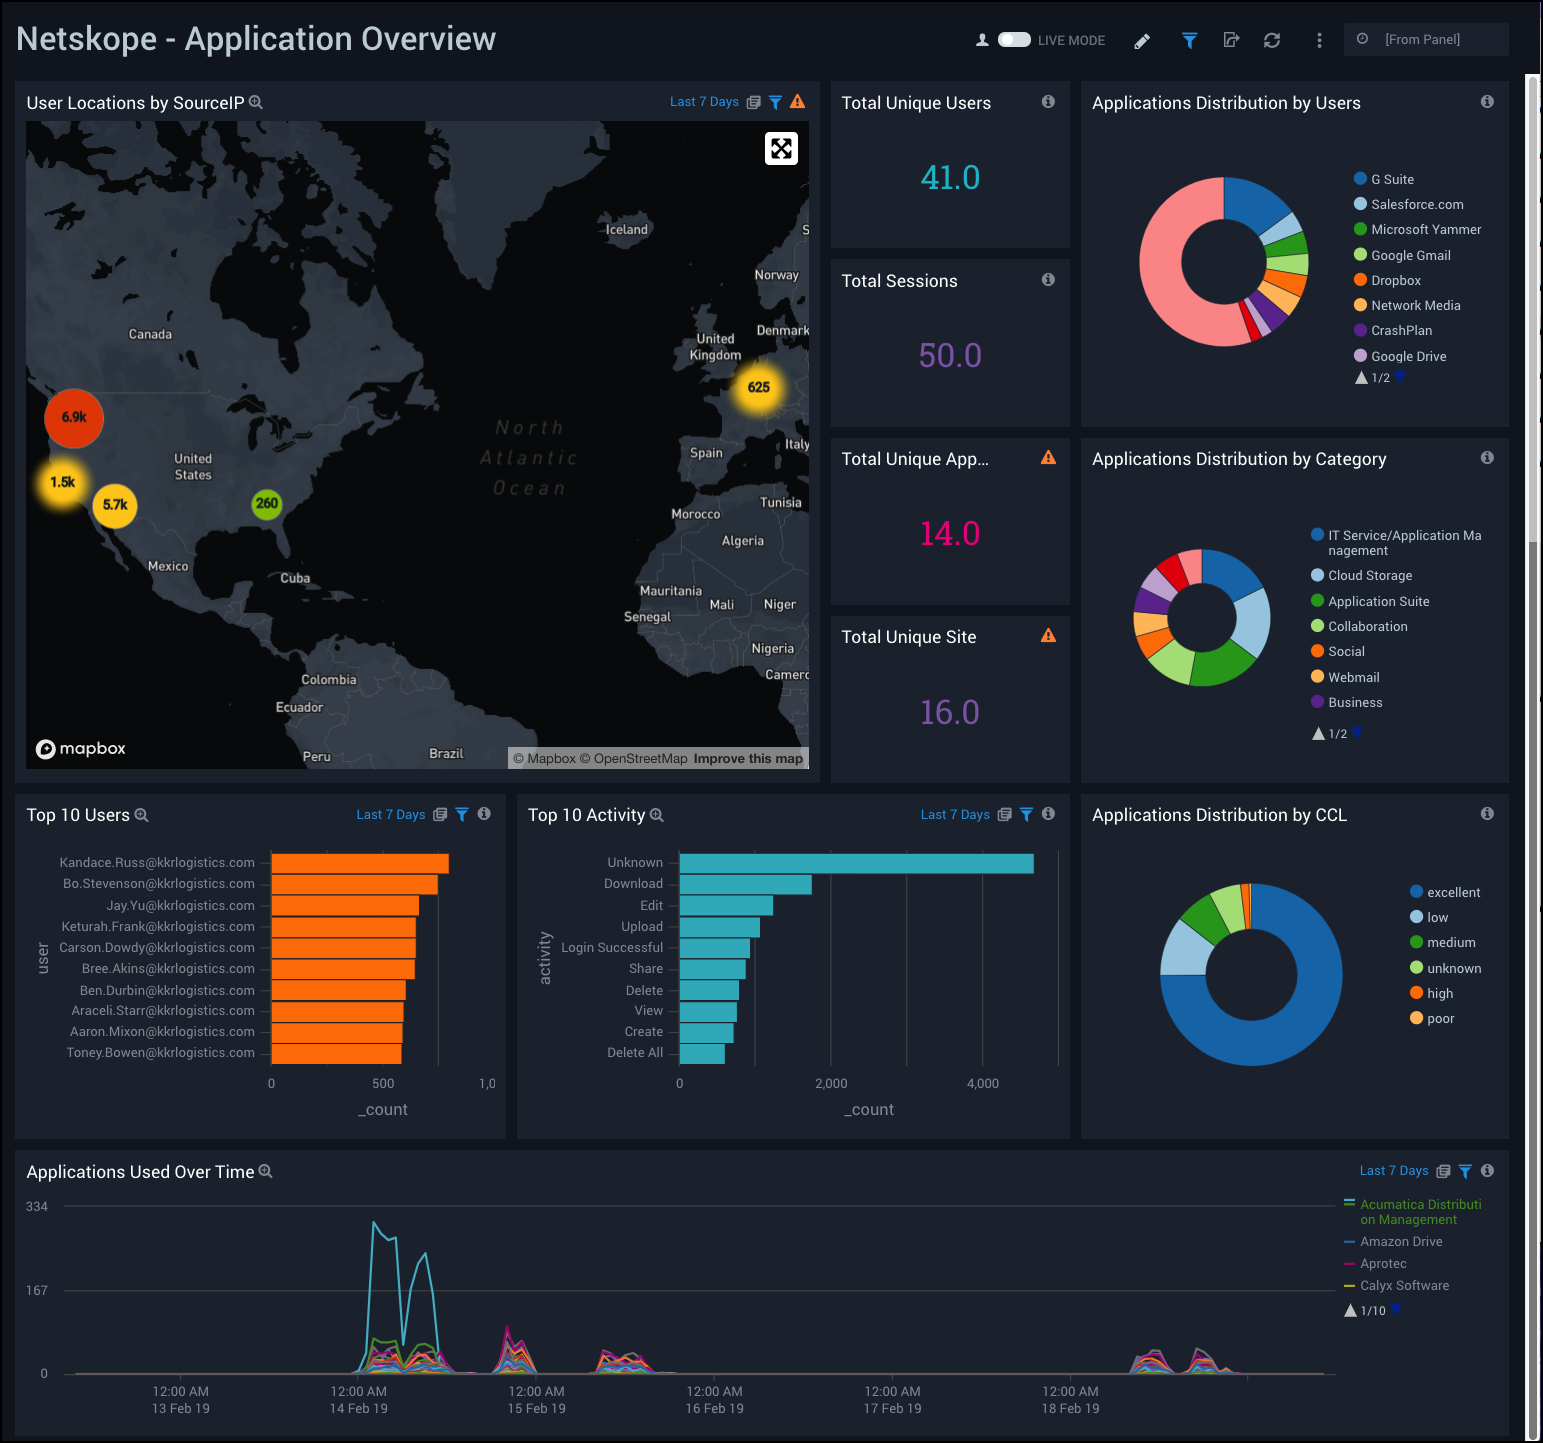
Application Overview
The Netskope - Application Overview dashboard provides a high-level view of user activity, user geographic location by source IP, total sessions, applications used, distribution and activity of applications, and application trends over time.
Use this dashboard to:
- Monitor number of users, sessions, and sites using the applications, and find out the popular apps by user and app category.
- Track spikes in application usage over time.
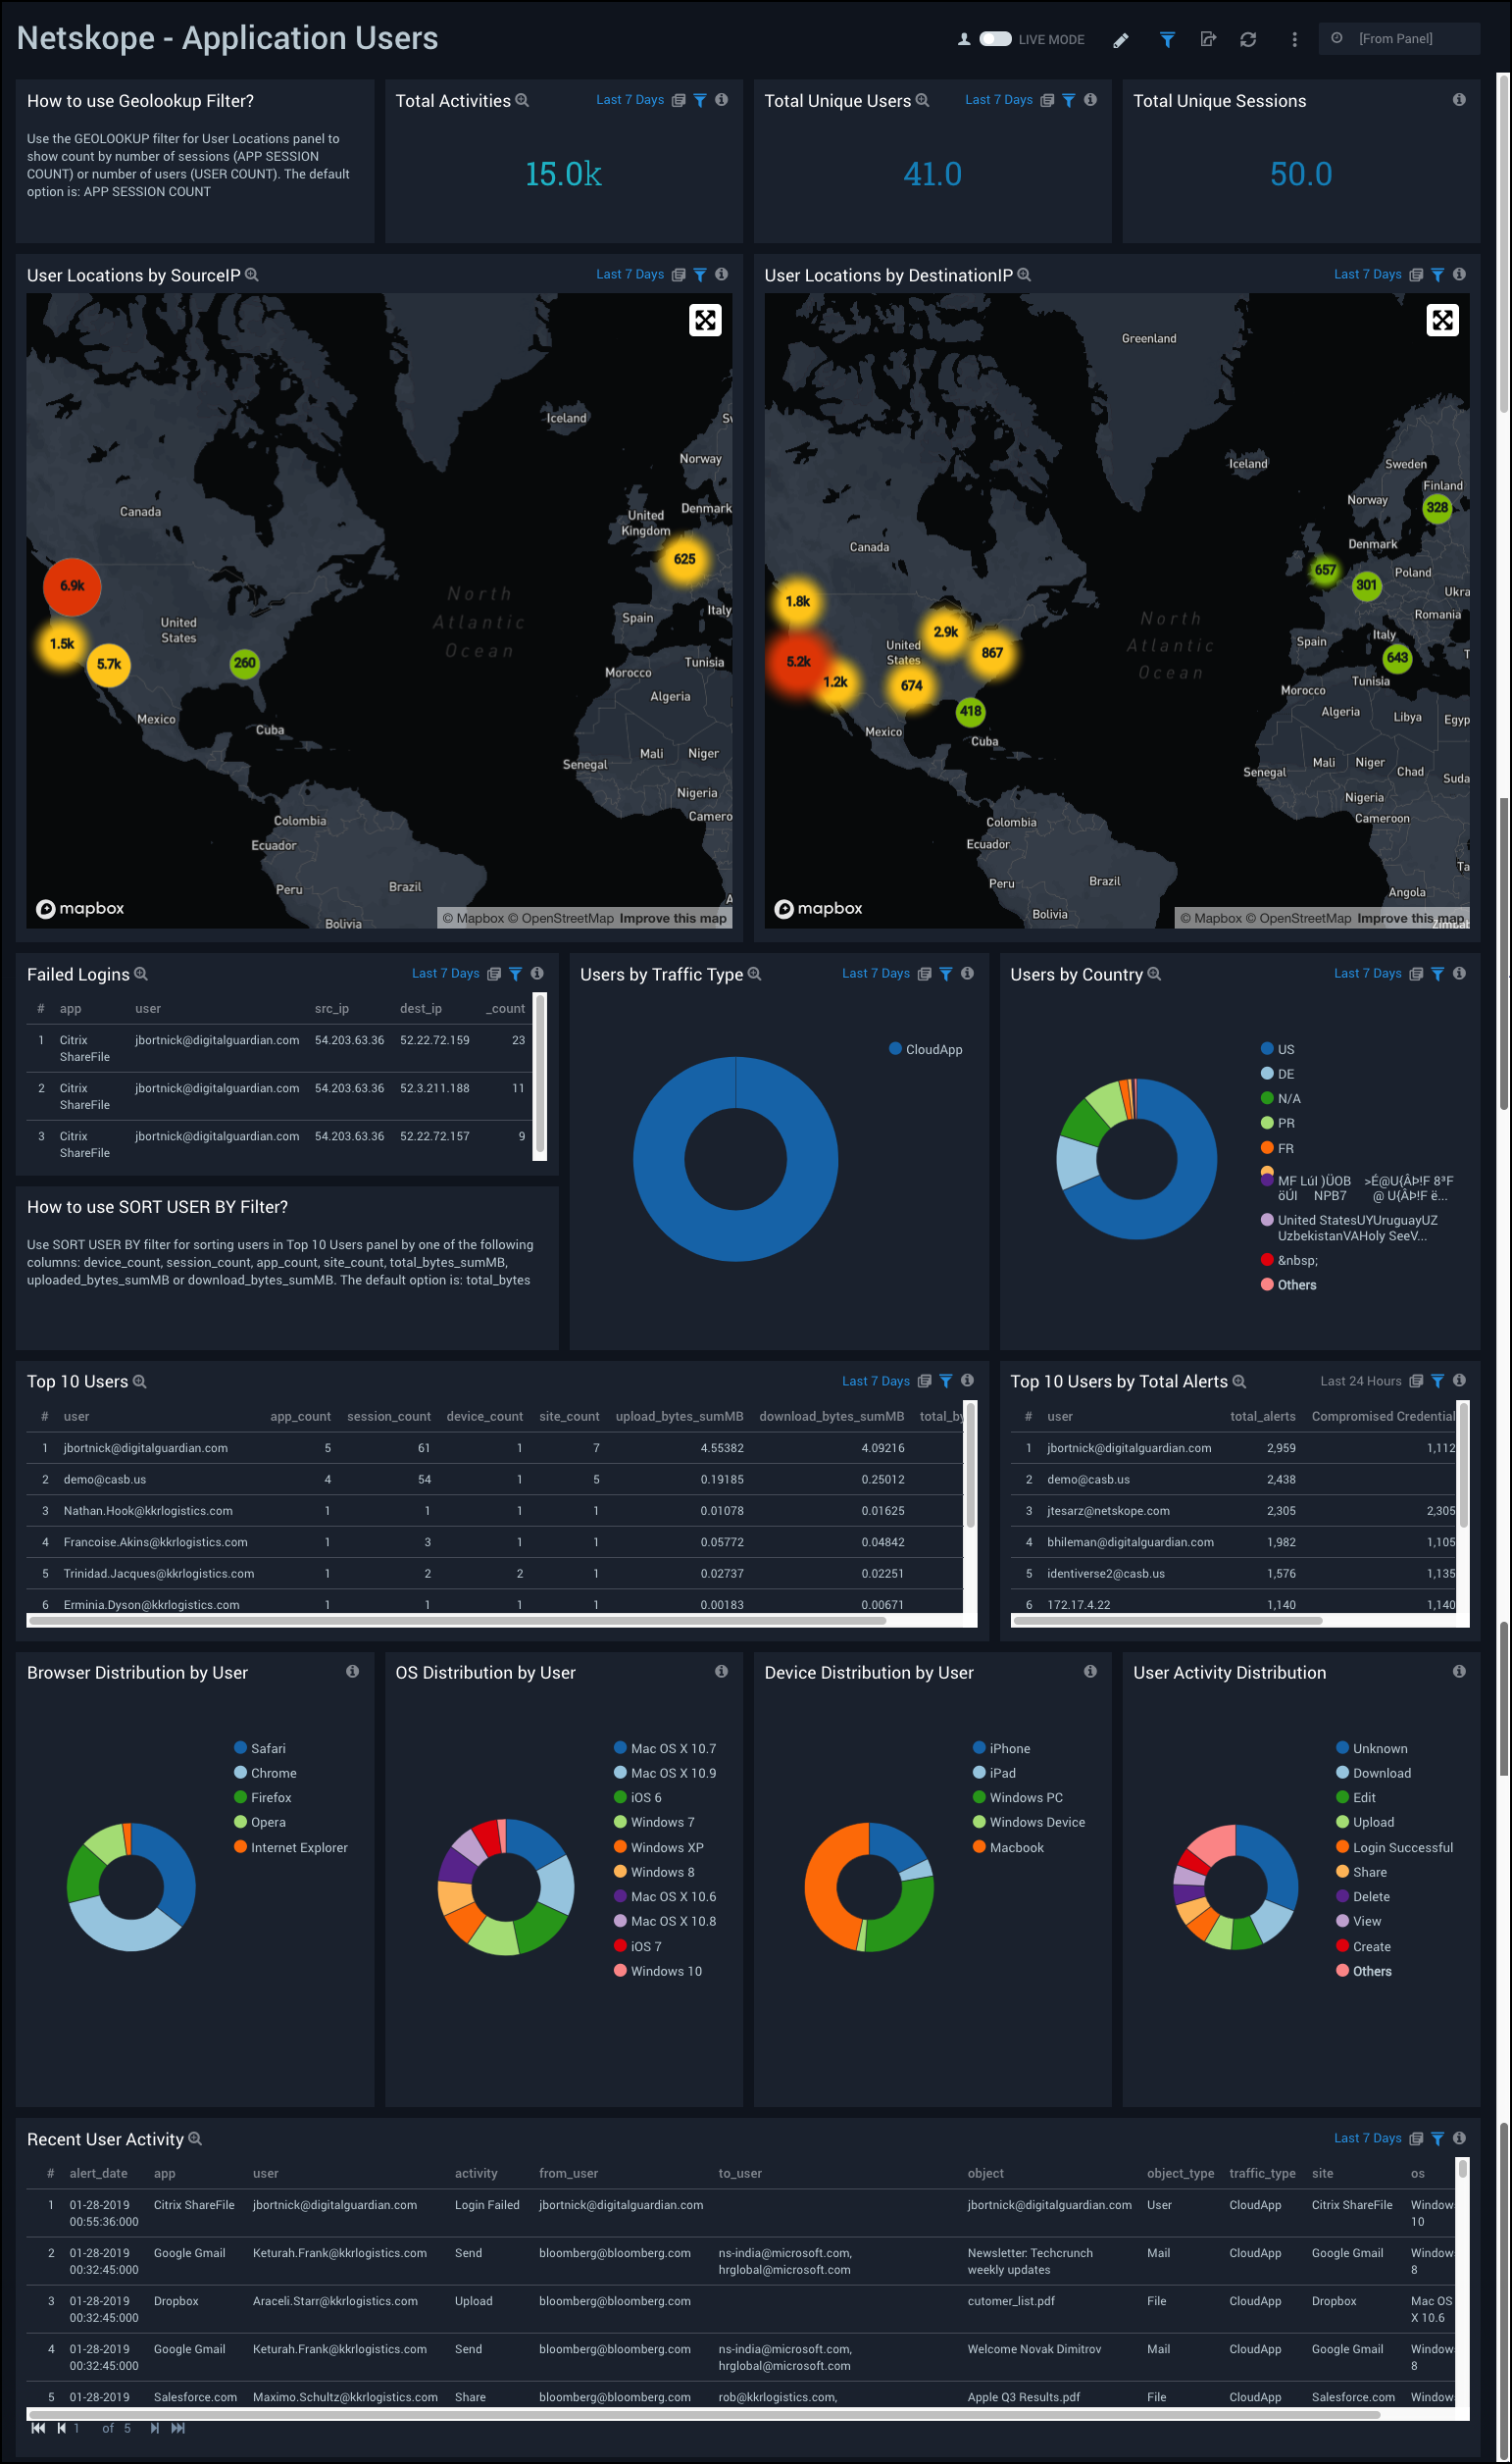
Application Users
The Netskope - Application Users dashboard provides a high-level view of application events, total sessions, user activity and geographic location by source IP and destination IP. This dashboard also shows visual breakdowns of distributions by operating system, browser, device, and user activity.
Use this dashboard to:
- Monitor recent user activities, track user locations, and find out the top users affected by alerts.
- Determine user classifications by browsers, devices, operating system (OS).
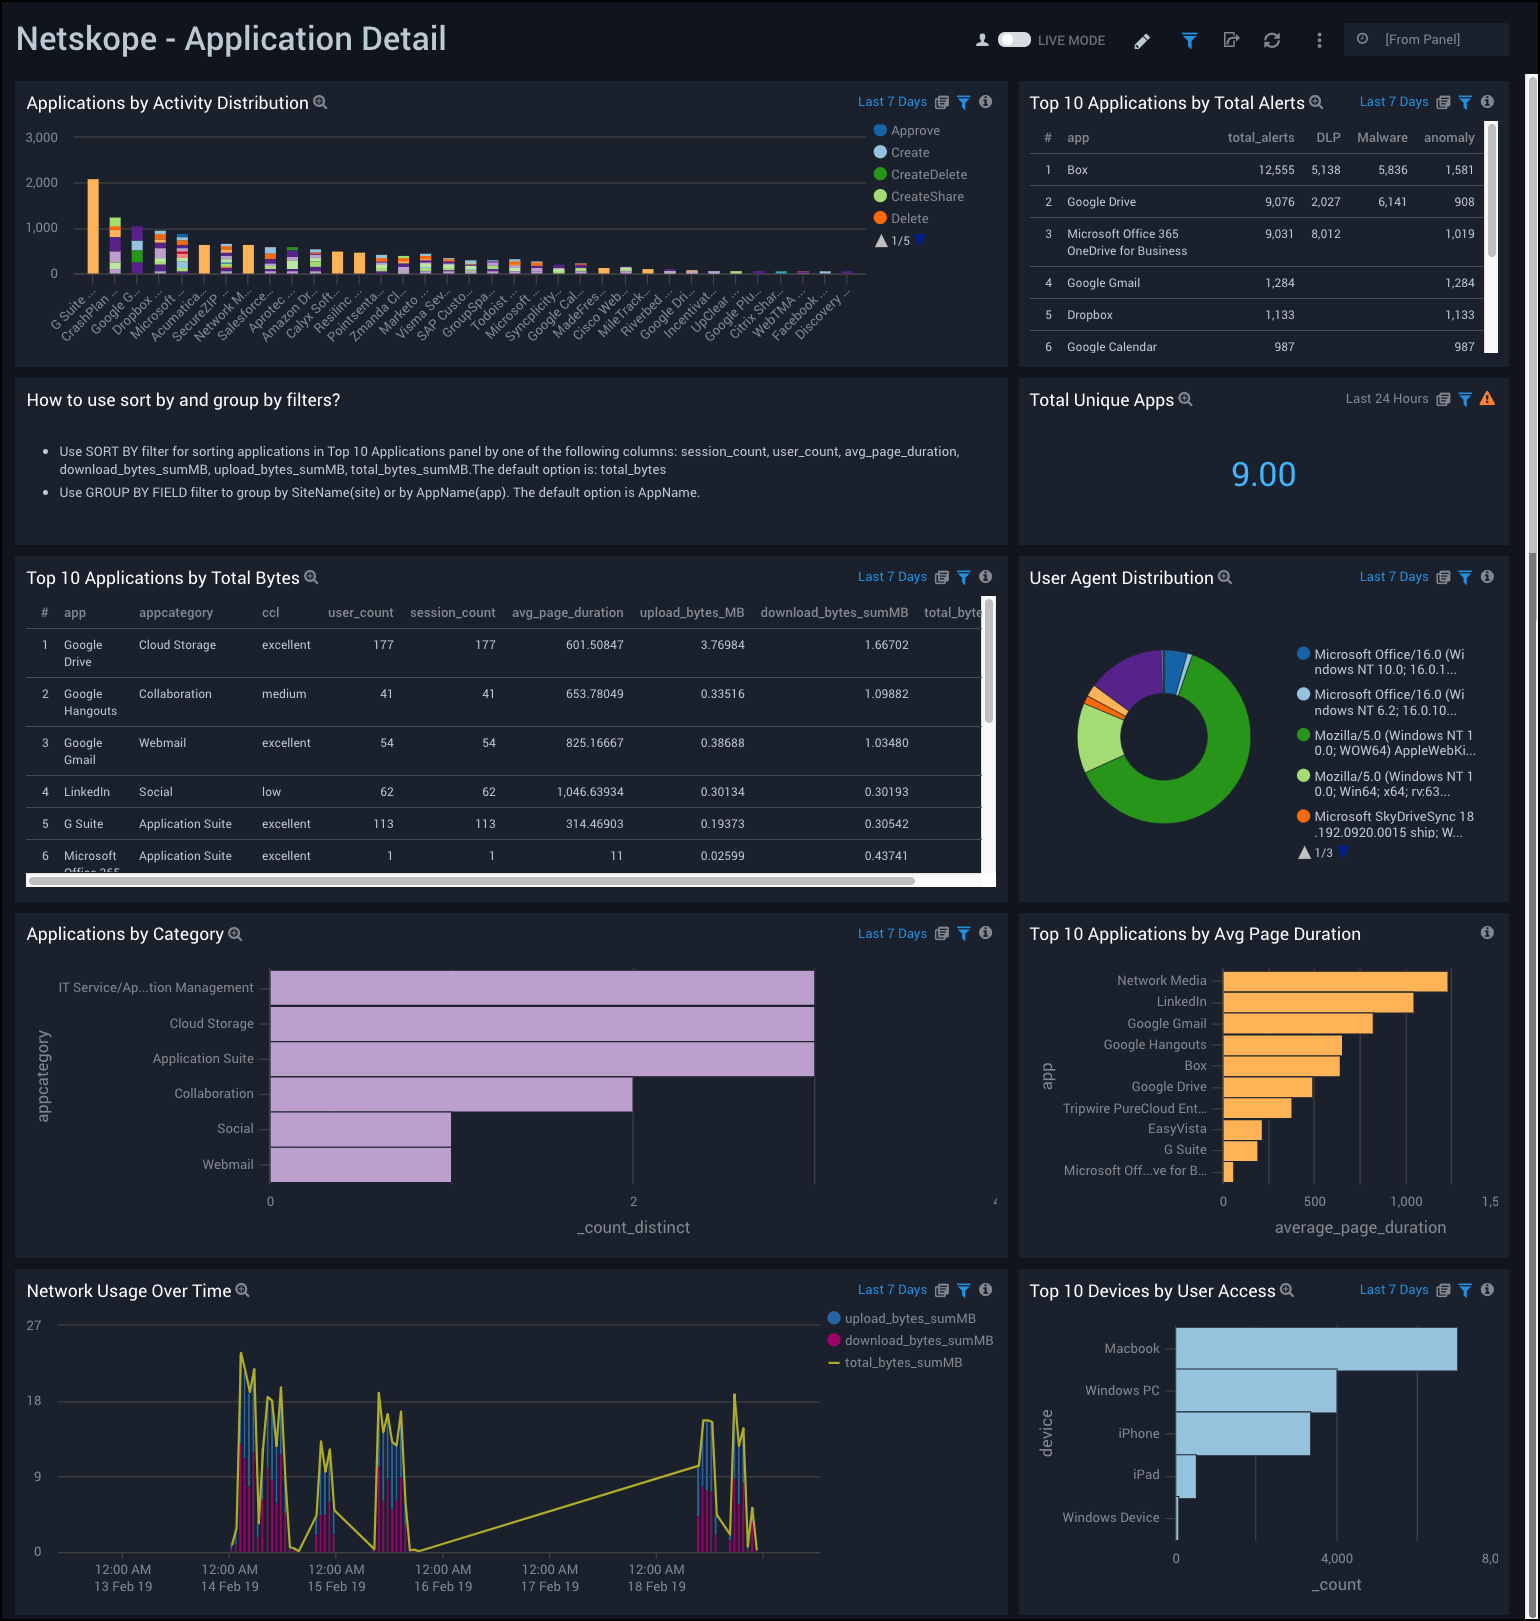
Application Details
The Netskope - Application Details dashboard provides a high-level view of data for unique applications used, as well as top applications by alerts, bytes, and average page duration. This dashboard also provides a visual breakdown of applications by category, devices by user access, and network usage over time.
Use this dashboard to:
- Monitor the top applications generating alerts.
- Find out detailed information about application usage in terms of page duration, user counts, upload and download bytes.
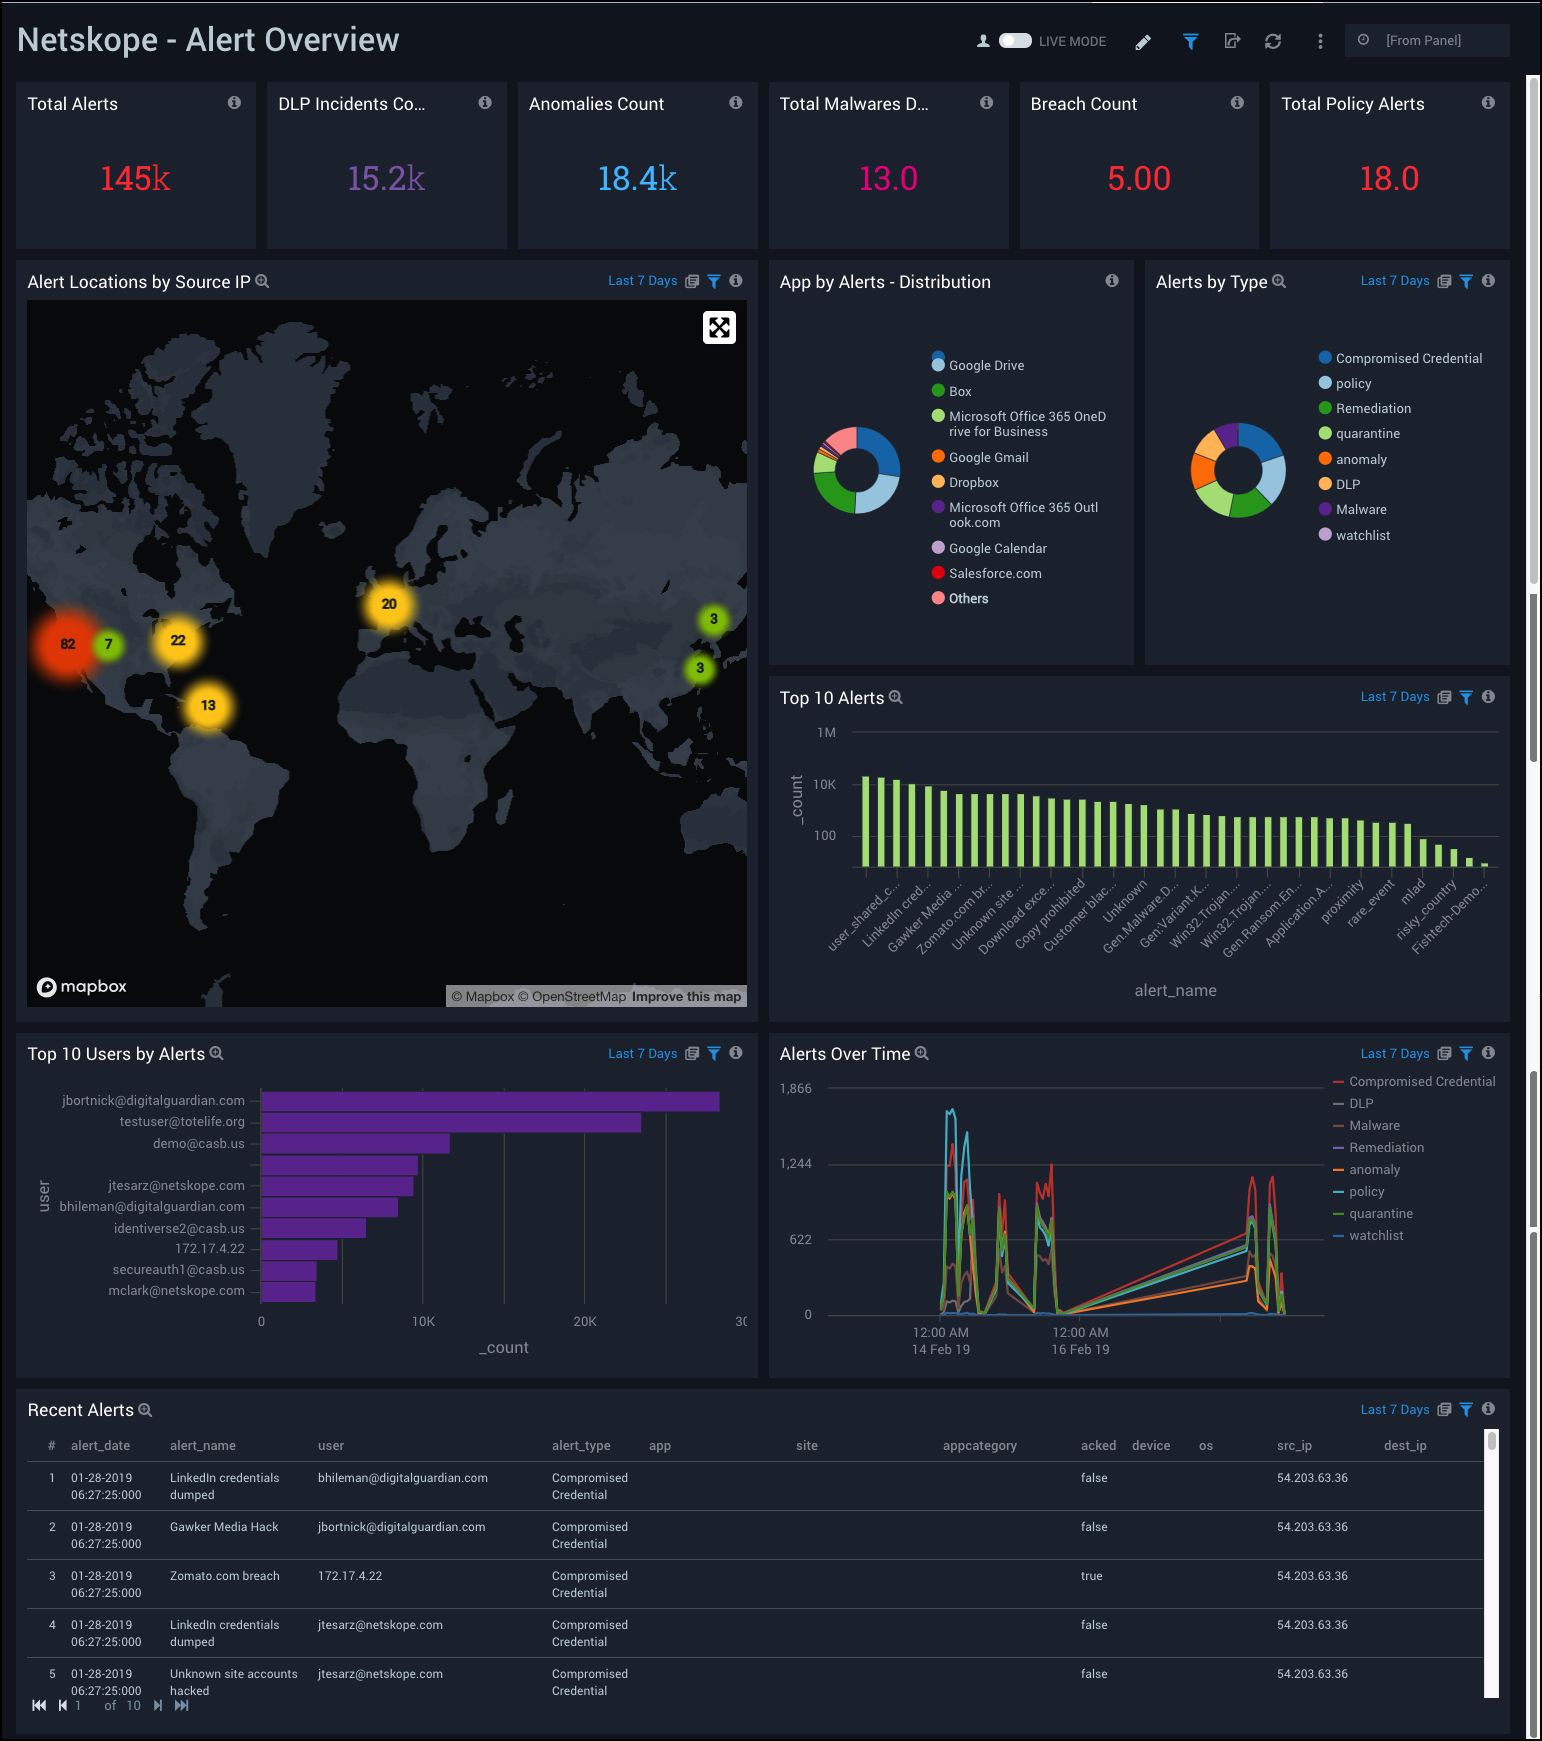
Alert Overview
The Netskope - Alert Overview dashboard provides a high-level view of your alert data by type, geographic location of source IPs, total and top alerts, alerts by user, recent alerts, and alert trends over time.
Use this dashboard to:
- Track users affected by alerts.
- Monitor abnormal spikes, alert locations, and recent alerts.
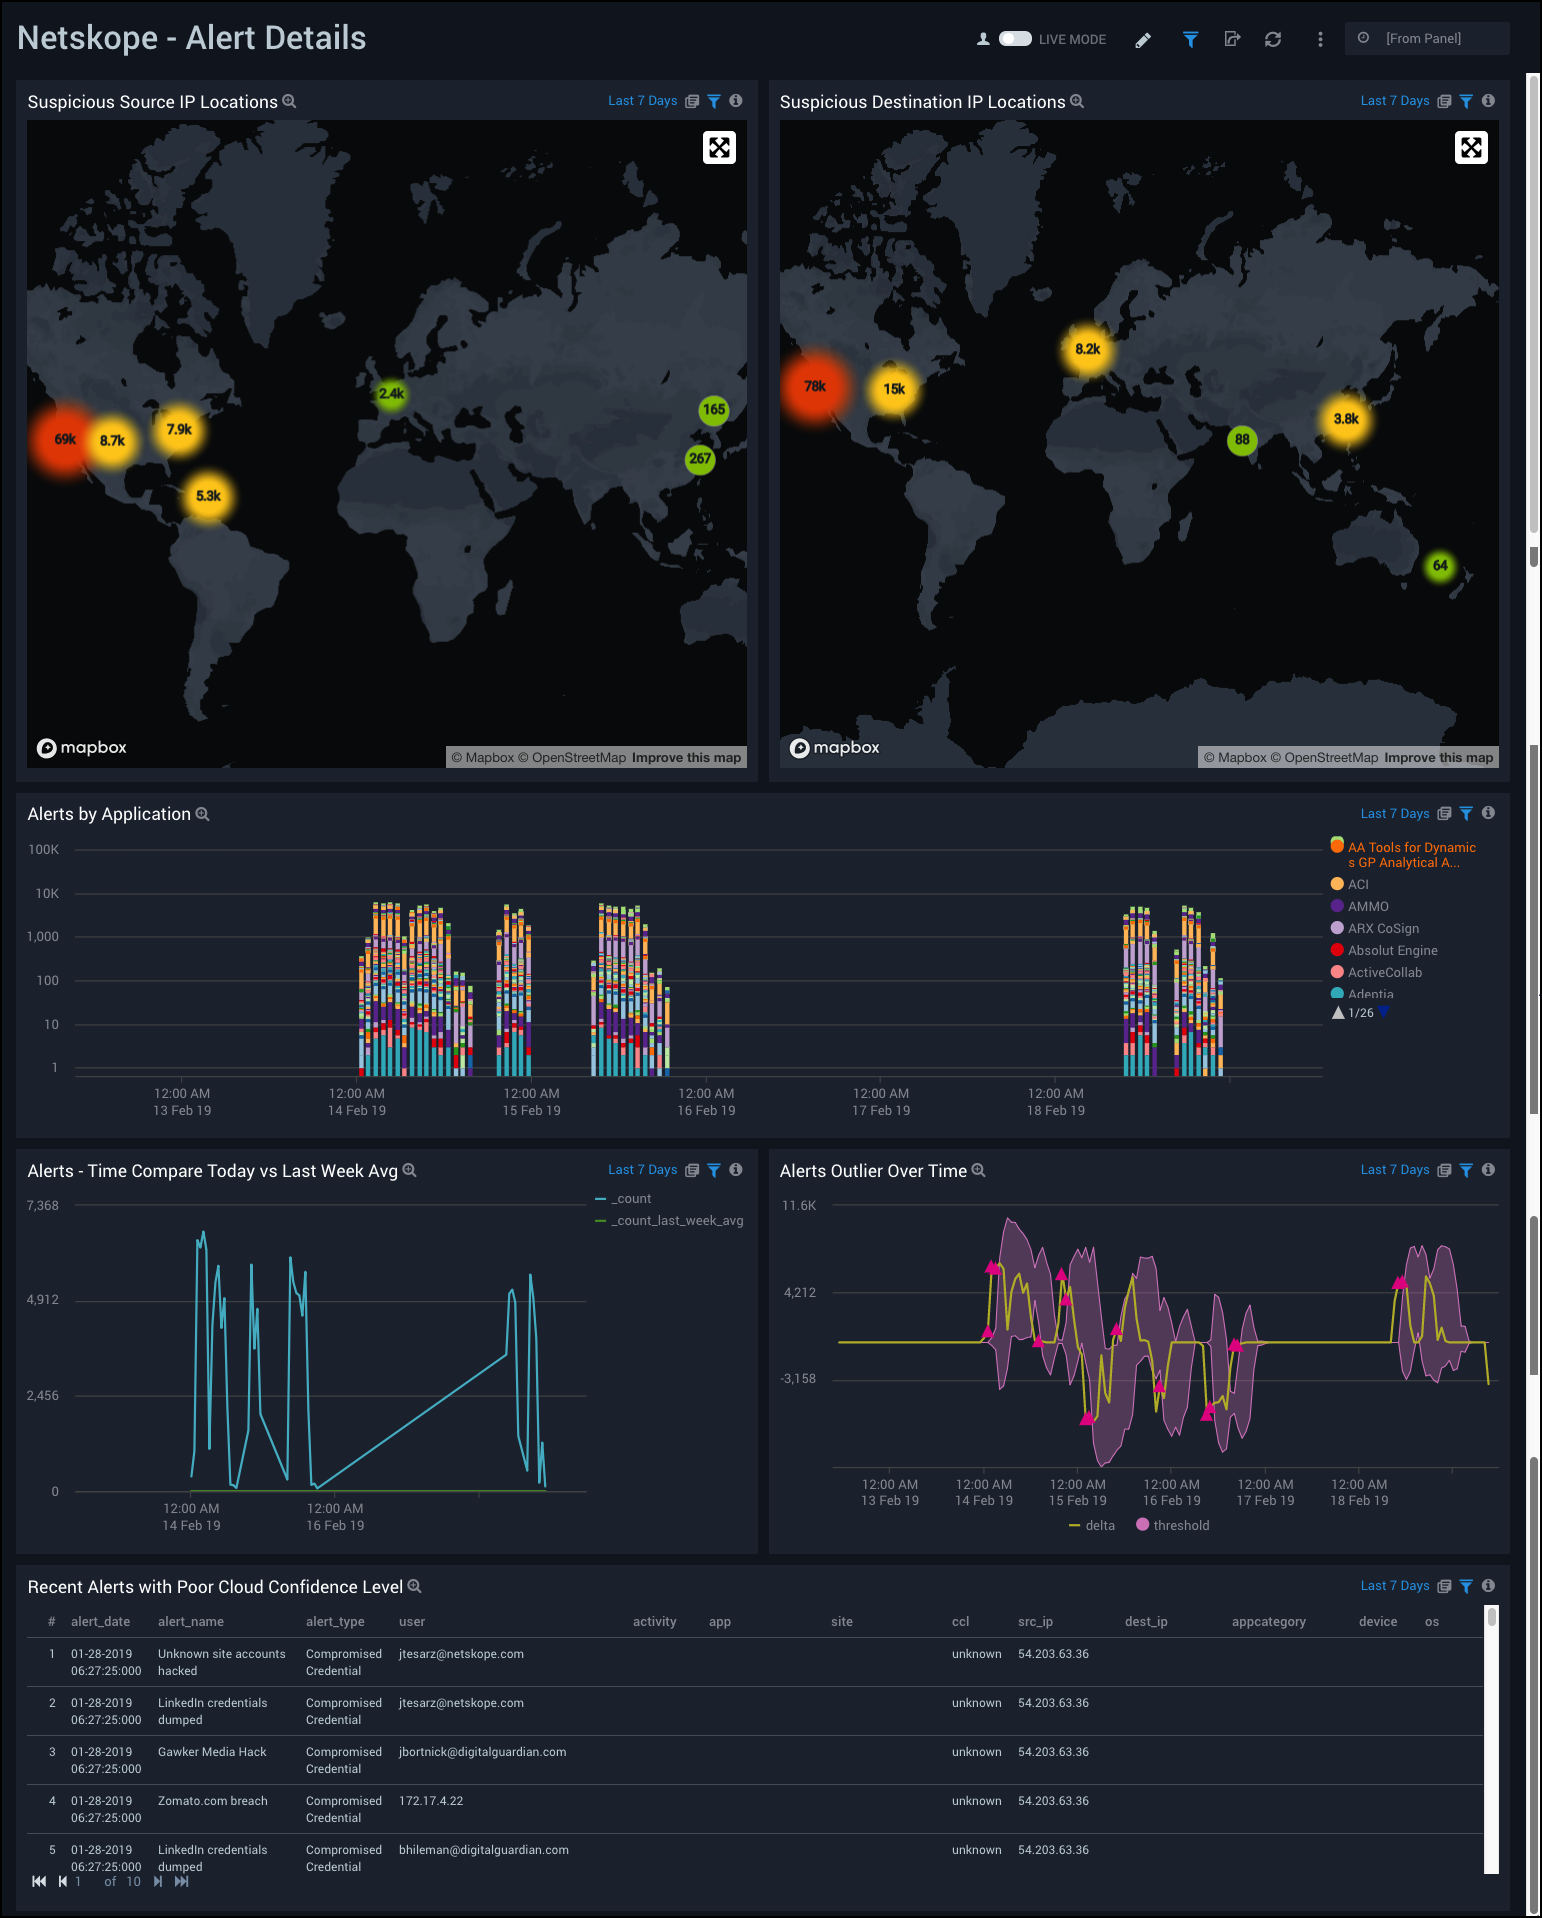
Alert Details
The Netskope - Alert Details dashboard provides a visual presentation of alert analytics, including the geographic locations of suspicious source and destination IPs, a time compare of alters, alert outlier trends over time, alerts by application, and recent alerts with a poor cloud confidence level.
Use this dashboard to:
- Compare alerts over time and anomalies in alert rates.
- Track which applications are producing the most alerts over time.
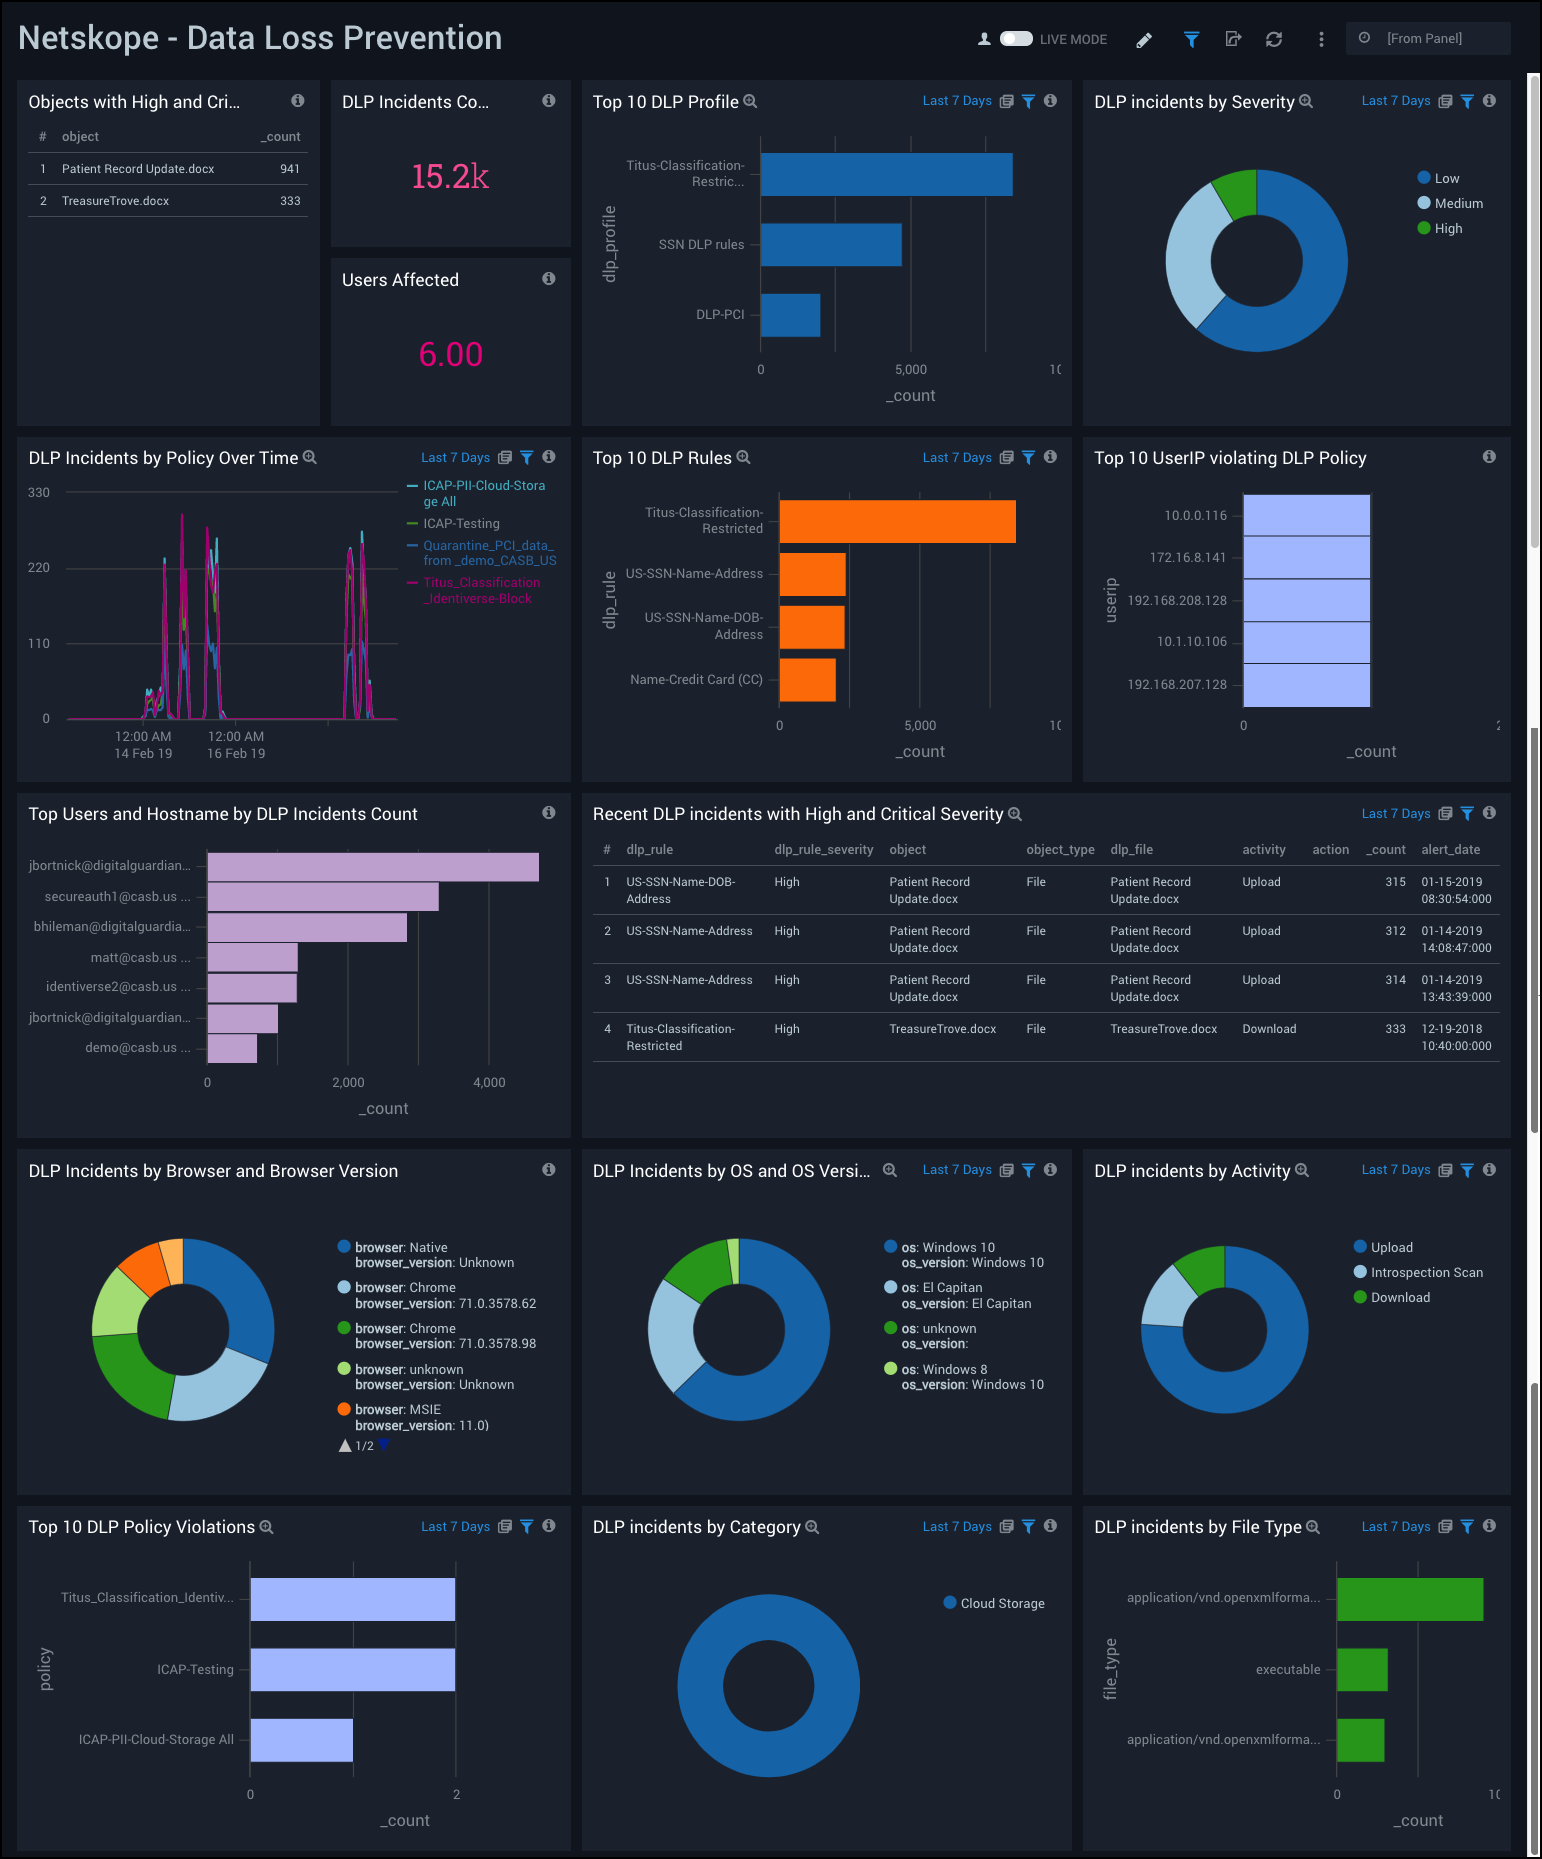
Data Loss Prevention
The Netskope - Data Loss Prevention dashboard provides a high-level view of data loss prevention (DLP) analytics, including incidents by policy over time, incidents by severity and application, incidents by operating system (OS) and browser. This dashboard also shows data on DLP rules, top profiles, incident count, and users affected.
Use this dashboard to:
- Track users and applications affected by DLP incidents.
- Monitor High Severity DLP incidents.
- Determine objects with critical severity.
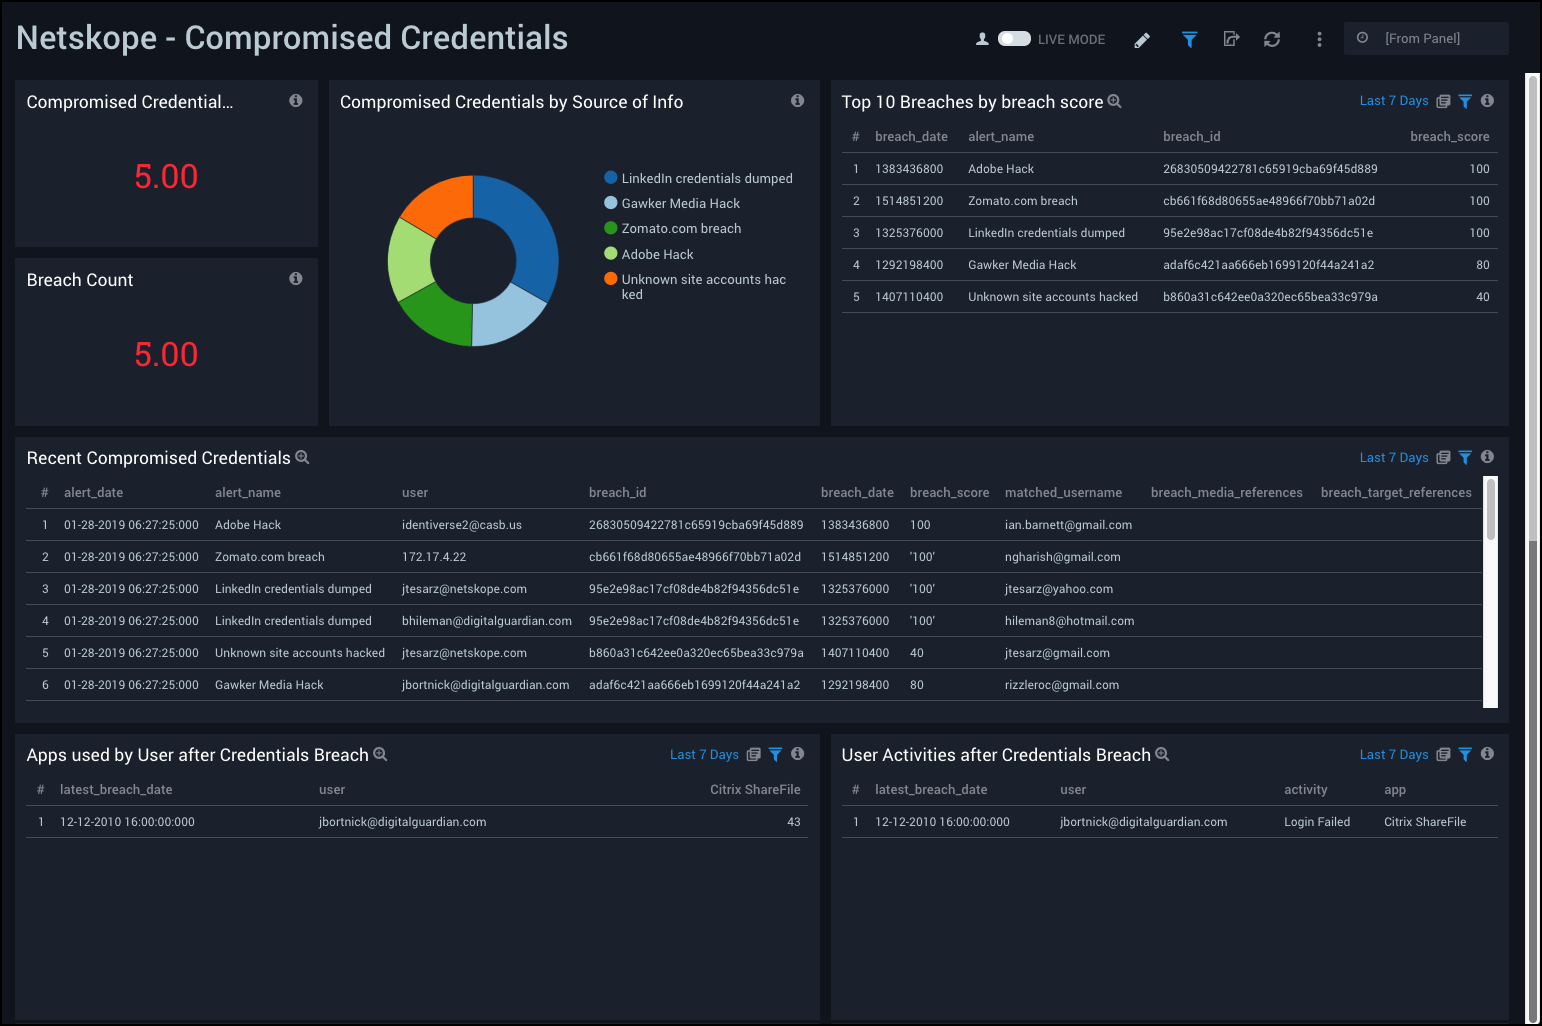
Compromised Credentials
The Netskope - Compromised Credentials dashboard provides easily accessible analytics on compromised credentials, including the number of users with compromised credentials, a breach count and top breaches, and source info. This dashboard also provides data on recent compromised credentials, apps used by users after a credentials breach, and user activities after a credentials breach.
Use this dashboard to:
- Track credential breaches along with their source.
- Monitor user activities.
- Monitor application usage after credentials have been breached.
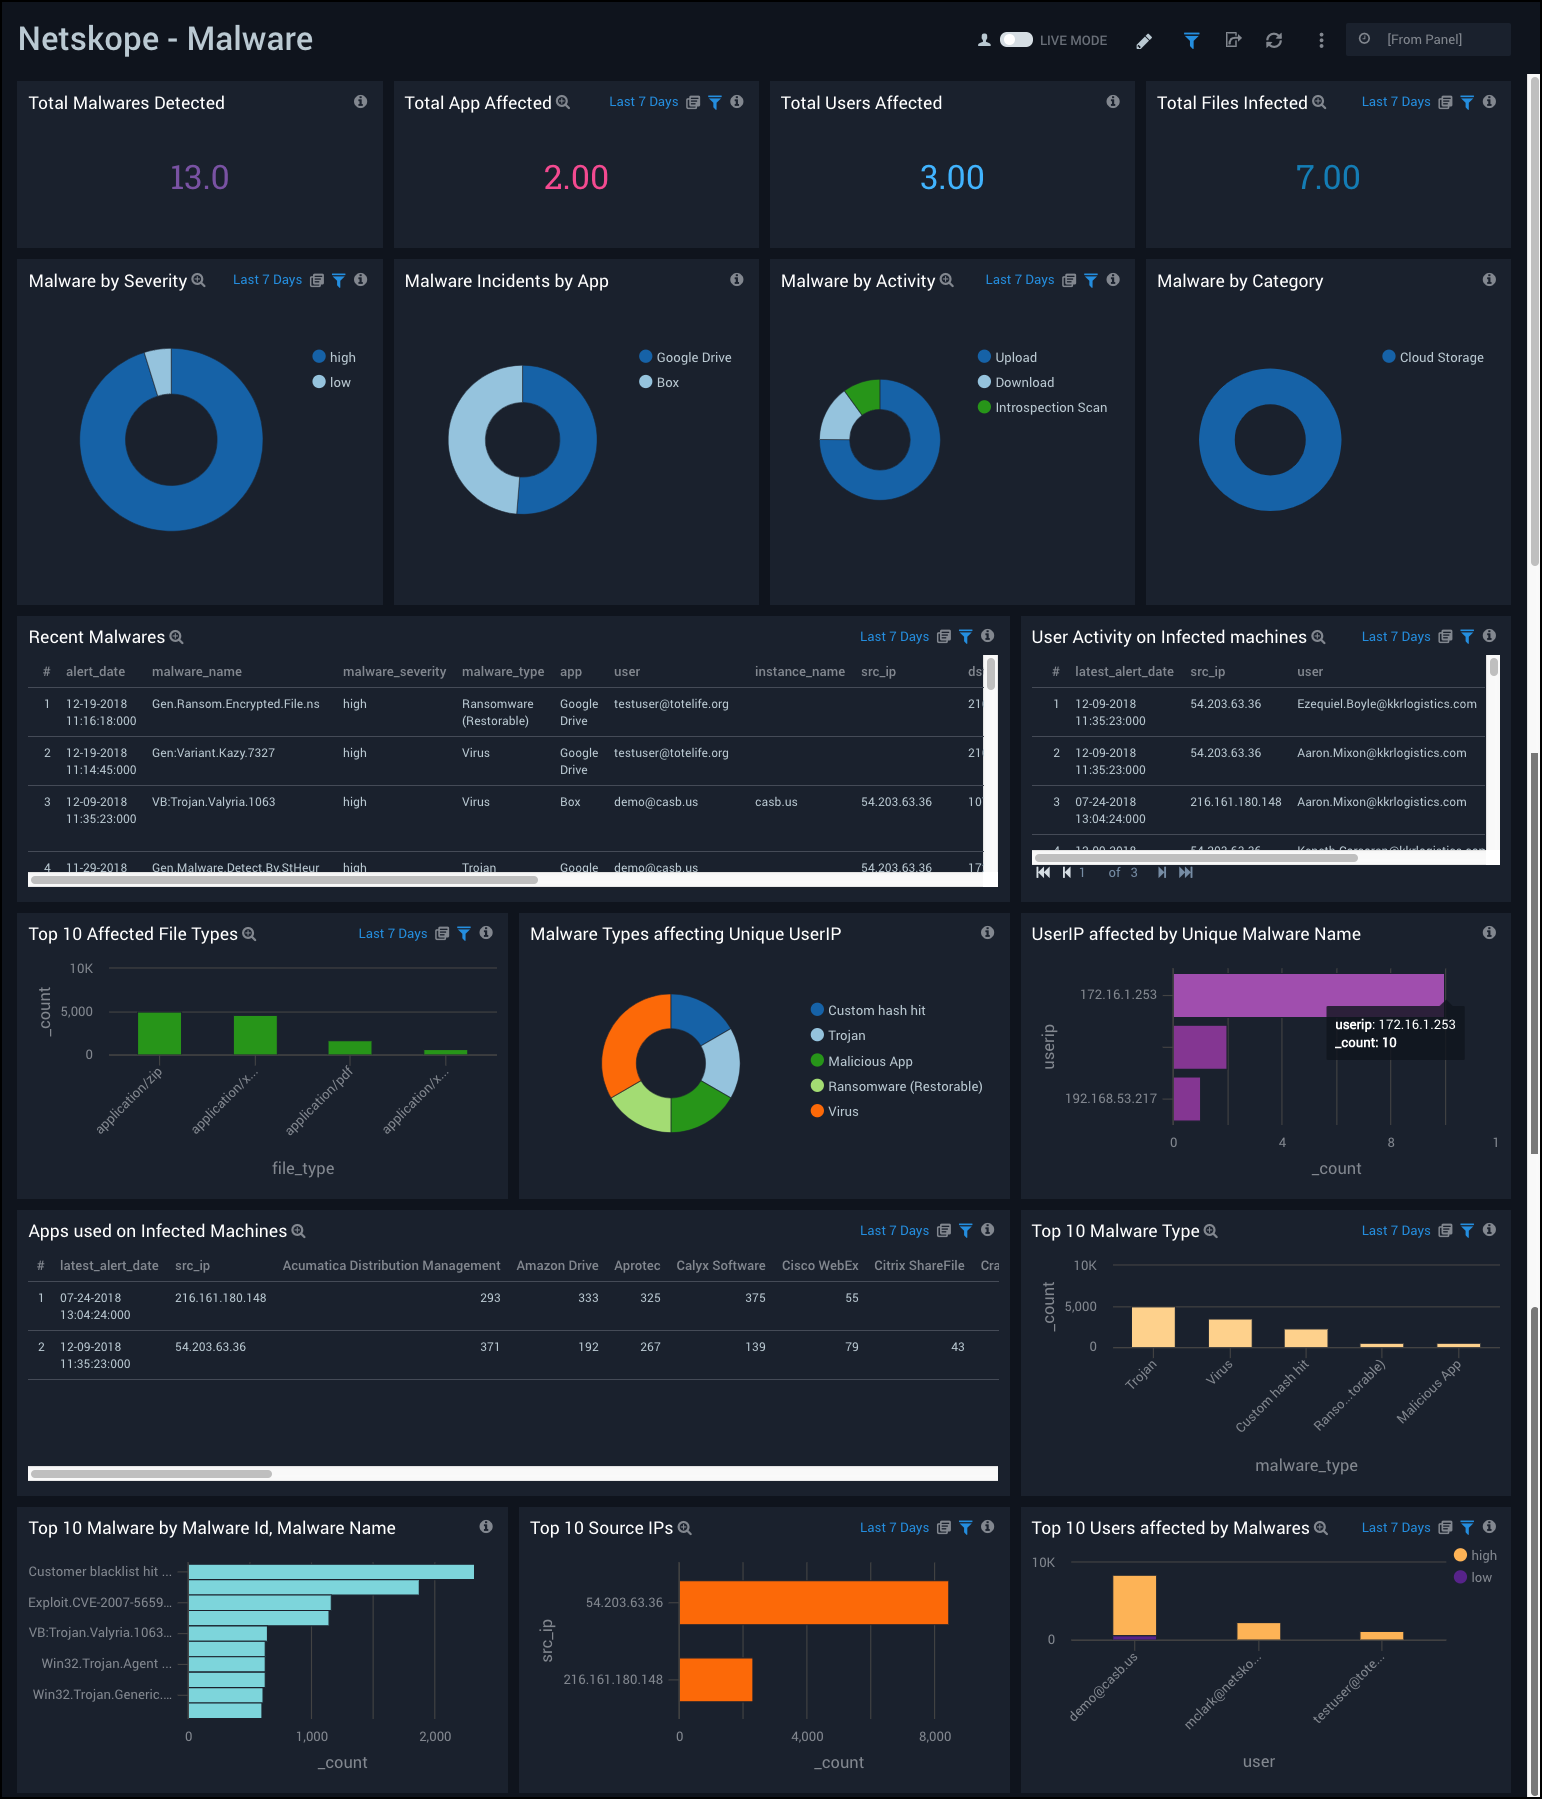
Malware
The Netskope - Malware dashboard provides a high-level view of total malwares detected, total apps and users affected, total files infected, top source IPs and malware types, and the top users affected. This dashboard also provides data malware incidents by app and severity, affected file types, apps used on infected machines, and the user activity on infected machines.
Use this dashboard to:
- Determine applications and users affected by malware.
- Monitor user activity on affected machines.
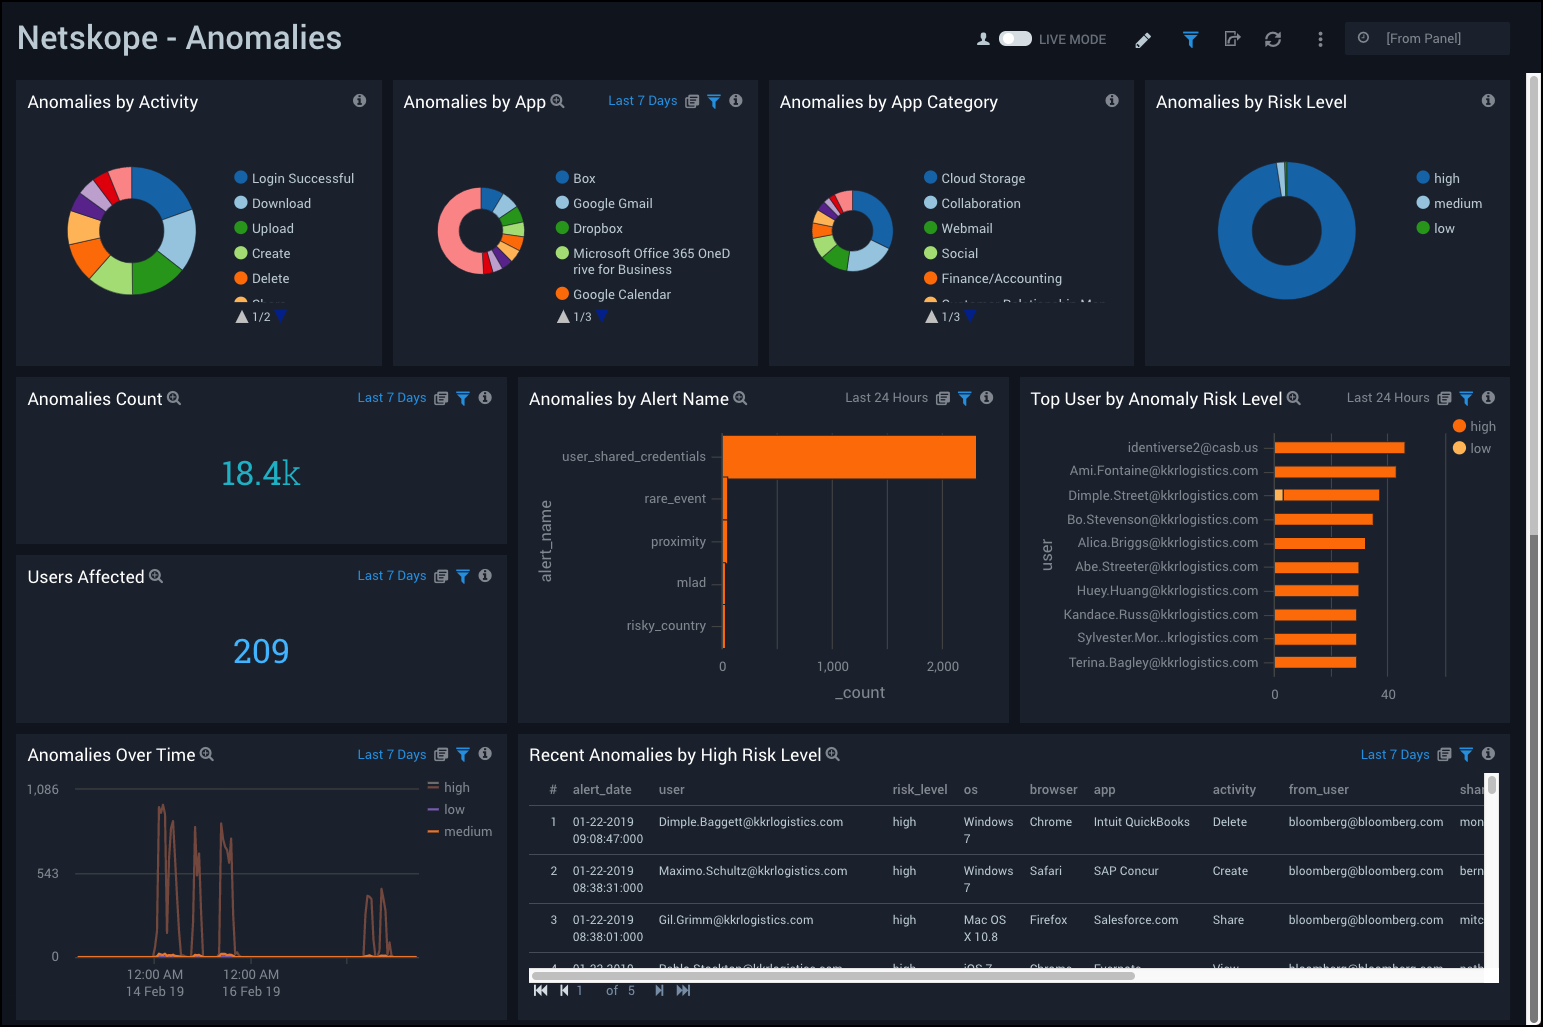
Anomalies
The Netskope - Anomalies dashboard provides an at-a-glance view of anomalies on your environment, including the number of anomalies, users affected, anomalies over time, anomalies by app, alert name, and risk level. It also includes data on top users by anomaly risk level and recent anomalies by high risk level.
Use this dashboard to:
- Monitor anomalies in users activities.
- Track anomalies with high risk levels.
Upgrade/Downgrade the Netskope app (Optional)
To update the app, do the following:
Next-Gen App: To install or update the app, you must be an account administrator or a user with Manage Apps, Manage Monitors, Manage Fields, Manage Metric Rules, and Manage Collectors capabilities depending upon the different content types part of the app.
- Select App Catalog.
- In the Search Apps field, search for and then select your app.
Optionally, you can identify apps that can be upgraded in the Upgrade available section. - To upgrade the app, select Upgrade from the Manage dropdown.
- If the upgrade does not have any configuration or property changes, you will be redirected to the Preview & Done section.
- If the upgrade has any configuration or property changes, you will be redirected to the Setup Data page.
- In the Configure section of your respective app, complete the following fields.
- Field Name. If you already have collectors and sources set up, select the configured metadata field name (eg _sourcecategory) or specify other custom metadata (eg: _collector) along with its metadata Field Value.
- Click Next. You will be redirected to the Preview & Done section.
Post-update
Your upgraded app will be installed in the Installed Apps folder and dashboard panels will start to fill automatically.
See our Release Notes changelog for new updates in the app.
To revert the app to a previous version, do the following:
- Select App Catalog.
- In the Search Apps field, search for and then select your app.
- To version down the app, select Revert to < previous version of your app > from the Manage dropdown.
Uninstalling the Netskope app (Optional)
To uninstall the app, do the following:
- Select App Catalog.
- In the 🔎 Search Apps field, run a search for your desired app, then select it.
- Click Uninstall.