Observable Networks

The Observable Networks app allows you to monitor your Observable Networks deployment from Sumo Logic. The app Overview Dashboard provides insight to high-level data about your network.
From Sumo Logic, you may also set up forwarding for log monitoring and authentication logs to Observable Networks. With log monitoring, Observable Networks can notify you when it detects that a Collector is missing, exposing gaps in your log coverage. Authentication log forwarding allows for more accurate and detailed alerts, using Sumo Logic log data to provide extra richness to Observable's Dynamic Endpoint Modeling algorithms.
Observable Networks is a provider of network security technology and advanced threat detection services that identify compromised and misused networked devices. Observable's Dynamic Endpoint Modeling technology includes a cloud-based service platform incorporating automated security analytics and real-time traffic sensors to continuously model all devices on a network. Endpoint modeling is based on network traffic flow metadata and is indifferent to encryption. Observable makes it easy to readily understand normal and abnormal device behaviors, helping to identify compromised devices and facilitate faster remediation.
For more information, visit Observable Networks (via Cisco).
Before you begin, your Observable Networks portal must be properly configured. Contact support@obsrvbl.com if you have any questions.
Log types
The Sumo Logic app for Observable Networks assumes Observable Networks formatted logs, which provide one JSON message per request.
Collect logs for the Observable Network app
This section provides instructions for configuring log collection for the Observable Network App, as well as relevant log and query samples.
The Observable Networks App allows you to monitor your Observable Networks deployment from Sumo Logic. From Sumo Logic, you can set up forwarding for log monitoring and authentication logs to Observable Networks. With log monitoring, Observable Networks can notify you when a collector is missing, exposing gaps in your log coverage. Authentication log forwarding allows for more accurate and detailed alerts, using Sumo Logic log data to provide extra richness to Observable's Dynamic Endpoint Modeling algorithms.
Observable Networks is a provider of network security technology and advanced threat detection services that identify compromised and misused networked devices. Observable's Dynamic Endpoint Modeling technology includes a cloud-based service platform incorporating automated security analytics and real-time traffic sensors to continuously model all devices on a network. Endpoint modeling is based on network traffic flow metadata and is indifferent to encryption. Observable makes it easy to readily understand normal and abnormal device behaviors, helping to identify compromised devices and facilitate faster remediation.
For more information, visit Observable Networks (via Cisco).
Prerequisites
From your Observable Networks portal, click Settings (gear icon) > Integrations > Sumo Logic > Settings and enter the Access ID, Access Key, and Source URL on the Sumo Logic Settings page. Before you begin, your Observable Networks portal must be properly configured. If you have any questions, contact support@obsrvbl.com.
Configure a Collector
Configure a Hosted Collector. Name the collector "observable" (case-sensitive).
Create an access key:
- Classic UI. In the main Sumo Logic menu, select Manage Data > Collection > Collection.
New UI. In the Sumo Logic top menu select Configuration, and then under Data Collection select Collection. You can also click the Go To... menu at the top of the screen and select Collection. - Click Access Keys.
- Add a new access key called Observable Networks, then save the new Access ID and Access Key values.
Configure a Source
Configure an HTTP Source. Name the new source "observable" (case-sensitive). Deselect the check box Enable Timestamp Parsing.
When the URL associated with the Source is displayed, copy the URL so you can use it to send files.
Configure the Observable Portal
- From your Observable Networks portal, click Settings (gear icon) > Integrations > Sumo Logic > Settings.
- On the Sumo Logic Settings page, enter the Access ID, Access Key, and Source URL from the previous sections.
- Check Enabled, then click Save.
Your Observable Networks deployment will now publish alert and endpoint information to Sumo Logic.
Configure Log Monitoring (optional)
If you have Sumo Logic API access, you can integrate Observable Networks and Sumo Logic even further. You can configure Observable Networks to identify devices on your network that do not have Collectors installed. Additionally, Observable Networks can parse authentication log ("auth.log") data from certain Linux distributions (e.g., Ubuntu) to monitor user access.
Identify Missing Collectors
You can configure the Observable Networks portal to expect certain roles in the network to have corresponding log files. For example, you might expect a Terminal Server to capture an auth.log. When you configure this expectation, Observable will alert when a role is missing an expected log file, notifying you that there is a gap in your log coverage.
To configure an expectation in Observable Networks:
- From your Observable Networks portal, click Settings (gear icon) > Integrations > Sumo Logic > Logs.
- Enter the name for the expected log, such as Auth Log.
- Enter the Log Query Prefix, which is the search prefix given to Sumo Logic to filter for this log. For example,
_source=auth.log. - Select the roles that are expected to have this log. For example, Terminal Server. Only roles present on your network are available.
- Click Save.
You can also add a log without associating any roles. In this case, simply leave all roles deselected in Step 4.
Parse Authentication Logs
If you are collecting auth.log data in Sumo Logic from a compatible Linux distribution, you can configure Observable Networks to parse this data and monitor session activity.
Before you begin, make sure that you are collecting from an auth.log source, and make sure that it is configured on the Sumo Logic Logs page.
To parse authentication logs:
- From your Observable Networks portal, click Settings (gear icon) > Integrations > Sumo Logic > Settings.
- From the Auth.log dropdown, select the log configuration that represents the auth.log source.
- Click Save.
Sample log message
{
   "id": 350698,
   "source_info": {
      "ips": [
         "10.147.115.88",
         "10.41.174.78"
      ],
      "hostnames": [
         "i-0da95a1534cafcae8"
      ],
      "namespace": "awsv2:078653657564:us-east-1:vpc-c837e7ac",
      "name": "i-0da95a1534cafcae8",
      "created": "2017-01-21T14:43:53.267268+00:00"
   },
   "timestamp": "2017-02-05T08:00:00Z",
   "role": "AWS EC2 Instance",
   "source": 97385,
   "obsrvbl_type": "role"
}

{
   "id": 349848,
   "source_info": {
      "ips": [
         "10.138.70.165",
         "184.73.187.100"
      ],
      "hostnames": [
         "i-2979aa4d"
      ],
      "namespace": "awsv2:078653657564:us-east-1",
      "name": "yodlee-staging",
      "created": "2016-09-06T22:23:22.937360+00:00"
   },
   "timestamp": "2017-02-05T08:00:00Z",
   "role": "AWS EC2 Instance",
   "source": 236,
   "obsrvbl_type": "role"
}
Sample queries
_sourceCategory=observable | json field=_raw "obsrvbl_type", "effective_session_count" as type, session_count
| where type="session_count"
| timeslice 10m
| sum(session_count) group by _timeslice
| order by _timeslice
_sourceCategory=observable
| json field=_raw "obsrvbl_type", "source_info.name" as type, name
| where type = "observation"
| count by name
| order by _count desc
Install the Observable Networks app
To install the app, do the following:
Next-Gen App: To install or update the app, you must be an account administrator or a user with Manage Apps, Manage Monitors, Manage Fields, Manage Metric Rules, and Manage Collectors capabilities depending upon the different content types part of the app.
- Select App Catalog.
- In the 🔎 Search Apps field, run a search for your desired app, then select it.
- Click Install App.
note
Sometimes this button says Add Integration.
- Click Next in the Setup Data section.
- In the Configure section of your respective app, complete the following fields.
- Field Name. If you already have collectors and sources set up, select the configured metadata field name (eg _sourcecategory) or specify other custom metadata (eg: _collector) along with its metadata Field Value.
- Click Next. You will be redirected to the Preview & Done section.
Post-installation
Once your app is installed, it will appear in your Installed Apps folder, and dashboard panels will start to fill automatically.
Each panel slowly fills with data matching the time range query received since the panel was created. Results will not immediately be available but will be updated with full graphs and charts over time.
Viewing Observable Networks dashboards
All dashboards have a set of filters that you can apply to the entire dashboard. Use these filters to drill down and examine the data to a granular level.
- You can change the time range for a dashboard or panel by selecting a predefined interval from a drop-down list, choosing a recently used time range, or specifying custom dates and times. Learn more.
- You can use template variables to drill down and examine the data on a granular level. For more information, see Filtering Dashboards with Template Variables.
- Most Next-Gen apps allow you to provide the scope at the installation time and are comprised of a key (
_sourceCategoryby default) and a default value for this key. Based on your input, the app dashboards will be parameterized with a dashboard variable, allowing you to change the dataset queried by all panels. This eliminates the need to create multiple copies of the same dashboard with different queries.
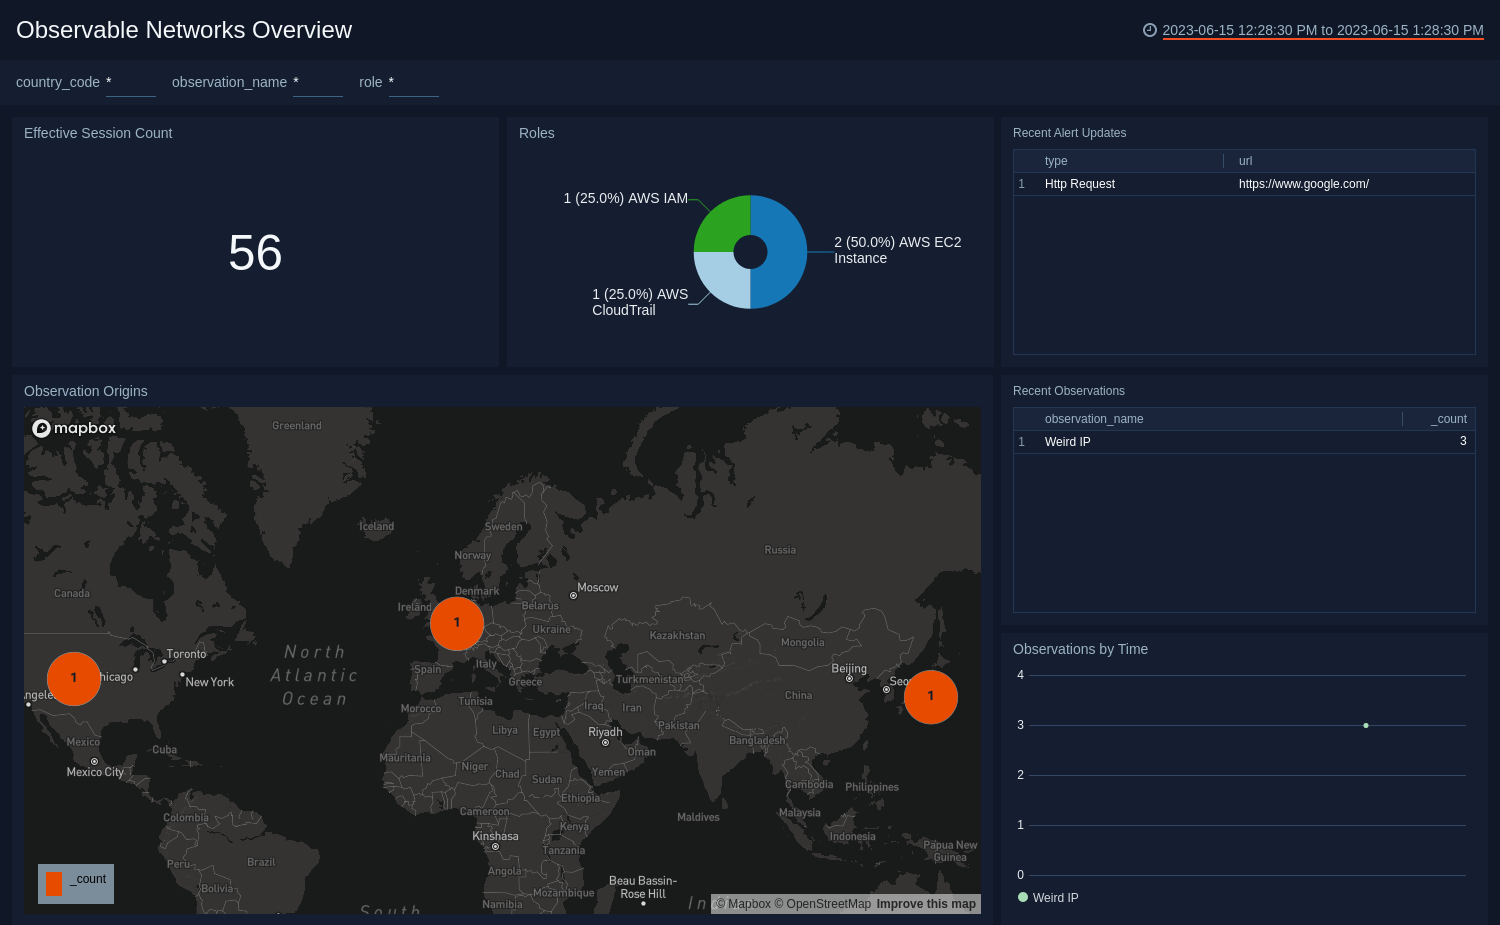
Overview
The Observable Networks Overview dashboard is intended to provide a high level at-a-glance view into your network.
Effective Session Count. Displays the number of effective "flows" ("sessions") as a single value chart for the last hour.
Roles. Provides a breakdown of the types of endpoints currently on the network in a pie chart for the last hour. Endpoint types could be WebServer, iOS, Printer, etc. Roles are published every hour, so this Panels displays the latest role distribution on your network.
Recent Alert Updates. Shows a list of recently updated alerts in a table with a URL link to their alert detail page on the Observable Networks portal for the last six hours. Click the links for more details about an alert. If this Panel is empty, that means there have been no alerts for the last six hours.
Observation Origins. Displays observations that relate to activity with external endpoints (e.g., "New External Server") on a map of the world for the last six hours.
Recent Observations. Lists the latest observations on the system and their counts in a table for the last six hours. Observations are notable events about your network, which are the building blocks for alerts.
Observations by Time. Displays the frequency of each observation type as an area chart on a timeline for the last six hours.
Searches
Recent Flow Count. This query shows the history of flow counts for your network. A network flow describes a single piece of communication on your network, including source and destination IPs, ports, and protocol (TCP, UDP, etc.). Flows are the main input to the Observable Networks platform.
Role History. This multi-line graph shows the population of each role type on the network. Here you can track how the population of your network has changed over time. For example, the number of iOS devices and printers.
Top Observation Hosts. This is simple query shows the hosts (sources) with the most observation counts.
Upgrade/Downgrade the Observable Networks app (Optional)
To update the app, do the following:
Next-Gen App: To install or update the app, you must be an account administrator or a user with Manage Apps, Manage Monitors, Manage Fields, Manage Metric Rules, and Manage Collectors capabilities depending upon the different content types part of the app.
- Select App Catalog.
- In the Search Apps field, search for and then select your app.
Optionally, you can identify apps that can be upgraded in the Upgrade available section. - To upgrade the app, select Upgrade from the Manage dropdown.
- If the upgrade does not have any configuration or property changes, you will be redirected to the Preview & Done section.
- If the upgrade has any configuration or property changes, you will be redirected to the Setup Data page.
- In the Configure section of your respective app, complete the following fields.
- Field Name. If you already have collectors and sources set up, select the configured metadata field name (eg _sourcecategory) or specify other custom metadata (eg: _collector) along with its metadata Field Value.
- Click Next. You will be redirected to the Preview & Done section.
Post-update
Your upgraded app will be installed in the Installed Apps folder and dashboard panels will start to fill automatically.
See our Release Notes changelog for new updates in the app.
To revert the app to a previous version, do the following:
- Select App Catalog.
- In the Search Apps field, search for and then select your app.
- To version down the app, select Revert to < previous version of your app > from the Manage dropdown.
Uninstalling the Observable Networks app (Optional)
To uninstall the app, do the following:
- Select App Catalog.
- In the 🔎 Search Apps field, run a search for your desired app, then select it.
- Click Uninstall.