Palo Alto Networks 9

The Sumo Logic app for Palo Alto Networks 9 utilizes PANOS 9 new features in predefined dashboards to provide extensive security analytics throughout your Palo Alto Networks environment. New PANOS 9 features include:
- GlobalProtect
- Panorama
- User-ID
- App-ID
- Content Inspection
- DNS Security
Palo Alto Networks 9 provides consistent protection across the data center, perimeter, branch, mobile and cloud networks.
Log types
The Palo Alto Networks 9 app uses the following log types:
Sample log messages
Oct 09 10:15:15 SumoRedfw01a 1,2019/10/09
10:15:15,001234567890002,SYSTEM,general,0,2019/10/09
10:15:15,,general,,0,0,general,critical,License for feature threat will expire on 2019/09/28,0123456789,0x0,0,0,0,0,,SumoRedfw01a
Oct 14 11:37:34 SumoRedfw01a 1,2019/10/14
11:37:34,001234567890001,CONFIG,0,0,2019/10/14
11:37:34,195.186.216.125,,clone,dduc,Web,Succeeded, config shared reports,,,0123456789,0x8000000000000000,0,0,0,0,,SumoRedfw01a
Oct 09 10:10:15 SumoRedfw01a.sumotest.com 1,2019/10/09
10:10:15,001234567890002,USERID,logout,2304,2019/10/09
10:10:15,vsys1,17.174.122.37,dduc,,0,1,0,0,0,vpn-client,globalprotect,0123456789,0x0,0,0,0,0,,SumoRedfw01a,1,,2019/10/09
10:10:15,1,0x80,aruan
Oct 09 10:20:15 SumoRedfw01a.sumotest.com 1,2019/10/09
10:20:15,001234567890002,HIPMATCH,0,2304,2019/10/09 10:20:15,ira,vsys1,oh-C02ABCDEFGH4,Mac,67.240.185.235,GP-HIP-PROFILE,1,profile,0,0,0123456789,0x0,0,0,0,0,,SumoRedfw01a,1,0.0.0.0,gh:85:90:99:5a:40,C02ABCDEFGH
Oct 09 10:19:15 SumPunFw07.sumotest.com 1,2019/10/09
10:19:15,001234567890002,TRAFFIC,drop,2304,2019/10/09
10:19:15,209.118.103.150,160.177.222.249,0.0.0.0,0.0.0.0,InternalServer,,,not-applicable,vsys1,inside,z1-FW-Transit,ethernet1/2,,All traffic,2019/10/09
10:19:15,0,1,63712,443,0,0,0x0,udp,deny,60,60,0,1,2019/10/09
10:19:15,0,any,0,0123456789,0x0,Netherlands,10.0.0.0-10.255.255.255,0,1,0,policy-deny,0,0,0,0,,SumPunFw07,from-policy,,,0,,0,,N/A,0,0,0,0,1202585d-b4d5-5b4c-aaa2-d80d77ba456e,0
Oct 09 10:21:11 SumPunFw07.sumotest.com 1,2019/10/09
10:21:11,001234567890002,THREAT,vulnerability,2304,2019/10/09
10:21:11,205.168.30.201,240.84.174.144,NAT_205.168.30.201,230.230.1.33,Rule 95,,,web-browsing,vsys3,z2-FW-Sumo-Internal,Z4-Outbound-internet,ethernet1/2,ethernet1/2,All traffic,2019/10/09
10:21:11,793911,1,37442,443,37442,20077,0x1402000,tcp,alert,"64.99.23.90/sslmgr?scep-profile-name=%99c",Palo Alto Networks GlobalProtect Remote Code Execution Vulnerability(54582),unknown,critical,client-to-server,0123456789,0x2000000000000000,United States,10.0.0.0-
10.255.255.255,0,,0,,,1,,,,,,,,0,0,0,0,0,,SumPunFw07,,,,,0,,0,,N/A,code-execution,AppThreat-8189-5641,0x4,0,4294967295,,,6bbbbec9-d123-4d51-1204-6aefd221079b,0
Sample queries
In the Palo Alto Networks 9 - Threat Overview dashboard, the following query detects Dest IPs Observing Multiple Threats.
_sourceCategory=Loggen/PAN* ",THREAT," !(",file," or ",url,")
| csv _raw extract 1 as f1, 2 as Receive_Time, 3 as serialNum, 4 as type, 5 as subtype, 6 as f2, 7 as LogGenerationTime, 8 as src_ip, 9 as dest_ip, 10 as NAT_src_ip, 11 as NAT_dest_ip, 12 as ruleName, 13 as src_user, 14 as dest_user, 15 as app, 16 as vsys, 17 as src_zone, 18 as dest_zone, 19 as inbound_interface, 20 as outbound_interface, 21 as LogAction, 22 as f3, 23 as SessonID, 24 as RepeatCount, 25 as src_port, 26 as dest_port, 27 as NAT_src_port, 28 as NAT_dest_port, 29 as flags, 30 as protocol, 31 as action, 32 as urlORFileName, 33 as Threat_Content_Name, 34 as category, 35 as severity, 36 as direction, 37 as seqNum, 38 as action_flags, 39 as src_country, 40 as dest_country, 41 as f4, 42 as content_type, 43 as pcap_id, 44 as filedigest, 45 as cloud, 46 as url_idx, 47 as user_agent, 48 as filetype, 49 as xff, 50 as referer, 51 as sender, 52 as subject, 53 as recipient, 54 as reportid, 55 as Device_Group_Hierarchy_l1, 56 as Device_Group_Hierarchy_l2, 57 as Device_Group_Hierarchy_l3, 58 as Device_Group_Hierarchy_l4, 59 as vsys_name, 60 as DeviceName, 61 as f5, 62 as Source_VM_UUID, 63 as Destination_VM_UUID, 64 as method, 65 as Tunnel_ID_IMSI, 66 as Monitor_Tag_IMEI, 67 as Parent_Session_ID, 68 as parent_start_time, 69 as Tunnel, 70 as thr_category, 71 as contentver, 72 as f6, 73 as SCTP_Association_ID, 74 as Payload_Protocol_ID, 75 as http_headers, 76 as URLCategoryList, 77 as UUIDforrule, 78 as HTTP2Connection
| where type = "THREAT" and subtype not in ("file", "url")
| count_distinct(Threat_Content_Name) as UniqueThreats by dest_ip
| sort by UniqueThreats, dest_ip asc
| limit 10
Collecting logs for the Palo Alto Networks 9 app
This section provides instructions for configuring log collection for the Sumo Logic app for Palo Alto Networks 9. You must have Palo Alto Networks Web administrative user permissions to successfully complete these tasks. Configuring log collection for Palo Alto Networks 9 includes the following tasks:
Step 1. Create a hosted collector and Cloud Syslog source
In this step you configure a hosted collector with a Cloud Syslog source that will act as Syslog server to receive logs and events from Palo Alto Networks devices.
To configure a hosted collector with a Cloud Syslog source, do the following:
- Sign in to Sumo Logic and create a Hosted Collector.
- Create a Cloud Syslog Source on the hosted collector, specifying the following:
- Enter a Source Name.
- Provide a Source Category. NW/PAN/V9.
- Click Save.
- Copy the Token, host URL and TCP TLS Port to a safe place. You will need this information in the tasks that follow.
Step 2. Define the destination for the logs
In this step you create a server profile where you can define the log destination. This will be the host name, port and protocol (TLS) of the Sumo Logic Cloud Syslog source.
To create a server profile specifying the log destination, do the following:
- Login to the Palo Alto Networks Web interface as an administrative user.
- Select Device tab > Server Profiles > Syslog.
- Click Add at the bottom of the screen and provide endpoint details and a profile name, such as Sumo_Logs_Profile01.
- In the Syslog Server Profile window, select the Servers tab and click Add.
- In the Servers window, specify the following information:
- In the Syslog Server Profile window, select the Custom Log Format tab, and use the following custom format for the following log types. At the end of each code snippet, you'll need to add your token from Step 1.
- Config.
,$receive_time,$serial,$type,$subtype,,$time_generated,$host,$vsys,$cmd,$admin,$client,$result,$path,$before-change-detail,$after-change-detail,$seqno,$actionflags,$dg_hier_level_1,$dg_hier_level_2,$dg_hier_level_3,$dg_hier_level_4,$vsys_name,$device_name <Token from Step 1> - System
,$receive_time,$serial,$type,$subtype,,$time_generated,$vsys,$eventid,$object,,,$module,$severity,$opaque,$seqno,$actionflags,$dg_hier_level_1,$dg_hier_level_2,$dg_hier_level_3,$dg_hier_level_4,$vsys_name,$device_name <Token from Step 1> - Threat
,$receive_time,$serial,$type,$subtype,,$time_generated,$src,$dst,$natsrc,$natdst,$rule,$srcuser,$dstuser,$app,$vsys,$from,$to,$inbound_if,$outbound_if,$logset,,$sessionid,$repeatcnt,$sport,$dport,$natsport,$natdport,$flags,$proto,$action,$misc,$threatid,$category,$severity,$direction,$seqno,$actionflags,$srcloc,$dstloc,,$contenttype,$pcap_id,$filedigest,$cloud,$url_idx,$user_agent,$filetype,$xff,$referer,$sender,$subject,$recipient,$reportid,$dg_hier_level_1,$dg_hier_level_2,$dg_hier_level_3,$dg_hier_level_4,$vsys_name,$device_name,,$src_uuid,$dst_uuid,$http_method,$tunnel_id/$imsi,$monitortag/$imei,$parent_session_id,$parent_start_time,$tunnel,$thr_category,$contentver,,$assoc_id,$ppid,$http_headers,$url_category_list,$rule_uuid,$http2_connection <Token from Step 1> - Traffic
,$receive_time,$serial,$type,$subtype,,$time_generated,$src,$dst,$natsrc,$natdst,$rule,$srcuser,$dstuser,$app,$vsys,$from,$to,$inbound_if,$outbound_if,$logset,,$sessionid,$repeatcnt,$sport,$dport,$natsport,$natdport,$flags,$proto,$action,$bytes,$bytes_sent,$bytes_received,$packets,$start,$sec,$category,,$seqno,$actionflags,$srcloc,$dstloc,,$pkts_sent,$pkts_received,$session_end_reason,$dg_hier_level_1,$dg_hier_level_2,$dg_hier_level_3,$dg_hier_level_4,$vsys_name,$device_name,$action_source,$src_uuid,$dst_uuid,$tunnelid/$imsi,$monitortag/$imei,$parent_session_id,$parent_start_time,$tunnel,$assoc_id,$chunks,$chunks_sent,$chunks_received,$rule_uuid,$http2_connection <Token from Step 1> - HIPMatch
,$_receive_time,$serial,$type,$subtype,,$time_generated,$srcuser,$vsys,$machinename,$os,$src,$matchname,$repeatcnt,$matchtype,,,$seqno,$actionflags,$dg_hier_level_1,$dg_hier_level_2,$dg_hier_level_3,$dg_hier_level_4,$vsys_name,$device_name,$vsys_id,$srcipv6,$hostid <Token from Step 1> - USERID
,$receive_time,$serial,$type,$subtype,,$time_generated,$vsys,$ip,$user,$datasourcename,$eventid,$repeatcnt,$timeout,$beginport,$endport,$datasource,$datasourcetype,$seqno,$actionflags,$dg_hier_level_1,$dg_hier_level_2,$dg_hier_level_3,$dg_hier_level_4,$vsys_name,$device_name,$vsys_id,$factortype,$factorcompletiontime,$factorno,,,$ugflags,$userbysource <Token from Step 1>
- Config.
- Click OK.
- Commit the changes.
Step 3. Configure syslog forwarding
To configure syslog forwarding for each log type (config, system, threat, traffic, HIPMatch, USERID), follow the steps to Configure Log Forwarding as described in the Palo Networks documentation.
Step 4. Verify logs in Palo Alto Networks
In this step, you view logs using the Palo Alto Network Web interface to confirm the logs are generated on the firewall.
To verify the logs in Palo Alto Networks, do the following:
- In the Palo Alto Networks UI, select Monitor > Logs.
- Once the setup is done, sign in to Sumo Logic.
- To validate that the logs are flowing to Sumo Logic, run a query using the source category you configured during Step 1, such as:
_sourceCategory = NW/PAN/V9
Install the Palo Alto Networks 9 app
This section provides instructions for installing the Palo Alto Networks 9 app, along with examples of each of the dashboards that provide visual insights into your data.
To install the app, do the following:
Next-Gen App: To install or update the app, you must be an account administrator or a user with Manage Apps, Manage Monitors, Manage Fields, Manage Metric Rules, and Manage Collectors capabilities depending upon the different content types part of the app.
- Select App Catalog.
- In the 🔎 Search Apps field, run a search for your desired app, then select it.
- Click Install App.
note
Sometimes this button says Add Integration.
- Click Next in the Setup Data section.
- In the Configure section of your respective app, complete the following fields.
- Field Name. If you already have collectors and sources set up, select the configured metadata field name (eg _sourcecategory) or specify other custom metadata (eg: _collector) along with its metadata Field Value.
- Click Next. You will be redirected to the Preview & Done section.
Post-installation
Once your app is installed, it will appear in your Installed Apps folder, and dashboard panels will start to fill automatically.
Each panel slowly fills with data matching the time range query received since the panel was created. Results will not immediately be available but will be updated with full graphs and charts over time.
Viewing Palo Alto Networks 9 dashboards
All dashboards have a set of filters that you can apply to the entire dashboard. Use these filters to drill down and examine the data to a granular level.
- You can change the time range for a dashboard or panel by selecting a predefined interval from a drop-down list, choosing a recently used time range, or specifying custom dates and times. Learn more.
- You can use template variables to drill down and examine the data on a granular level. For more information, see Filtering Dashboards with Template Variables.
- Most Next-Gen apps allow you to provide the scope at the installation time and are comprised of a key (
_sourceCategoryby default) and a default value for this key. Based on your input, the app dashboards will be parameterized with a dashboard variable, allowing you to change the dataset queried by all panels. This eliminates the need to create multiple copies of the same dashboard with different queries.
Overview
The Palo Alto Networks 9 - Overview dashboard provides an at-a-glance view of threats and events by type and severity. Panels also display information on user activity, source hosts geographic locations, and bandwidth consumption by app and virtual system.
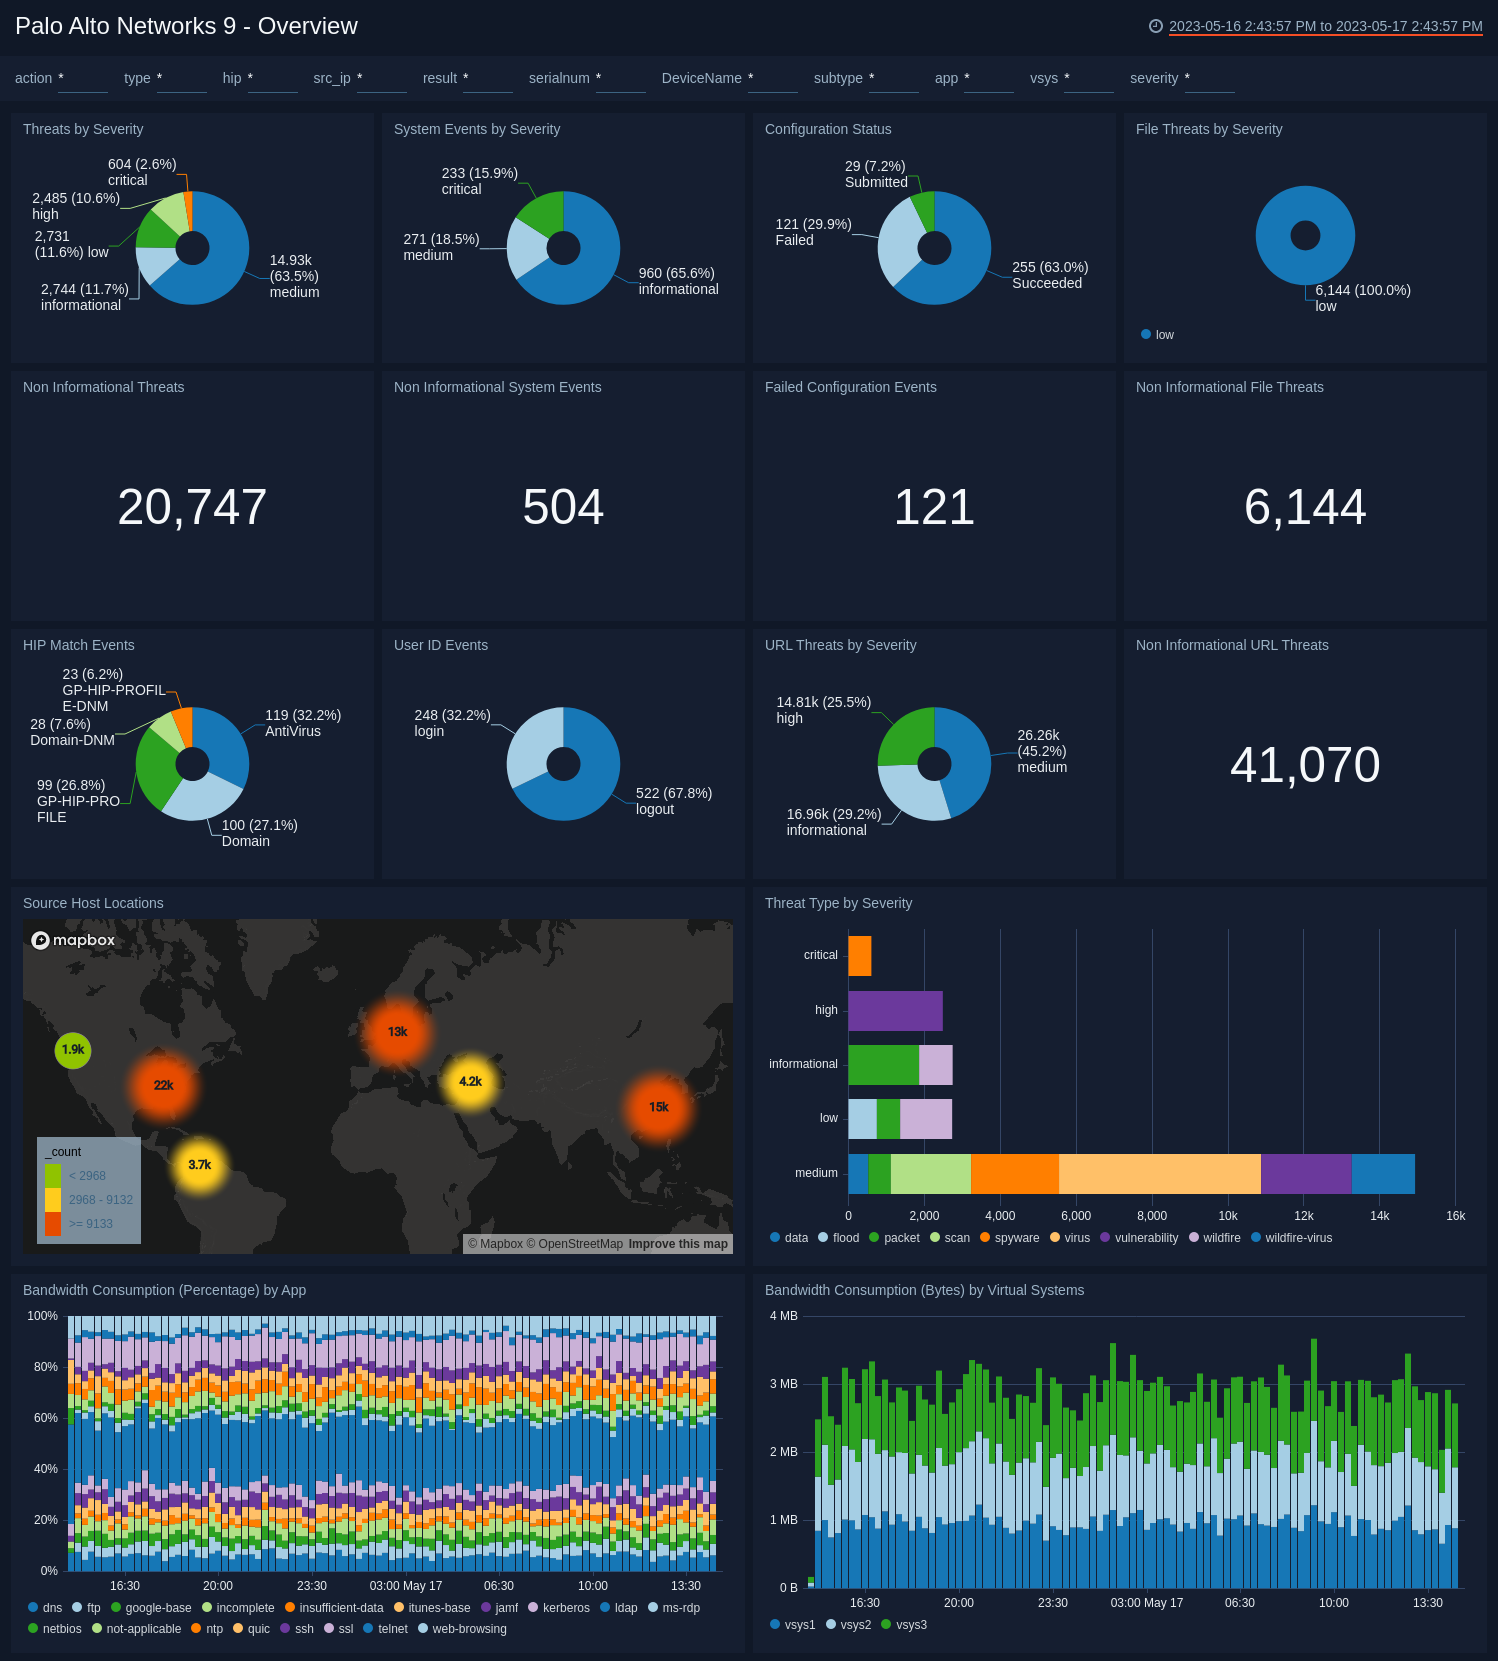
*Use this dashboard to:
- Analyze activities by severity level, geo-location, and bandwidth consumption.
- Investigate events for more detail. For example, if “Threats By Severity Level” shows “Critical” threats, you can find out more on the threat-related dashboards, such as Threat Overview, Threat Analysis, Traffic Insight - File Activity, and Traffic Insight - Web Activity.
Threat Overview
The Palo Alto Networks 9 - Threat Overview dashboard provides insights into the types of threats on your network, threat severity, and threat comparisons over time. Panels also display information on threats impacting the most IPs, IPs receiving multiple threats, IPs generating threats, and users who are impacted by threats.
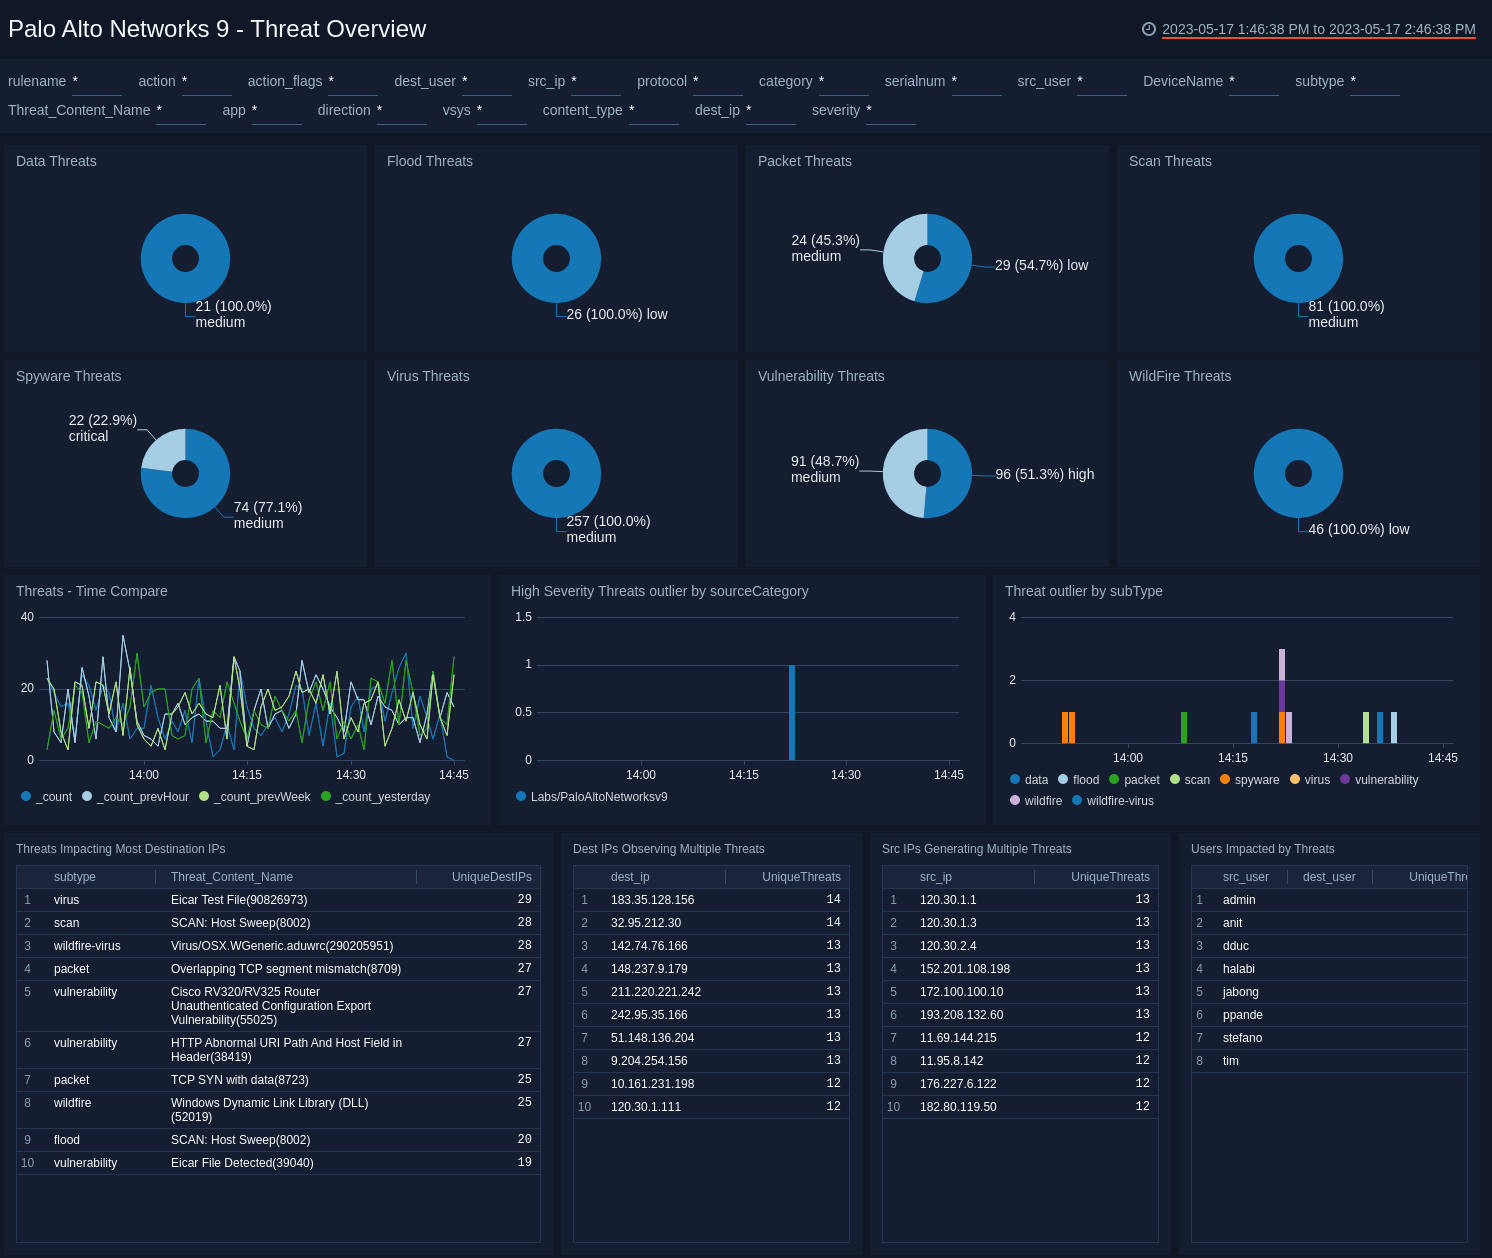
Use this dashboard to:
- Identify threat subtypes.
- Identify threats that affect multiple IPs, IPs affected by multiple threats, and identify source IPs or users that are either responsible for generating threats or are most impacted by threats.
Threat Analysis
The Palo Alto Networks 9 - Threat Analysis dashboard provides detailed information on threats by type, severity, outliers, and trends over time. Panels also display details on non-critical and critical threat events, top source and destination IPs, as well as apps by severity, and threat categories.
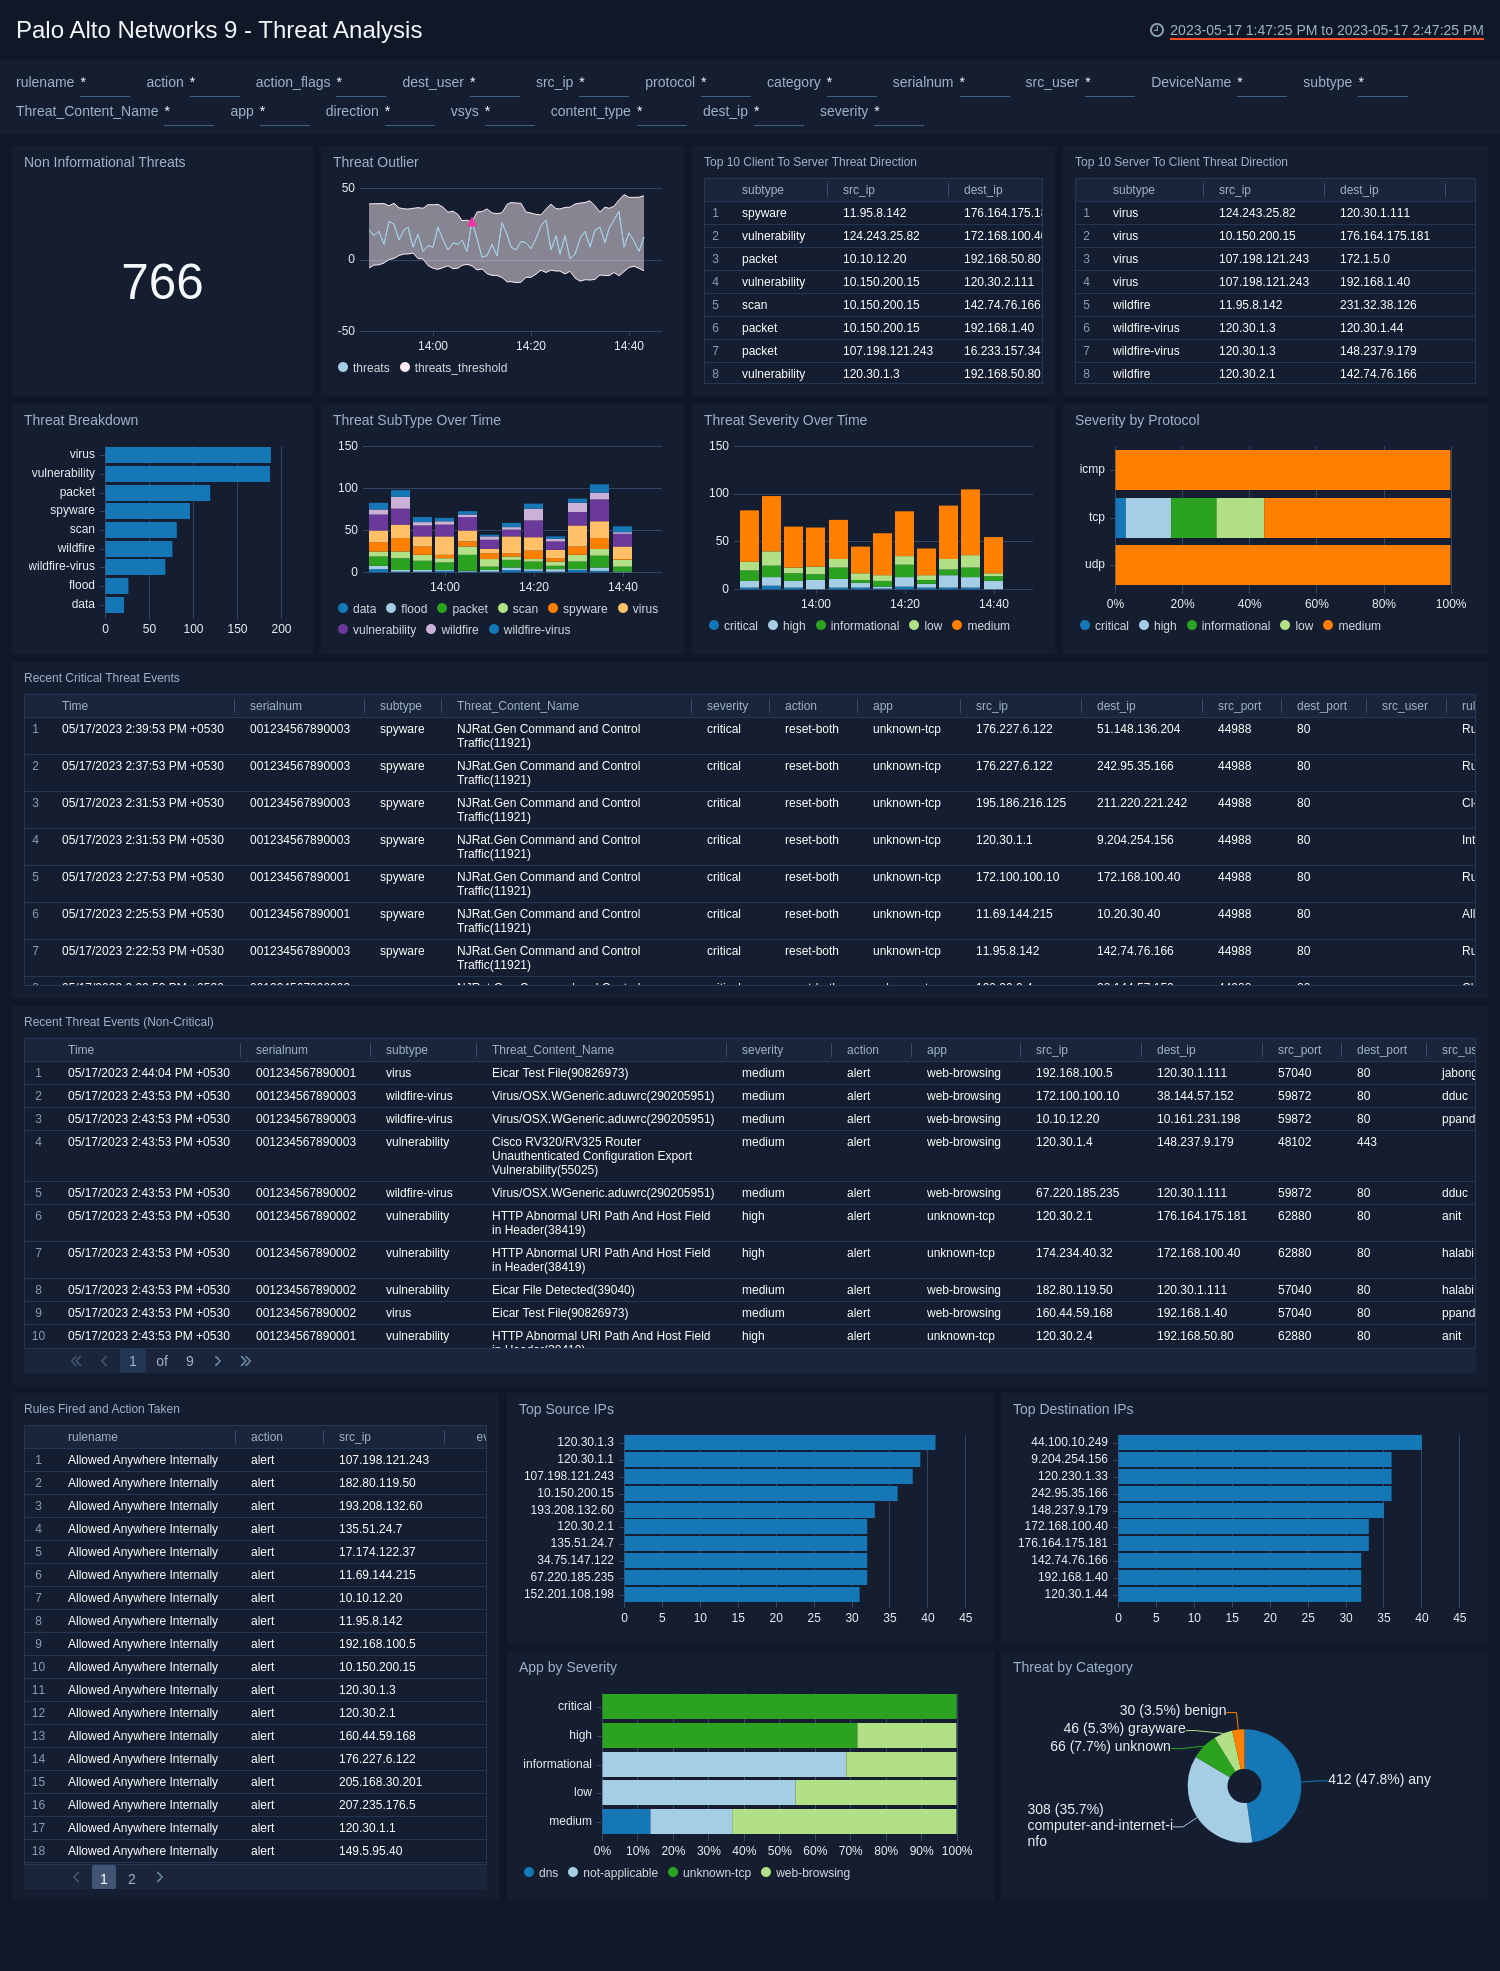
Use this dashboard to:
- Get detailed information on identified threats.
- Review rules fired and actions that were taken.
- Analyze trends, threat outliers, and threat direction.
High Severity Threats
The Palo Alto Networks 9 - High Severity Threats dashboard provides visibility into high severity threats that are coming from and impacting the most hosts.
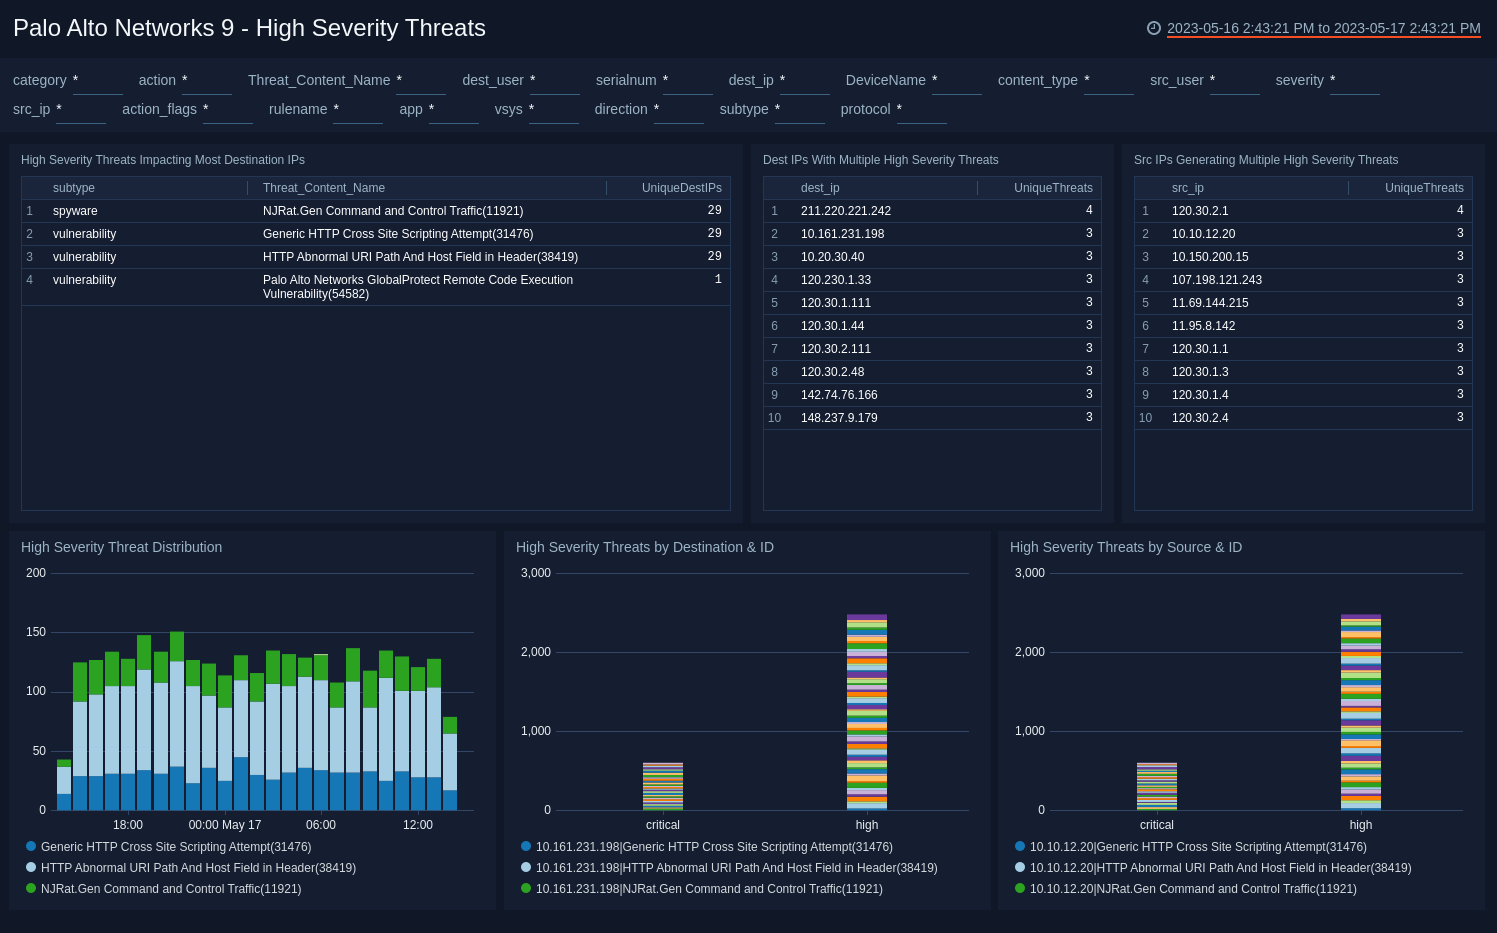
Use this dashboard to:
- Identify the impact of high severity threats, including the most involved source and destination IP addresses.
- Identify high severity threats caused by and impacted by hosts.
Traffic Insight - File Activity
The Palo Alto Networks 9 - Traffic Insight - File Activity dashboard provides visibility into file activity detected by PANOS firewall devices. Panels also display top apps, trends for events and file activity, and trends for file outlier activity.
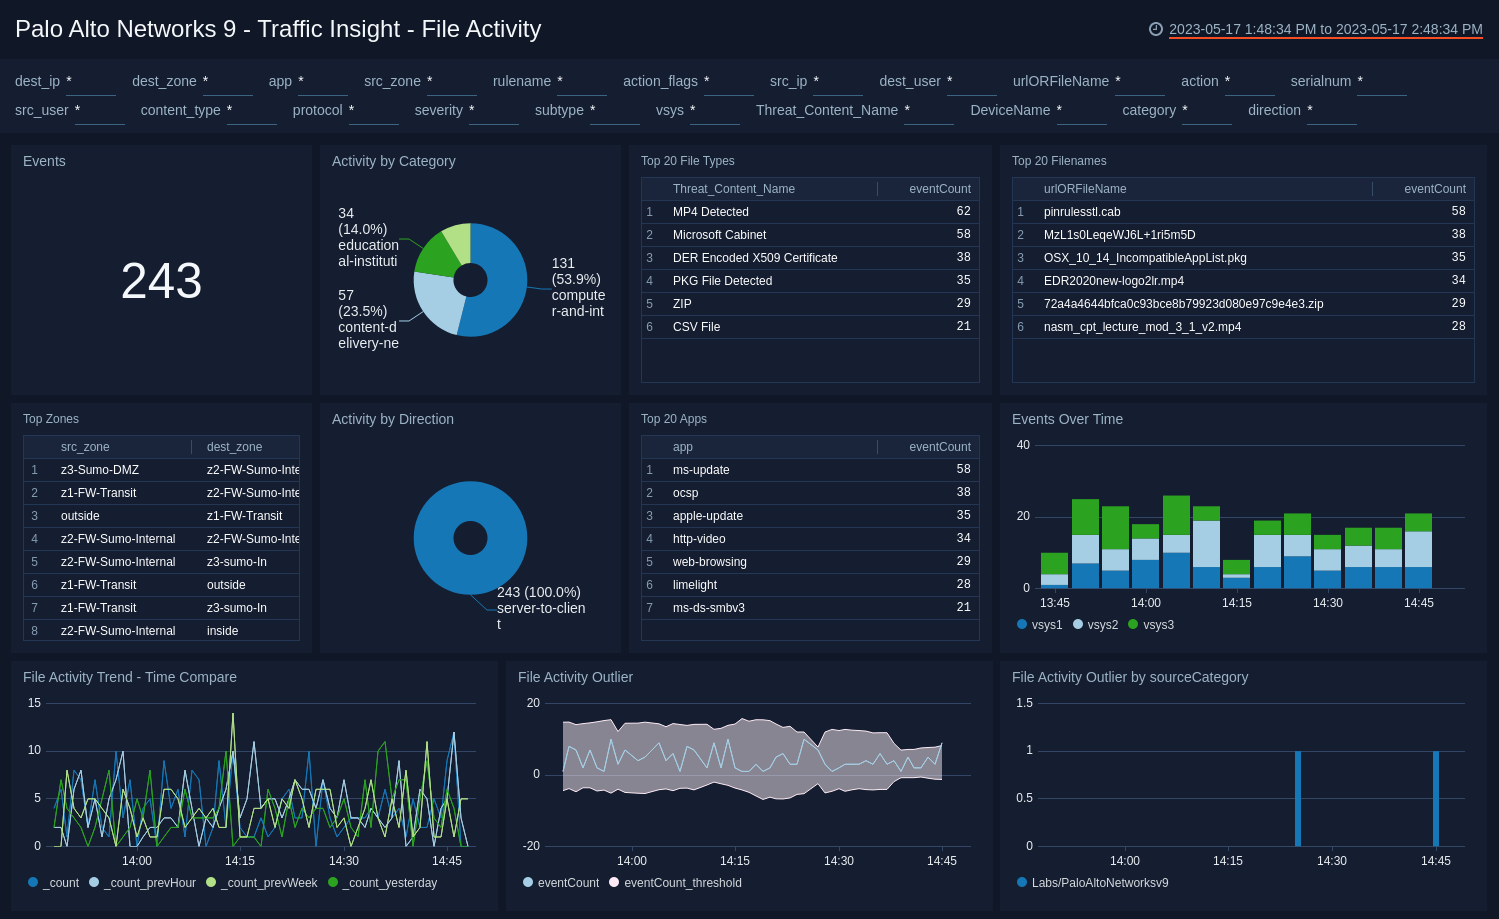
Use this dashboard to:
- Monitor end user file upload and download activities.
- Track suspicious file types being uploaded or downloaded through various apps.
- Monitor unexpected activities via outlier detection capabilities.
- Detect unexpected activities via outlier detection and time comparisons.
Traffic Insight - Web Activity
The Palo Alto Networks 9 - Traffic Insight Web Activity dashboard provides insights into user web activity on your network with the number of events, activity by category, top apps, URLs, and zones. Panels also show details on content types, zones, event and web activity trends, and web activity outliers.
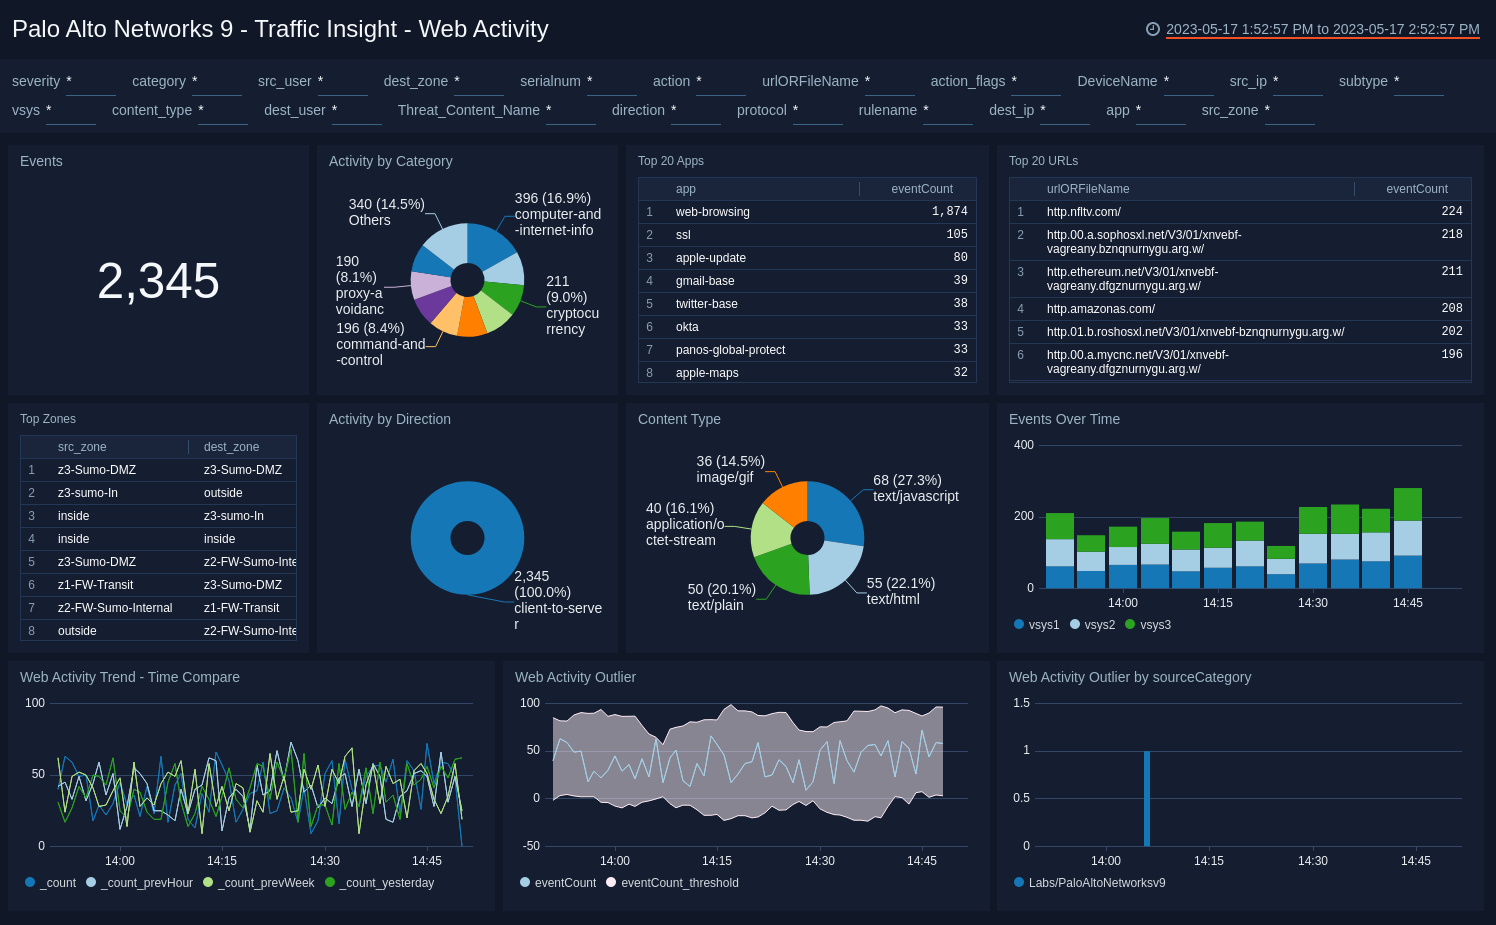
Use this dashboard to:
- Monitor end user web browsing activities.
- Track URLs and the content browsed by various apps.
- Monitor sudden changes in activities though outliers.
- Compare current activity trends with prior time intervals.
Traffic Monitoring
The Palo Alto Networks 9 - Traffic Monitoring dashboard provides insights into the traffic on your network, including protocol trends, top source and destination IPs, top app activities, geographic locations of public IPs, and top destination ports.
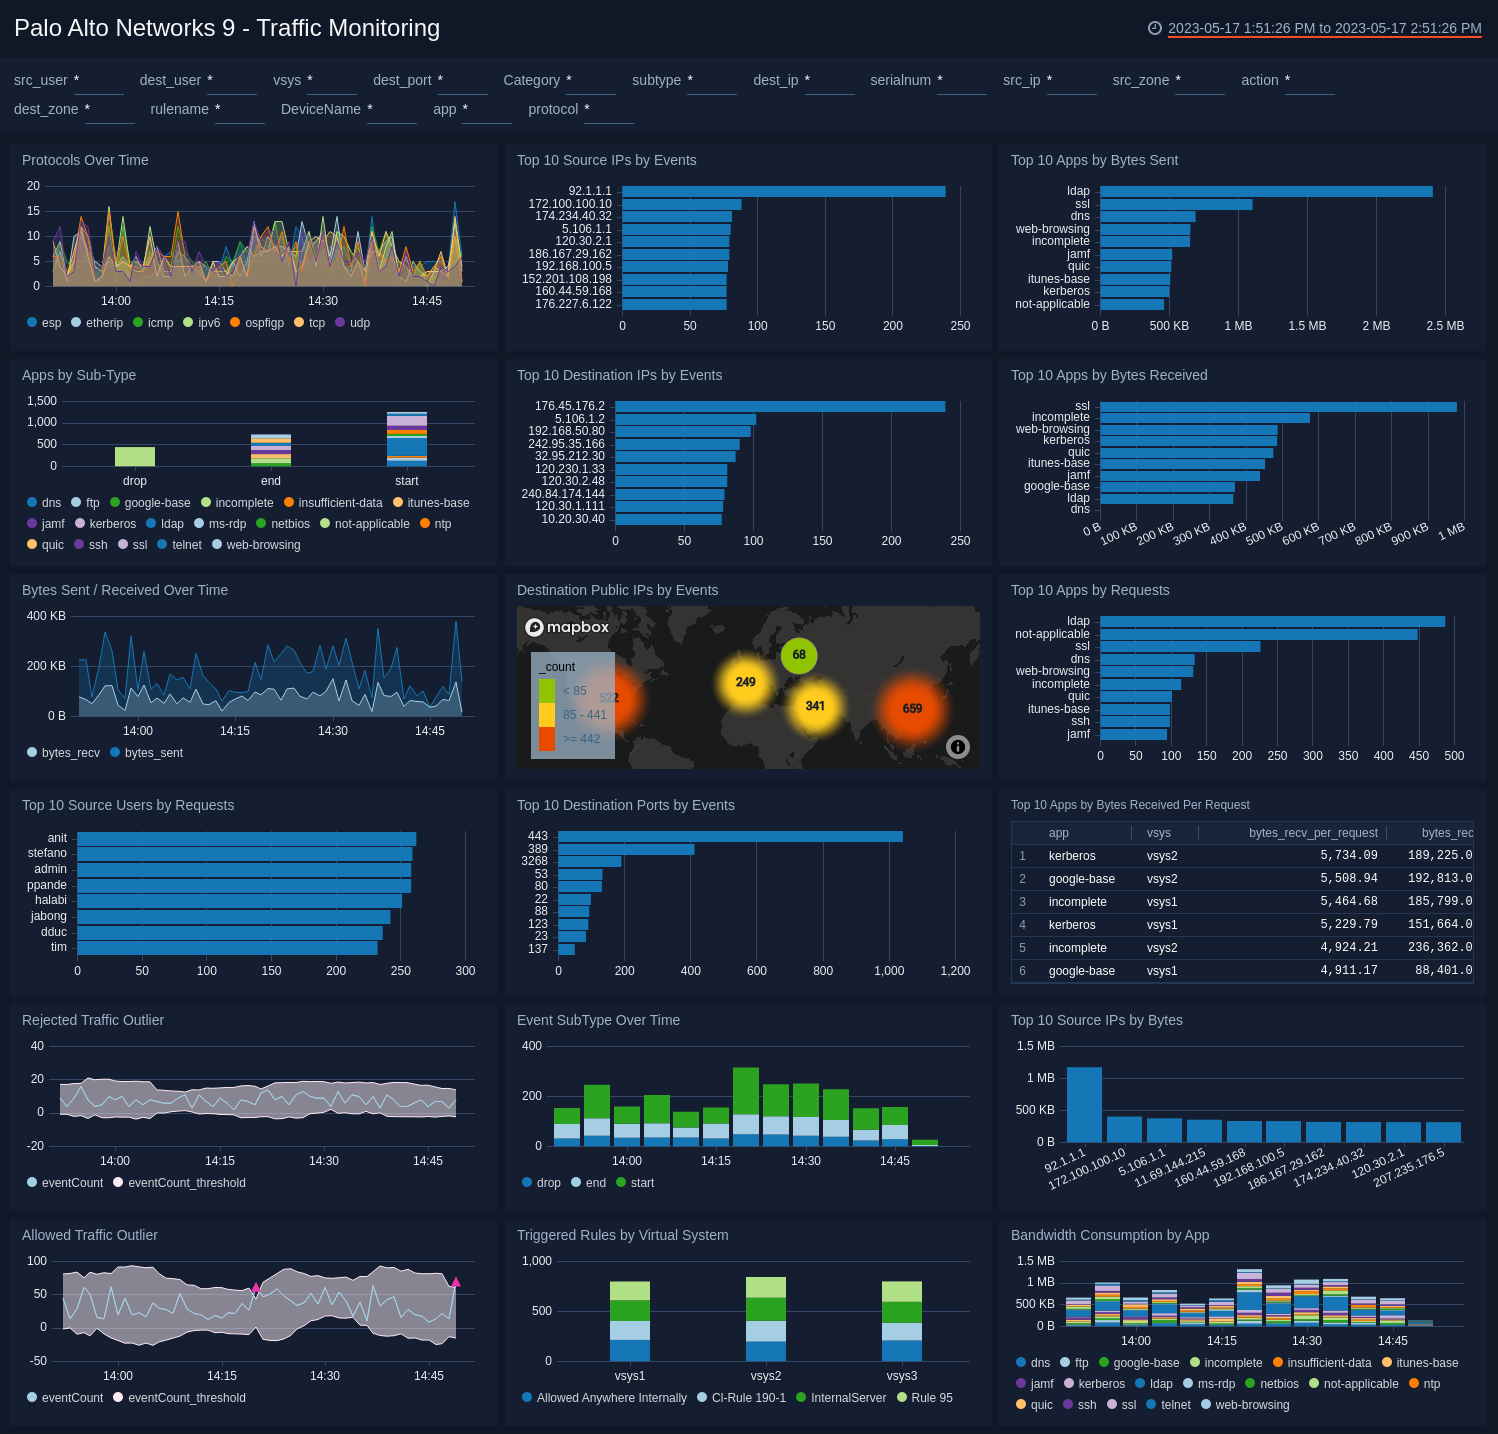
Use this dashboard to:
- Detect sudden changes in allowed or rejected traffic via the outlier panels.
- Monitor the types of content being accessed by various apps and virtual systems.
- Track the bandwidth consumed by specific apps and take corrective action as necessary.
- Use the geographic location map to track the source and destination locations and block certain locations or IP address ranges from your firewall if needed.
Configuration Analysis
The Palo Alto Networks 9 - Configuration Analysis dashboard provides visibility into device configuration activity on your network.
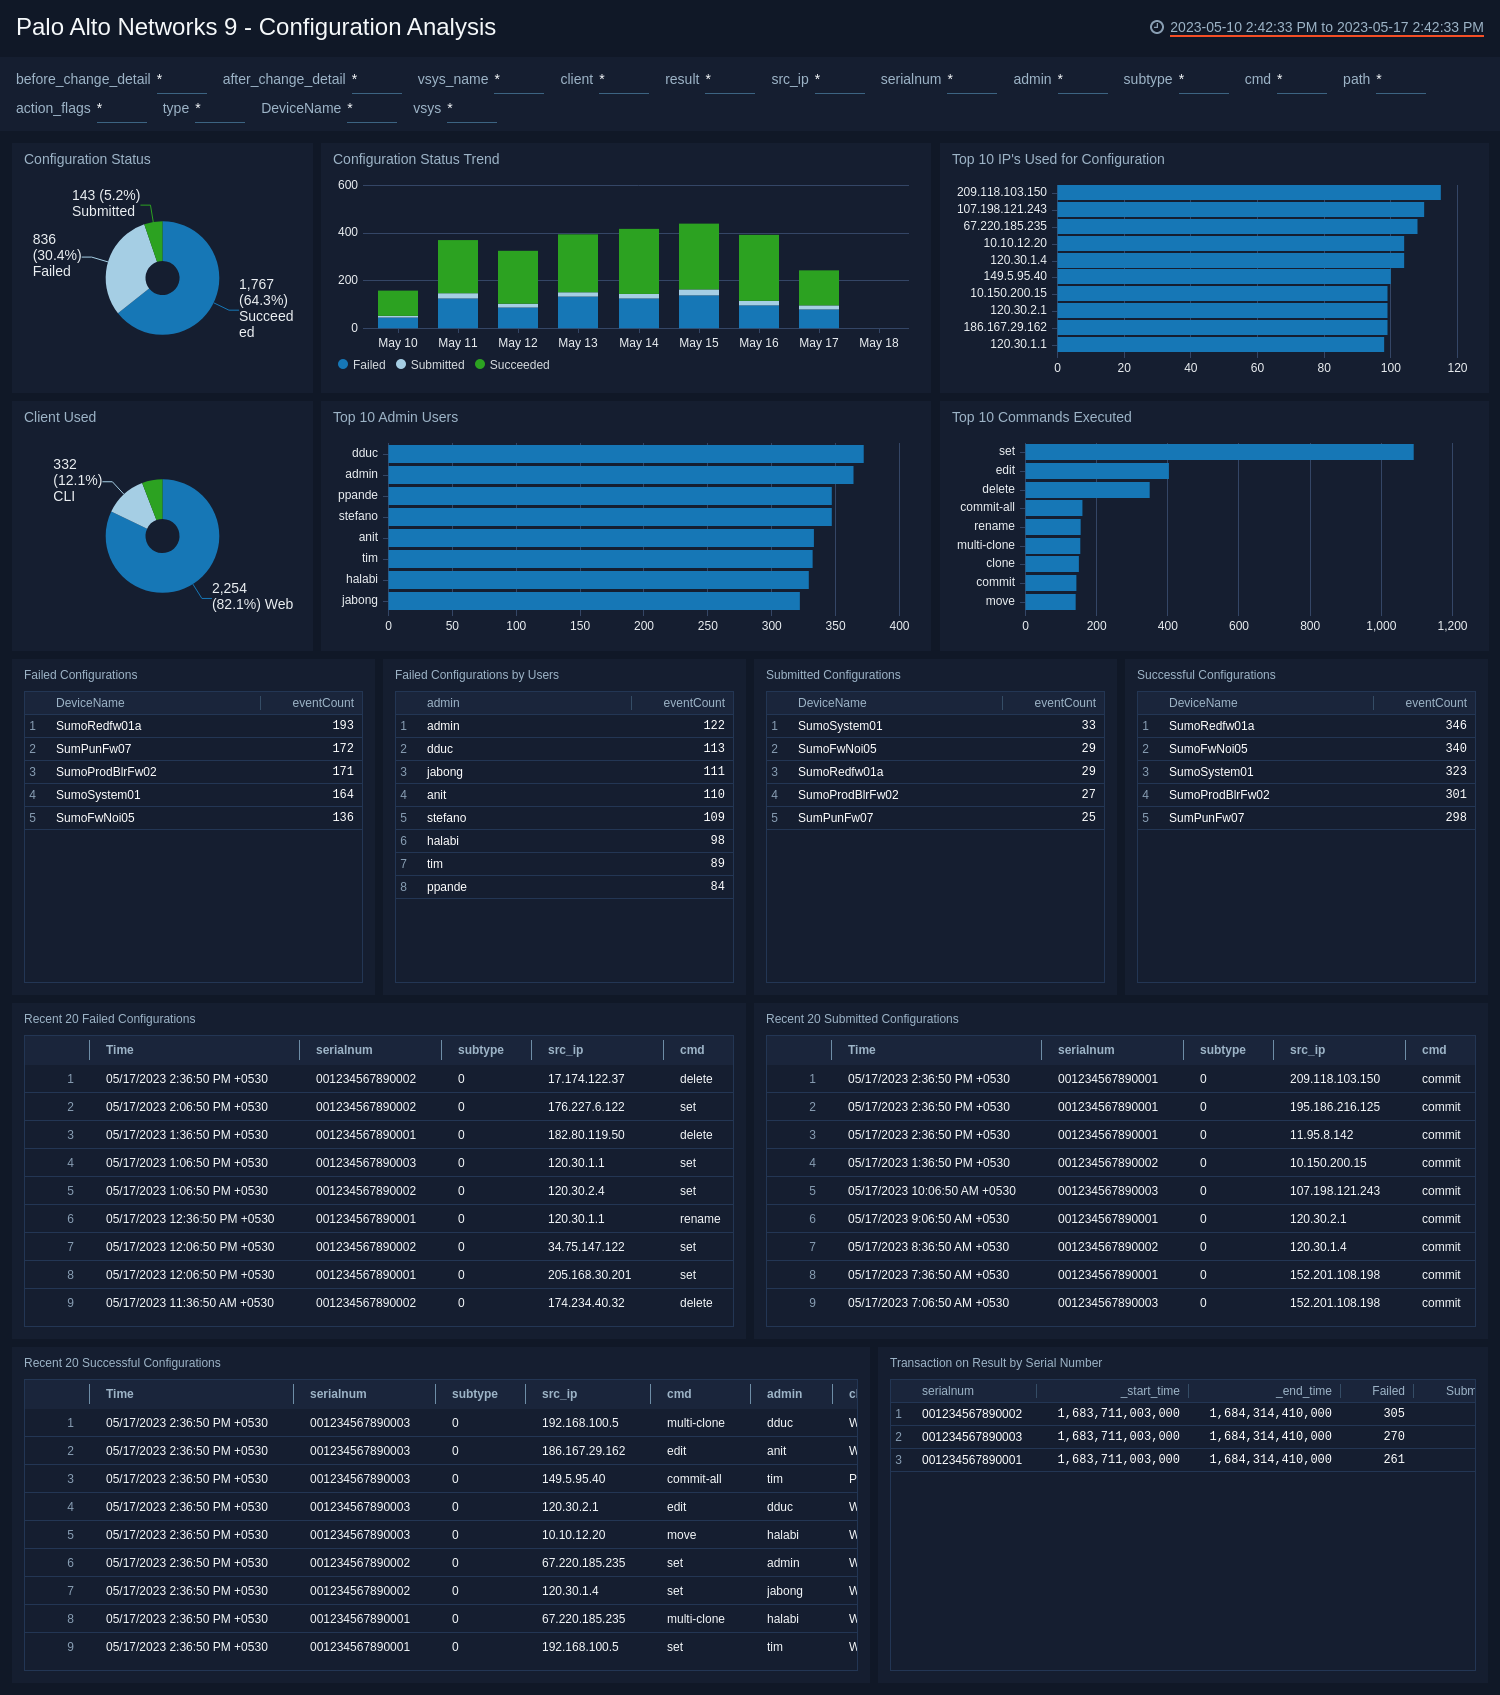
Use this dashboard to:
- Identify details around device configuration changes including users, configuration changes, mechanisms used and source systems.
- Monitor failed and successful configurations changes to ensure they are in line with expectations.
- Monitor sudden changes in device behavior, and investigate whether or not a configuration change was the root cause.
HIPMatch Monitoring
The Palo Alto Networks 9 - HIPMatch Monitoring dashboard provides visibility into the number of HIP events, HIP name, HIP type, and firewall devices accessing your network. Panels also show information on active hosts and users, as well as users and systems with multiple policy violations.
The GlobalProtect Host Information Profile (HIP) matching collects information on the security status of the end devices accessing your network. A firewall can allow or deny access to a host based on HIP-based security rules. HIP Match logs display traffic flows that match a HIP Object or HIP Profile configured for rules.
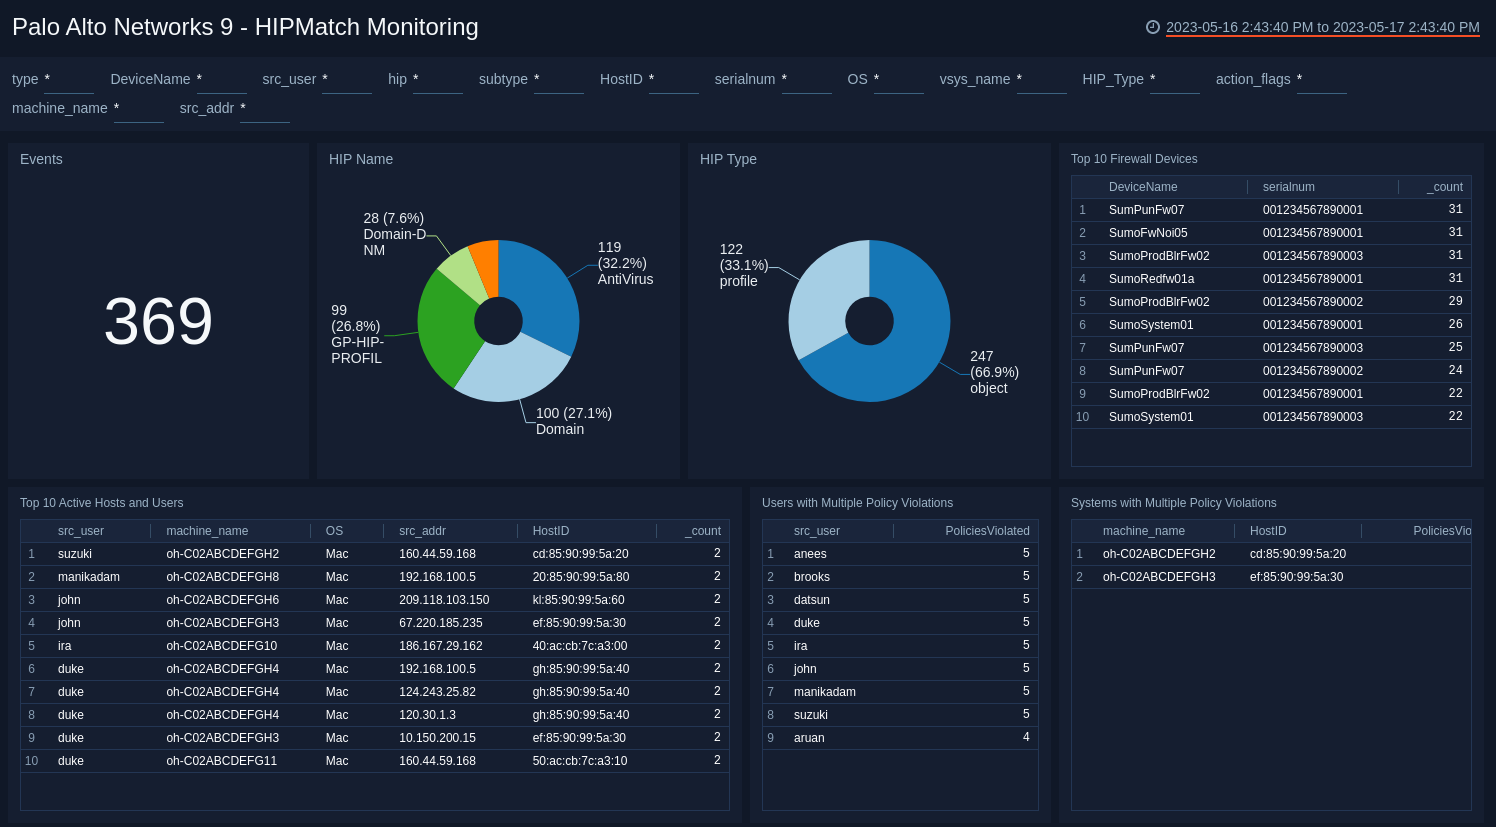
Use this dashboard to:
- Analyze the security status and policies violations of your endpoints and hosts.
- Determine whether to allow or deny resource access to a specific host based on adherence to host policies.
System Monitoring
The Palo Alto Networks 9 - System Monitoring dashboard provides insights into events on your network by type, severity, and trends. Panels also display data for objects by event type and severity level, and details on recent system feeds.
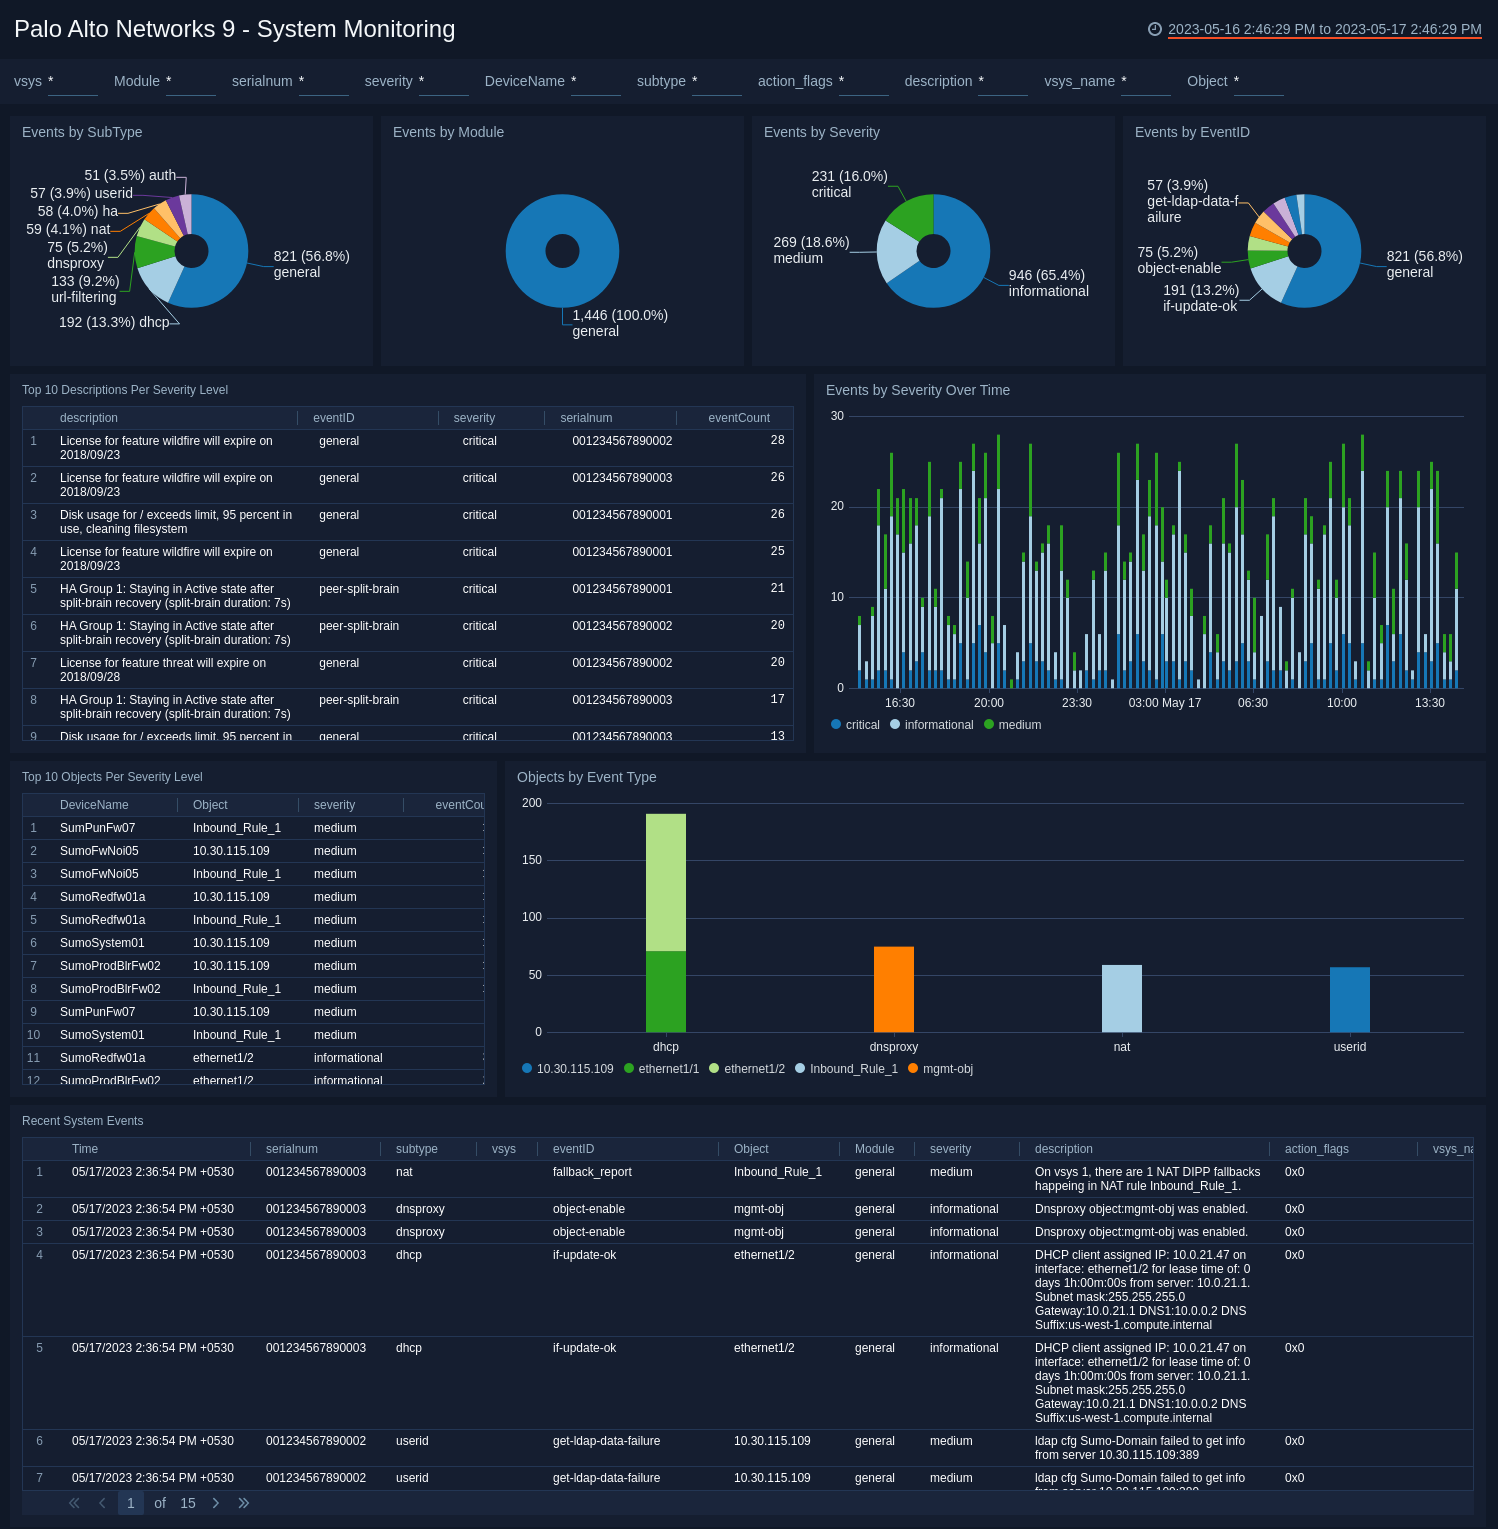
Use this dashboard to:
- Identify system issues, such as hardware failures, HA failures, links down and dropped connections with external devices.
- Monitor firmware and software upgrades.
- Monitor user activity, such as password change notifications, logon, logoff, administrator name or password changes, and configuration changes.
USERID Monitoring
The Palo Alto Networks 9 - USERID Monitoring dashboard provides insights into user activity on your network, with information on authentication factor, content type, and trends for content and new user activity. Panels also show details on the top firewall devices, source IPs, active users, and users who connected from multiple IPs.
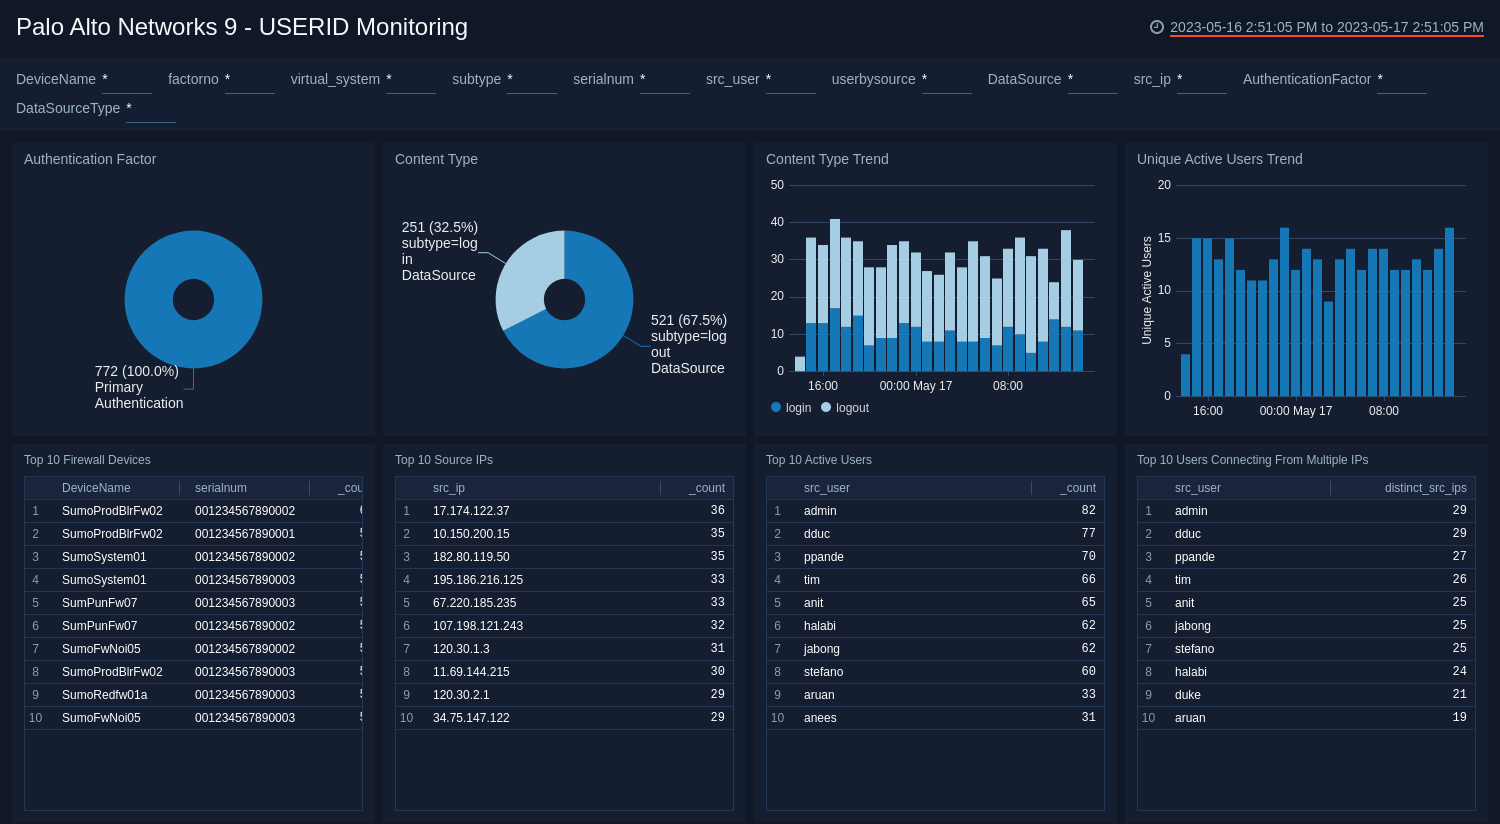
Use this dashboard to:
- Monitor users logged into a device on an IP generating the traffic.
- Detect which users are not using secure multi-factor authentication.
- Get better visibility into the application activity at a user level so as to define policies based on users or groups of users.
Upgrade/Downgrade the Palo Alto Networks 9 app (Optional)
To update the app, do the following:
Next-Gen App: To install or update the app, you must be an account administrator or a user with Manage Apps, Manage Monitors, Manage Fields, Manage Metric Rules, and Manage Collectors capabilities depending upon the different content types part of the app.
- Select App Catalog.
- In the Search Apps field, search for and then select your app.
Optionally, you can identify apps that can be upgraded in the Upgrade available section. - To upgrade the app, select Upgrade from the Manage dropdown.
- If the upgrade does not have any configuration or property changes, you will be redirected to the Preview & Done section.
- If the upgrade has any configuration or property changes, you will be redirected to the Setup Data page.
- In the Configure section of your respective app, complete the following fields.
- Field Name. If you already have collectors and sources set up, select the configured metadata field name (eg _sourcecategory) or specify other custom metadata (eg: _collector) along with its metadata Field Value.
- Click Next. You will be redirected to the Preview & Done section.
Post-update
Your upgraded app will be installed in the Installed Apps folder and dashboard panels will start to fill automatically.
See our Release Notes changelog for new updates in the app.
To revert the app to a previous version, do the following:
- Select App Catalog.
- In the Search Apps field, search for and then select your app.
- To version down the app, select Revert to < previous version of your app > from the Manage dropdown.
Uninstalling the Palo Alto Networks 9 app (Optional)
To uninstall the app, do the following:
- Select App Catalog.
- In the 🔎 Search Apps field, run a search for your desired app, then select it.
- Click Uninstall.