VMware Carbon Black

Sumo Logic provides a complete security analytics solution by allowing you to correlate, validate and investigate VMware Carbon Black endpoint alerts with alerts from other security vendors and security threat feeds to identify and remediate the root causes of new security threats.
The Sumo Logic App for VMware Carbon Black provides visibility into key endpoint security data from VMware Carbon Black EDR and Endpoint Standard with pre-configured dashboards for alerts, threats intelligence, feeds, sensors, alerts, users, hosts, processes, IOCs, devices, and network status.
- VMware Carbon Black Endpoint Detection and Response (EDR) is an incident response and threat hunting solution designed for security operations center (SOC) teams. EDR continuously records and stores unfiltered endpoint data, so that security professionals can hunt threats in real time and visualize the complete attack kill chain.
- VMware Carbon Black Endpoint Standard is a next-generation antivirus (NGAV) solution available through MSSPs or directly as software as a service through VMware Carbon Black’s Predictive Security Cloud (PSC).
Log types
Sumo Logic analyzes the following required VMware Carbon Black events for more efficient monitoring:
- VMware Carbon Black EDR Events
- VMware Carbon Black Endpoint Standard Events
Carbon Black events are forwarded to Sumo Logic by Carbon Black, as defined in Collect Logs for Carbon Black. For more information, see Endpoint Detection Response and Endpoint Standard documentation.
Collect Logs for VMware Carbon Black
This section provides instructions for adding a hosted collector, HTTP, and S3 sources, then configuring collection agents to collect findings for the Carbon Black App.
Collection overview
VMware Carbon Black Endpoint Detection and Response (EDR) events can be sent to Sumo Logic via its event forwarder mechanism. The cb-event-forwarder can be installed on any 64-bit Linux machine running CentOS 6.x. It can be installed on the same machine as the Carbon Black server, or any other machine. Data can be sent in either JSON or LEEF format, both of which are supported by Sumo Logic.
VMware Carbon Black Cloud Endpoint Standard events can be collected via VMware Carbon Black Event Forwarder S3 mechanism and a Sumo Logic S3 source.
For more in-depth information, see Endpoint Standard and EDR documentation.
Step 1: Add a Hosted Collector
To add a hosted collector, perform the steps as defined on the page Configure a Hosted Collector.
Step 2: Configure Collection for VMware Carbon Black EDR
To configure collection, add an HTTP Source, get credentials for VMware Carbon Black, and configure the event forwarder.
Add an HTTP Source for VMware Carbon Black EDR
To add an HTTP source for VMware Carbon Black EDR, do the following:
- Add HTTP Logs and Metrics Source for VMware Carbon Black EDR.
When you configure the HTTP Sources, make sure to save the HTTP Source Address URLs. You will need these URLs later.
Get credentials from VMware Carbon Black EDR
VMware Carbon Black EDR event forwarder requires a RabbitMQ Username and Password. Copy RabbitMQUser and RabbitMQPassword from /etc/cb.conf from the VMware Carbon Black EDR server. These will be required in the next step.
Configure the event forwarder for VMware Carbon Black EDR
This section provides instructions for configuring the collection of VMware Carbon Black EDR events.
The steps in the following procedure should be done as the “root” user on your target Linux system.
To configure the collection of VMware Carbon Black EDR events:
- If it isn't already present, install the CbOpenSource repository.
cd /etc/yum.repos.d
curl -O https://opensource.carbonblack.com/release/x86_64/CbOpenSource.repo - Install the RPM with YUM.
yum install cb-event-forwarder - Configure cb-event-forwarder
- If installing on a machine other than the Carbon Black EDR server, copy the RabbitMQ username and password into the rabbit_mq_username and rabbit_mq_password variables in /etc/cb/integrations/event-forwarder/cb-event-forwarder.conf file. Also fill out the cb_server_hostname with the hostname or IP address where the Carbon Black EDR server can be reached.
- If the cb-event-forwarder is forwarding events from a Carbon Black EDR cluster, the cb_server_hostname should be set to the hostname or IP address of the Carbon Black EDR master node. More details here.
- Additionally set the following variables in the cb-event-forwarder.conf:
output_typeas httpoutput_formatas JSON or LEEF as requiredhttpoutas the HTTP Source Address from the previous step
- Ensure that the configuration is correct, by running (as root) the cb-event-forwarder in check mode:
/usr/share/cb/integrations/event-forwarder/cb-event-forwarder -check
- Start and stop the service. Once the service is installed, it is managed by the Upstart init system in CentOS 6.x. You can control the service with the initctl command:
- To start the service:
initctl start cb-event-forwarder- To stop the service:
initctl stop cb-event-forwarder
Once the service is installed, it is configured to start automatically on system boot.
Step 3: Configure Collection for VMware Carbon Black Cloud Endpoint Standard
Add an S3 Source for VMware Carbon Black Cloud Endpoint Standard
To add an S3 source for VMware Carbon Black Cloud Endpoint Standard, do the following
- Create a new bucket in S3 for Cloud Endpoint Standard events collection.
- Add an S3 for Cloud Endpoint Standard as per the below example. Populate the bucket name and path as created in the previous step.
Configure VMware Carbon Black Cloud Endpoint Standard to send alerts and events to S3
VMware Carbon Black Cloud Endpoint Standard events will be pushed to S3 via VMware Carbon Black Event Forwarder S3 and will be collected via Sumo logic S3 source.
To configure the Event Forwarder, follow the steps mentioned here. Please carefully evaluate this information to assure that your configuration reflects the data set you would like to send to Sumo Logic.
Utilize the S3 bucket created in the previous steps while configuring the Event Forwarder.
Step 4: Verify Sumo is receiving findings
In Sumo, open a Live Tail tab and run a search to verify Sumo is receiving findings. Search by the source category you assigned to the HTTP Source that receives the log data, for example:
_sourceCategory="cb_edr_events" or _sourceCategory="cb_endpoint_standard_events"
For more information, see Live Tail.
Sample log messages
This section provides examples of JSON and LEEF log messages.
VMware Carbon Black Cloud Endpoint Standard - JSON
{
  "type": "WATCHLIST",
  "id": "efaa284a-a995-4de9-b524-a548d3fb06da",
  "legacy_alert_id": "7DESJ9GN-00340e2b-000005a4-00000000-1d70b72a8bf72ad-6C3681D234D45B831699EB80627C96F6",
  "org_key": "7DESJ9GN",
  "create_time": "2021-03-03T09:31:45Z",
  "last_update_time": "2021-03-03T09:31:45Z",
  "first_event_time": "2021-03-03T09:27:30Z",
  "last_event_time": "2021-03-03T09:27:30Z",
  "threat_id": "CF6977EA8CB7343813145381835E9D25",
  "severity": 8,
  "category": "WARNING",
  "device_id": 3411499,
  "device_os": "WINDOWS",
  "device_name": "QA\\VM-2k12-DG01",
  "device_username": "user.abc@zxc.com",
  "policy_id": 6525,
  "policy_name": "Default",
  "target_value": "LOW",
  "workflow": {
"state": "OPEN",
"remediation": "",
"last_update_time": "2021-03-03T09:30:39Z",
"comment": "",
"changed_by": "Carbon Black"
  },
  "device_internal_ip": "10.4.2.153",
  "device_external_ip": "65.127.112.131",
  "alert_url": "https://defense.conferdeploy.net/cb/investigate/processes?orgId=1105&query=alert_id%3Aefaa284a-a995-4de9-b524-a548d3fb06da+AND+device_id%3A3411499&searchWindow=ALL",
  "reason_code": "Process procman.exe was detected by the report \"Processes NOT Listed and Not Signed\" in watchlist \"TEST Use Cases for Adaptive Response Actions\"",
  "process_name": "procman.exe",
  "threat_indicators": [
{
   "process_name": "procman.exe",
   "sha256": "c926606c9372da3b8033307011dbee69879ed374024d8dacea405d05c724f244",
   "ttps": [
     "3c1ae54d-96c8-42a7-ada0-d2db38c9a081"
   ]
}
  ],
  "threat_cause_actor_sha256": "c926606c9372da3b8033307011dbee69879ed374024d8dacea405d05c724f244",
  "threat_cause_actor_name": "procman.exe",
  "threat_cause_reputation": "NOT_LISTED",
  "threat_cause_threat_category": "RESPONSE_WATCHLIST",
  "threat_cause_vector": "UNKNOWN",
  "run_state": "RAN",
  "ioc_id": "3c1ae54d-96c8-42a7-ada0-d2db38c9a081",
  "ioc_hit": "(process_reputation:NOT_LISTED AND NOT process_publisher_state:FILE_SIGNATURE_STATE_SIGNED)",
  "watchlists": [
{
   "id": "BeCXz92RjiQxN1PnYlM6w",
   "name": "TEST Use Cases for Adaptive Response Actions"
}
  ],
  "process_guid": "7DESJ9GN-00340e2b-000005a4-00000000-1d70b72a8bf72ad",
  "process_path": "c:\\program files\\abc\\administration api\\admin api\\dependencies\\procman-beta\\procman.exe",
  "report_name": "Processes NOT Listed and Not Signed",
  "report_id": "7M4vlko3THG1v6a0kGOtpw",
  "status": "UNRESOLVED"
}
VMware Carbon Black EDR - JSON
{
  "cb_server":"cbserver",
  "cb_version":"6.2.4.181112.1308",
  "computer_name":"suse-agent1",
  "feed_id":34,
  "feed_name":"carbonstream",
  "from_feed_search":false,
  "group":"mnt 3rd wave",
  "hostname":"suse-agent1",
  "ioc_attr":{
  "direction":"Outbound",
  "dns_name":"qrgrakybjmcko.sumonetworks.com",
  "local_ip":"192.168.1.14",
  "local_port":7316,
  "port":7316,
  "protocol":"UDP",
  "remote_ip":"198.108.66.208",
  "remote_port":1381
  },
  "ioc_type":"ipv4",
  "ioc_value":"165.160.13.20",
  "os_type":"OSX",
  "process_guid":"000009a9-0000-4b8d-01d4-a897a4ce3f0a",
  "process_id":"0000408a-0000-3324-01d4-a7d3e8679254",
  "report_id":"2aaba46c8302f9805284c3b2bd6ce932",
  "report_score":100,
  "segment_id":"1547092507241",
  "sensor_id":850,
  "server_name":"localhost",
  "timestamp":"1548931379",
  "type":"feed.ingress.hit.process"
}
Carbon Black EDR LEEF
1234 <12>0 2019-01-31T16:12:54.111+0530 previous-gymnast cb-notifications 94538 - -
reason=feed.storage.hit type=event process_guid=0000148e-0000-0c70-01d4-a8dc9f4b27b2
segment_id=1547094054393 host='rhel-agent1' comms_ip='142.255.119.77' interface_ip='172.20.4.130'
sensor_id=4994 feed_id=13 feed_name='bit9endpointvisibility' ioc_type='query' ioc_value='
{""index_type"": ""events"", ""search_query"": ""cb.urlver=1&q=(regmod%3Adomains%5Caccount%5Cusers%5Cnames%5C*)""}'
timestamp='1548931374' start_time='2019-01-31T16:12:54.111+0530' group='aes 2nd wave' process_md5=
'0f9760b796dede249193b1f7844104b1' process_name='lsass.exe' process_path='c:\windows\system32\lsass.exe'
last_update='2019-01-31T16:12:54.111+0530'  alliance_updated_bit9endpointvisibility='2018-10-31T17:11:39.000Z'
alliance_data_bit9endpointvisibility='74ccc9e8-ffc6-4e0b-ba88-0e947cf7b146' alliance_link_bit9endpointvisibility='
' alliance_score_bit9endpointvisibility='20'
Sample queries
This section provides a sample query from the Top Processes panel of the Carbon Black - EDR - Processes dashboard.
Parameters
- Host_Name: *
- IOC_Type: *
- Feed_Name: *
- Watchlist_Name: *
- Group: *
- Status: *
- Process_Name: *
Query String
_sourceCategory="Labs/cb-edr-json" | parse regex "(?:process_name)(?:\"\:\"|=')
(?<process_name>.*?)(?:\"|')" multi | parse regex "ioc_type(?:\"\:\"|=')(?<ioc_type>.*?)(?:\"|')
" nodrop | parse regex "feed_name(?:\"\:\"|=')(?<feed_name>.*?)(?:\"|')" nodrop | parse regex
"group(?:\"\:\"|=')(?<group>.*?)(?:\"|')" nodrop | parse regex "(?:hostname|host)(?:\"\:\"|=')
(?<hostname>.*?)(?:\"|')" nodrop | parse regex "watchlist_name(?:\"\:\"|=')(?<watchlist_name>.*?)
(?:\"|')" nodrop | parse regex "status(?:\"\:\"|=')(?<status>.*?)(?:\"|')" nodrop | where
(isBlank(hostname) or hostname matches {{Host_Name}}) and (isBlank(ioc_type) or ioc_type matches
{{IOC_Type}}) and (isBlank(feed_name) or feed_name matches {{Feed_Name}}) and (isBlank(watchlist_name)
 or watchlist_name matches {{Watchlist_Name}}) and (isBlank(group) or group matches {{Group}}) and
 (isBlank(status) or status matches {{Status}}) and process_name matches {{Process_Name}} |
 count by process_name | sort by _count | limit 10
Installing the VMware Carbon Black App
This section demonstrates how to install the VMware Carbon Black EDR and Cloud Endpoint Standard App and has examples of each of the App dashboards. The VMware Carbon Black App dashboards are organized in the following categories, according to their function:
- VMware Carbon Black Endpoint Detection and Response (EDR) is an incident response and threat hunting solution that continuously records and stores unfiltered endpoint data, allowing security professionals to track potential threats in real-time.
- VMware Carbon Black Cloud Endpoint Standard is a next-generation antivirus (NGAV) and endpoint detection and EDR solution.
To install the app:
- Select App Catalog.
- In the 🔎 Search Apps field, run a search for your desired app, then select it.
- Click Install App.
note
Sometimes this button says Add Integration.
- On the next configuration page, under Select Data Source for your App, complete the following fields:
- Data Source. Select one of the following options:
- Choose Source Category and select a source category from the list; or
- Choose Enter a Custom Data Filter, and enter a custom source category beginning with an underscore. For example,
_sourceCategory=MyCategory.
- Folder Name. You can retain the existing name or enter a custom name of your choice for the app.
- All Folders (optional). The default location is the Personal folder in your Library. If desired, you can choose a different location and/or click New Folder to add it to a new folder.
- Data Source. Select one of the following options:
- Click Next.
- Look for the dialog confirming that your app was installed successfully.
Post-installation
Once your app is installed, it will appear in your Personal folder or the folder that you specified. From here, you can share it with other users in your organization. Dashboard panels will automatically start to fill with data matching the time range query received since you created the panel. Results won't be available immediately, but within about 20 minutes, you'll see completed graphs and maps.
Viewing VMware Carbon Black Dashboards
Dashboard filters
Each dashboard has a set of filters that you can apply to the entire dashboard, as shown in the following example. Click the funnel icon in the top dashboard menu bar to display a scrollable list of filters that are applied across the entire dashboard.
You can use filters to drill down and examine the data on a granular level.
Each panel has a set of filters that are applied to the results for that panel only, as shown in the following example. Click the funnel icon in the top panel menu bar to display a list of panel-specific filters.
EDR - Overview
The Carbon Black - EDR - Overview dashboard provides a high-level view of the state of your network infrastructure and systems. The panels highlight detected threats, hosts, top feeds and IOC’s, top processes, top watchlists, and alert trends.
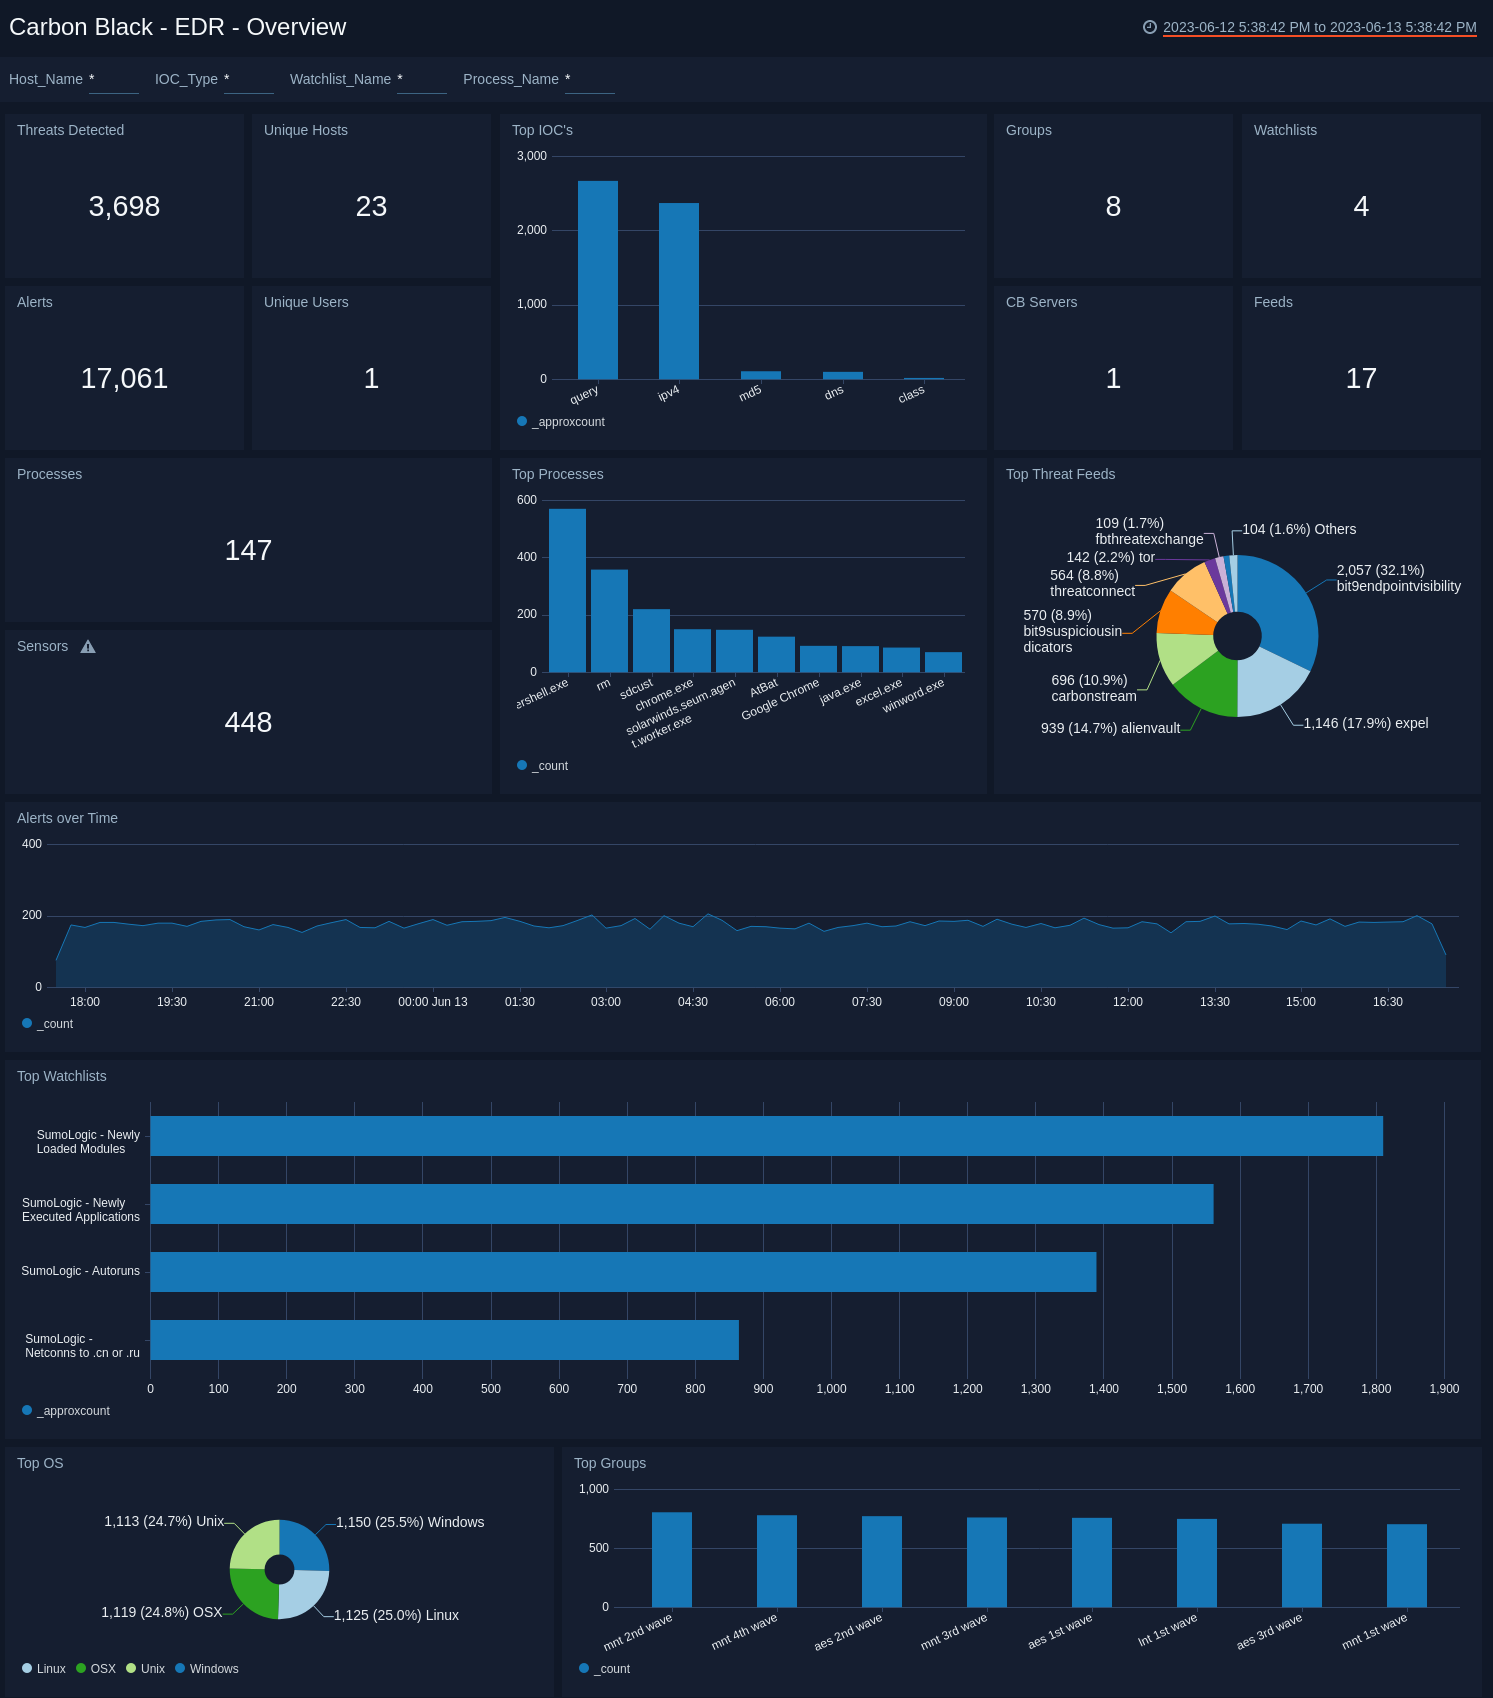
Use this dashboard to:
- Monitor potential threats.
- Determine the top processes and threat indicators.
- Track alerts.
- Monitor hosts, users, watchlists and feeds.
EDR - Alerts
The Carbon Black - EDR - Alerts dashboard provides detailed information on the alerts in your environment, including alerts by mode, OS, report, and groups. The panels also show alert trends, recent alerts, and top users.
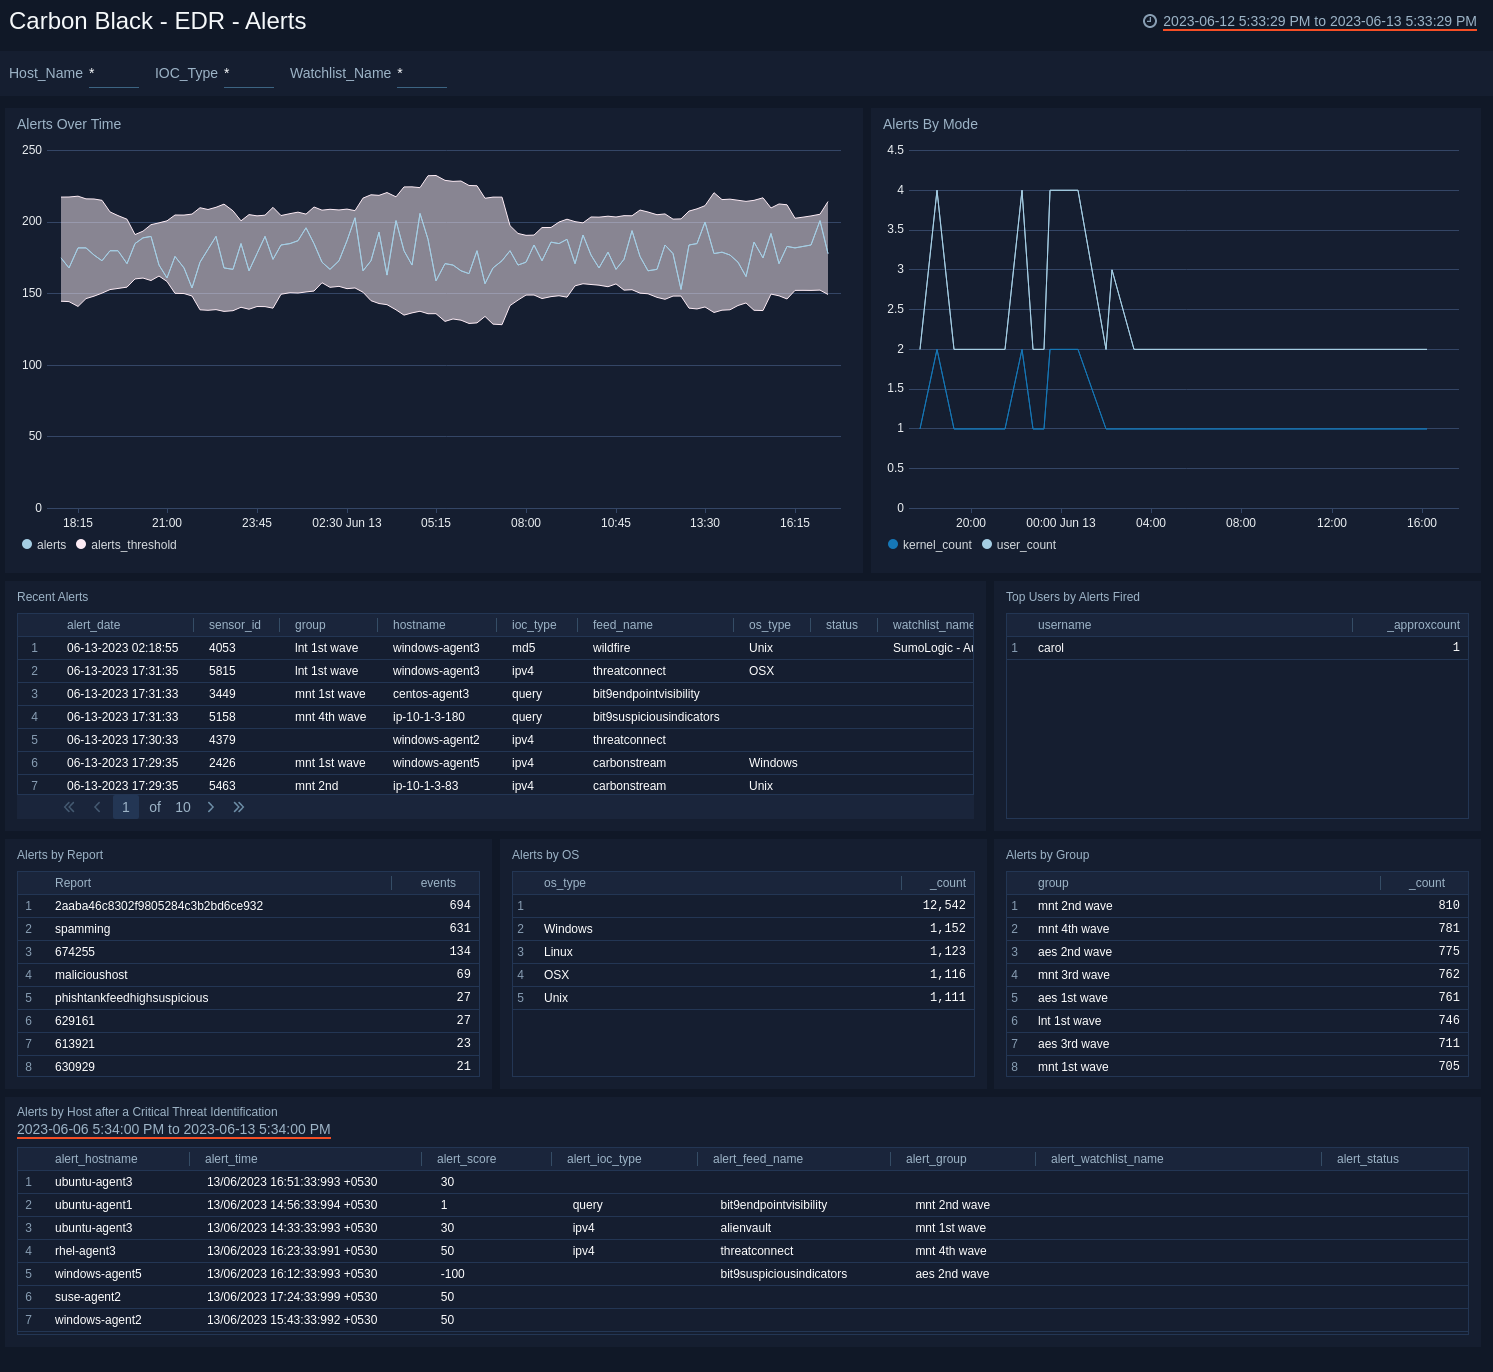
Use this dashboard to:
- Monitor alert activity and identify spikes.
- Monitor alerts triggered after a critical issue.
- Track users who trigger a high number of alerts.
EDR - Feeds
The Carbon Black - EDR - Feeds dashboard provides detailed information on total feeds, feed trends, top and recent feeds, feed comparisons, and processes related to feeds.
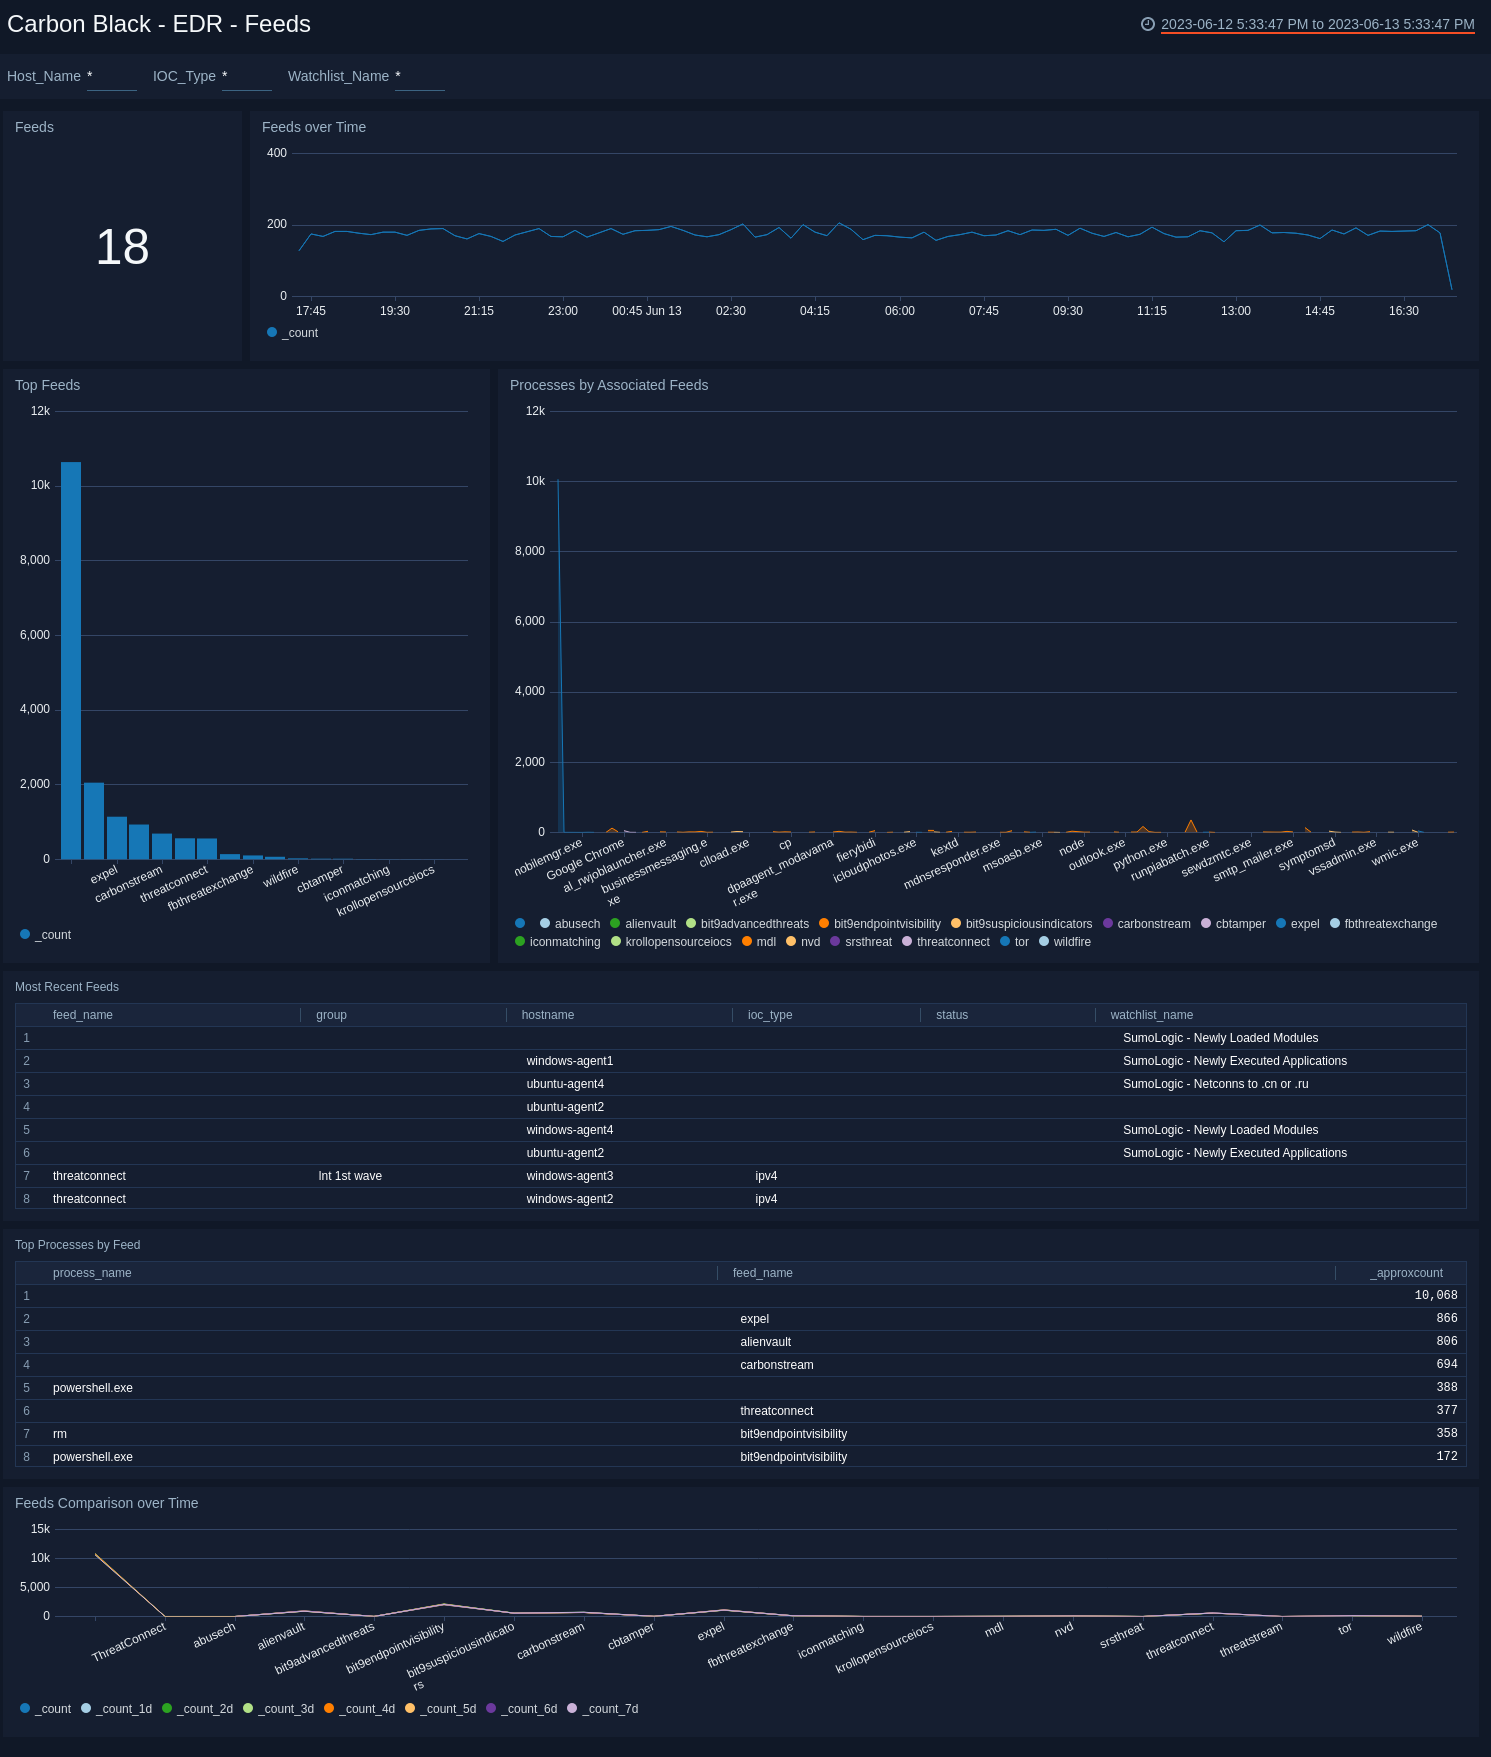
Use this dashboard to:
- Monitor feed activity and identify spikes.
- Correlate processes and feeds.
- Compare feeds over time.
EDR - Indicators of Compromise
The Carbon Black - EDR - Indicators of Compromise dashboard shows details on indicators of a compromised environment, as well as status for IOCs. The panels also provide an at-a-glance view of top malicious IPv4 addresses, top IOC DNSs, queries and query based feeds.
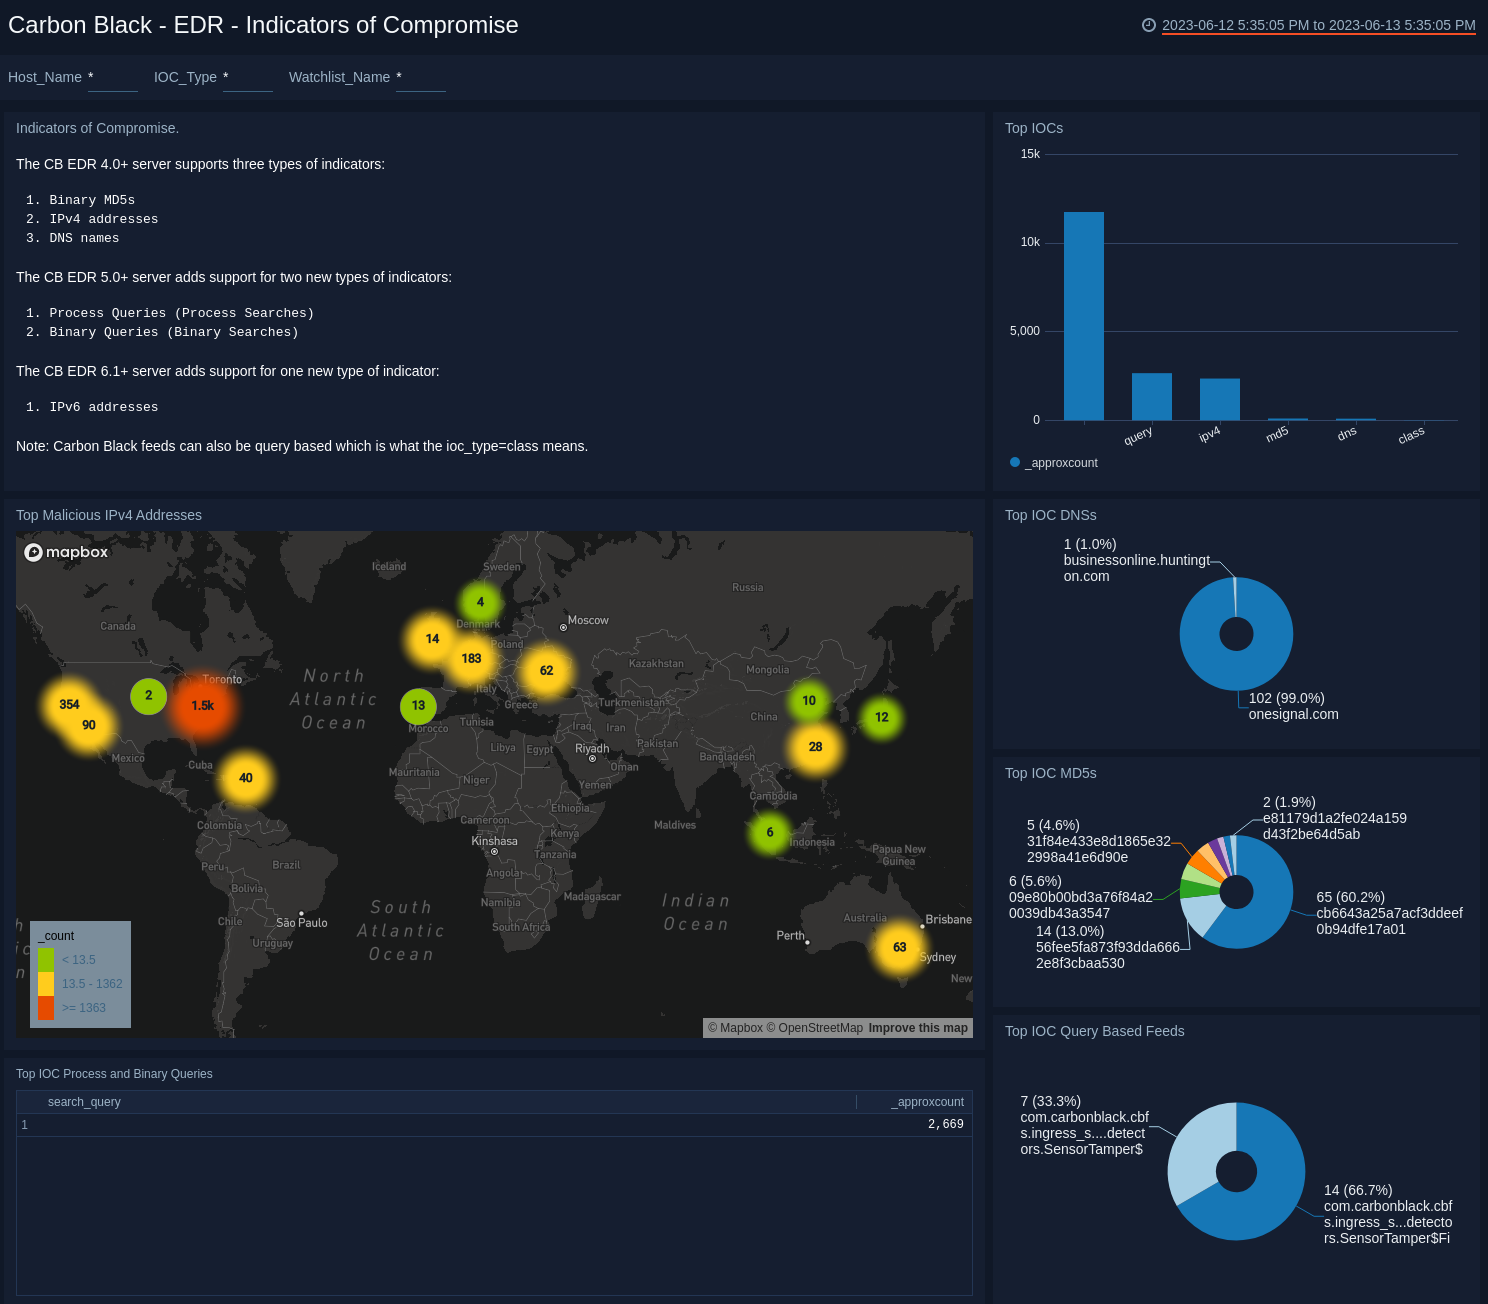
Use this dashboard to:
- Determine the locations of attacks.
- Track suspicious DNSs.
- Determine which queries receive the most hits.
EDR - Network
The Carbon Black - EDR - Network dashboard provides networking details for top protocols, local and remote ports, and unique IP addresses.
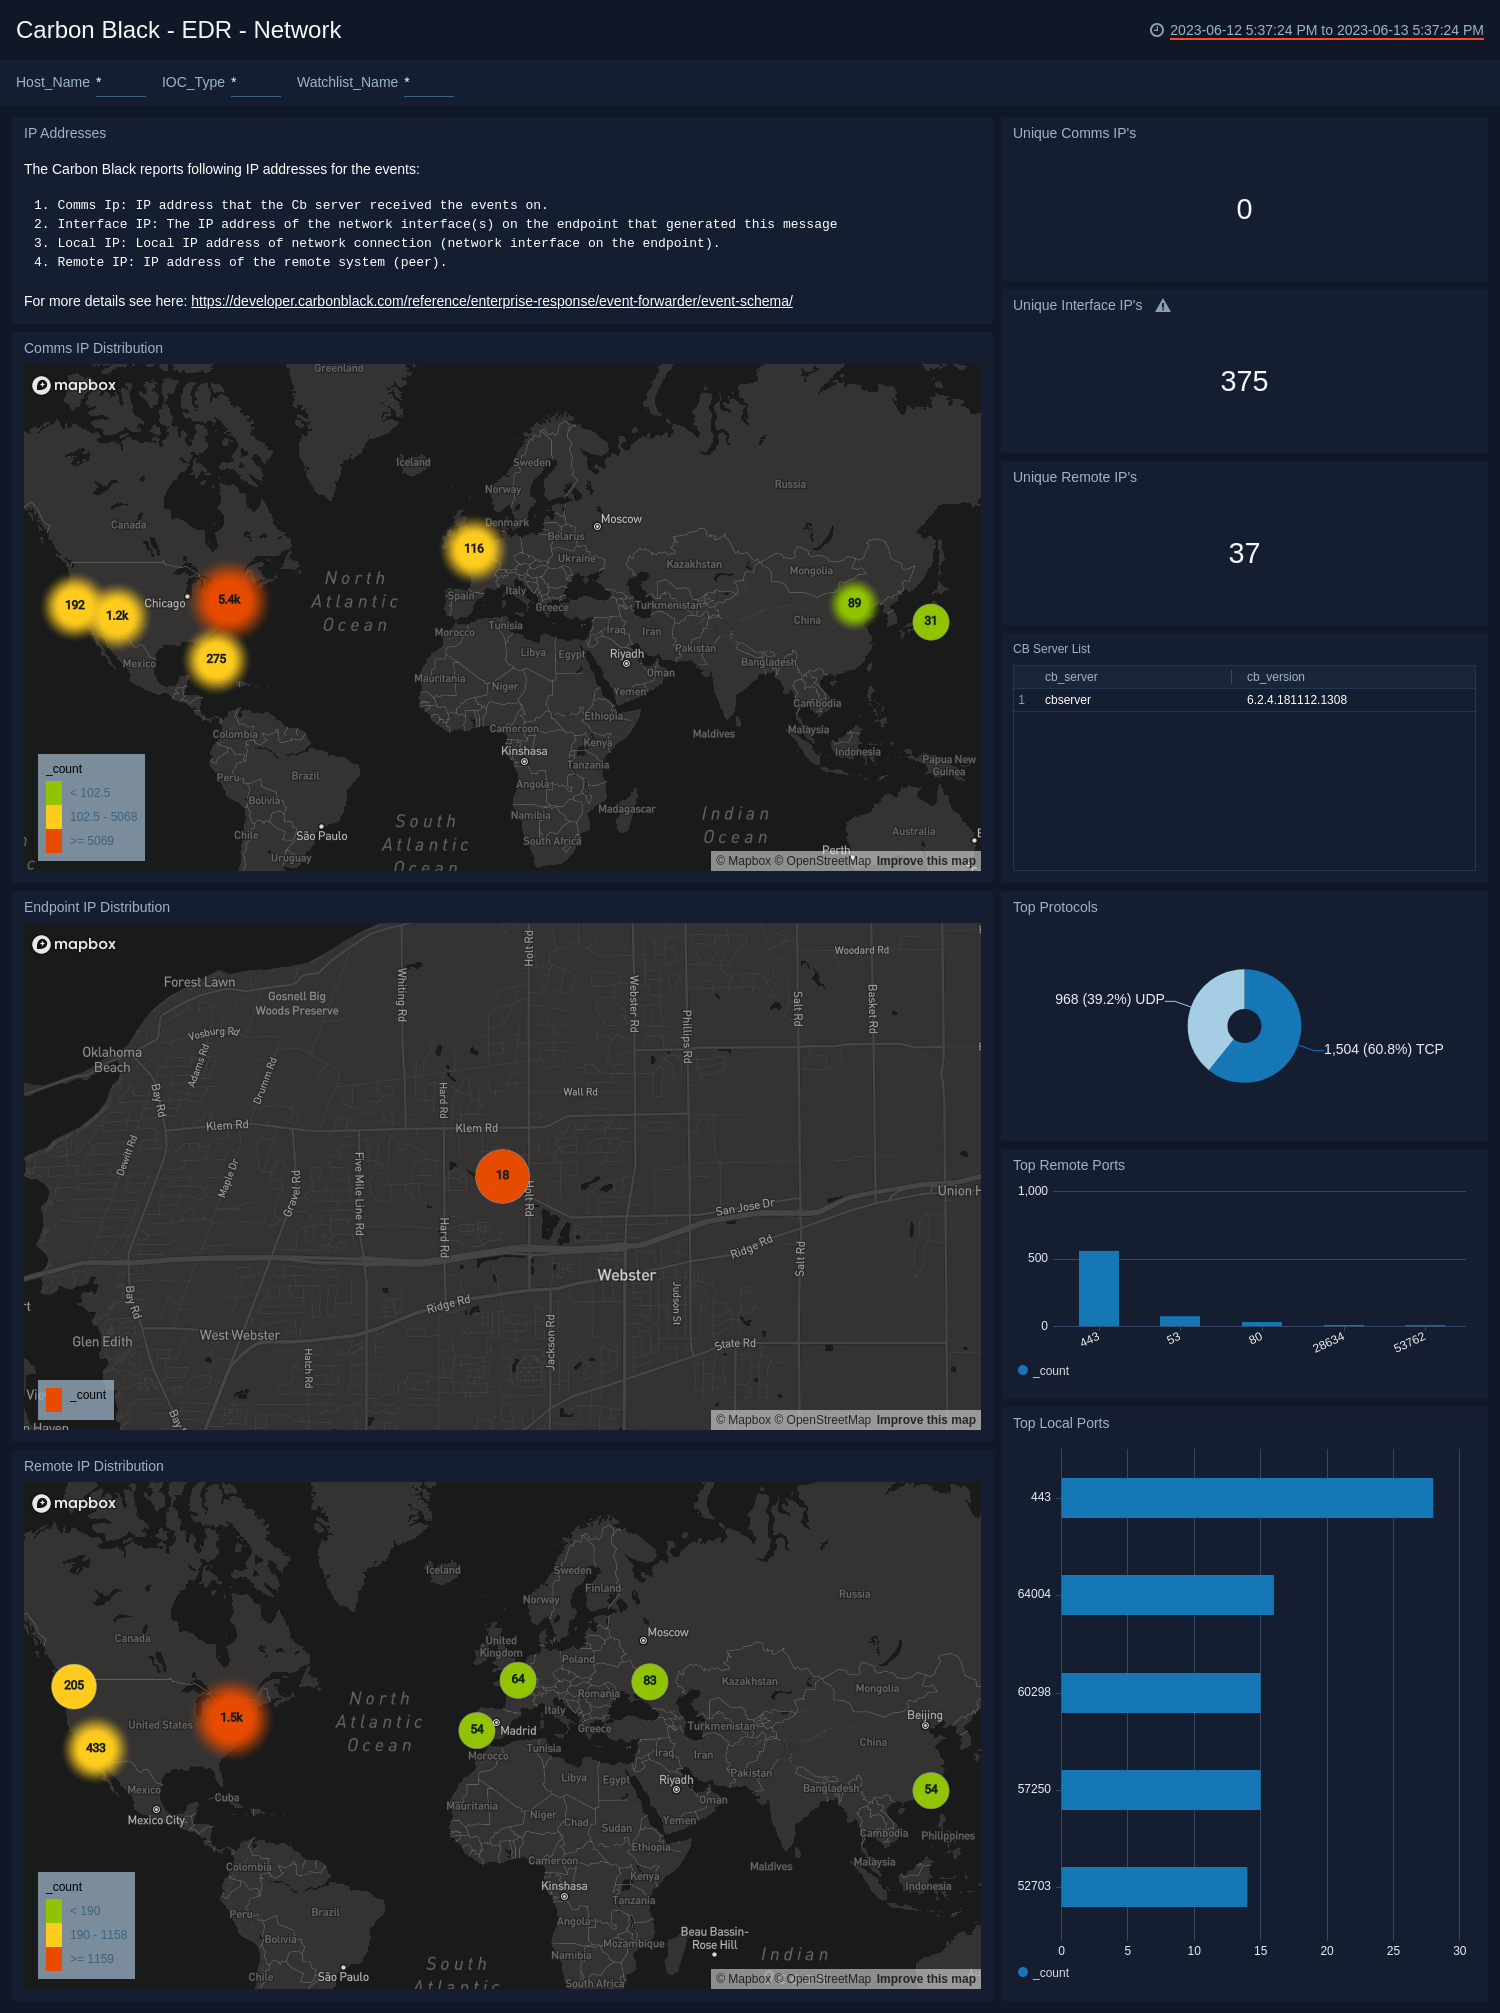
Use this dashboard to:
- Determine the geographic location of network connections.
- Monitor ports.
- Review a list of CB servers.
EDR - Processes
The Carbon Black - EDR - Processes dashboard provides details on the processes that generate events.
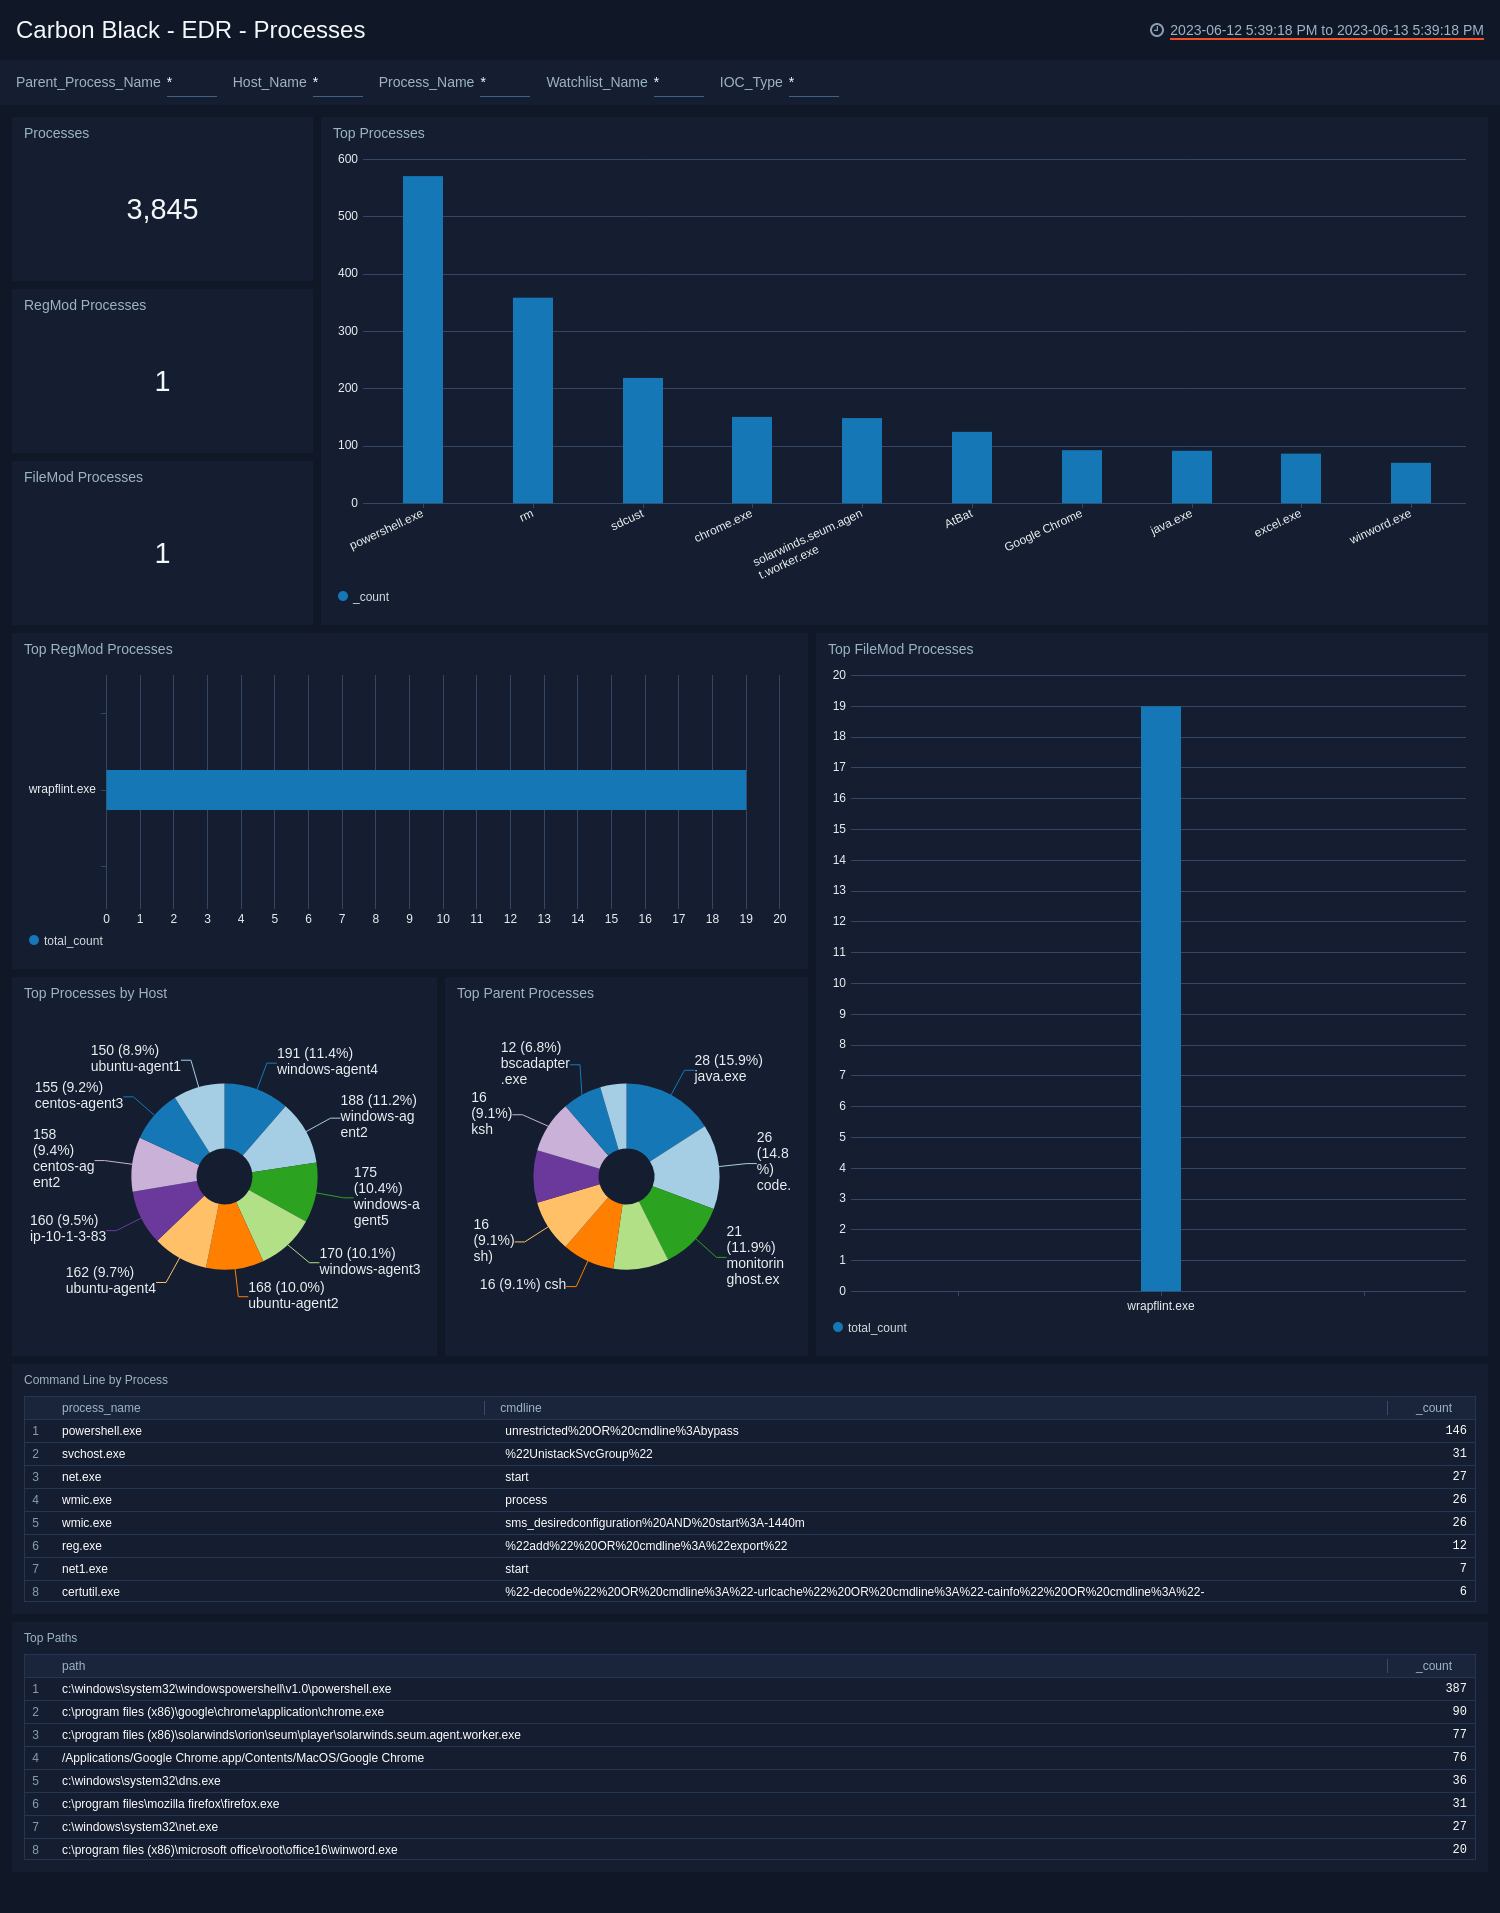
Use this dashboard to:
- Review processes used to modify registries and files.
- Monitor command line processes, and top paths for processes that generate alerts.
EDR - Sensors
The Carbon Black - EDR - Sensors dashboard provides details of the sensors in your environment, such as sensor activity, trends and activity over time, and operating system.
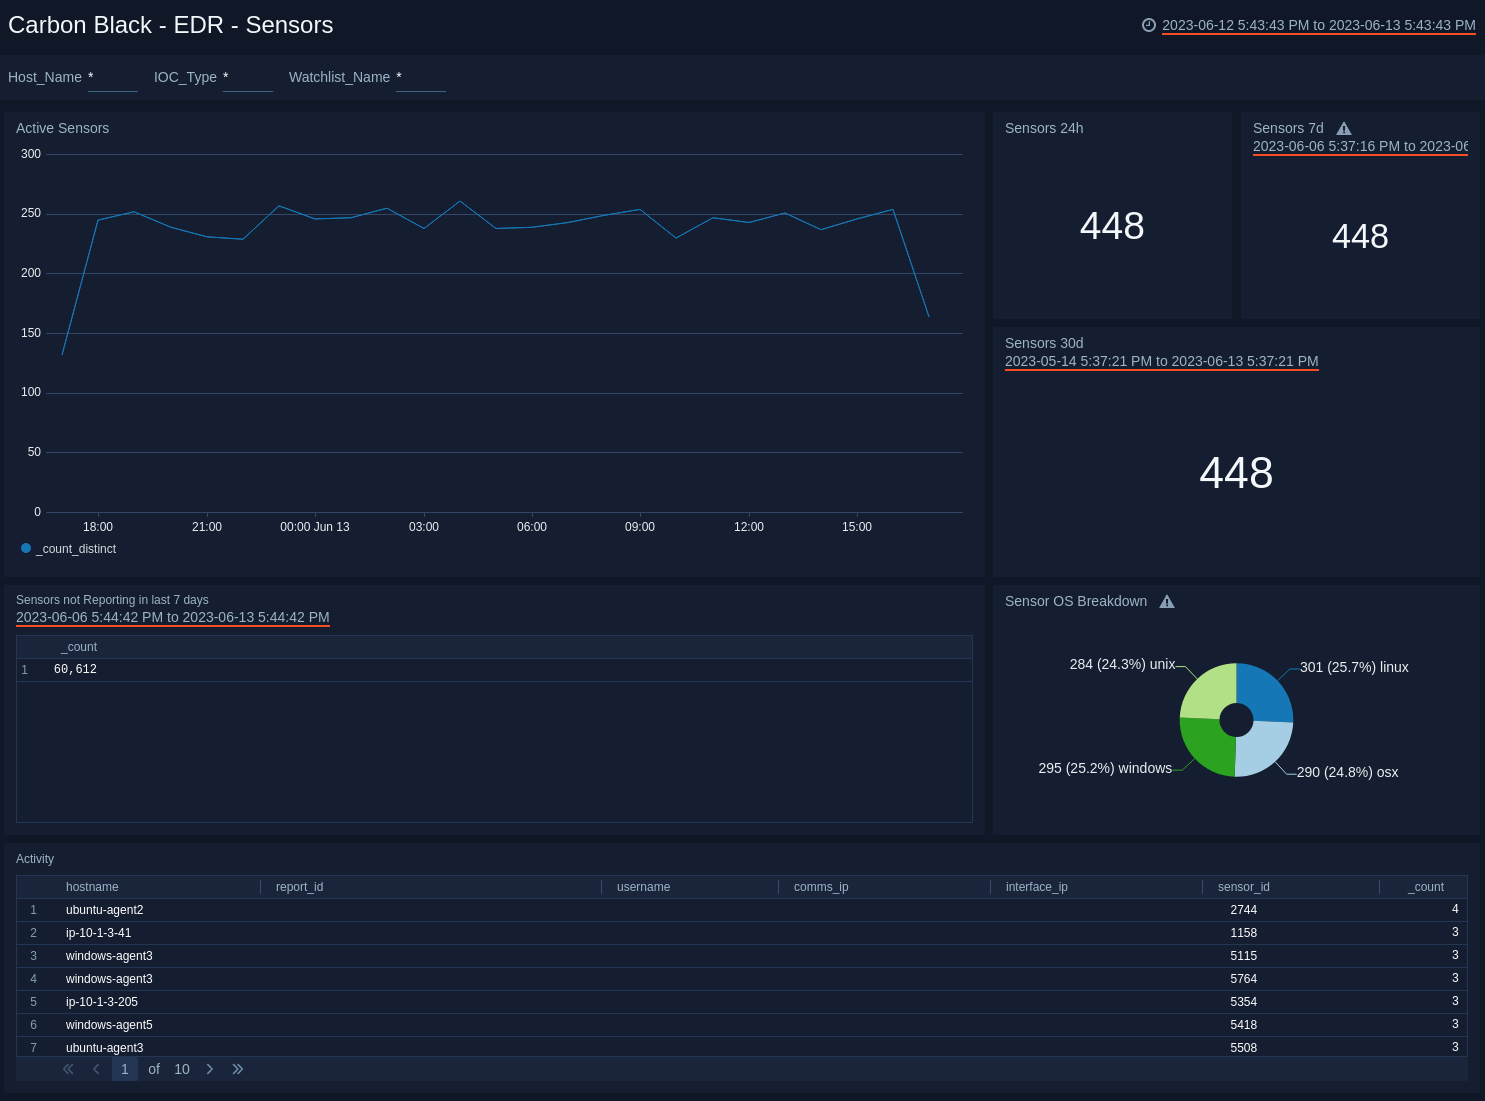
Use this dashboard to:
- Identify sensors that are not reporting over a specified time period.
- Monitor sensor activity and rate spikes.
EDR - Threat Intelligence
The Carbon Black - EDR - Threat Intelligence dashboard allows you to monitor threats on your network, categorized by feed, score, and severity. You can view recent threats, trends over time, and hosts affected by threats.
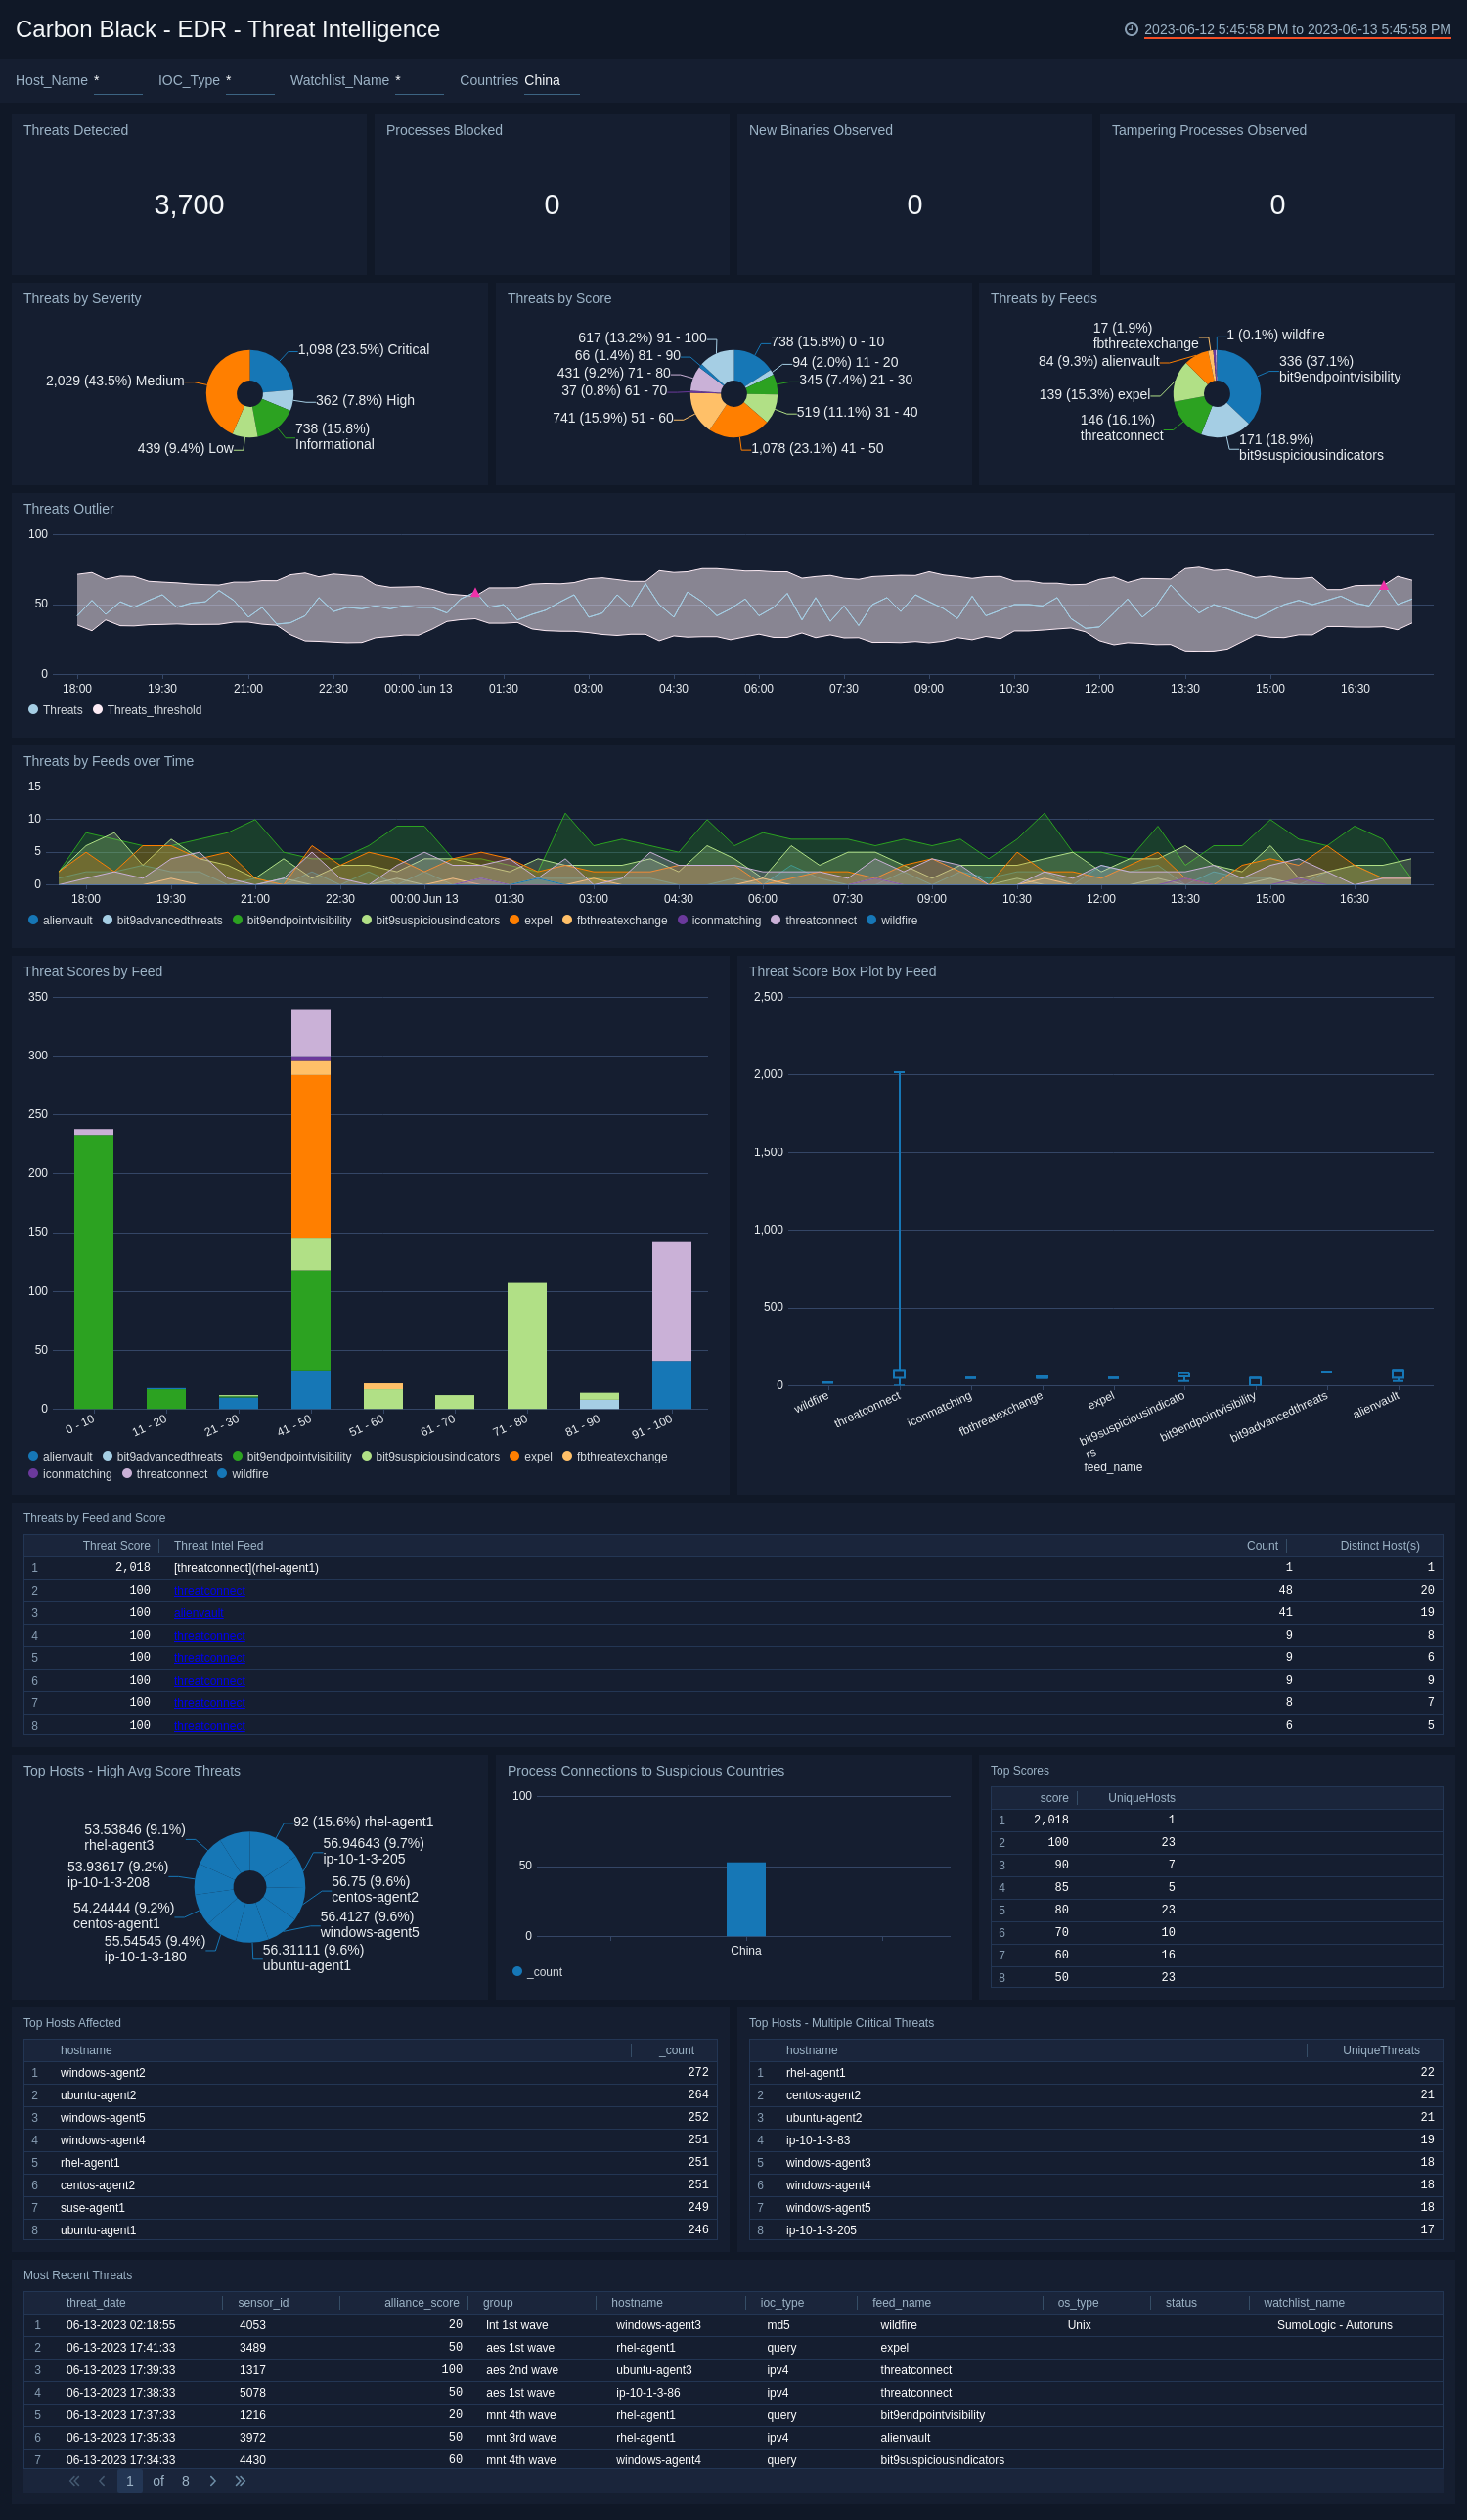
Use this dashboard to:
- Review threats over specified time periods.
- Filter threats by severity to focus on high priority threats.
- Identify hosts with the greatest number of threats.
EDR - User and Host Alerts
The Carbon Black - EDR - User and Host Alerts dashboard provides an at-a-glance view of user and host activity.
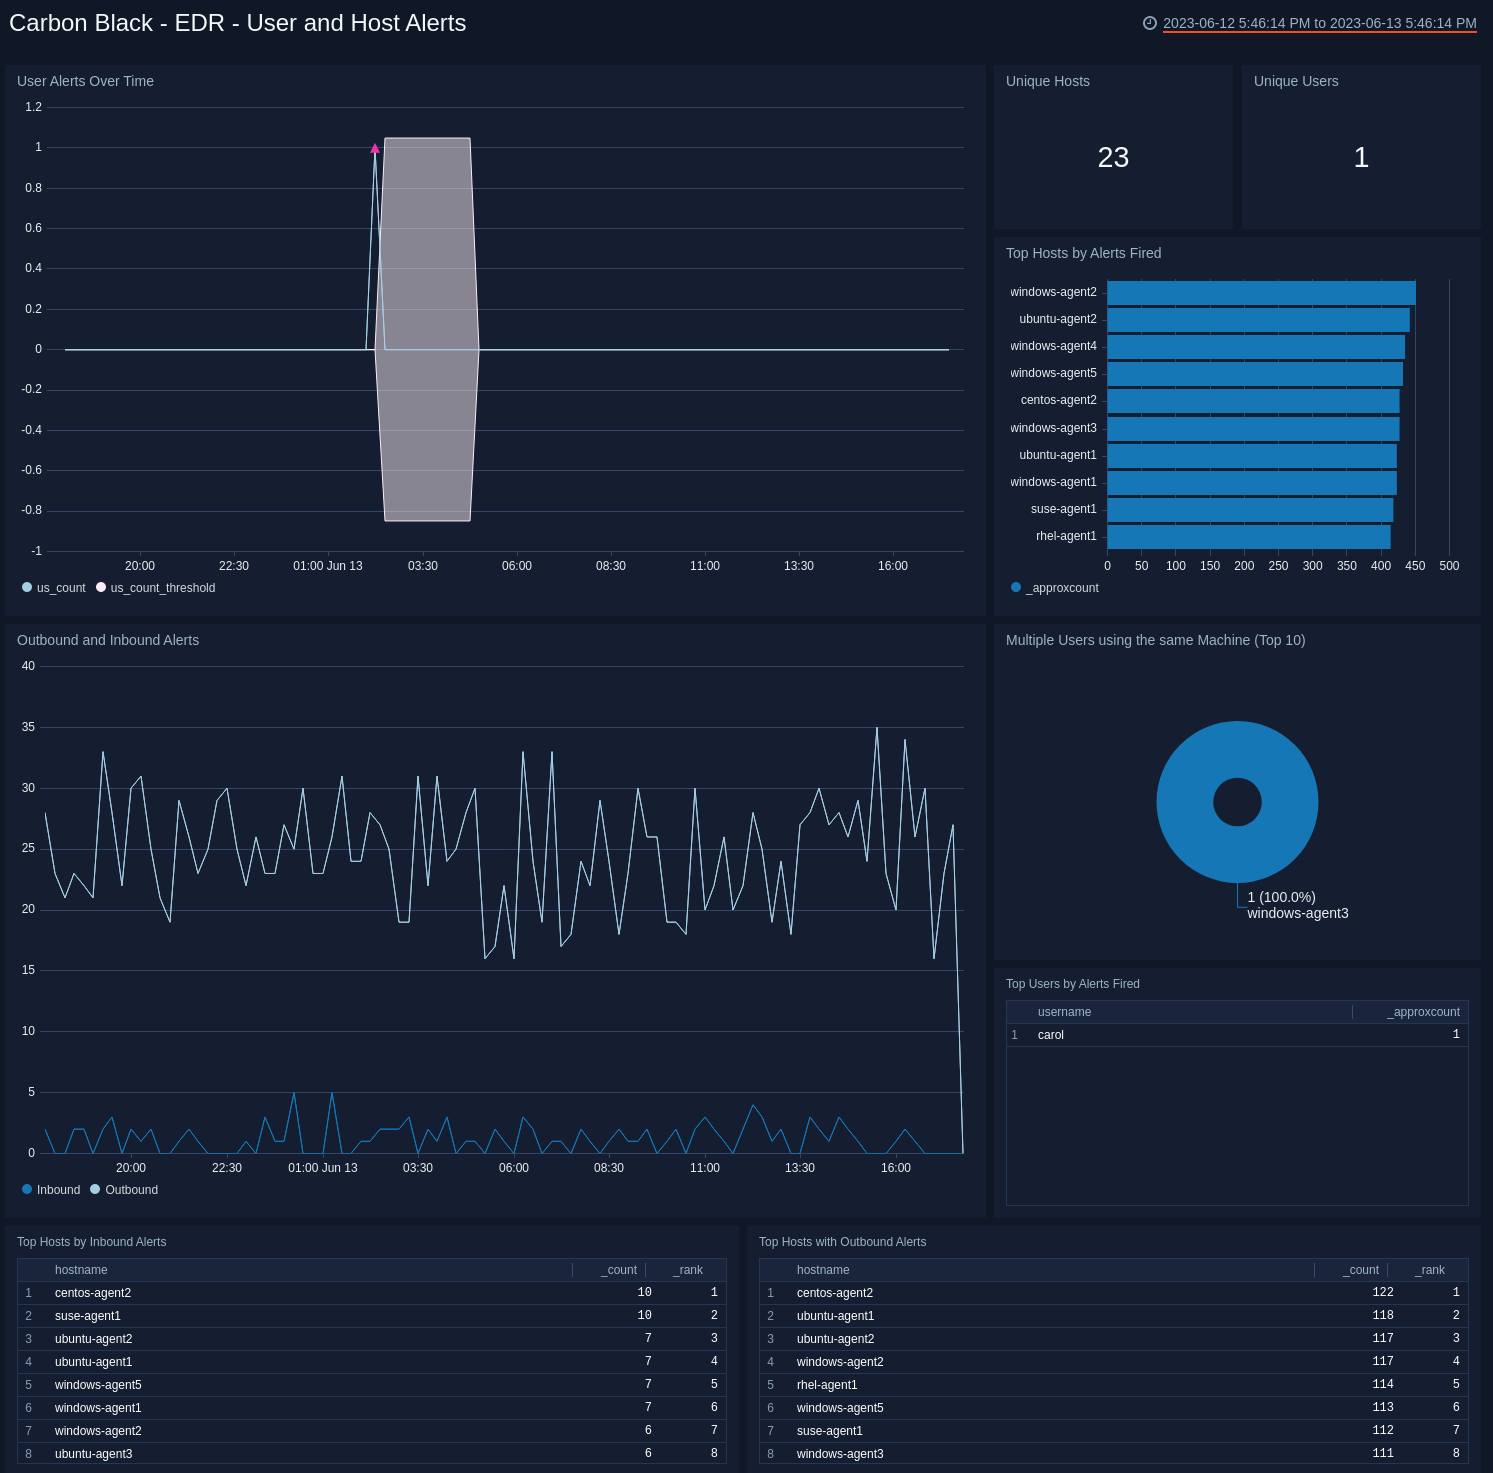
Use this dashboard to:
- Monitor alert trends
- Identify users responsible for the most alerts.
- Monitor user activity
- Review outbound and inbound alert activity.
EDR - Watchlists Dashboard
The Carbon Black - EDR - Watchlists dashboard provides details on watchlists, including the number of watchlists, top watchlists, trends, and comparisons over time.
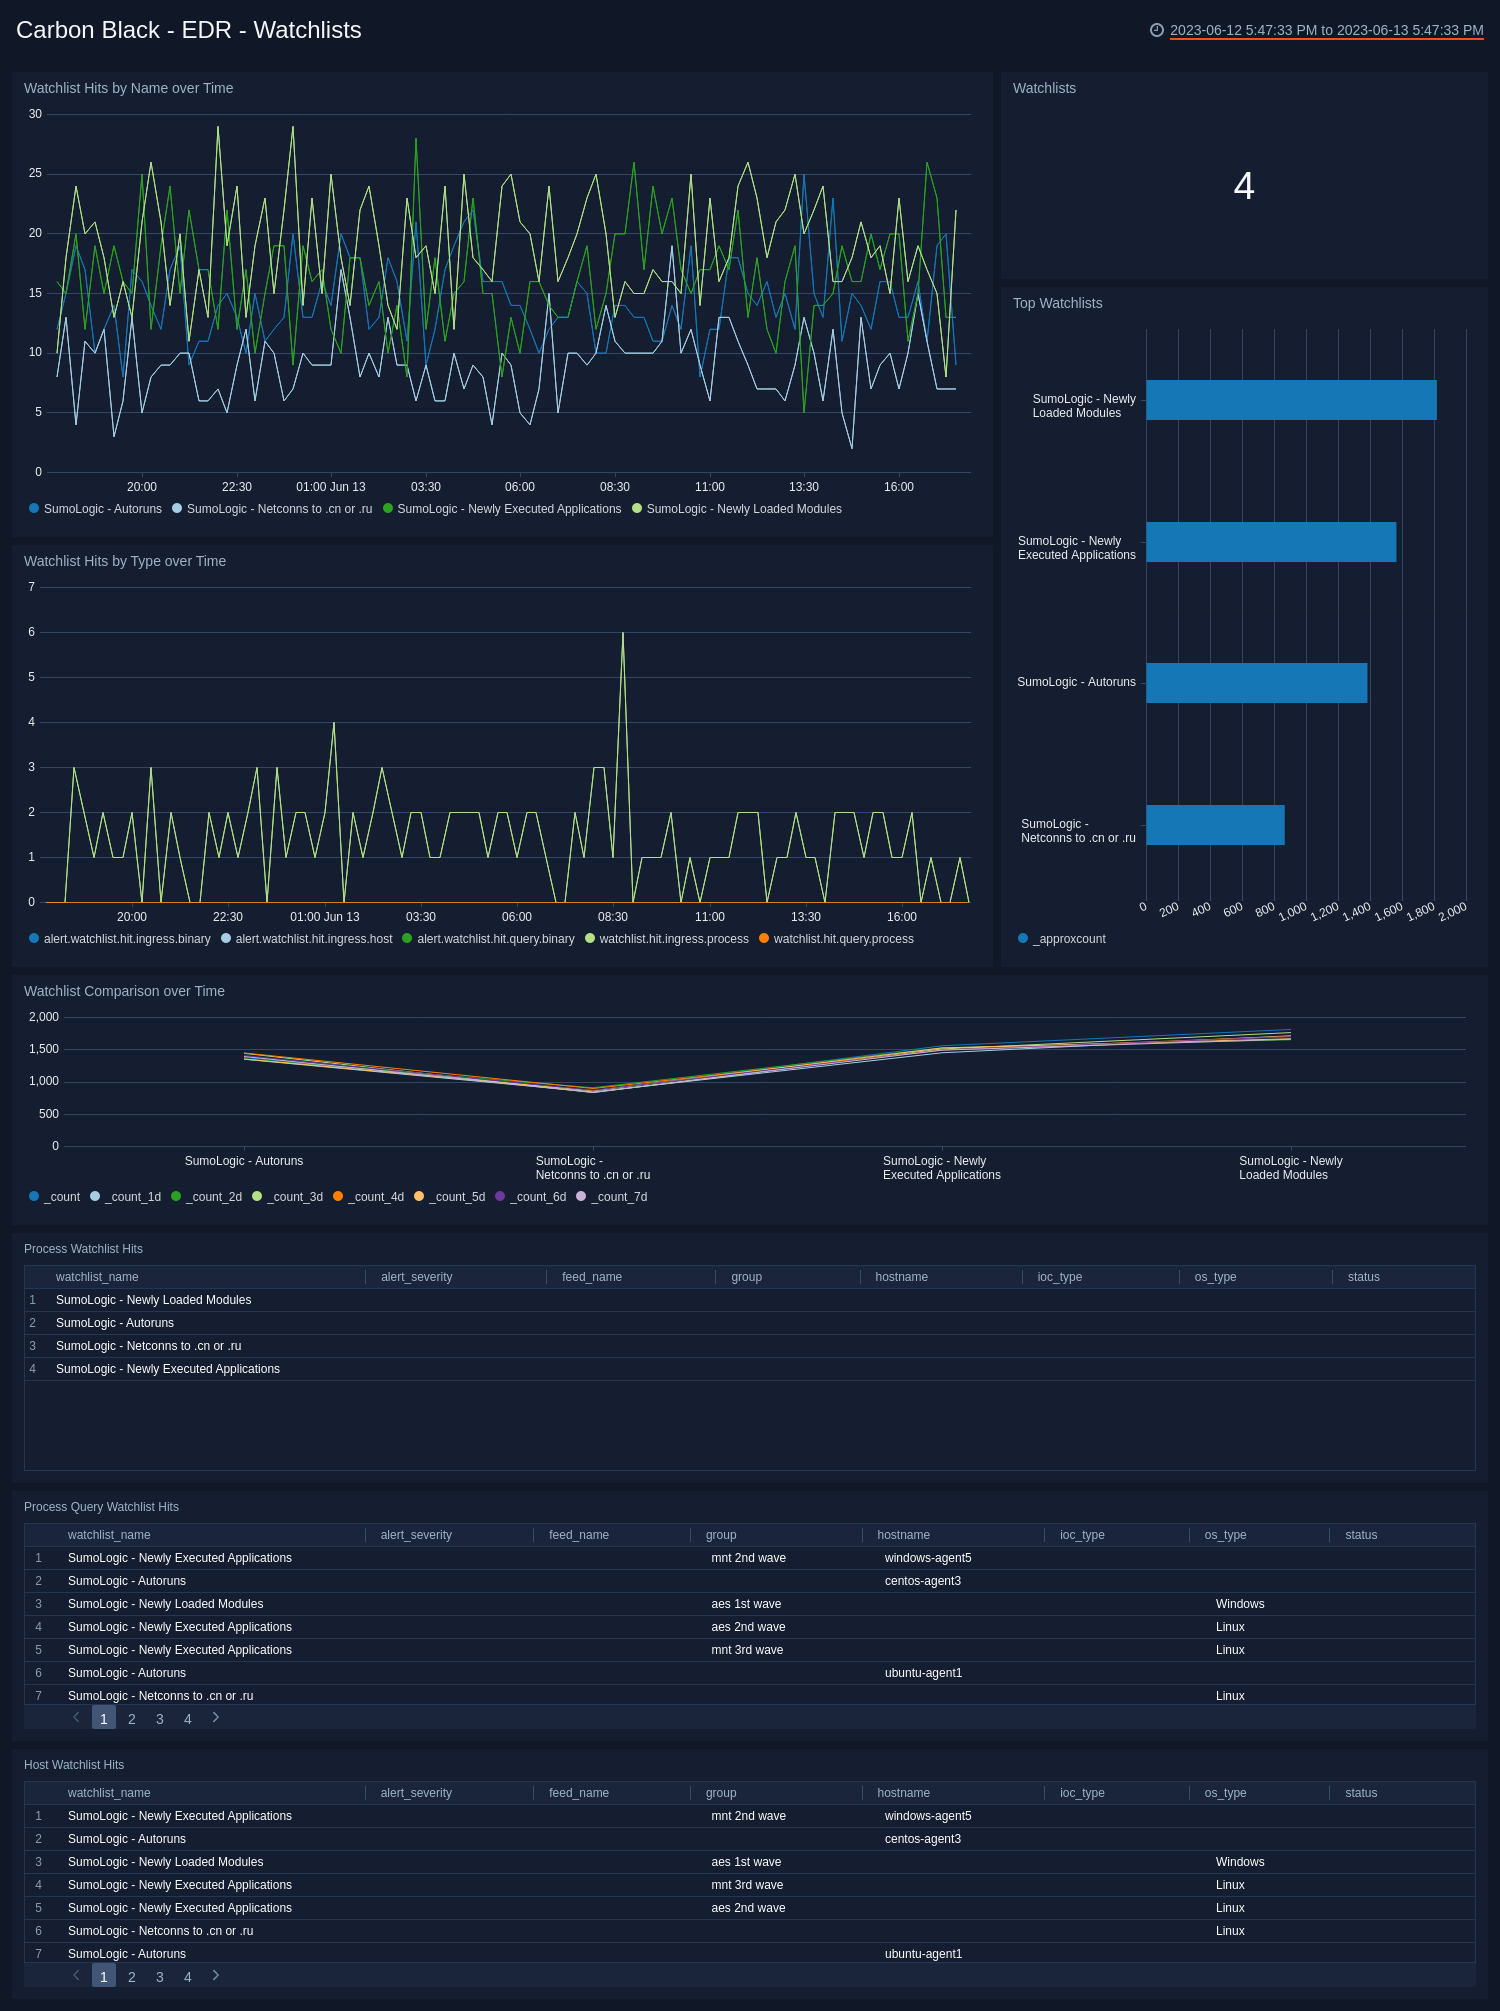
Use this dashboard to:
- Identify the watchlists with the most hits in each category.
- Monitor hits for individual watchlists and determine activity spikes.
Endpoint Standard - Overview Dashboard
The Carbon Black - Endpoint Standard - Overview dashboard provides a high-level view of the state of your network security, showing the number of detected threats, alerts, indicators of compromise, devices, users, and groups. The panels also highlight alert trends, top users, indicators, devices, applications, and reasons.
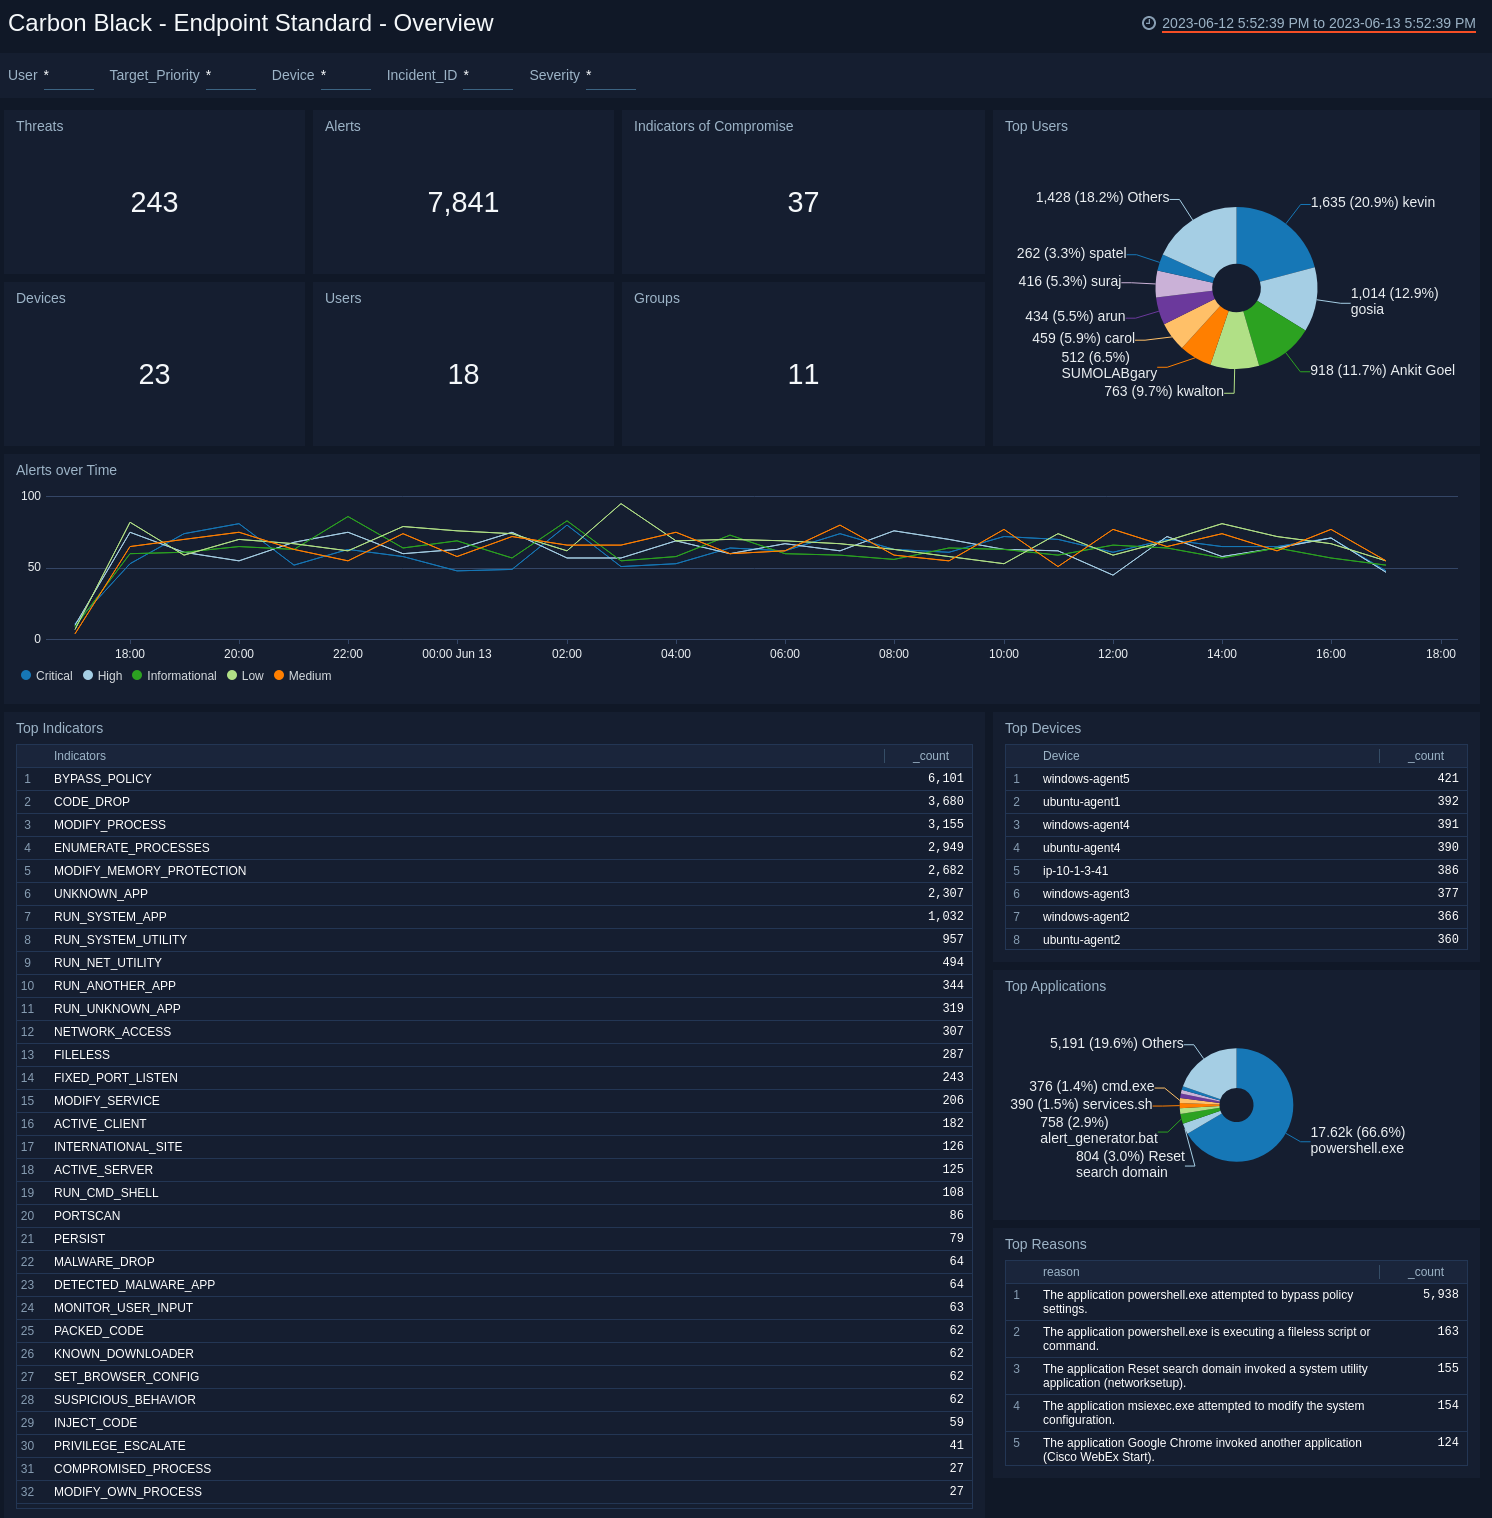
Use this dashboard to:
- Quickly review your infrastructure security status.
- Understand what areas of the infrastructure are experiencing issues.
- Determine how the infrastructure is being utilized by taking a look at top users, applications and devices.
Endpoint Standard - Indicators of Compromise Dashboard
The Carbon Black - Endpoint Standard - Indicators of Compromise dashboard provides an at-a-glance view of indicators of threats to a secure network by severity, application, and the number of unique instances. A breakdown of each known indicator is also shown.
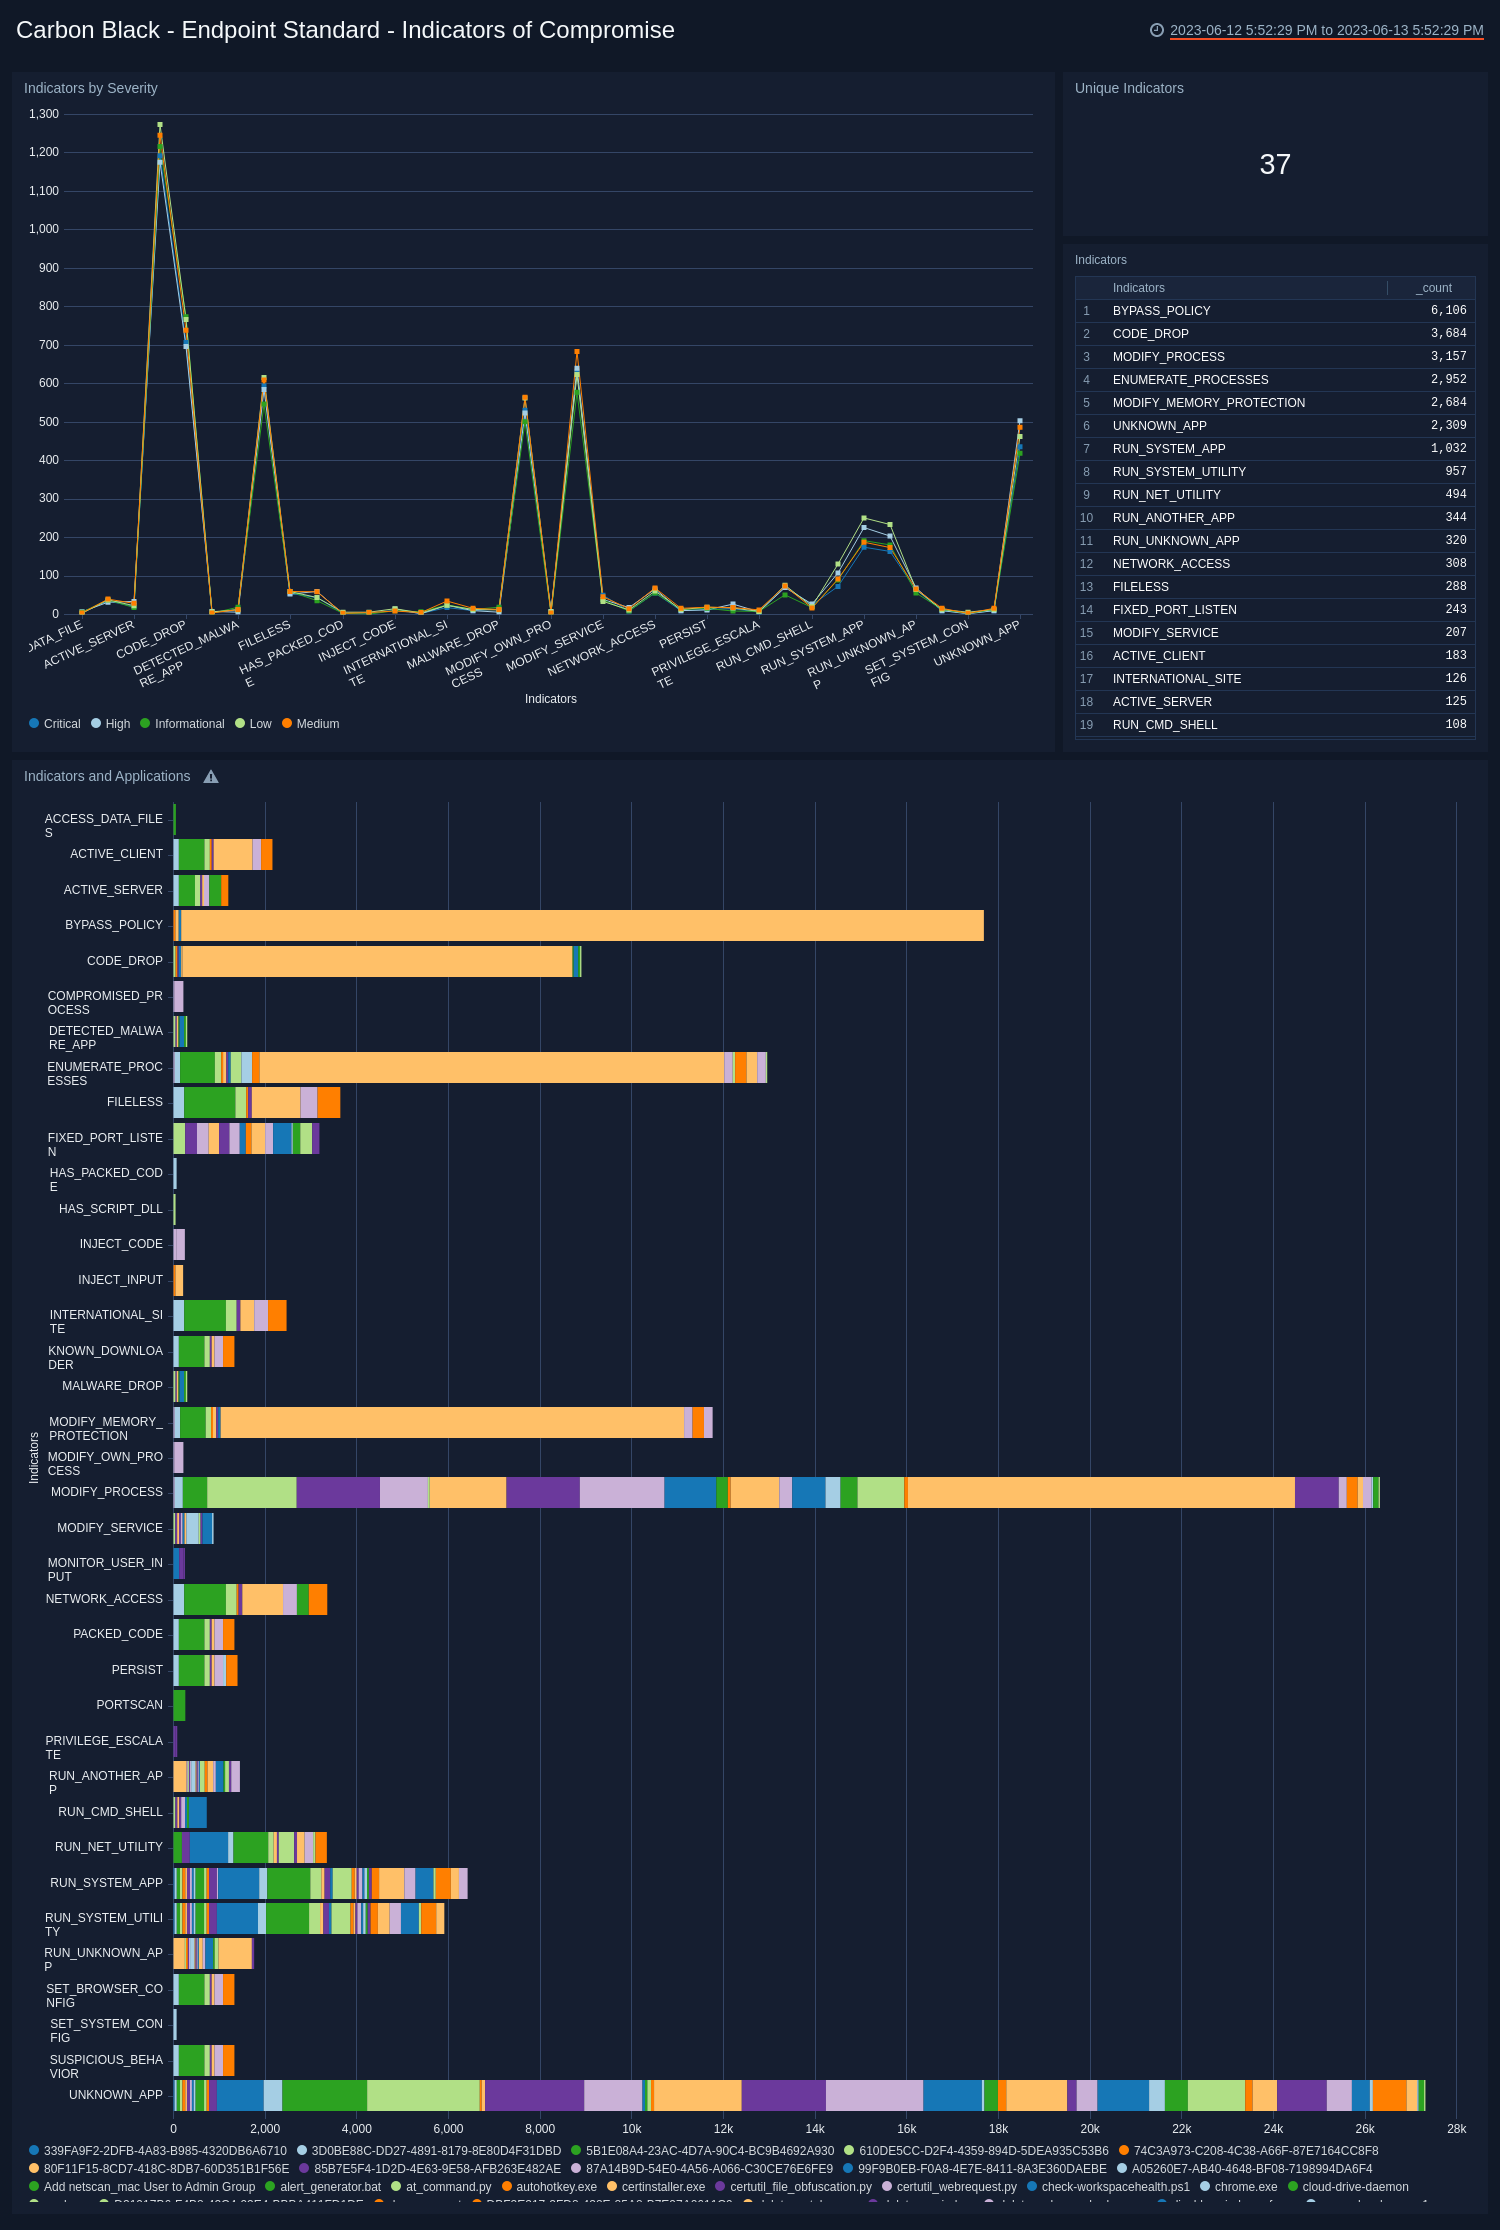
Use this dashboard to:
- Review which indicators are affecting your system.
- Understand how severity and the applications relate to the indicators.
Endpoint Standard - Threat Intelligence Dashboard
The Carbon Black - Endpoint Standard - Threat Intelligence dashboard provides details on the threats on your network, including the number of threats, their severity, and threat outliers. The panels also show details on the top devices affected by threats, recent threats, and a rating score of threats.
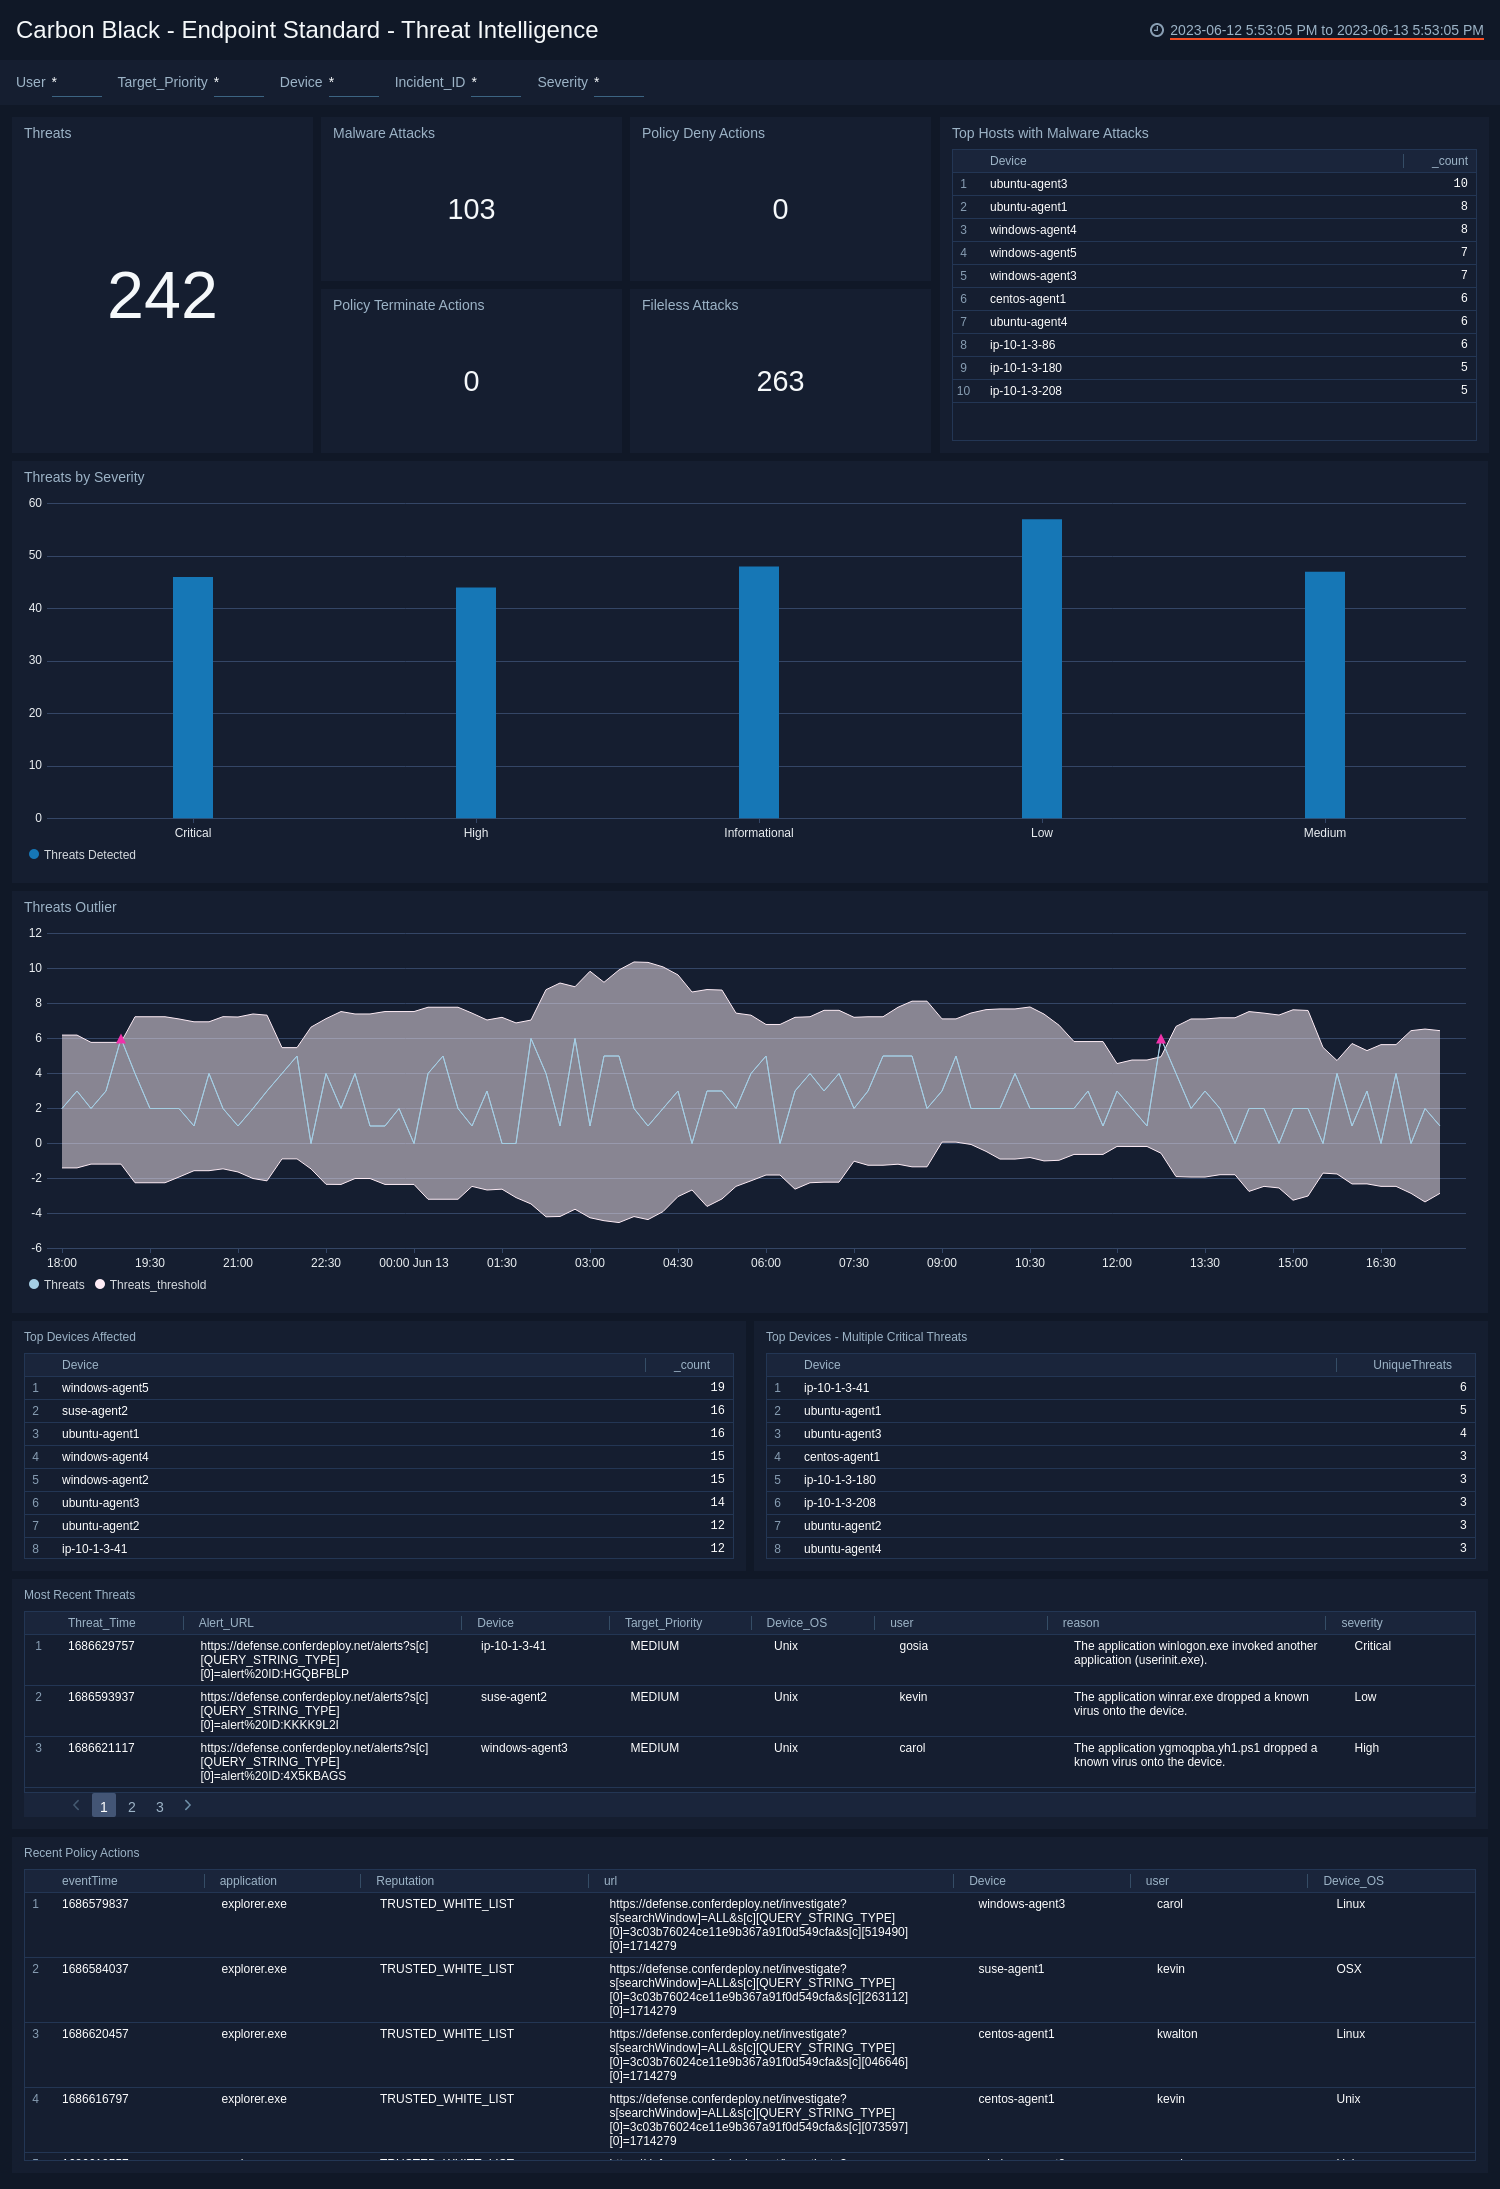
Use this dashboard to:
- Review the threats identified in your infrastructure.
- Investigate the threats by understanding the severity and scores of the threats.
Endpoint Standard - Alerts Dashboard
The Carbon Black - Endpoint Standard - Alerts dashboard provides detailed information on security-related alerts in your environment, including the number of alerts, severity, and trends over time. The panels also show information on alert policies, device operating systems (OS), and most recent alerts.
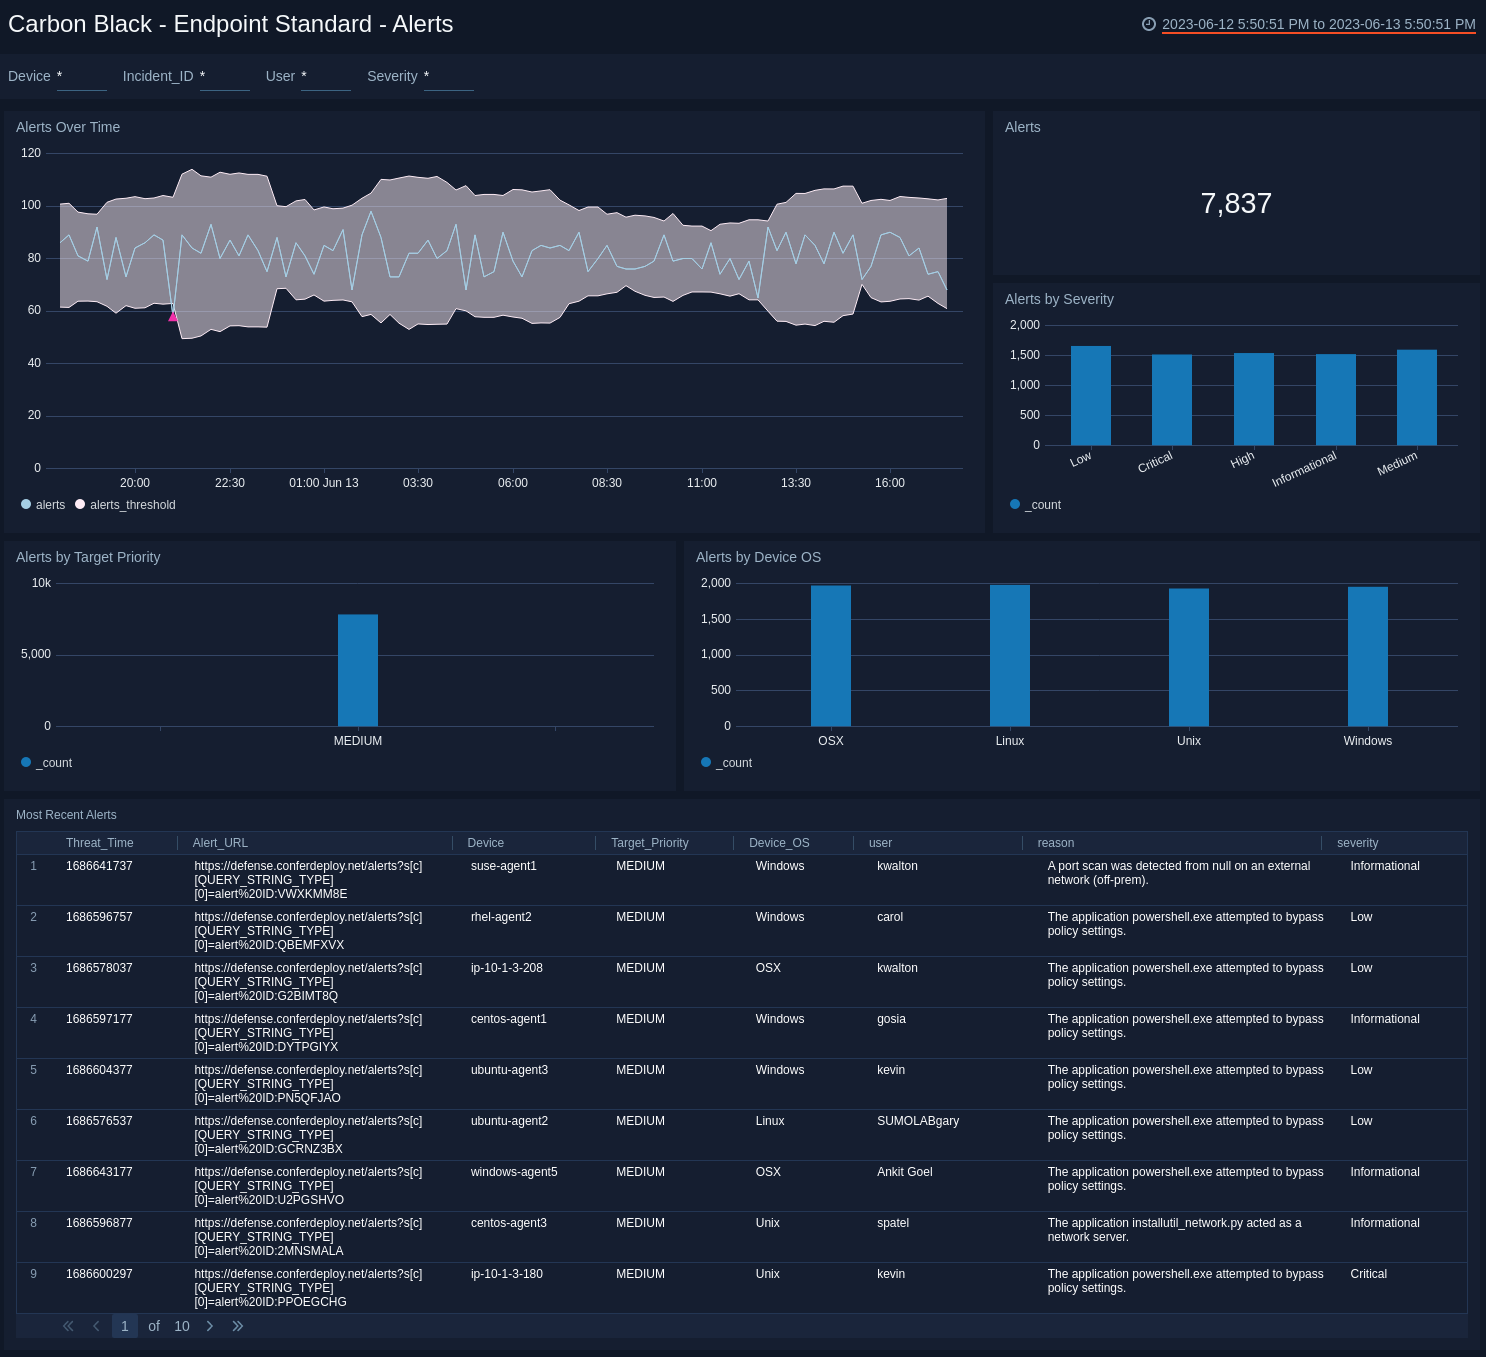
Use this dashboard to:
- View an overall picture of all the alerts being generated.
- Understand the classification of alerts based on different criteria, such as Severity, Policy, and Score.
- Monitor spikes in alerts over time.
Endpoint Standard - Device Dashboard
The Carbon Black - Endpoint Standard - Device dashboard provides a high-level view of the devices on your network, including the number of devices, geographic locations, and operating systems. The panels also show information on device groups, incidents, alert severity, and target priority.
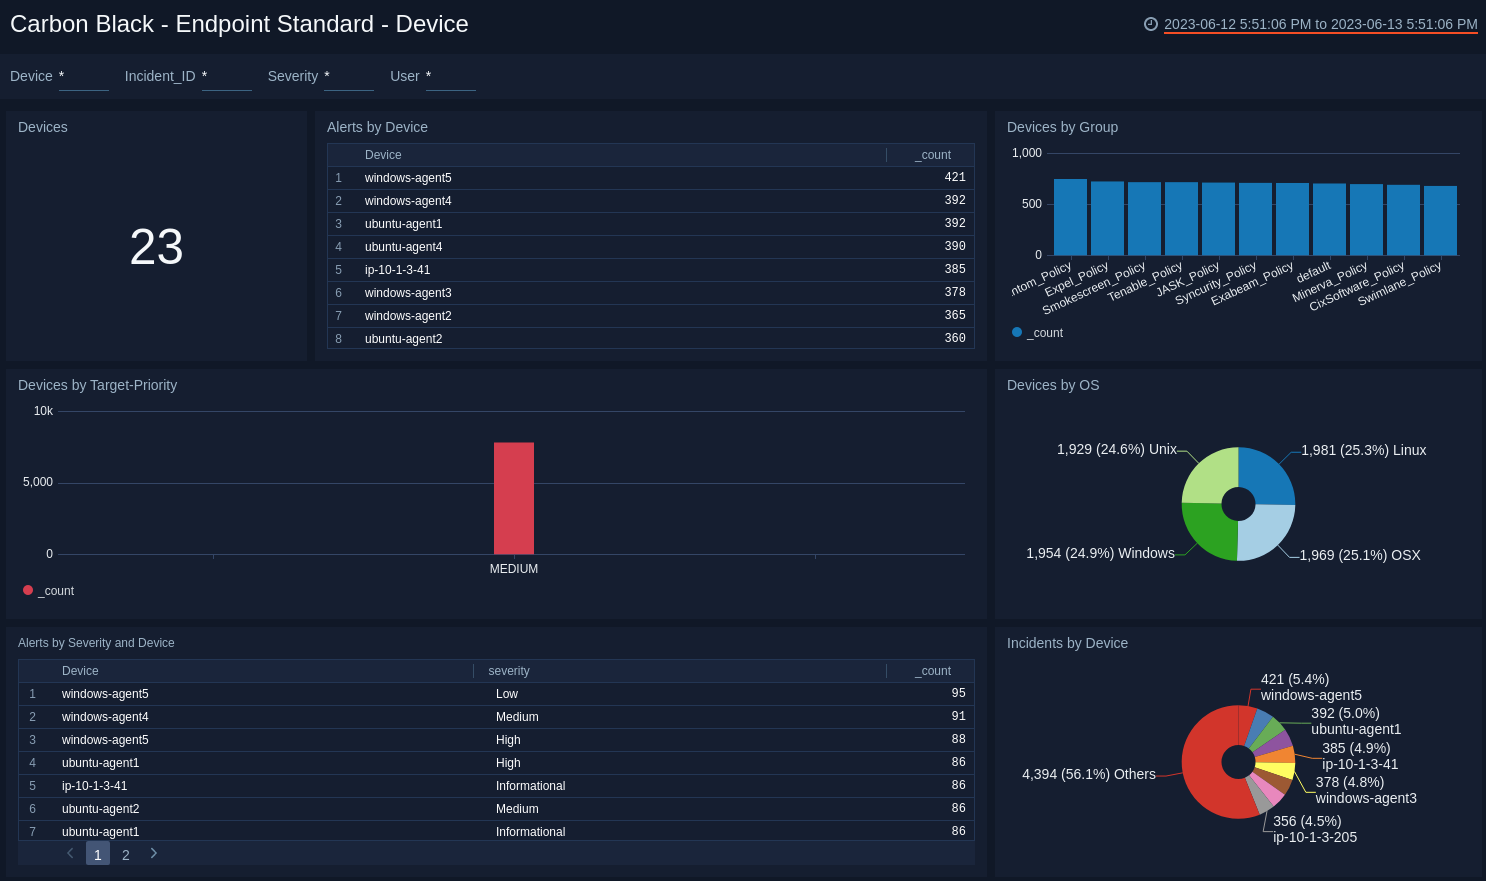
Use this dashboard to:
- Monitor device classification by OS, Group, and Target Priority.
- Track the devices generating the highest number of incidents.
- Determine the most common location of the devices generating alerts to isolate threats.