Zscaler Internet Access

The Sumo Logic app for Zscaler Internet Access (ZIA) collects logs via Cloud Nanolog Streaming Service (NSS) to populate pre-configured searches and Dashboards in order to visualize and provide insight into threats, DNS, web traffic behaviors, security, user browsing activities, and risk.
Log types
The Sumo Logic app for Zscaler uses NSS feed output logs (Web, Tunnel, DNS, and Firewall), as documented here.
Sample log messages
{
  "sourcetype": "zscalernss-web",
  "event": {
    "datetime": "2021-06-17 14:53:16",
    "reason": "Allowed",
    "event_id": "6974776045860487177",
    "protocol": "HTTP_PROXY",
    "action": "Allowed",
    "transactionsize": "639",
    "responsesize": "65",
    "requestsize": "574",
    "urlcategory": "Corporate Marketing",
    "serverip": "104.21.31.16",
    "clienttranstime": "0",
    "requestmethod": "CONNECT",
    "refererURL": "None",
    "useragent": "Windows Microsoft Windows 10 Pro ZTunnel/1.0",
    "product": "NSS",
    "location": "Road Warrior",
    "ClientIP": "40.83.138.250",
    "status": "200",
    "user": "testuser2@bd-dev.com",
    "url": "hamsan.yektanet.com:443",
    "vendor": "Zscaler",
    "hostname": "hamsan.yektanet.com",
    "clientpublicIP": "40.83.138.250",
    "threatcategory": "None",
    "threatname": "None",
    "filetype": "None",
    "appname": "General Browsing",
    "pagerisk": "0",
    "department": "Service Admin",
    "urlsupercategory": "Business and Economy",
    "appclass": "General Browsing",
    "dlpengine": "None",
    "urlclass": "Business Use",
    "threatclass": "None",
    "dlpdictionaries": "None",
    "fileclass": "None",
    "bwthrottle": "NO",
    "servertranstime": "0",
    "contenttype": "Other",
    "unscannabletype": "None",
    "odeviceowner": "5864177",
    "odevicehostname": "4051327232"
  }
}
Sample queries
_sourceCategory=ZIA
| json field=_raw "event.clientpublicIP", "event.user", "event.url", "event.action" as src_ip, src_user, url, action
| where action != "Allowed"
| parse regex field=url "(?<baseurl>.+?)[:/]" nodrop
| count by baseurl
| sort _count
| top 10 baseurl by _count
Collect logs for the Zscaler Internet Access app
Zscaler uses Cloud Nanolog Streaming Service (NSS), which allows direct cloud-to-cloud log streaming for all types of ZIA logs into Sumo Logic.
To collect logs for Zscaler, perform these steps, detailed in the following sections.
Step 1: Configure Sumo Logic Hosted Collector and an HTTP Source
To collect logs for Zscaler, do the following in Sumo Logic:
- Configure a Hosted Collector.
- Configure an HTTP Source.
- For the Source Category, enter any string to tag the output collected from this Source, such as ZIA.
- Click Save and make note of the HTTP address for the Source. You will need it when you configure the Zscaler Cloud NSS in the next section.
Step 2: Configure Zscaler Cloud NSS
Zscaler uses Cloud Nanolog Streaming Service (NSS), which allows direct cloud-to-cloud log streaming for all types of ZIA logs into Sumo Logic.
To send logs to Sumo Logic using Cloud NSS, add a feed in ZIA using the following steps:
- Log into your ZIA system.
- Go to Administration > Nanolog Streaming Service > Cloud NSS Feeds.
enable Cloud NSS
Cloud NSS is disabled by default in ZIA. If you do not see Cloud NSS Feeds option in your ZIA environment, create a support request with Zscaler support.
- From the Cloud NSS Feeds tab, click Add Cloud NSS Feed. For more information about adding Cloud NSS Feeds, see the Zscaler documentation.
- In the Add NSS Feed dialog:
- Feed Name. Enter a name for your NSS feed.
- NSS Type. Select NSS for Web.
- Status. Select Enabled.
- SIEM Type. Select Sumo Logic.
- API URL. Paste the HTTP address for the Source generated in the previous section.
- Add HTTP Header. No headers are required for Sumo Logic. If it requires at least one header, add a dummy header.
- Log Type. Select Web Log.
- Feed Output Type. Select JSON.
- JSON Array Notation. Disable so that logs ingest as individual JSON objects instead of a JSON array.
- Feed Escape Character. Leave this field blank for Web, Firewall, and Tunnel. Set as ," for DNS.
- Feed Output Format. The JSON format is displayed. (Leave the default setting.)
- Timezone. Set to GMT by default.
- Web Log Filters. Choose filters you would like to have.
- Click Save.
- Repeat above steps for:
- NSS Type: NSS for Web and Log Type: Tunnel.
- NSS Type: NSS for Web and Log Type: SaaS Security.
- NSS Type: NSS for FireWall and Log Type: Firewall Logs.
- NSS Type: NSS for FireWall and Log Type: DNS Logs.
Sumo Logic Dashboards utilize Web, Tunnel, and DNS Logs.
Configure the Zscaler NSS feeds (optional)
If you are not able to use Zscaler Cloud NSS, you can collect logs for the ZIA app using NSS Servers. For DNS, Firewall, and Tunnel logs, you can select JSON as the output format for the feed in the Add NSS Feeds dialog. For Web logs, you will need to configure the feed as follows:
- Log into your Zscaler NSS system.
- Go to Administration > Settings > Nanolog Streaming Service.
- From the NSS Feeds tab, click Add.
- In the Add NSS Feed dialog:
- Feed Name. Enter a name for your NSS feed.
- NSS Server. Select the NSS Server.
- SIEM IP Address. Enter the Sumo Logic Installed Collector IP address.
- Log Type. Select Web Log.
- Feed Output Type. Custom.
- NSS Type. NSS for Web is the default.
- Status. Select Enabled.
- SIEM TCP Port. Enter the Sumo Logic Syslog Source TCP port number.
- Feed Escape Character. Leave this field blank for Web, Firewall, and Tunnel. Set as ," for DNS.
- Feed Output Format. Select Custom and paste the following:
- Web Logs
\{ "sourcetype" : "zscalernss-web", "event" : \{"datetime":"%d{yy}-%02d{mth}-%02d{dd} %02d{hh}:%02d{mm}:%02d{ss}","reason":"%s{reason}","event_id":"%d{recordid}","protocol":"%s{proto}","action":"%s{action}","transactionsize":"%d{totalsize}","responsesize":"%d{respsize}","requestsize":"%d{reqsize}","urlcategory":"%s{urlcat}","serverip":"%s{sip}","clienttranstime":"%d{ctime}","requestmethod":"%s{reqmethod}","refererURL":"%s{ereferer}","useragent":"%s{ua}","product":"NSS","location":"%s{location}","ClientIP":"%s{cip}","status":"%s{respcode}","user":"%s{login}","url":"%s{eurl}","vendor":"Zscaler","hostname":"%s{ehost}","clientpublicIP":"%s{cintip}","threatcategory":"%s{malwarecat}","threatname":"%s{threatname}","filetype":"%s{filetype}","appname":"%s{appname}","pagerisk":"%d{riskscore}","department":"%s{dept}","urlsupercategory":"%s{urlsupercat}","appclass":"%s{appclass}","dlpengine":"%s{dlpeng}","urlclass":"%s{urlclass}","threatclass":"%s{malwareclass}","dlpdictionaries":"%s{dlpdict}","fileclass":"%s{fileclass}","bwthrottle":"%s{bwthrottle}","servertranstime":"%d{stime}","contenttype":"%s{contenttype}","unscannabletype":"%s{unscannabletype}","deviceowner":"%s{deviceowner}","devicehostname":"%s{devicehostname}"\}\}- Firewall Logs
\{ "sourcetype" : "zscalernss-fw", "event" :\{"datetime":"%s{time}","user":"%s{elogin}","department":"%s{edepartment}","locationname":"%s{elocation}","cdport":"%d{cdport}","csport":"%d{csport}","sdport":"%d{sdport}","ssport":"%d{ssport}","csip":"%s{csip}","cdip":"%s{cdip}","ssip":"%s{ssip}","sdip":"%s{sdip}","tsip":"%s{tsip}","tunsport":"%d{tsport}","tuntype":"%s{ttype}","action":"%s{action}","dnat":"%s{dnat}","stateful":"%s{stateful}","aggregate":"%s{aggregate}","nwsvc":"%s{nwsvc}","nwapp":"%s{nwapp}","proto":"%s{ipproto}","ipcat":"%s{ipcat}","destcountry":"%s{destcountry}","avgduration":"%d{avgduration}","rulelabel":"%s{erulelabel}","inbytes":"%ld{inbytes}","outbytes":"%ld{outbytes}","duration":"%d{duration}","durationms":"%d{durationms}","numsessions":"%d{numsessions}","ipsrulelabel":"%s{ipsrulelabel}","threatcat":"%s{threatcat}","threatname":"%s{ethreatname}","deviceowner":"%s{deviceowner}","devicehostname":"%s{devicehostname}"\}\}- DNS Logs
\{ "sourcetype" : "zscalernss-dns", "event" :\{"datetime":"%s{time}","user":"%s{elogin}","department":"%s{edepartment}","location":"%s{elocation}","reqaction":"%s{reqaction}","resaction":"%s{resaction}","reqrulelabel":"%s{reqrulelabel}","resrulelabel":"%s{resrulelabel}","dns_reqtype":"%s{reqtype}","dns_req":"%s{req}","dns_resp":"%s{res}","srv_dport":"%d{sport}","durationms":"%d{durationms}","clt_sip":"%s{cip}","srv_dip":"%s{sip}","category":"%s{domcat}","respipcategory":"%s{respipcat}","deviceowner":"%s{deviceowner}","devicehostname":"%s{devicehostname}"\}\}- Tunnel Logs (IKE Phase 1)
\{ "sourcetype" : "zscalernss-tunnel", "event" : \{"datetime":"%s{datetime}","Recordtype":"%s{tunnelactionname}","tunneltype":"IPSEC IKEV %d{ikeversion}","user":"%s{vpncredentialname}","location":"%s{elocationname}","sourceip":"%s{sourceip}","destinationip":"%s{destvip}","sourceport":"%d{srcport}","destinationport":"%d{dstport}","lifetime":"%d{lifetime}","ikeversion":"%d{ikeversion}","spi_in":"%lu{spi_in}","spi_out":"%lu{spi_out}","algo":"%s{algo}","authentication":"%s{authentication}","authtype":"%s{authtype}","recordid":"%d{recordid}"\}\}- Tunnel Logs (IKE Phase 2)
\{ "sourcetype" : "zscalernss-tunnel", "event" : \{"datetime":"%s{datetime}","Recordtype":"%s{tunnelactionname}","tunneltype":"IPSEC IKEV %d{ikeversion}","user":"%s{vpncredentialname}","location":"%s{elocationname}","sourceip":"%s{sourceip}","destinationip":"%s{destvip}","sourceport":"%d{srcport}","sourceportstart":"%d{srcportstart}","destinationportstart":"%d{destportstart}","srcipstart":"%s{srcipstart}","srcipend":"%s{srcipend}","destinationipstart":"%s{destipstart}","destinationipend":"%s{destipend}","lifetime":"%d{lifetime}","ikeversion":"%d{ikeversion}","lifebytes":"%d{lifebytes}","spi":"%d{spi}","algo":"%s{algo}","authentication":"%s{authentication}","authtype":"%s{authtype}","protocol":"%s{protocol}","tunnelprotocol":"%s{tunnelprotocol}","policydirection":"%s{policydirection}","recordid":"%d{recordid}"\}\}- Tunnel Logs (Tunnel Event)
\{ "sourcetype" : "zscalernss-tunnel", "event" : \{"datetime":"%s{datetime}","Recordtype":"%s{tunnelactionname}","tunneltype":"%s{tunneltype}","user":"%s{vpncredentialname}","location":"%s{elocationname}","sourceip":"%s{sourceip}","destinationip":"%s{destvip}","sourceport":"%d{srcport}","event":"%s{event}","eventreason":"%s{eventreason}","recordid":"%d{recordid}"\}\} - Duplicate Logs. Disabled by default.
- Timezone. Set to GMT by default.
- Click Save.
Install the Zscaler Internet Access app
To install the app, do the following:
Next-Gen App: To install or update the app, you must be an account administrator or a user with Manage Apps, Manage Monitors, Manage Fields, Manage Metric Rules, and Manage Collectors capabilities depending upon the different content types part of the app.
- Select App Catalog.
- In the 🔎 Search Apps field, run a search for your desired app, then select it.
- Click Install App.
note
Sometimes this button says Add Integration.
- Click Next in the Setup Data section.
- In the Configure section of your respective app, complete the following fields.
- Field Name. If you already have collectors and sources set up, select the configured metadata field name (eg _sourcecategory) or specify other custom metadata (eg: _collector) along with its metadata Field Value.
- Click Next. You will be redirected to the Preview & Done section.
Post-installation
Once your app is installed, it will appear in your Installed Apps folder, and dashboard panels will start to fill automatically.
Each panel slowly fills with data matching the time range query received since the panel was created. Results will not immediately be available but will be updated with full graphs and charts over time.
Viewing Zscaler Internet Access dashboards
All dashboards have a set of filters that you can apply to the entire dashboard. Use these filters to drill down and examine the data to a granular level.
- You can change the time range for a dashboard or panel by selecting a predefined interval from a drop-down list, choosing a recently used time range, or specifying custom dates and times. Learn more.
- You can use template variables to drill down and examine the data on a granular level. For more information, see Filtering Dashboards with Template Variables.
- Most Next-Gen apps allow you to provide the scope at the installation time and are comprised of a key (
_sourceCategoryby default) and a default value for this key. Based on your input, the app dashboards will be parameterized with a dashboard variable, allowing you to change the dataset queried by all panels. This eliminates the need to create multiple copies of the same dashboard with different queries.
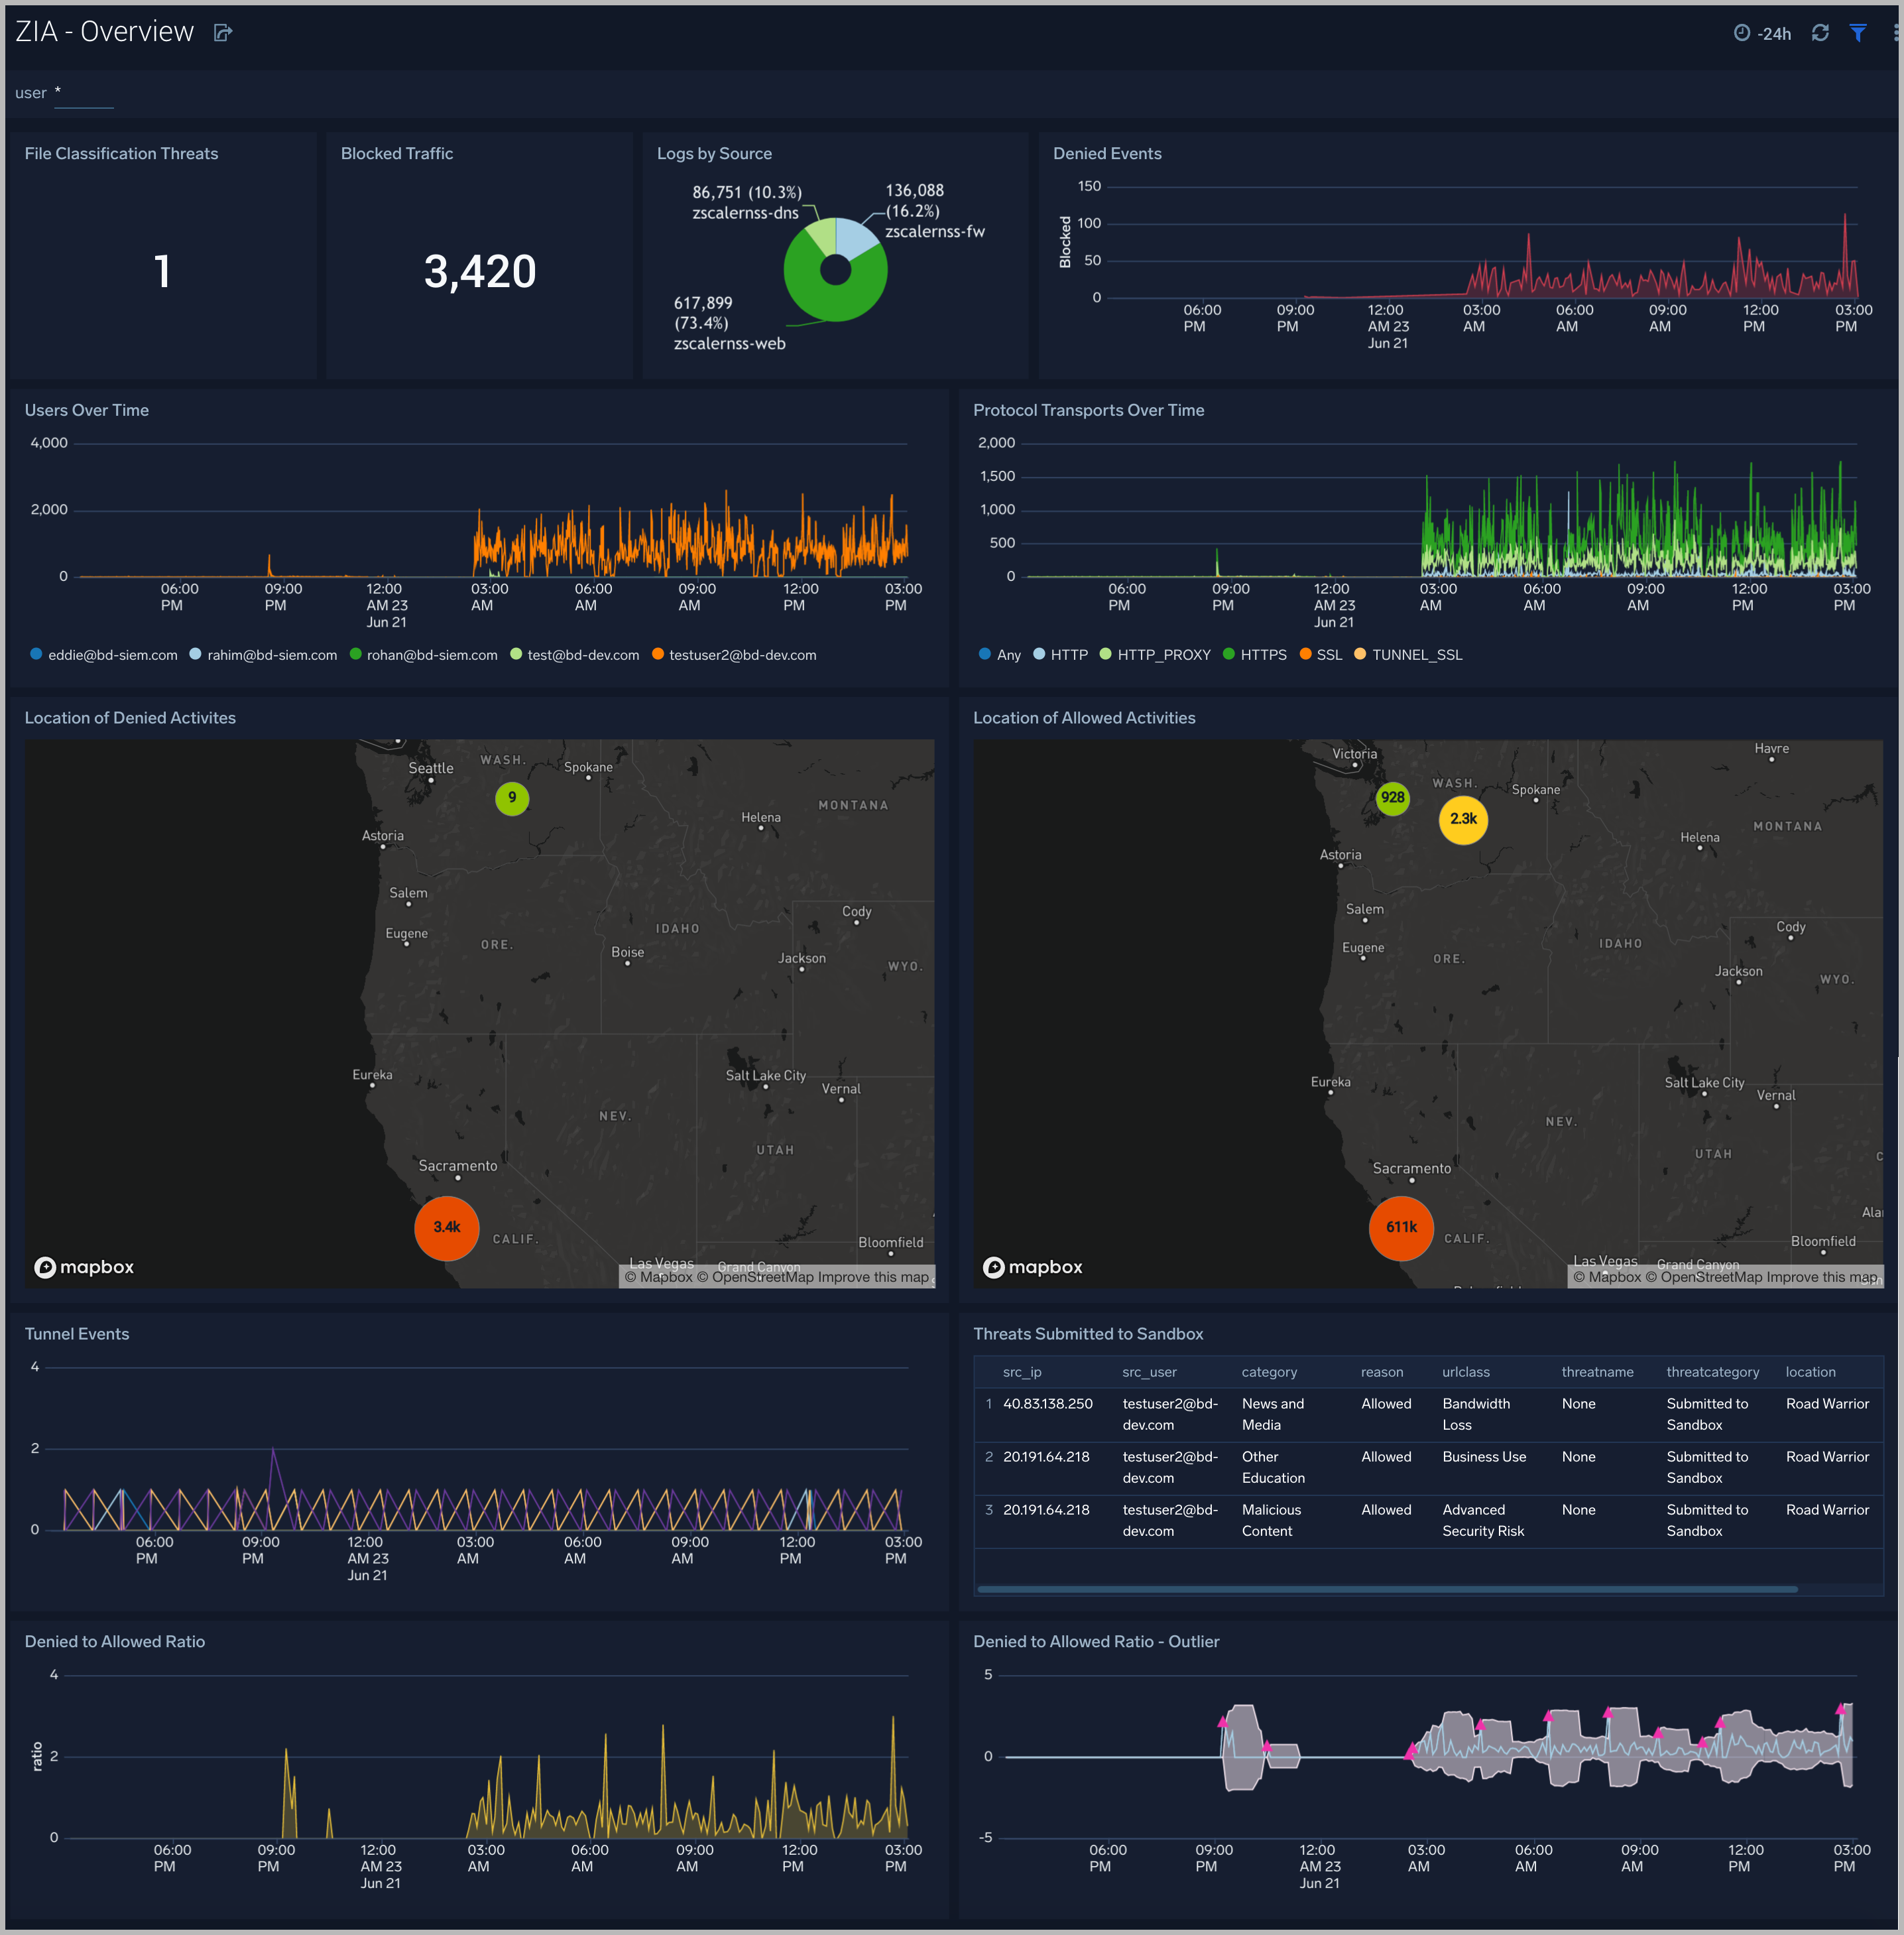
Overview
The Zscaler - Overview dashboard provides general information of the Zscaler Web Gateway logs, including Panels that drill-down into the other Zscaler Dashboards. The Overview Dashboard gives a good starting point for detecting anomalies in blocked traffic and geographic hotspots for allowed and blocked traffic.
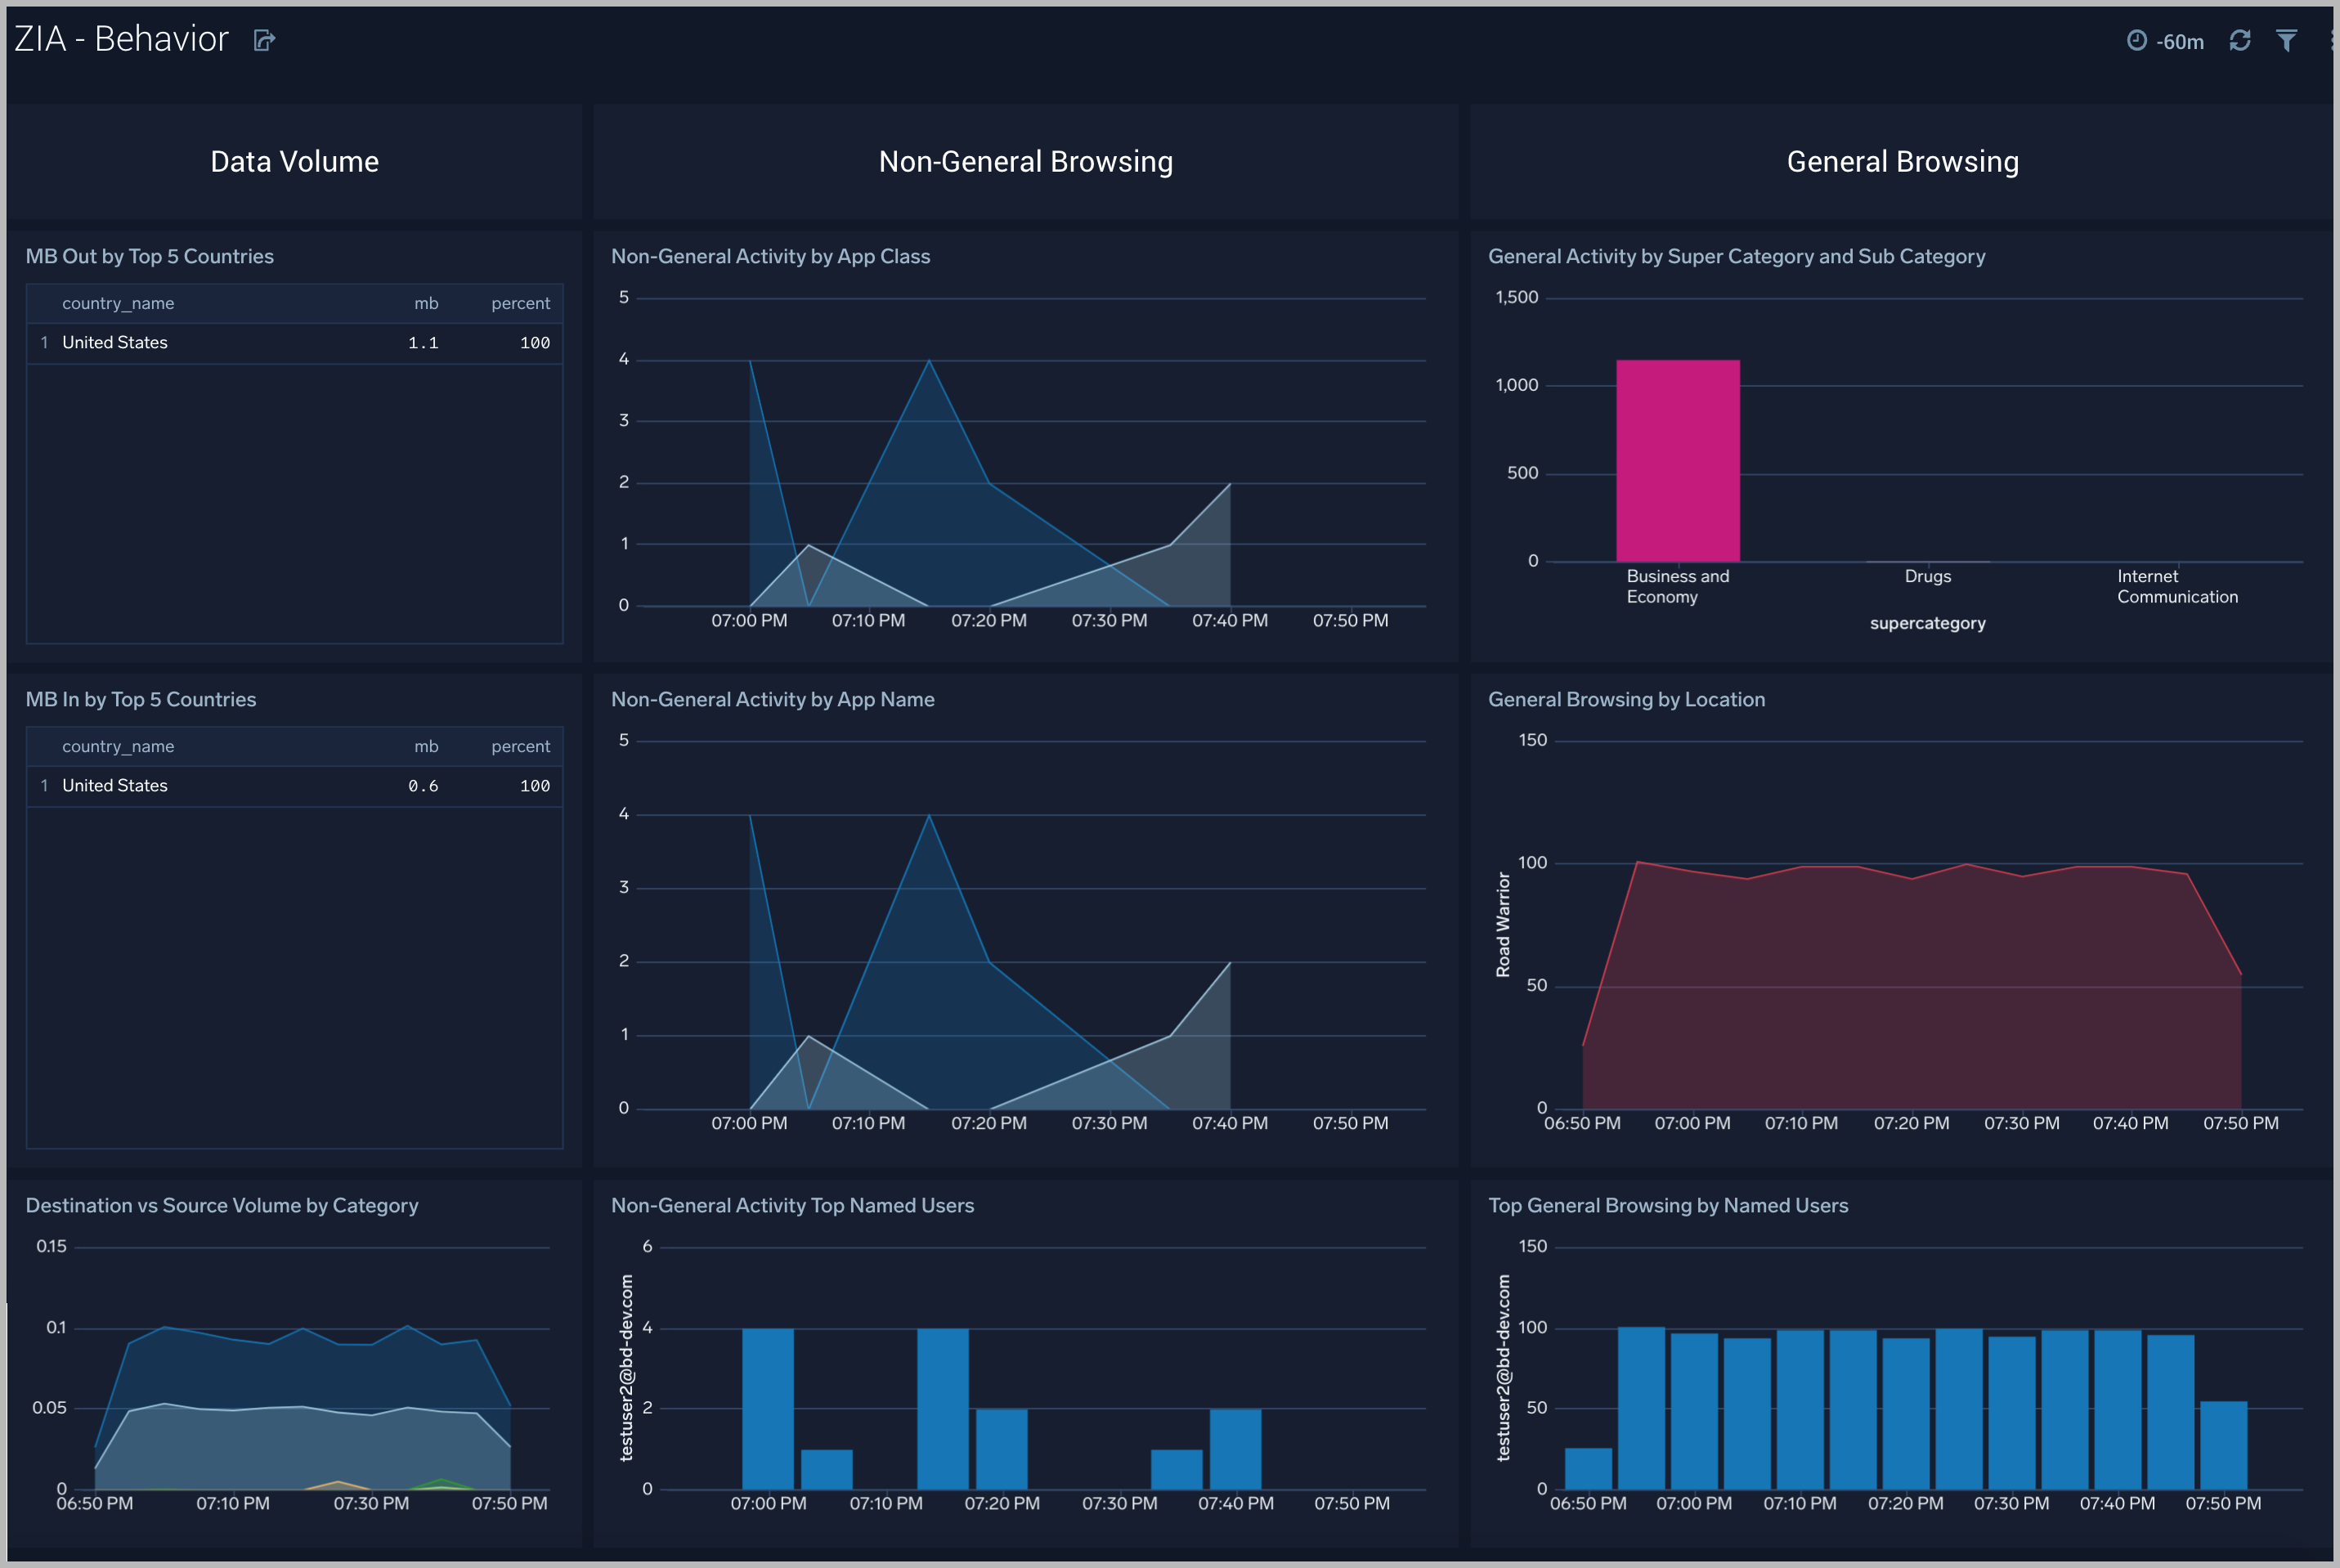
Behavior
The Zscaler - Behavior dashboard focuses on allowed traffic behaviors, showing trends and deviations by users, content types accessed, content categories, super categories, and bandwidth trends.
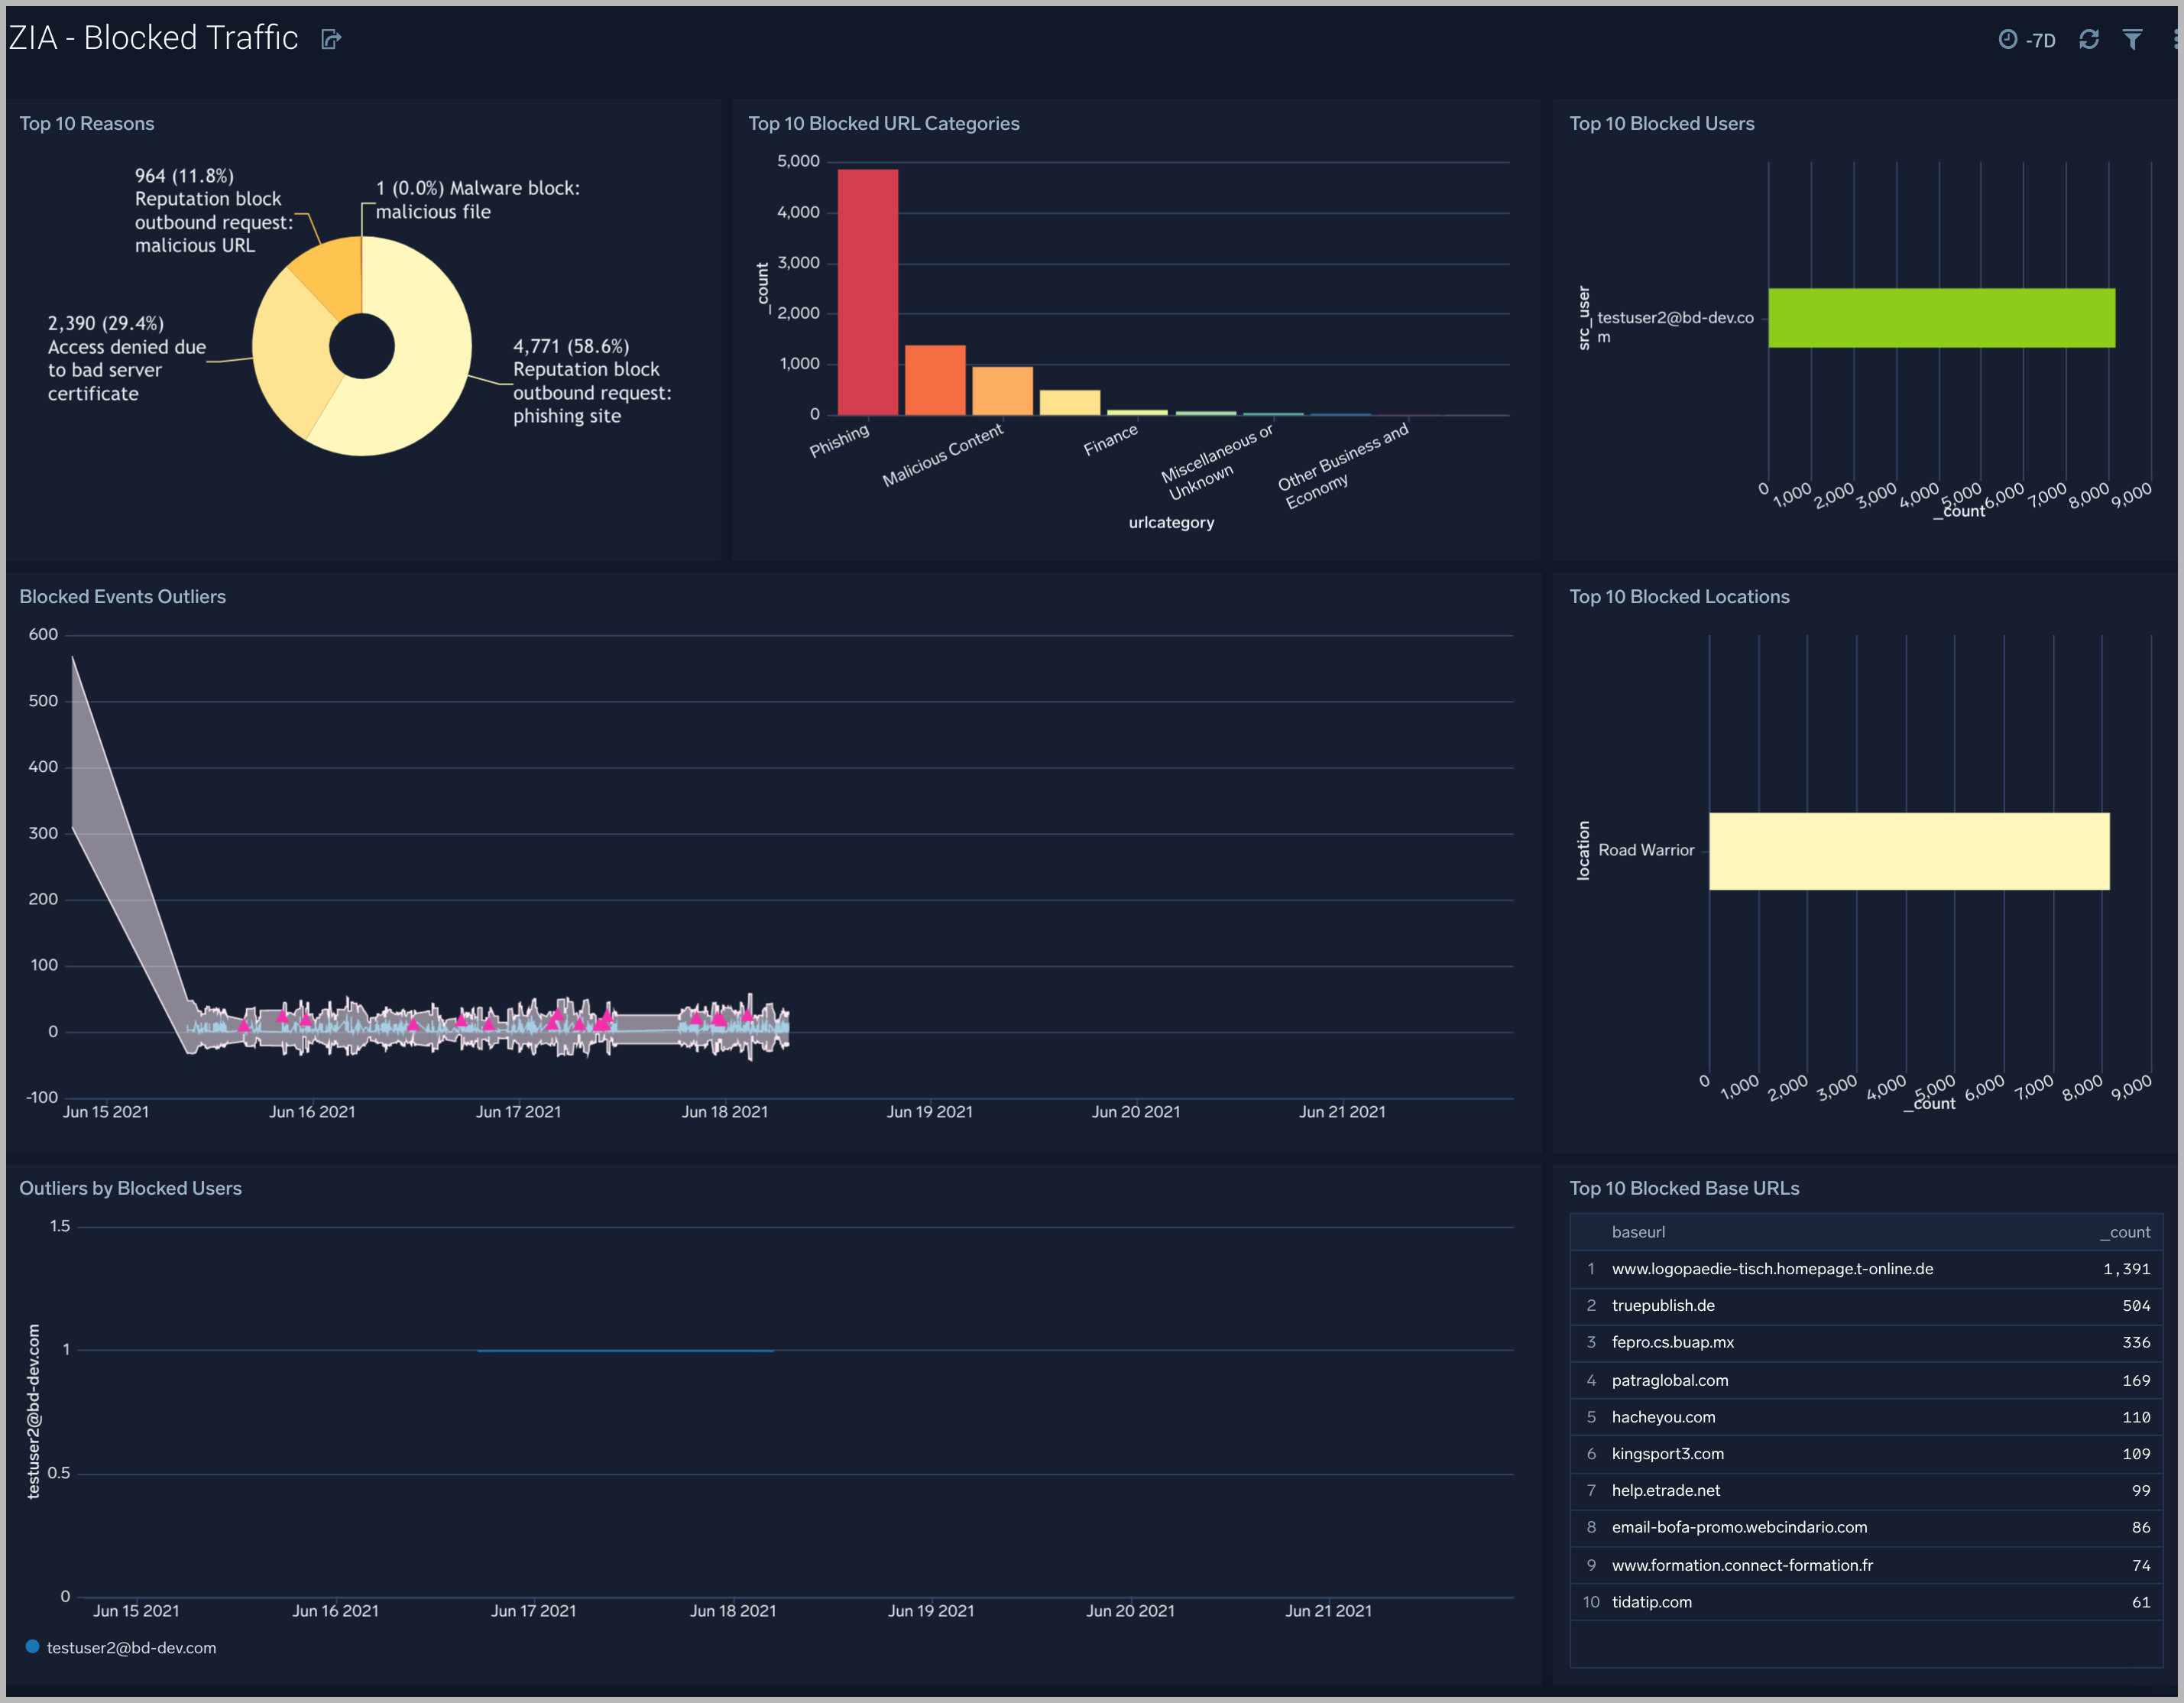
Blocked Traffic
The Zscaler - Blocked Traffic dashboard illustrates outliers in both blocked traffic peaks and multi-dimensional outliers for blocked activity specific to user.
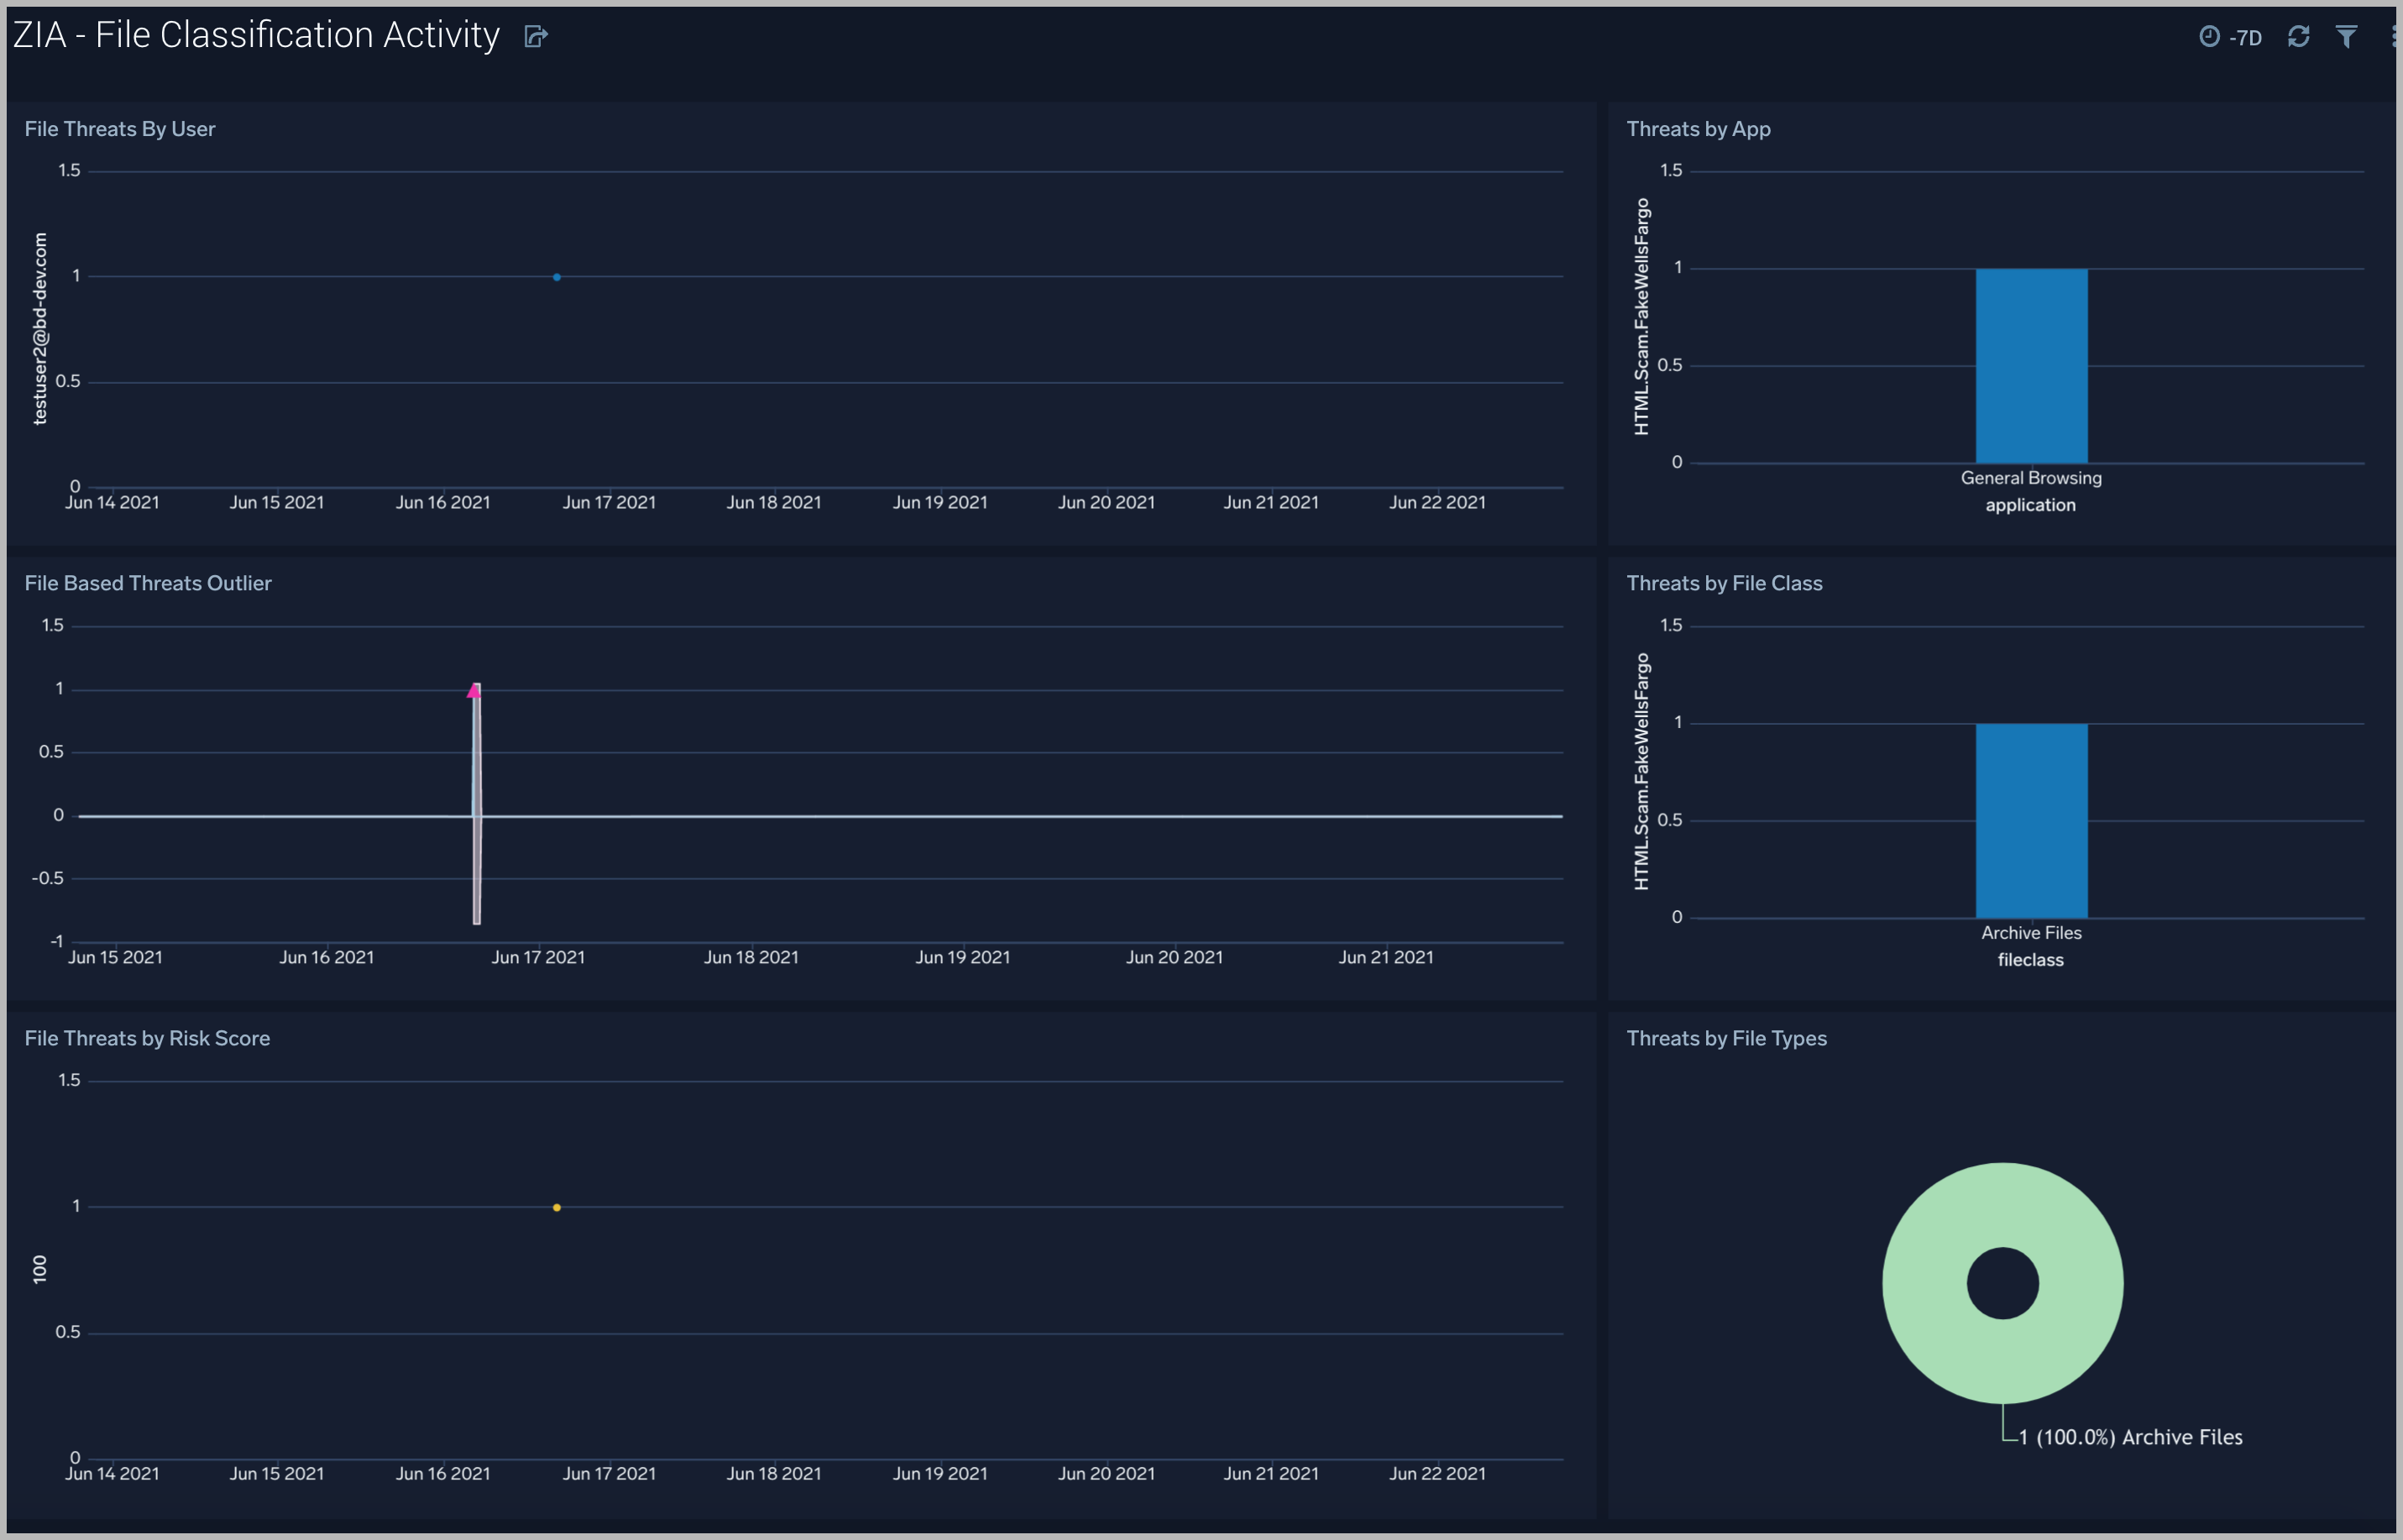
File Classification Activity
The Zscaler - File Classification Activity dashboard focuses on file-based threats by users, threat name, file types, and subtypes for a overarching view of blocked files across the Zscaler environment.
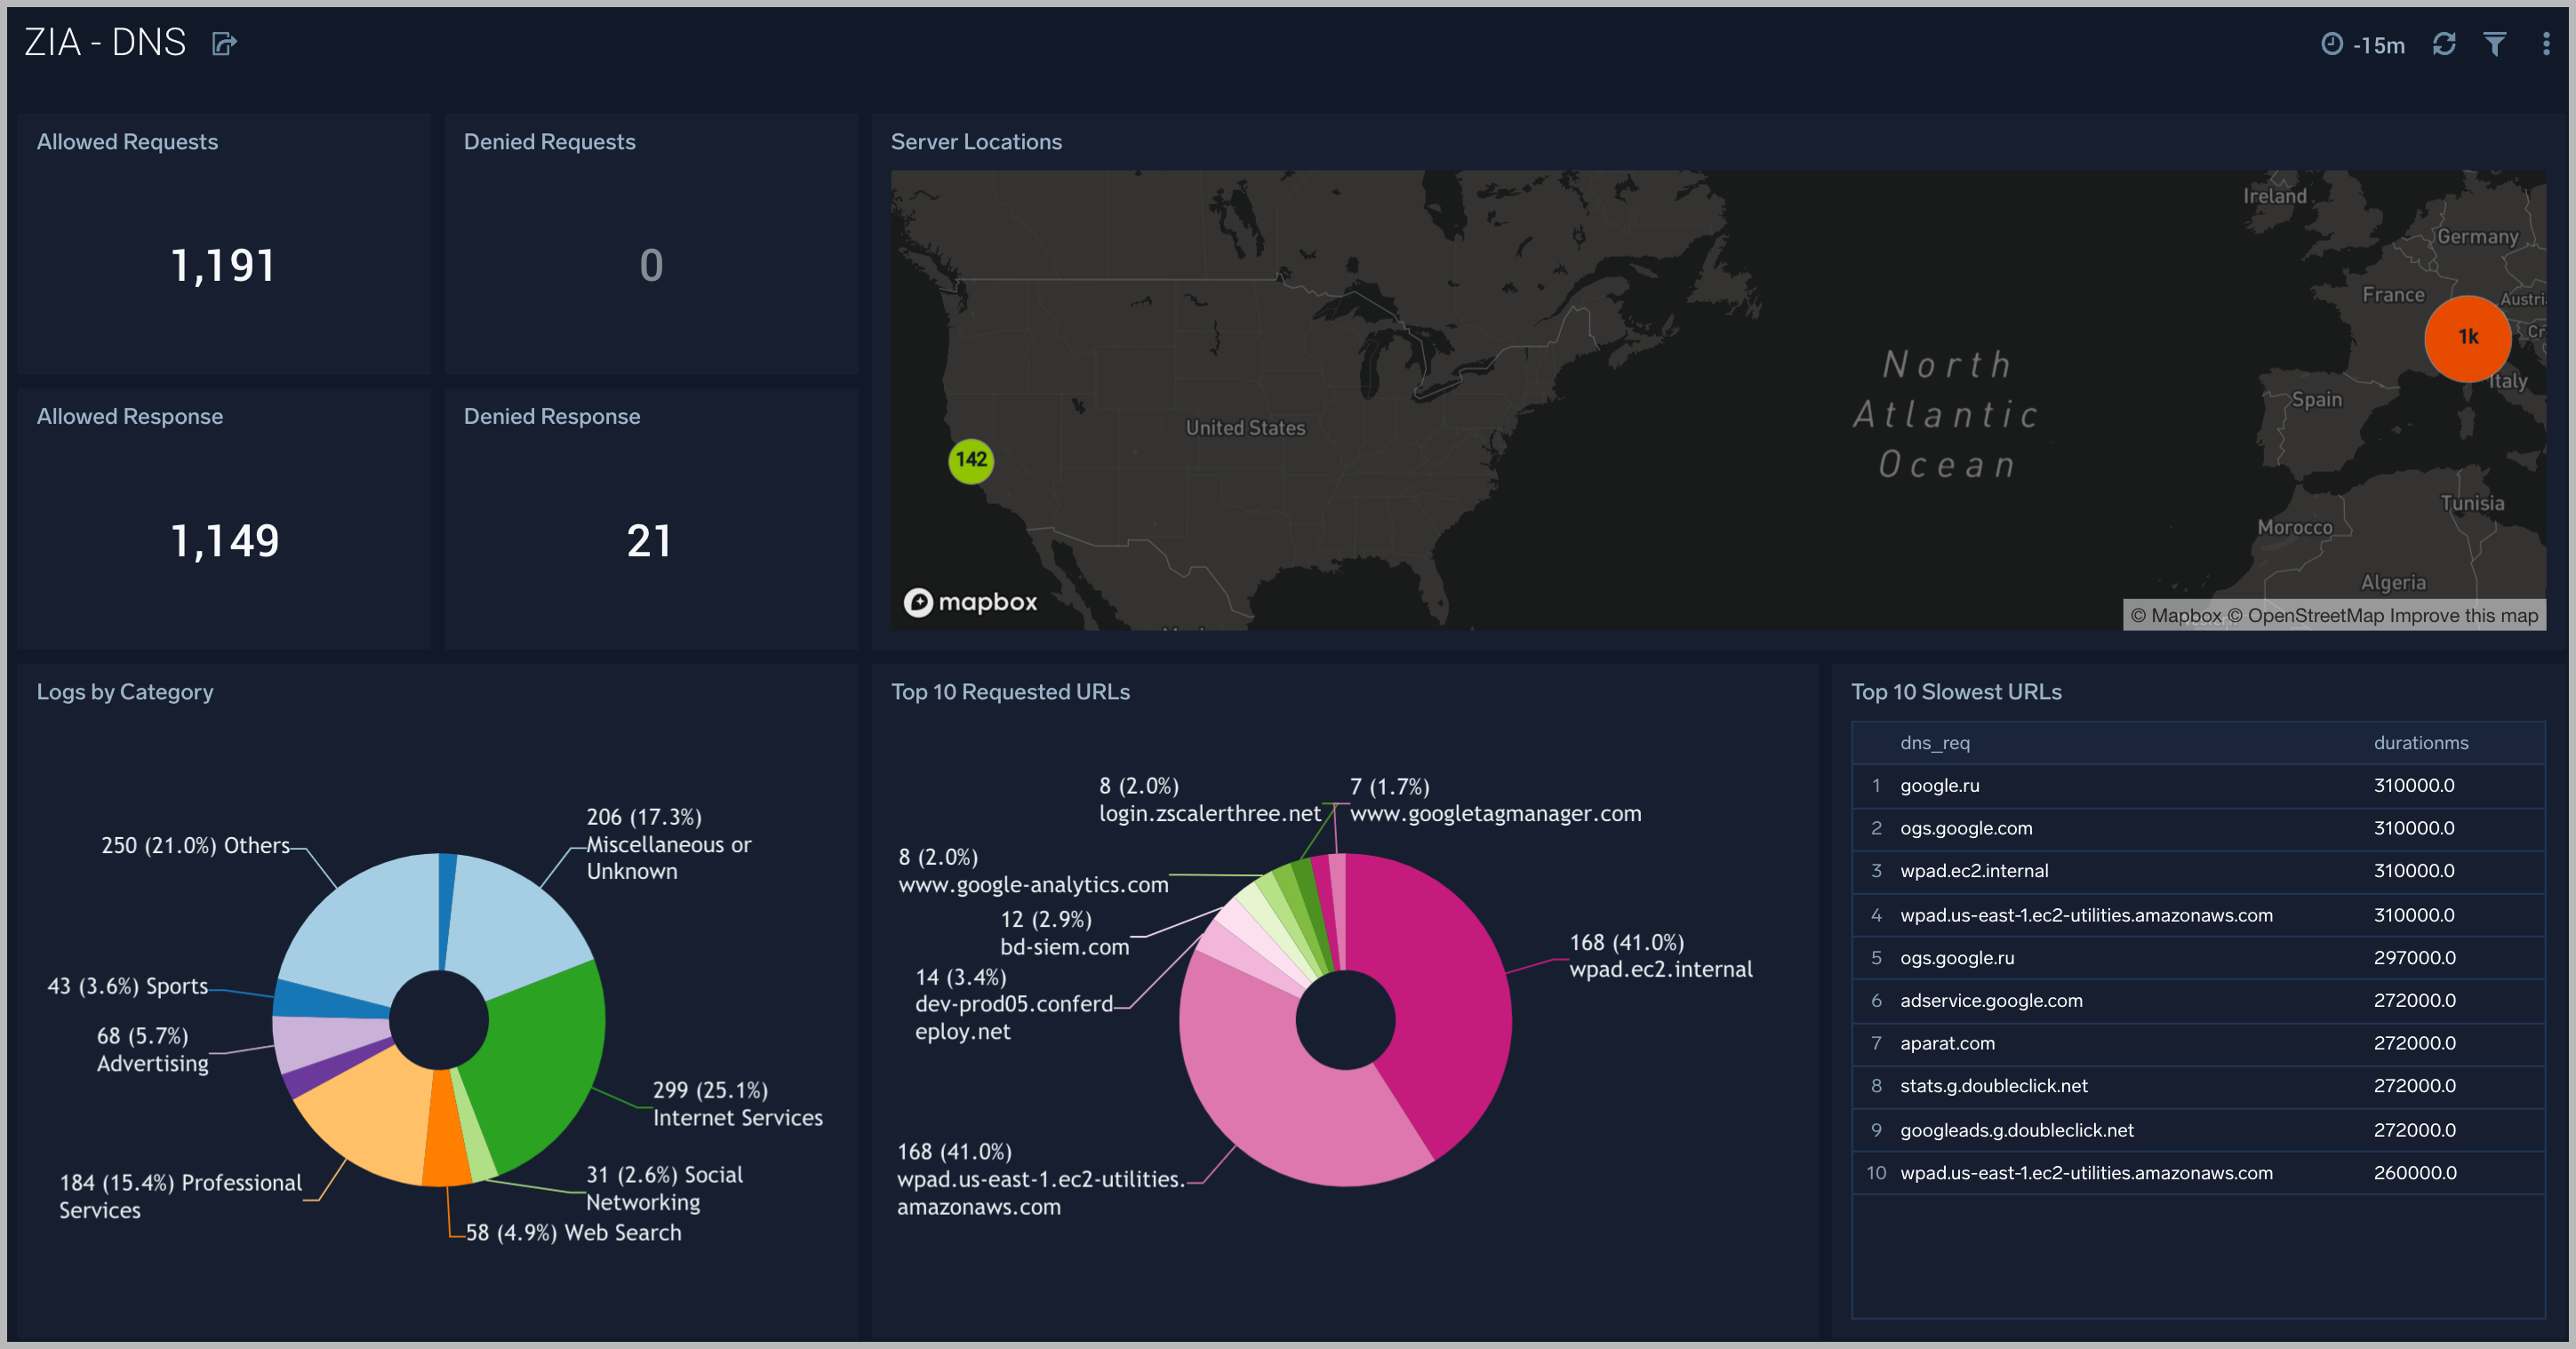
DNS
The ZIA - DNS dashboard focuses on DNS activity specifically around denied requests and responses, server locations across the Zscaler environment.
Use this dashboard to:
- Gain insights into DNS health and performance.
- Determine if rules need tweaking based on volume of denied/allowed requests and responses.
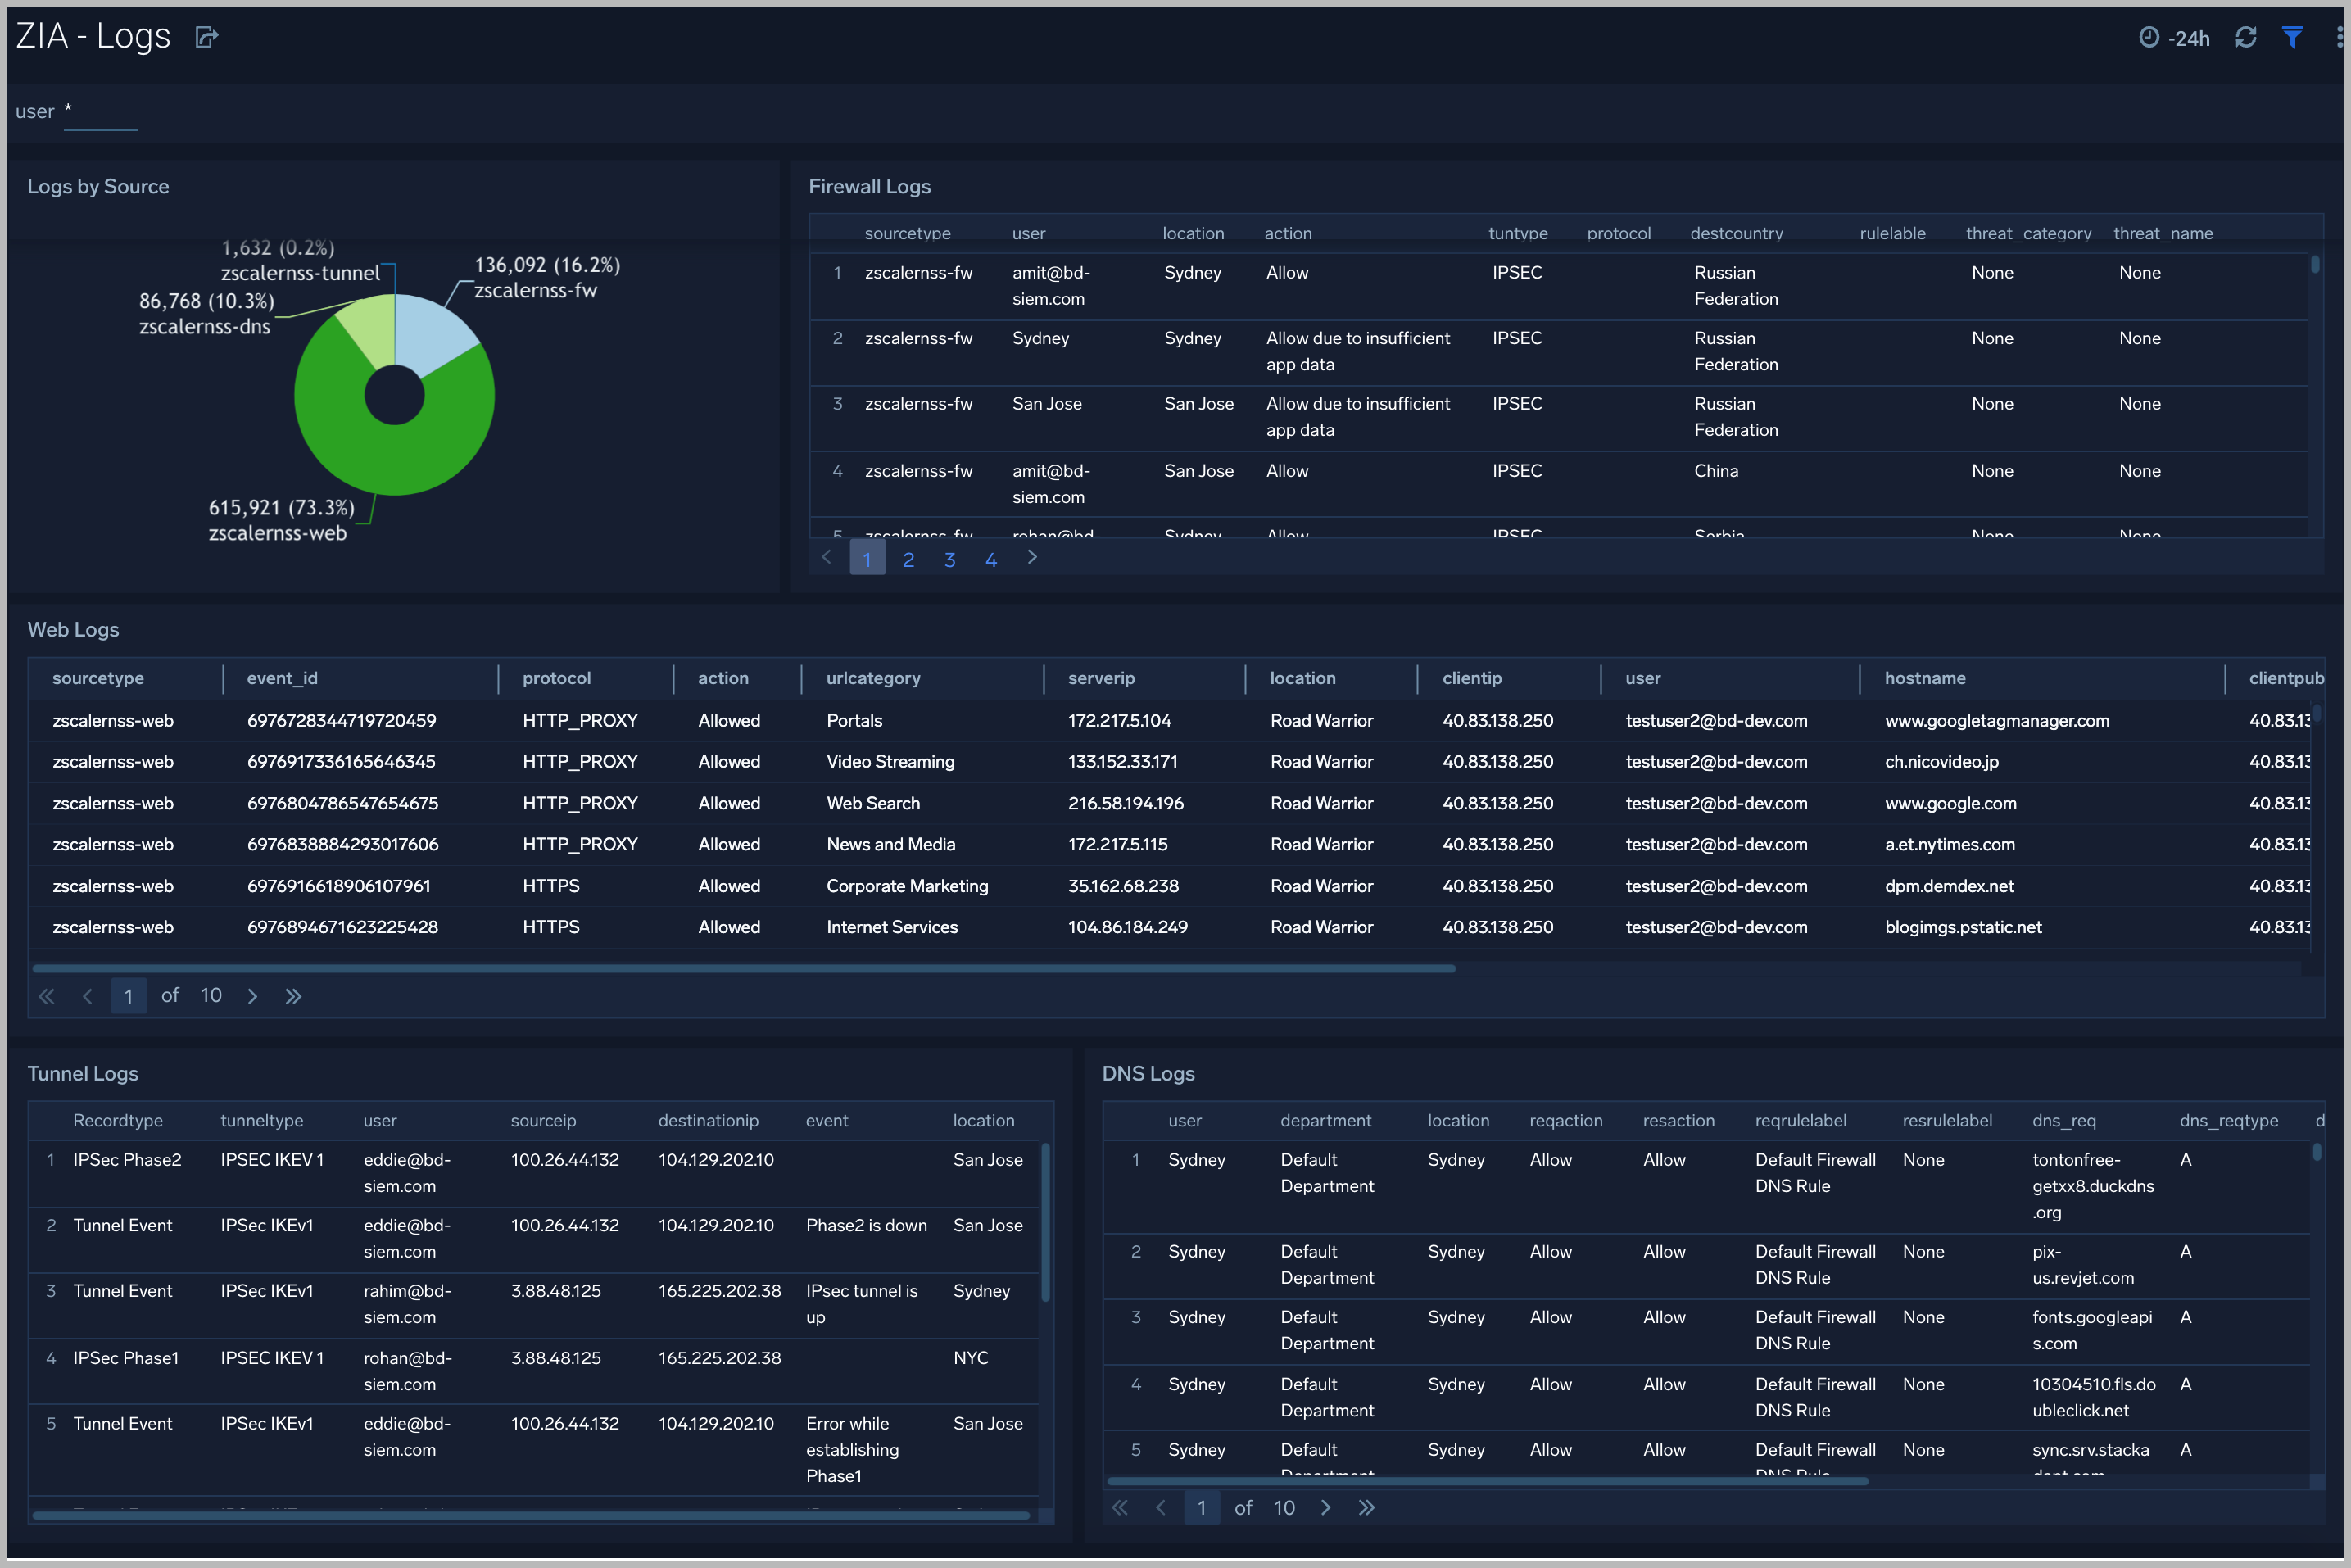
Logs
The ZIA - Logs dashboard gives insights into different logs being produced in the Zscaler environment.
Use this dashboard to:
- Get quick insights into logs volume by source.
- View logs filtered by type and users and determine any potential issues.
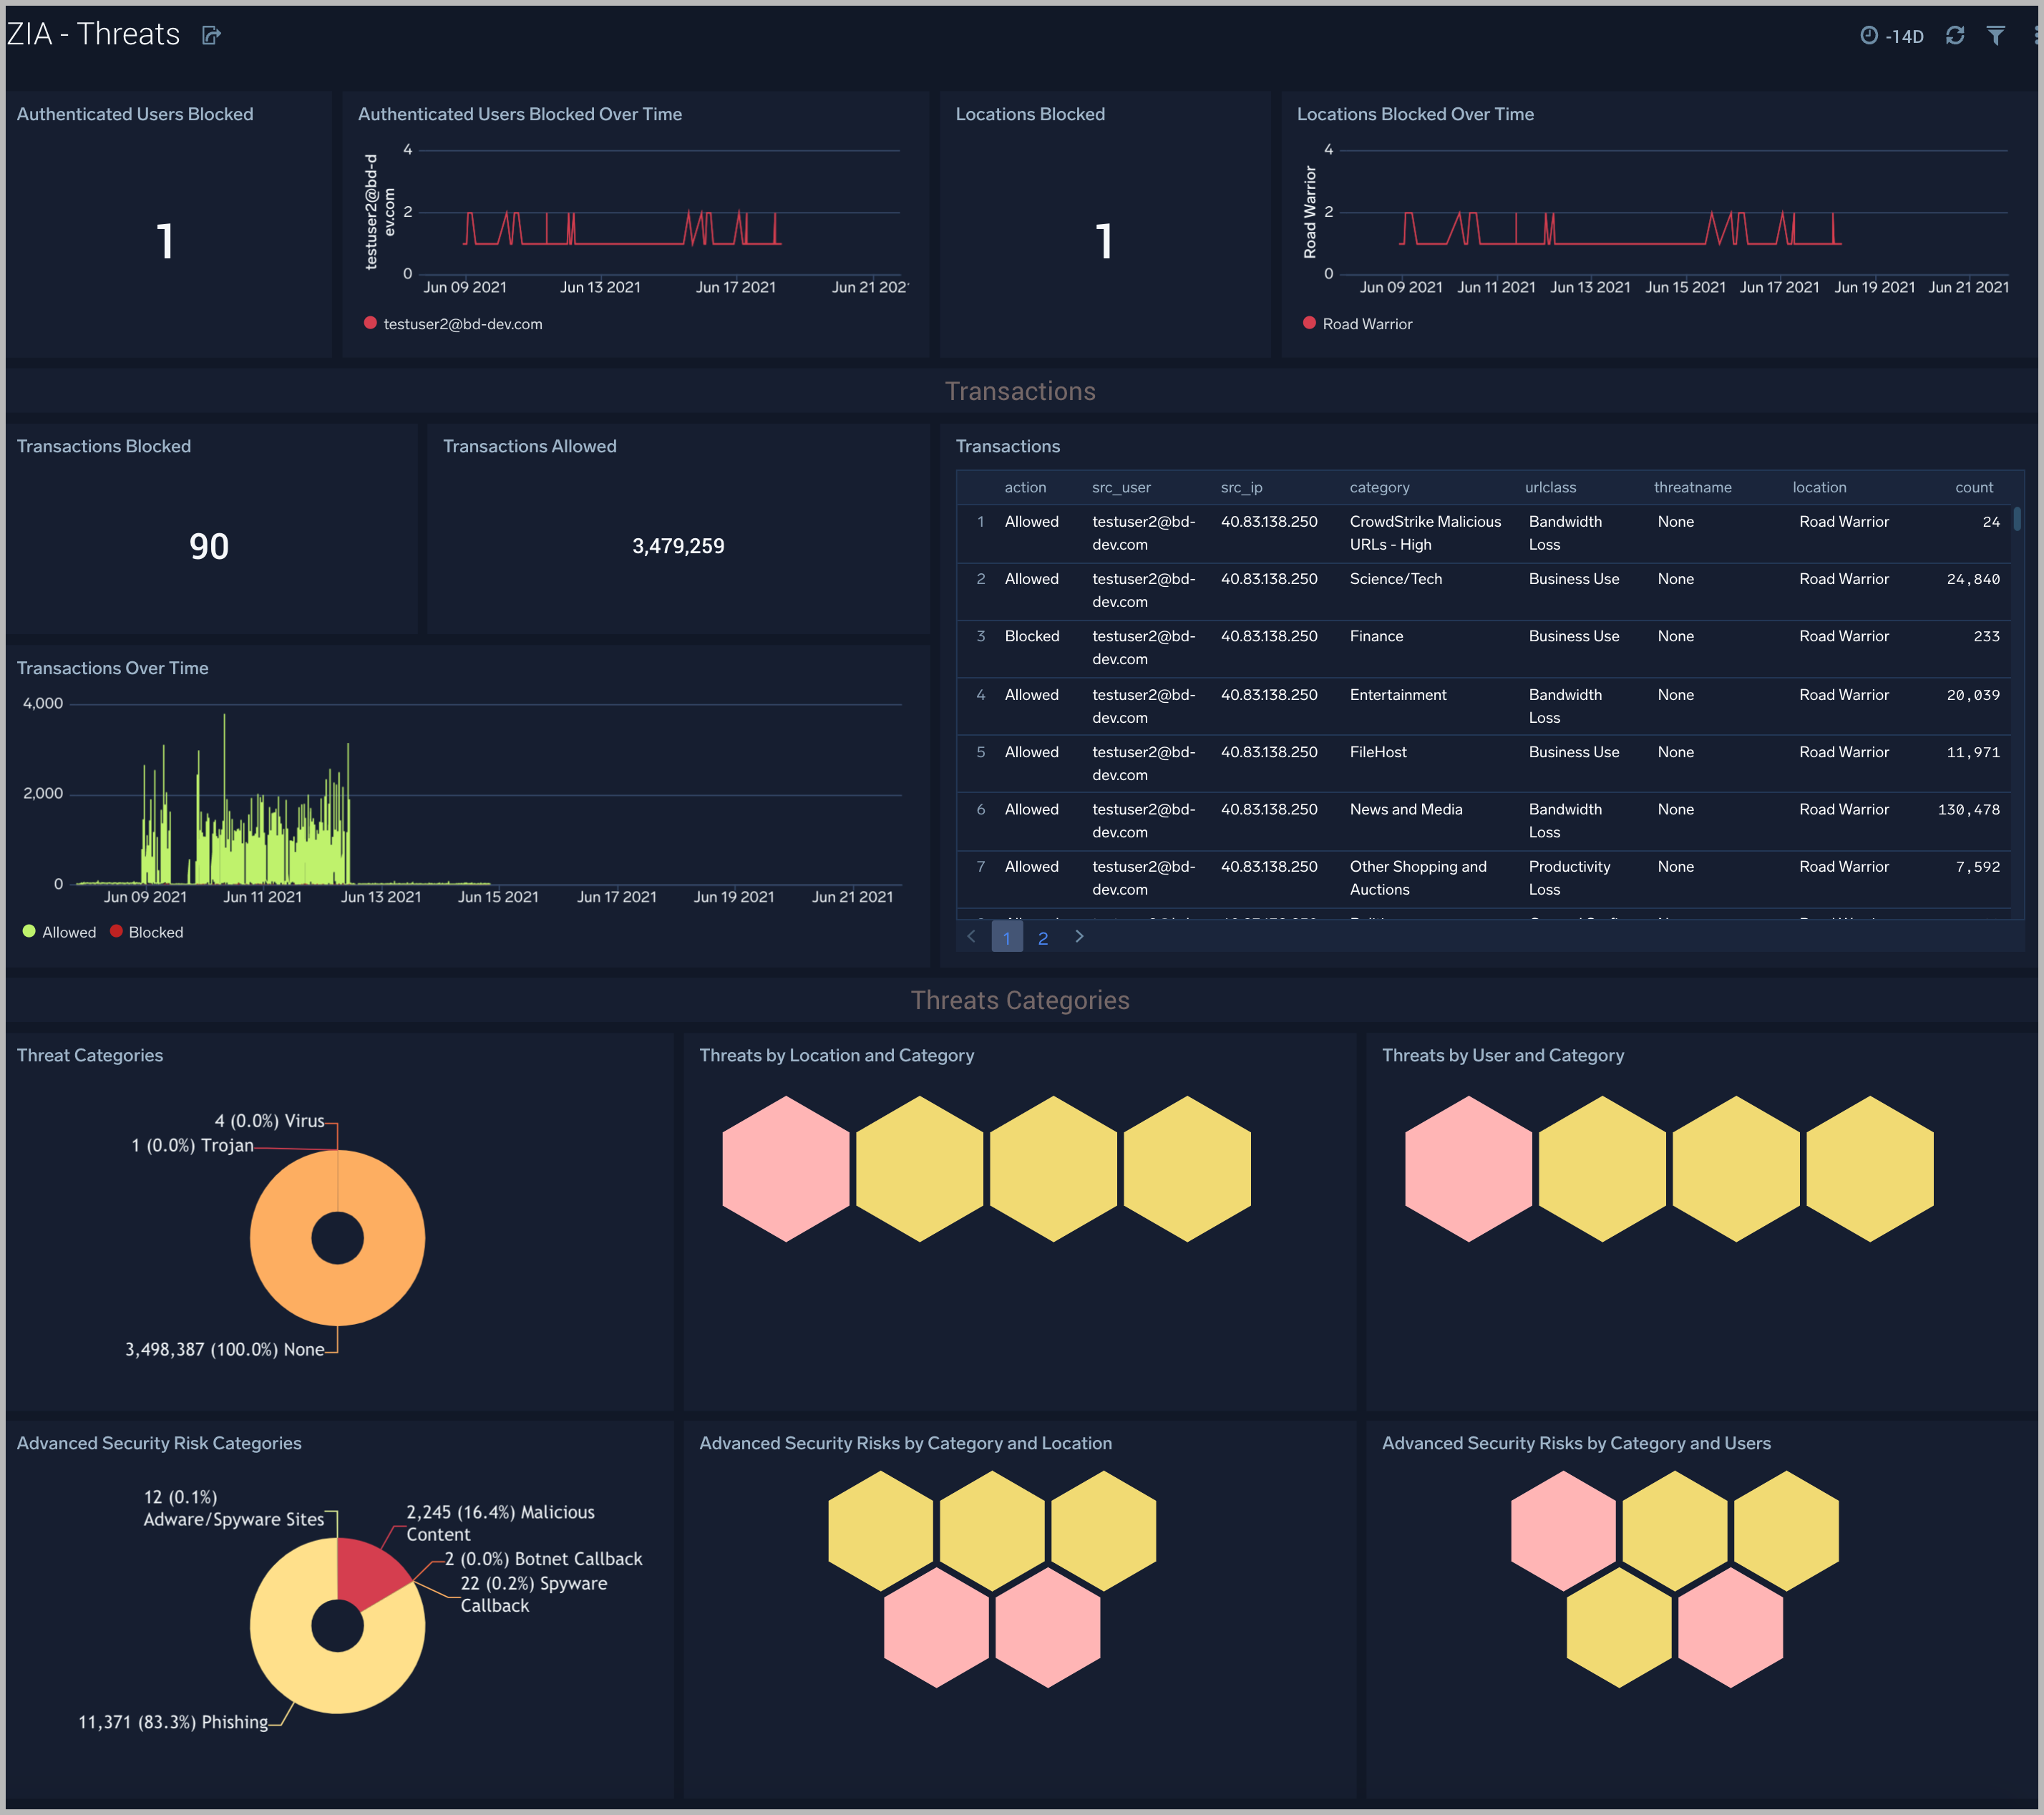
Threats
The ZIA - Threats dashboard focuses on threats in your Zscaler environment.
Use this dashboard to:
- Detect anomalies in blocked traffic and geographic hotspots for allowed and blocked traffic.
- Gain insights into threats by categories and transactions.
- Identify locations and users being blocked as a sign of potential suspicious or malicious activity.
Upgrade/Downgrade the Zscaler Internet Access app (Optional)
To update the app, do the following:
Next-Gen App: To install or update the app, you must be an account administrator or a user with Manage Apps, Manage Monitors, Manage Fields, Manage Metric Rules, and Manage Collectors capabilities depending upon the different content types part of the app.
- Select App Catalog.
- In the Search Apps field, search for and then select your app.
Optionally, you can identify apps that can be upgraded in the Upgrade available section. - To upgrade the app, select Upgrade from the Manage dropdown.
- If the upgrade does not have any configuration or property changes, you will be redirected to the Preview & Done section.
- If the upgrade has any configuration or property changes, you will be redirected to the Setup Data page.
- In the Configure section of your respective app, complete the following fields.
- Field Name. If you already have collectors and sources set up, select the configured metadata field name (eg _sourcecategory) or specify other custom metadata (eg: _collector) along with its metadata Field Value.
- Click Next. You will be redirected to the Preview & Done section.
Post-update
Your upgraded app will be installed in the Installed Apps folder and dashboard panels will start to fill automatically.
See our Release Notes changelog for new updates in the app.
To revert the app to a previous version, do the following:
- Select App Catalog.
- In the Search Apps field, search for and then select your app.
- To version down the app, select Revert to < previous version of your app > from the Manage dropdown.
Uninstalling the Zscaler Internet Access app (Optional)
To uninstall the app, do the following:
- Select App Catalog.
- In the 🔎 Search Apps field, run a search for your desired app, then select it.
- Click Uninstall.