Enterprise Audit - Cloud SIEM
The Enterprise Audit - Cloud SIEM app gives you visibility into what’s going on in Cloud SIEM. The app dashboards present high-level and detailed views into the records that were created, the signals that have fired, and the insights generated by Cloud SIEM. You can also get insight in Cloud SIEM rules, including rule management activity, and which rules have fired.
Watch this micro lesson to learn more about the Enterprise Audit - Cloud SIEM app.
Log types
The Enterprise Audit - Cloud SIEM App relies on data that is already available in Sumo Logic, so you don’t need to configure data collection.
Cloud SIEM records
Cloud SIEM records are stored in the following Sumo Logic partitions:
sec_record_auditsec_record_authenticationsec_record_emailsec_record_endpointsec_record_failuresec_record_networksec_record_notification
Cloud SIEM signals
Cloud SIEM signals are stored in the following partition:
sec_signal
Cloud SIEM insights
Cloud SIEM insight activity is written to these Audit Event Index partitions:
sumologic_audit_events. User actions performed on insights.sumologic_system_events. System actions performed on insights.
Insight event logging written to either of the partitions above is assigned the source category cseinsight.
Note that the Audit Event Index contains logs for a variety of Sumo Logic subsystems, so when searching either partition for insights, include the source category in your search scope. For more information, see Cloud SIEM Audit Logging.
Install the Enterprise Audit - Cloud SIEM app
Install and configure Cloud SIEM
The Enterprise Audit - Cloud SIEM app provides data on your Cloud SIEM installation. Therefore, before you can install the app, you must install and configure Cloud SIEM. See Onboarding Checklist for Cloud SIEM Administrators for an overview.
Most importantly, before you can see data in the app dashboards, you must have already set up data ingestion to Cloud SIEM. See Cloud SIEM Ingestion Best Practices for an introduction.
Install the Enterprise Audit - Cloud SIEM app
To install the app:
- Ensure Cloud SIEM is installed and is receiving collected data.
- Select App Catalog.
- In the Search Apps field, search for and then select the Enterprise Audit - Cloud SIEM app.
- Click Install App.
- Click Next. The app installs.
- Look for the dialog confirming that your app was installed successfully.
Dashboard panels will automatically start to fill with data matching the time range query received since you installed the app. Results won't be available immediately, but within about 20 minutes, you'll see completed graphs and maps.
View the app in the Installed Apps folder
Once the app is installed, it will appear in the Installed Apps folder of your library. From there, you can share the app with other users in your organization.
Subfolders under the app
Dashboards for the app are organized in subfolders:
- Health Monitoring. Dashboards monitoring the health of your Cloud SIEM parsing, mapping, and rules.
- Insight Analysis. Dashboards analyzing Cloud SIEM insights in the system.
- Record Analysis. Dashboards analyzing the records collected for use in signals.
- Signal Analysis. Dashboards analyzing the signals used to generate insights.
- SOC Analysis. Dashboards useful for security operations center (SOC) analysts.
Example queries
The Enterprise Audit - Cloud SIEM folder in the library not only contains dashboards, but also example queries that you can use to work with Cloud SIEM data. For example, the SOC Analysis folder contains the Scheduled View Threat Hunting query that you can use to create a new scheduled view for queries over large time windows.
Viewing the Enterprise Audit - Cloud SIEM app dashboards
All dashboards have a set of filters that you can apply to the entire dashboard. Use these filters to drill down and examine the data to a granular level.
- You can change the time range for a dashboard or panel by selecting a predefined interval from a drop-down list, choosing a recently used time range, or specifying custom dates and times. Learn more.
- You can use template variables to drill down and examine the data on a granular level. For more information, see Filtering Dashboards with Template Variables.
- Most Next-Gen apps allow you to provide the scope at the installation time and are comprised of a key (
_sourceCategoryby default) and a default value for this key. Based on your input, the app dashboards will be parameterized with a dashboard variable, allowing you to change the dataset queried by all panels. This eliminates the need to create multiple copies of the same dashboard with different queries.
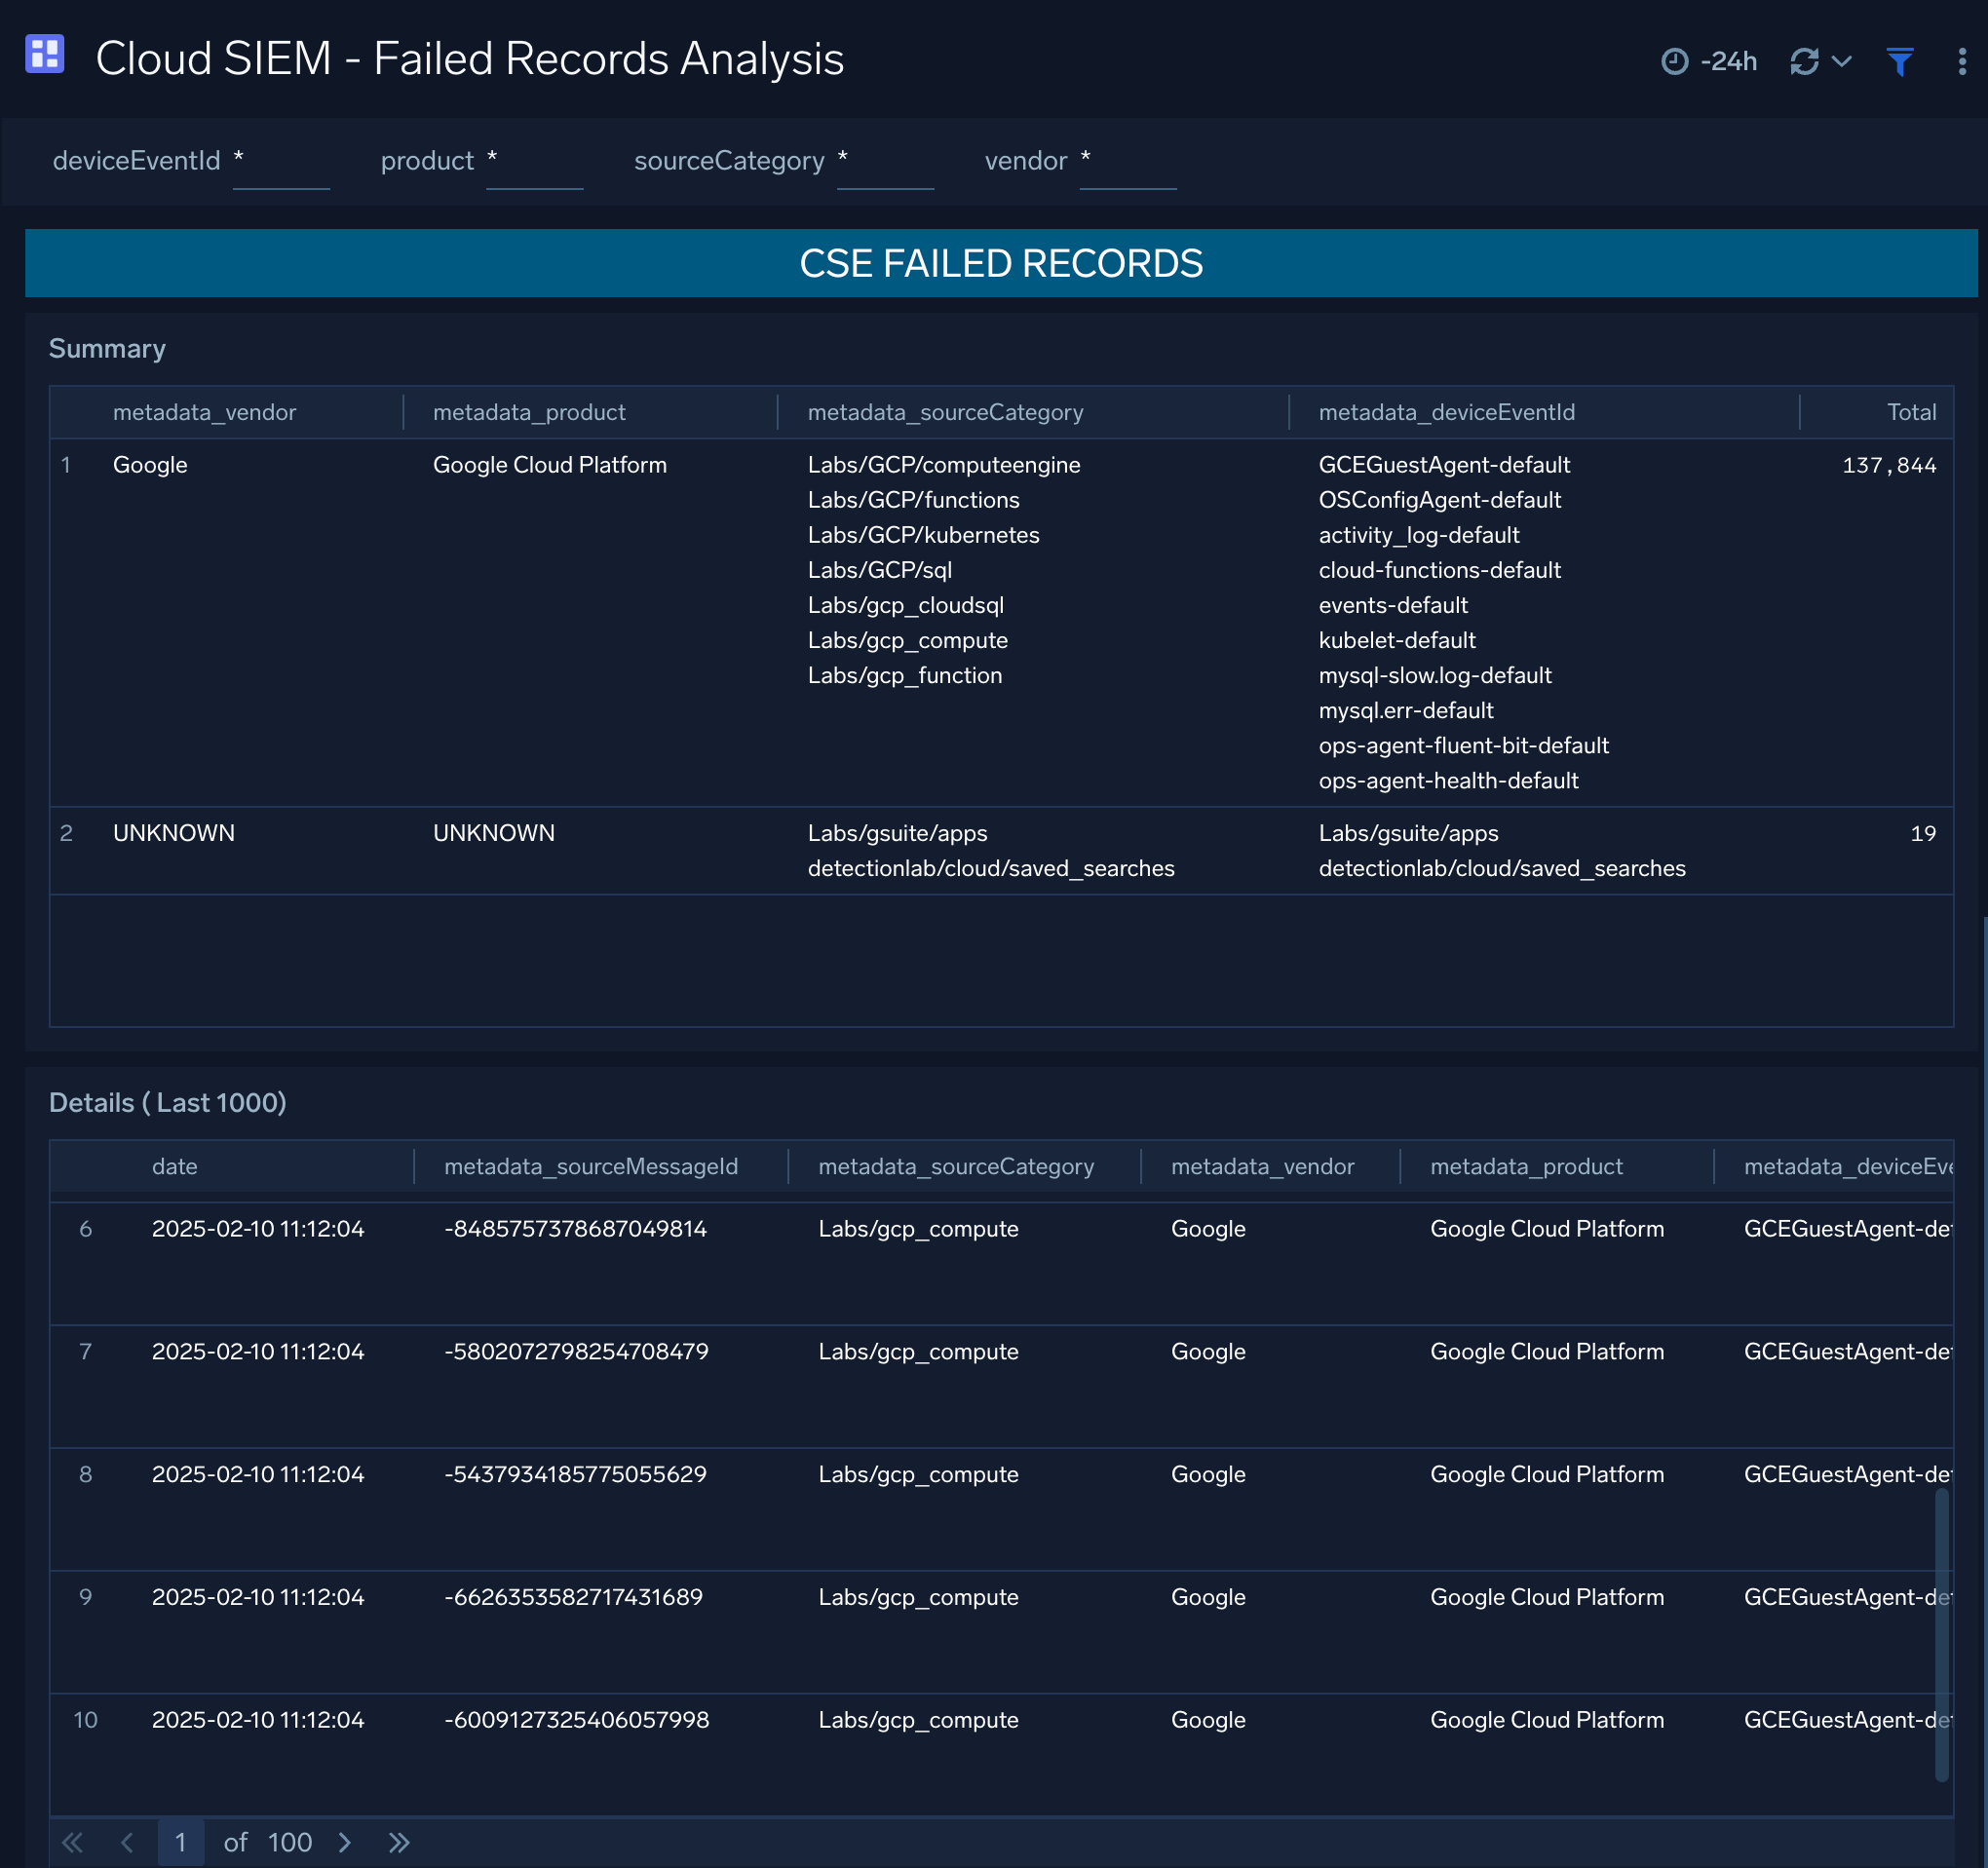
Cloud SIEM - Failed Records Analysis
The Cloud SIEM - Failed Records Analysis dashboard provides a summary of failed records.
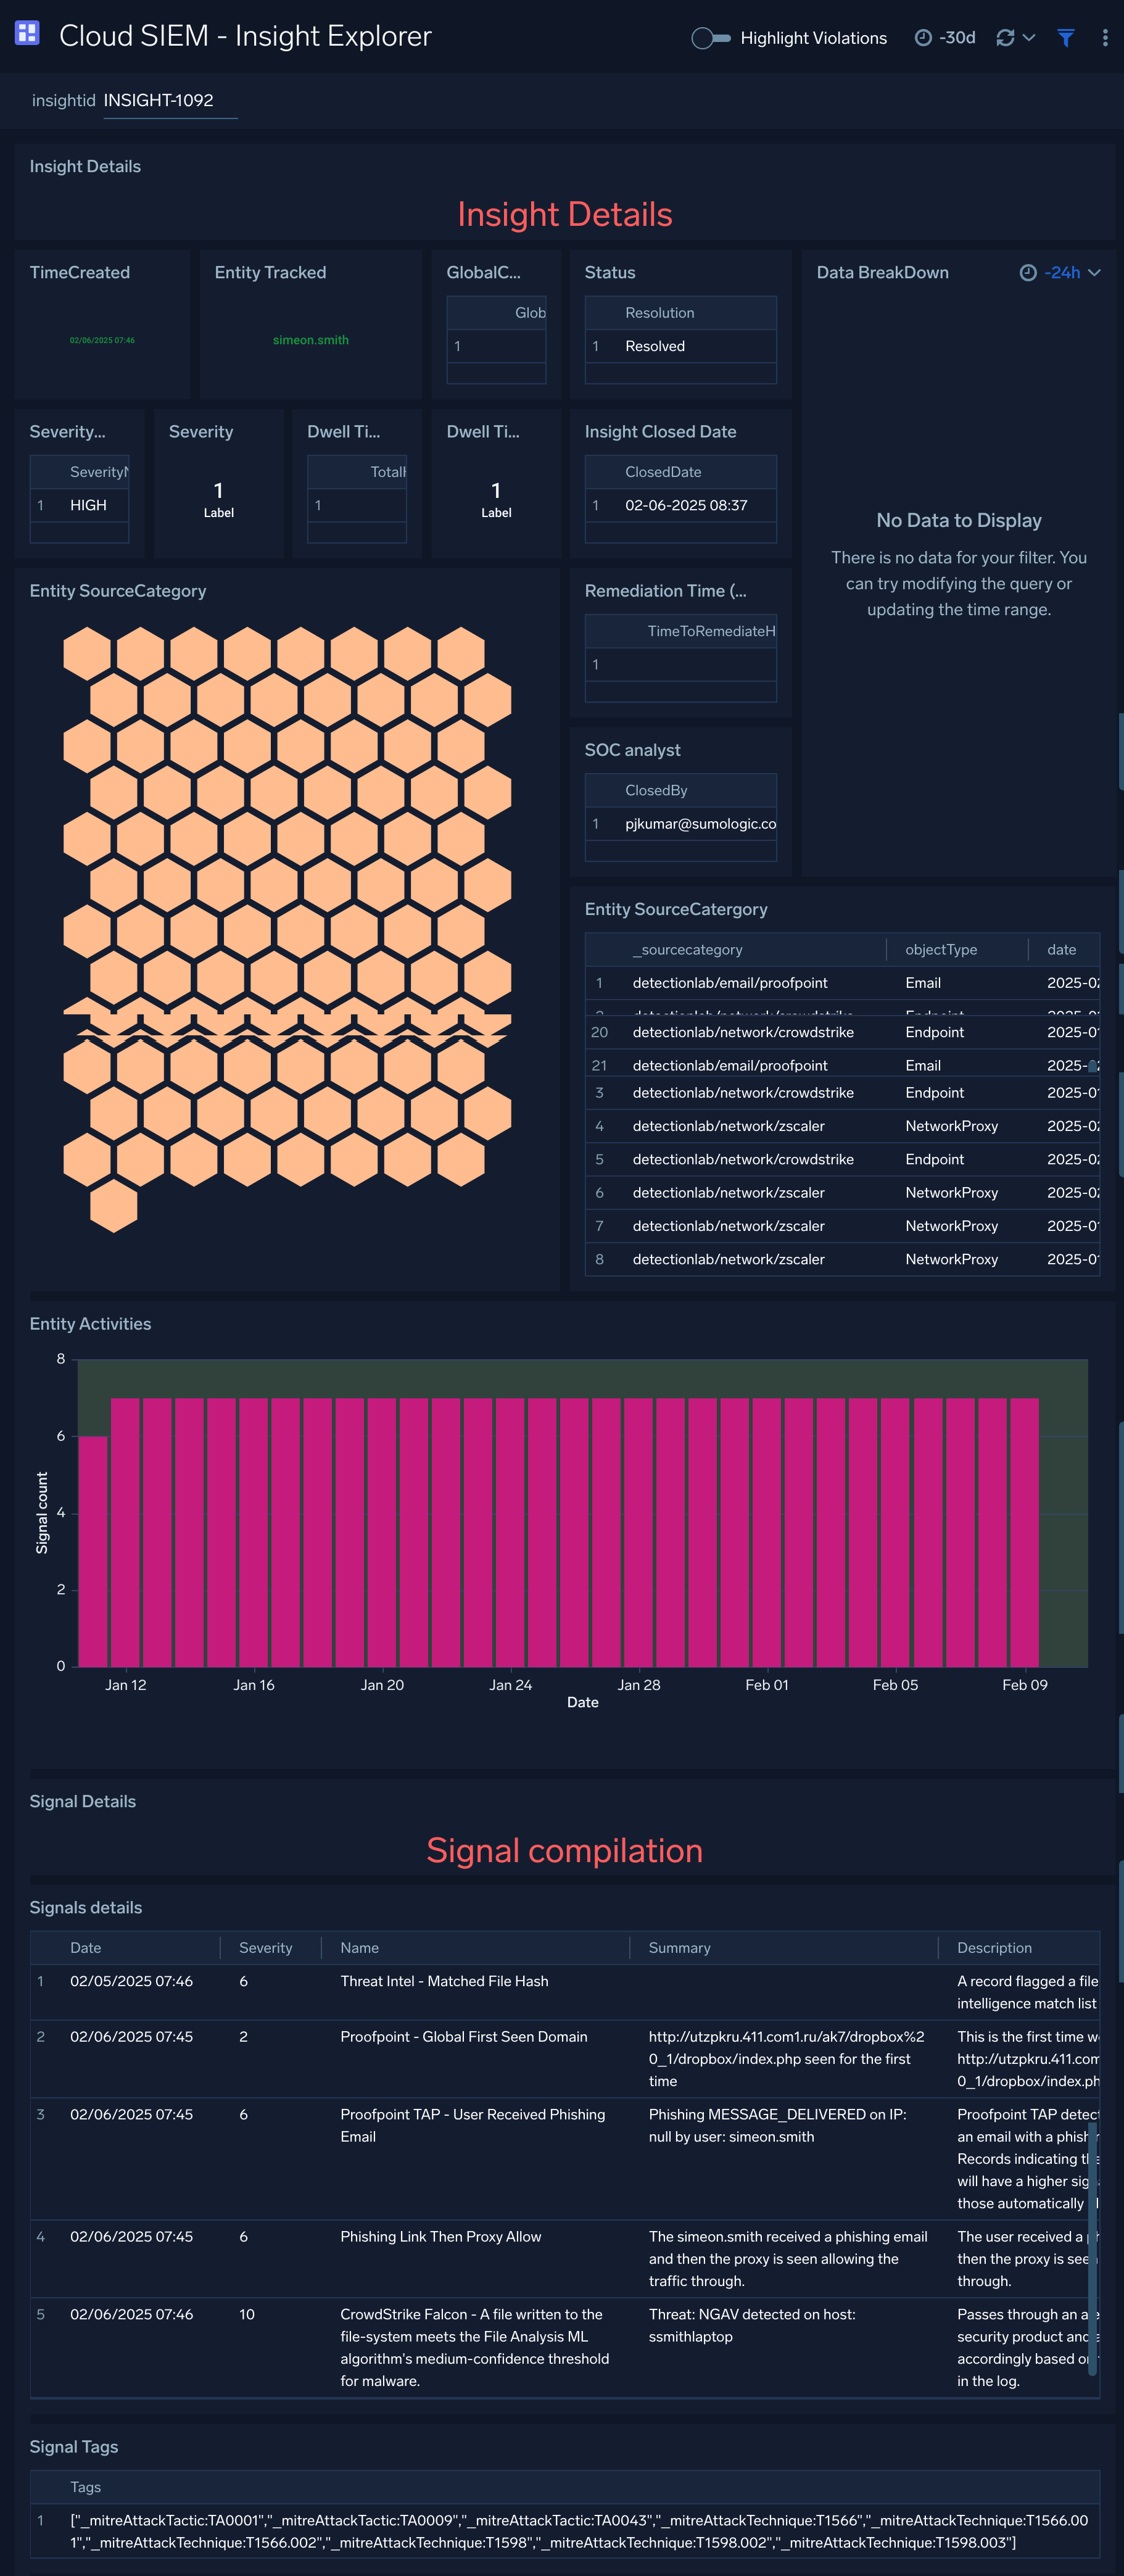
Cloud SIEM - Insight Explorer
The Cloud SIEM - Insight Explorer dashboard provides details of an insight.
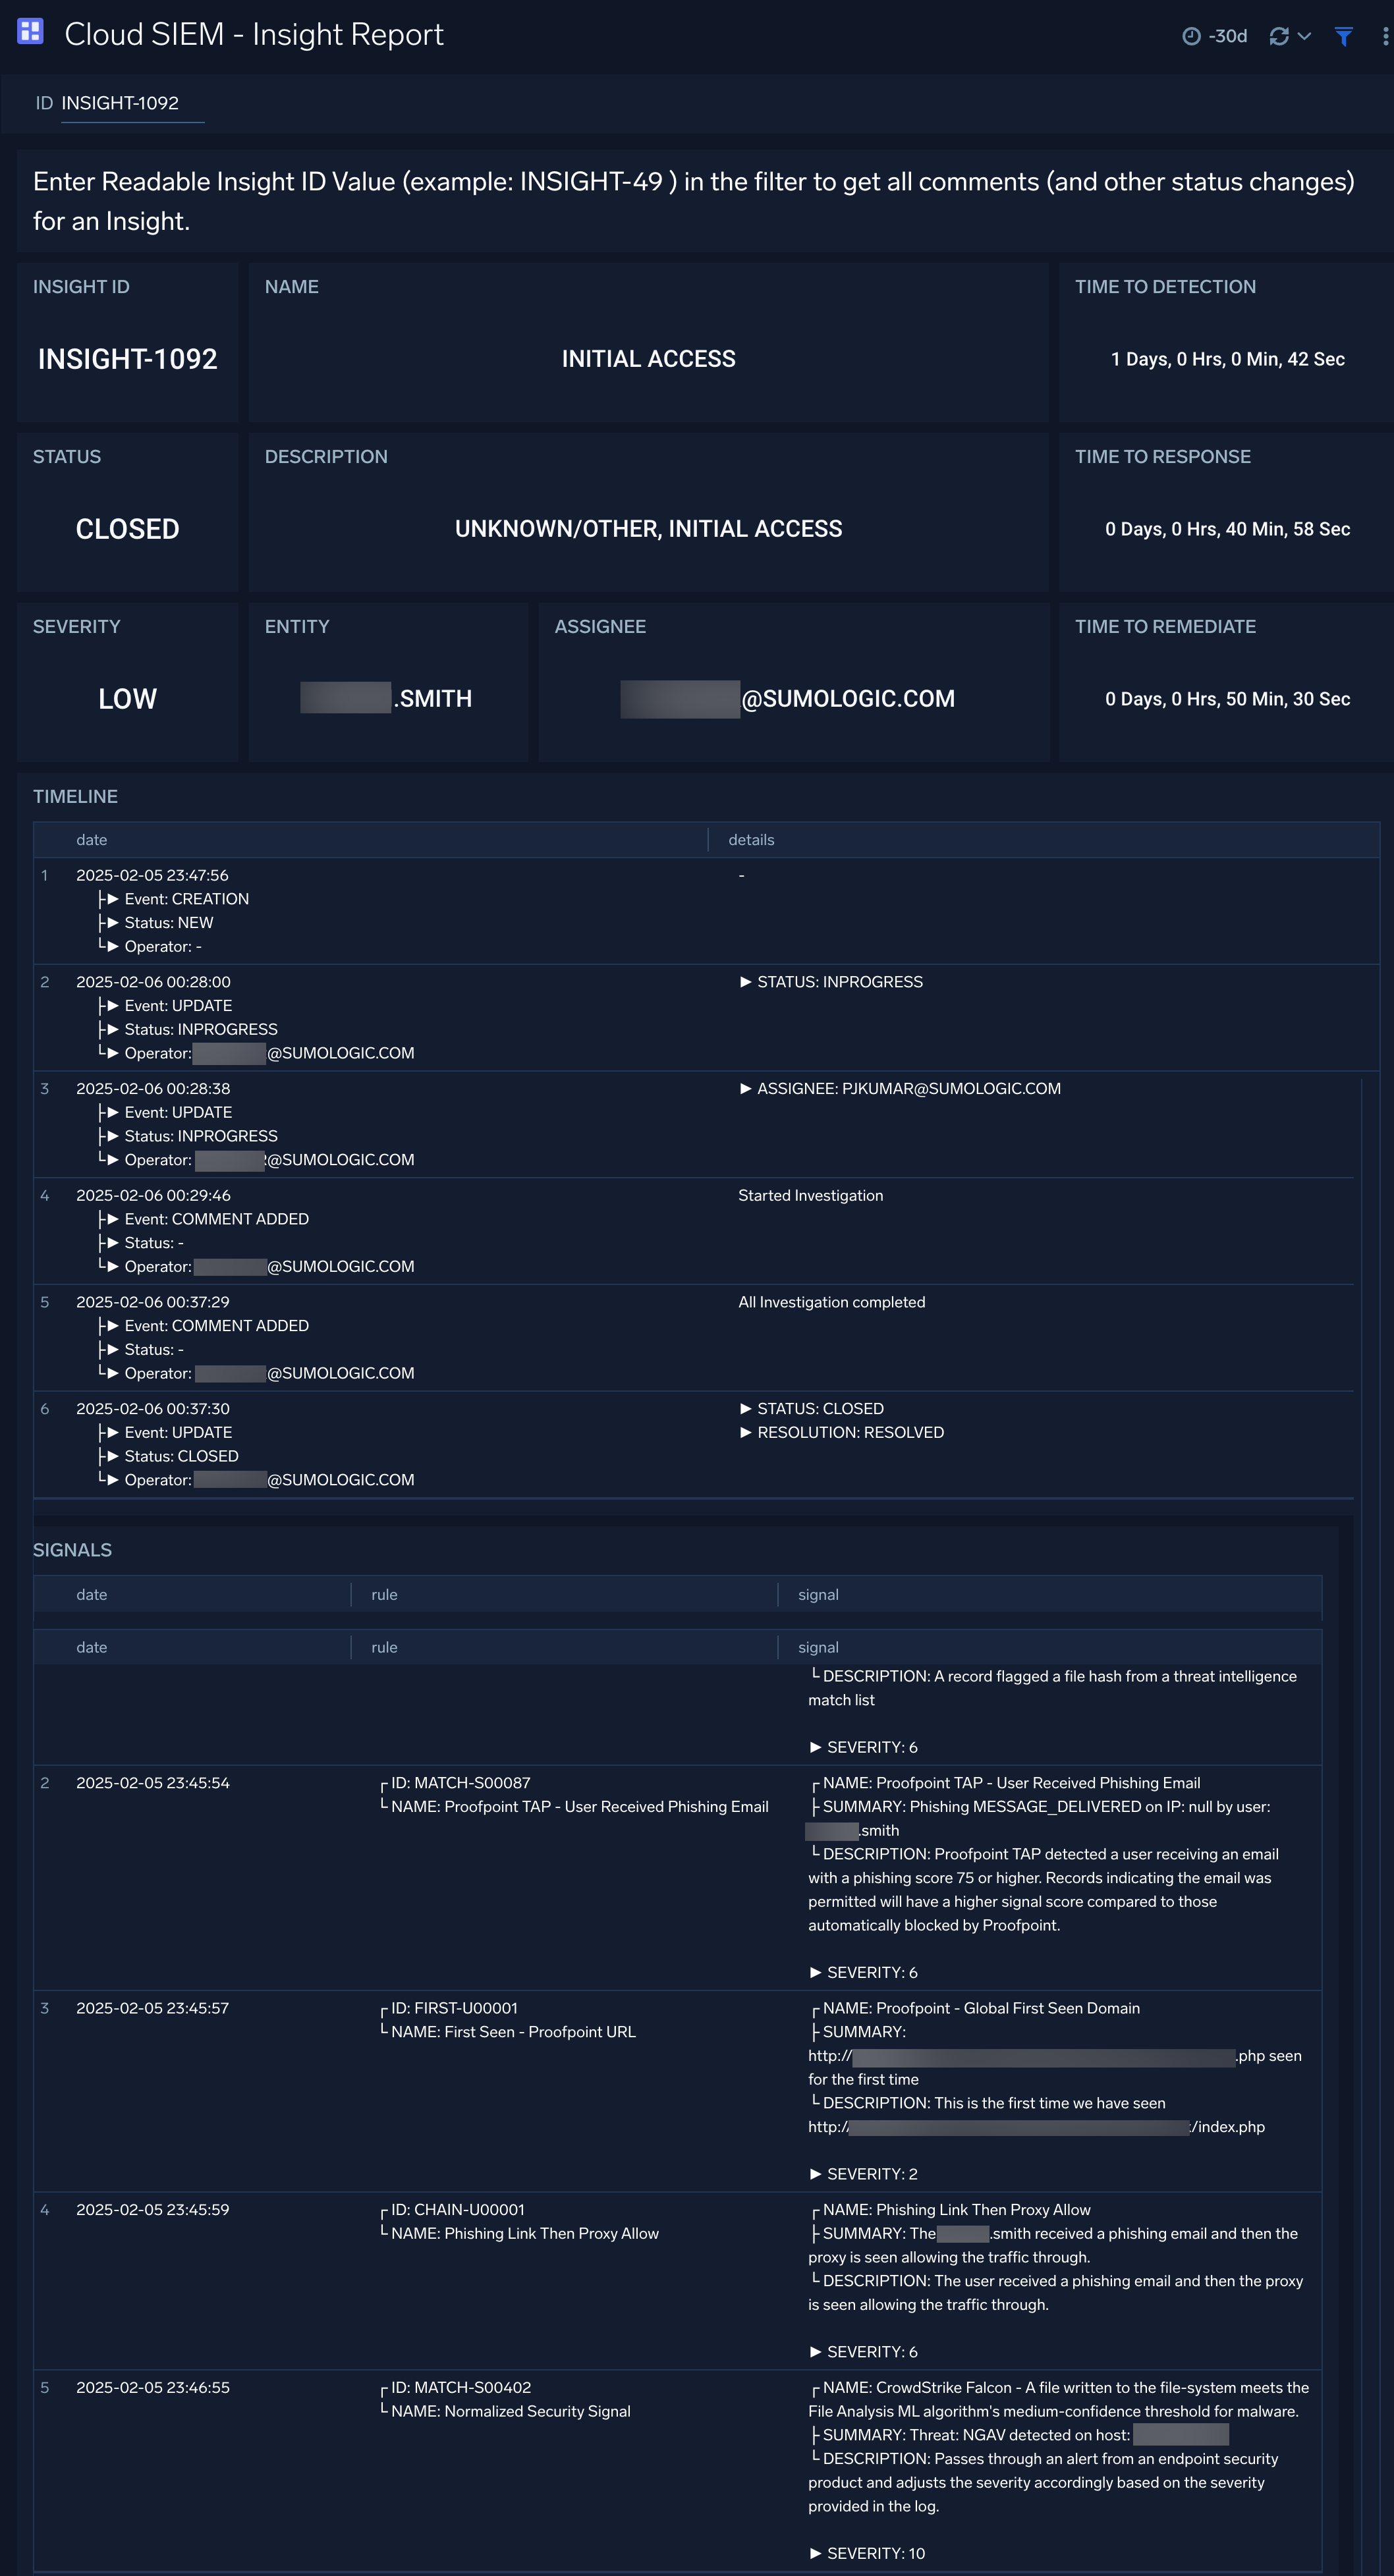
Cloud SIEM - Insight Report
The Cloud SIEM - Insight Report dashboard provides all comments (and other status changes) for an insight provided in the filter.
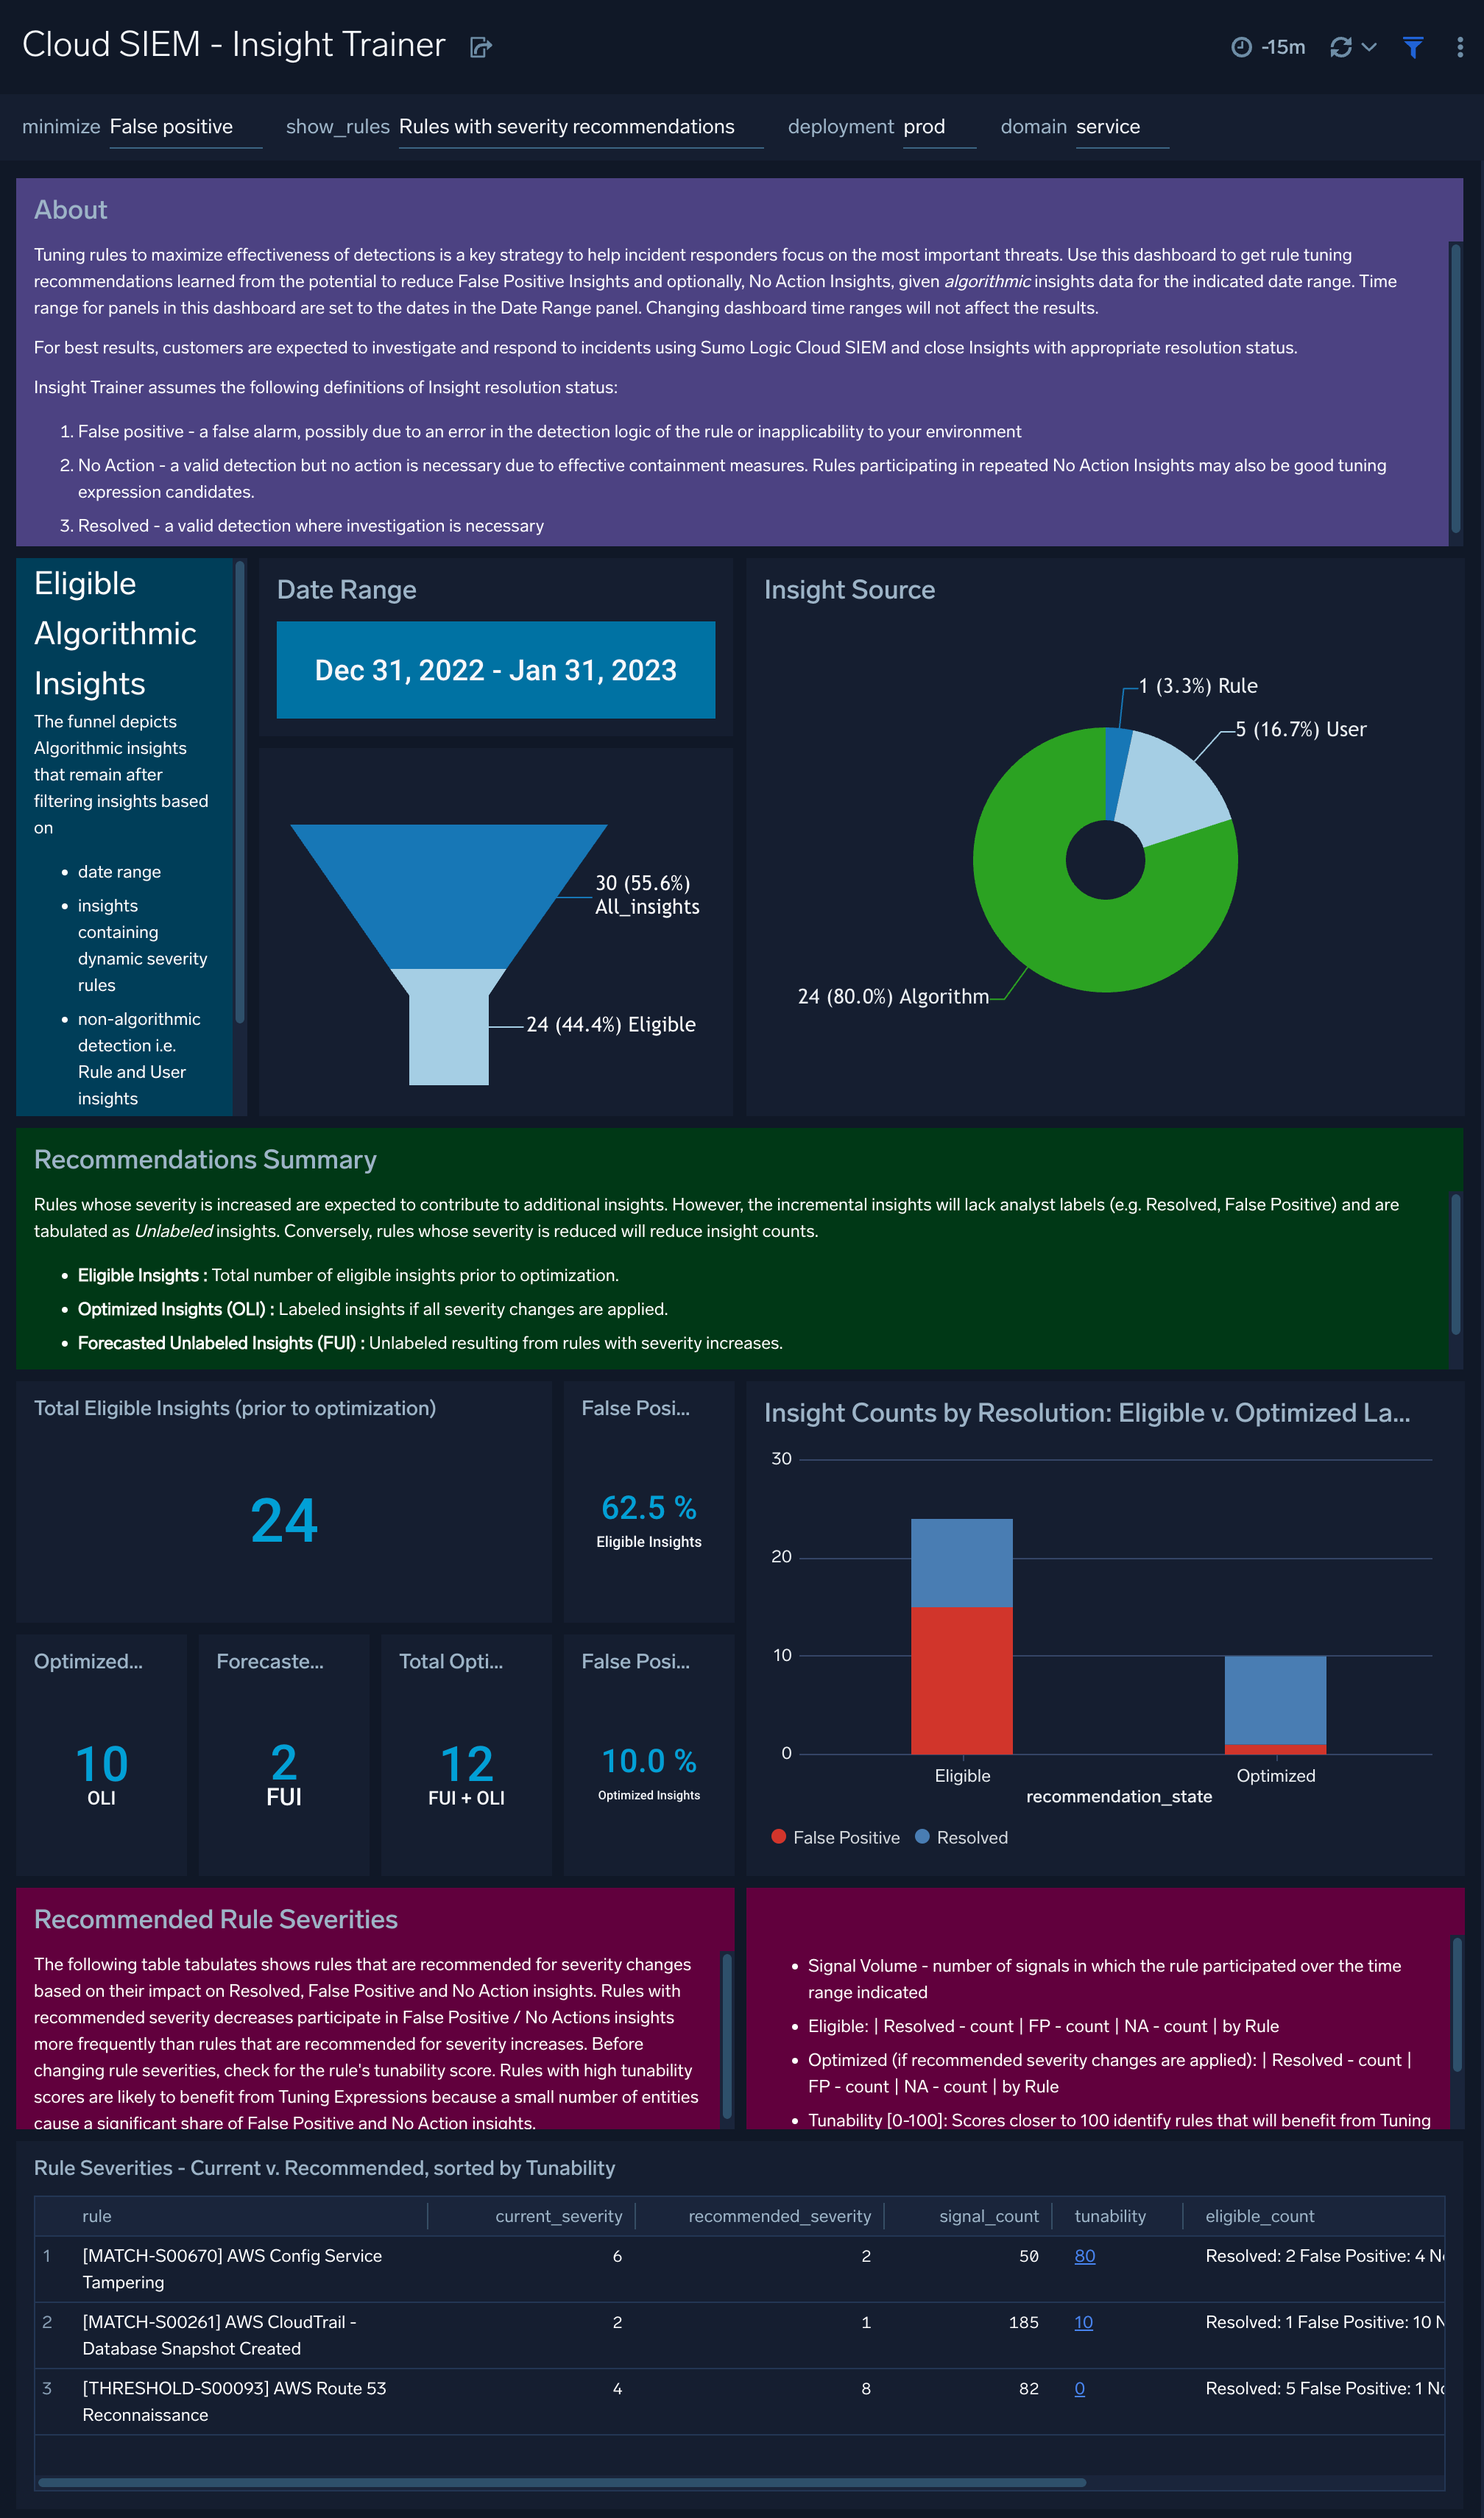
Cloud SIEM - Insight Trainer
The Cloud SIEM - Insight Trainer dashboard offers suggestions for making adjustments to rules, such as writing rule tuning expressions and changing severities. Implementing the recommendations causes rules to be more effective at creating high-fidelity signals, resulting in generation of more meaningful insights. For more information, see Improve Rules with Insight Trainer.
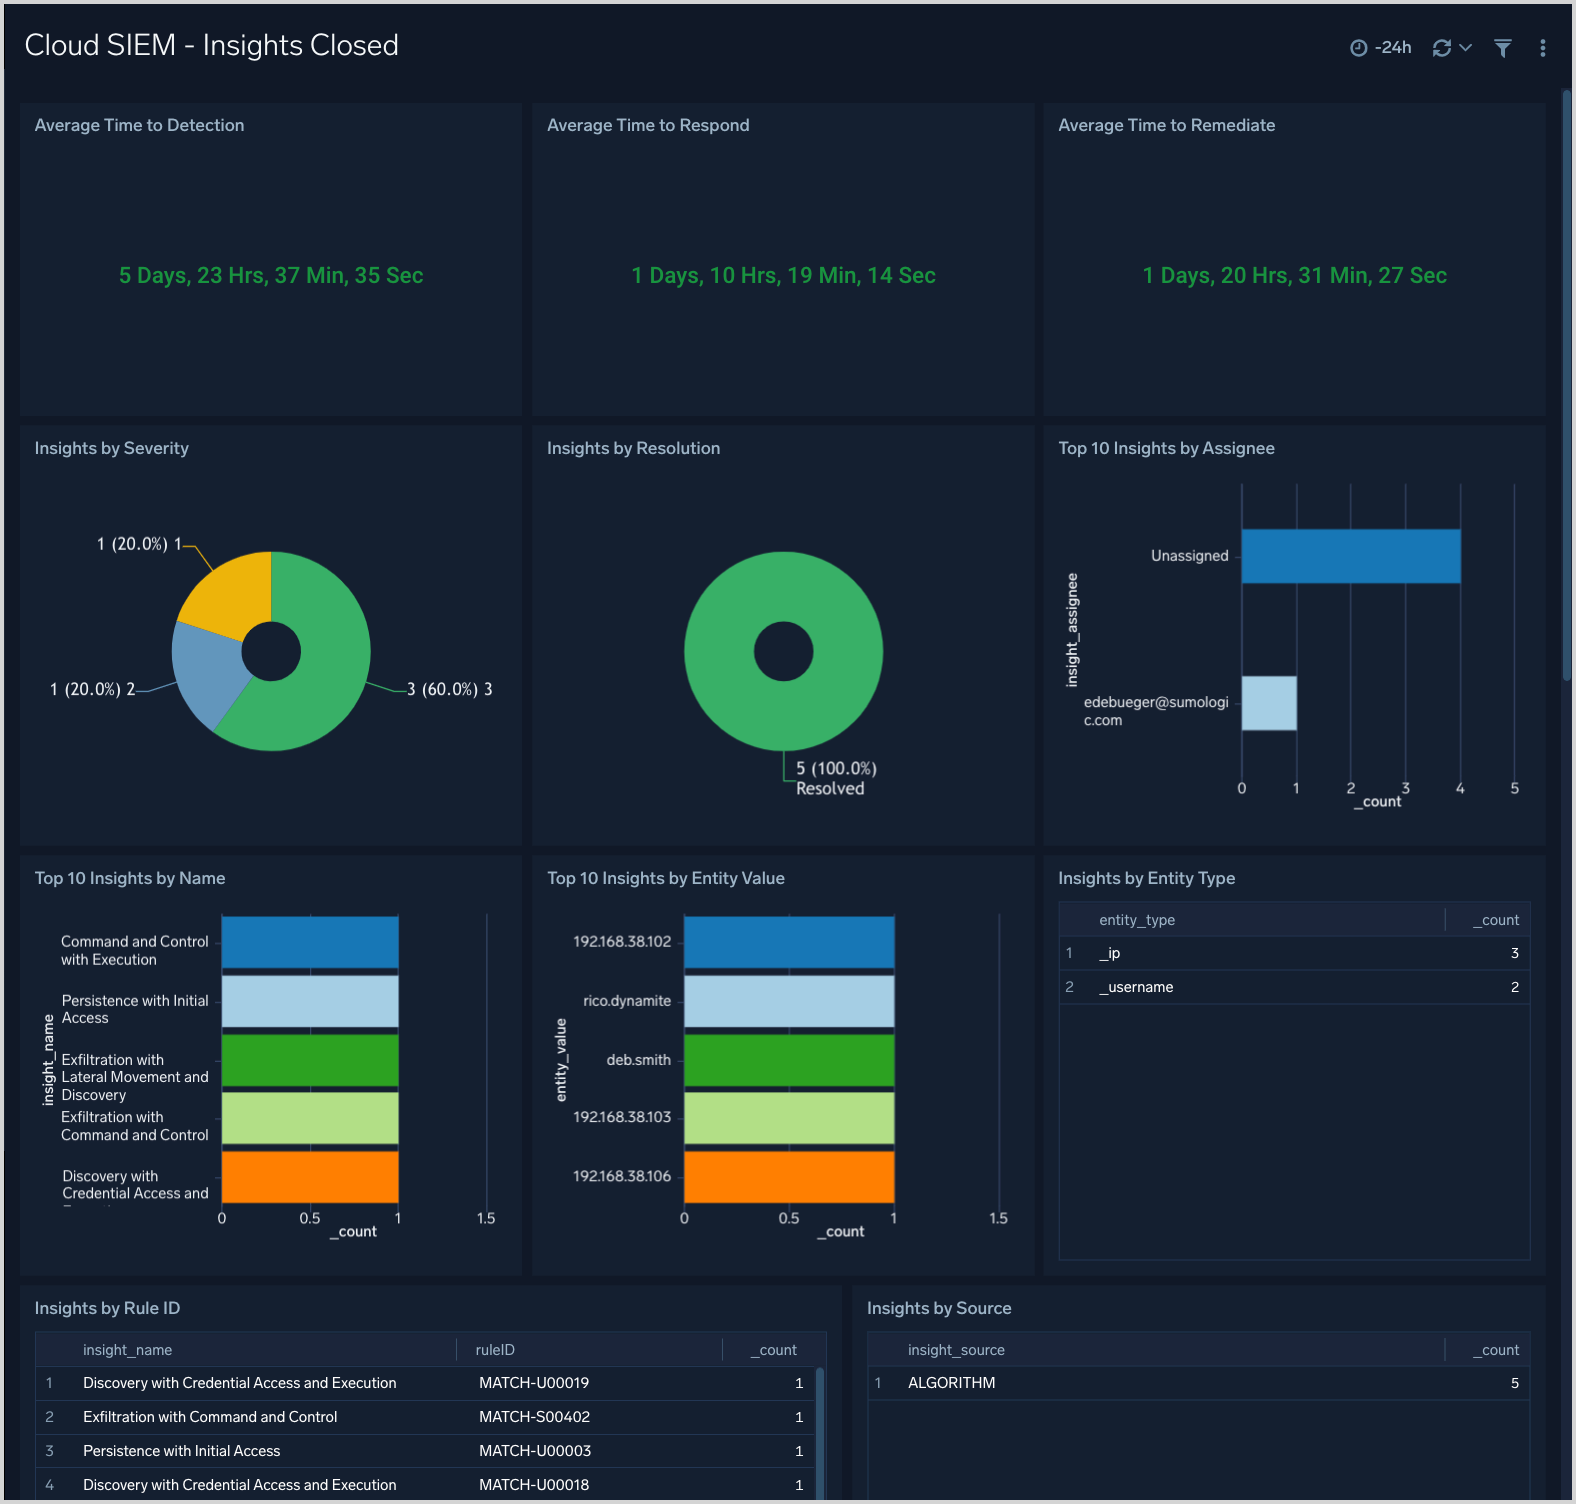
Cloud SIEM - Insights Closed
The Cloud SIEM - Insights Closed dashboard displays metrics on closed insights, including breakdowns by severity, resolution status, assignee, entity type, Rule ID and more.
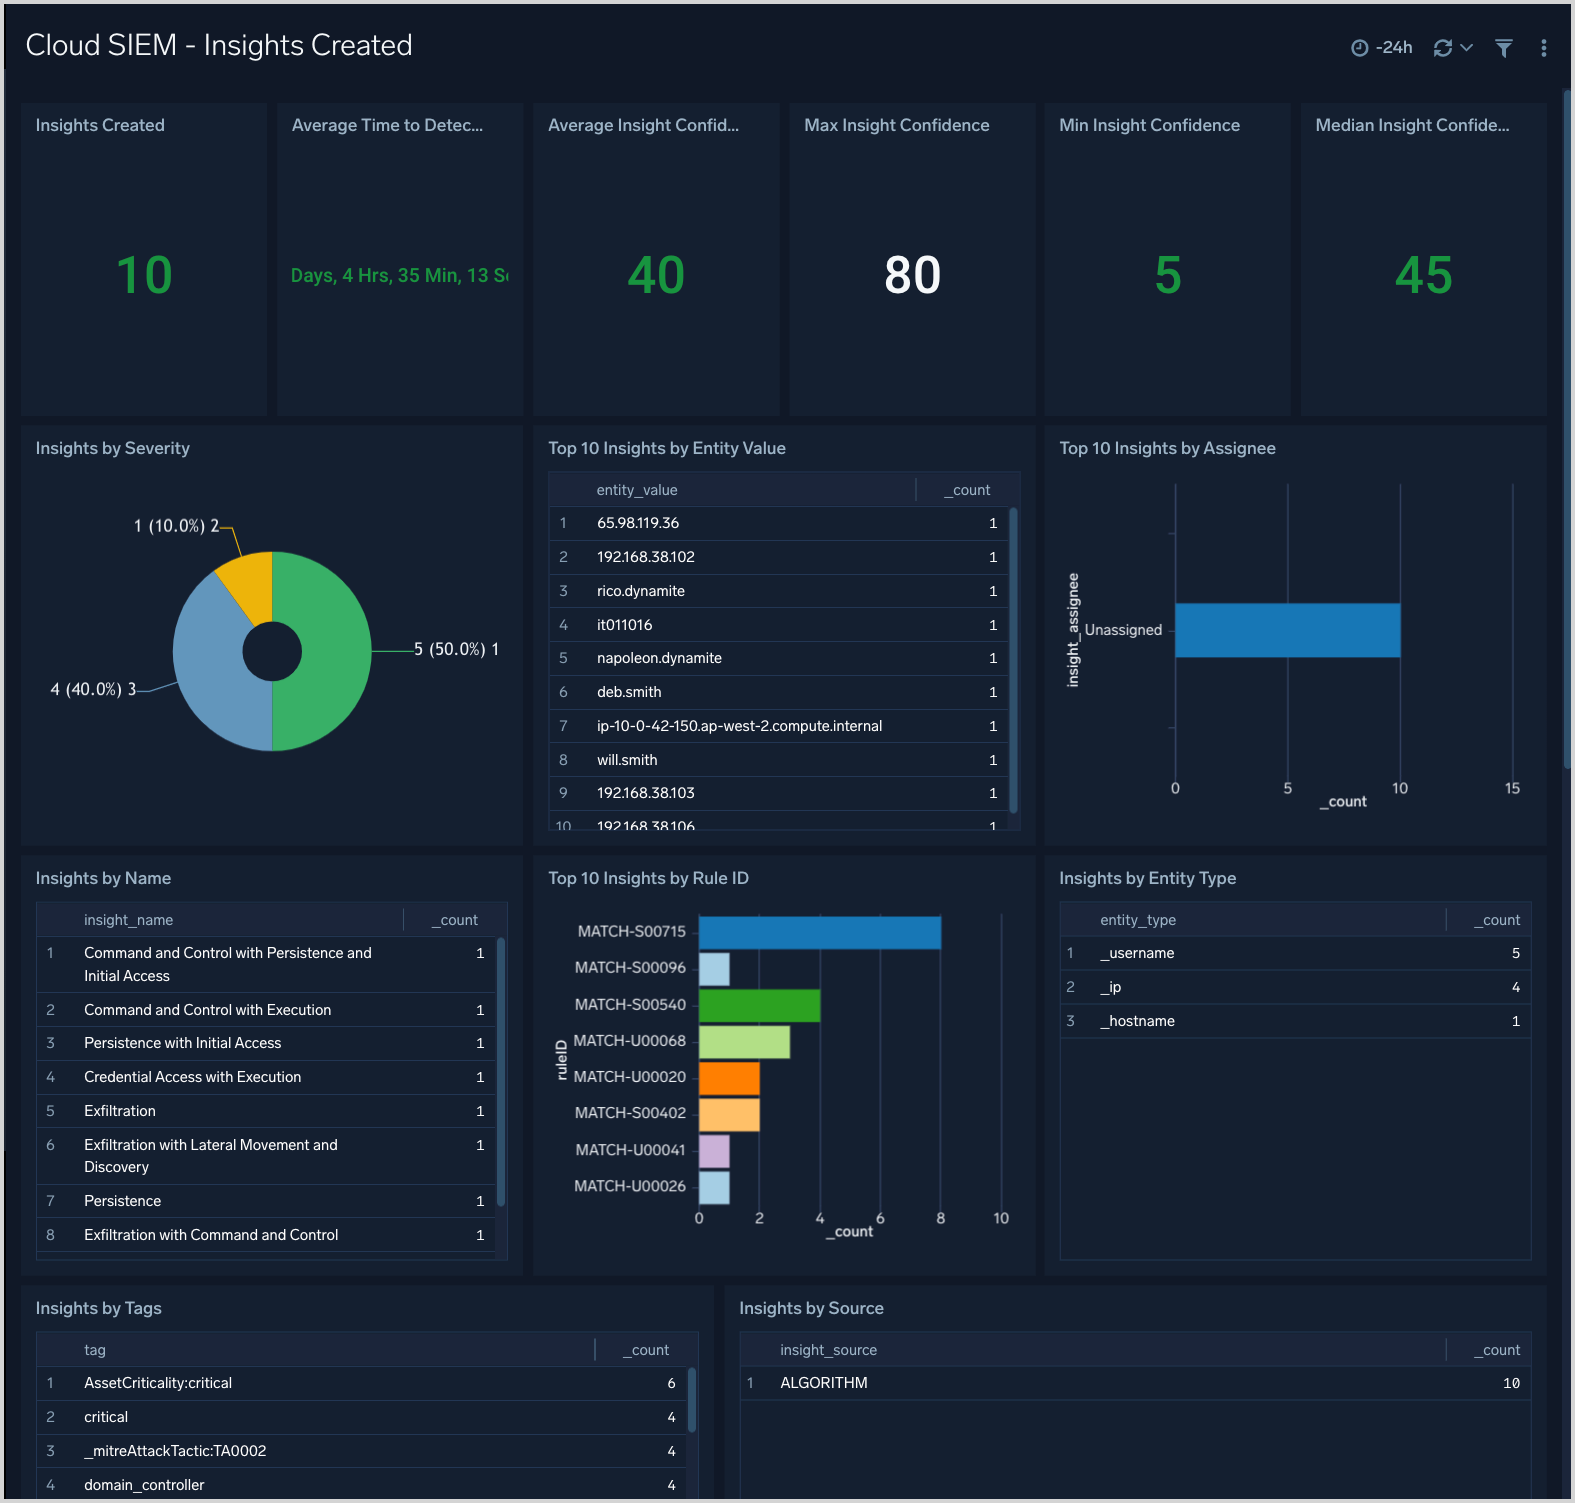
Cloud SIEM - Insights Created
The Cloud SIEM - Insights Created dashboard presents metrics about insight creation in your environment. You can see information like how many insights have been created, average time to detection, and insight Confidence statistics. There are breakdowns of insights created by severity, primary entity, rule ID, entity type, and more.
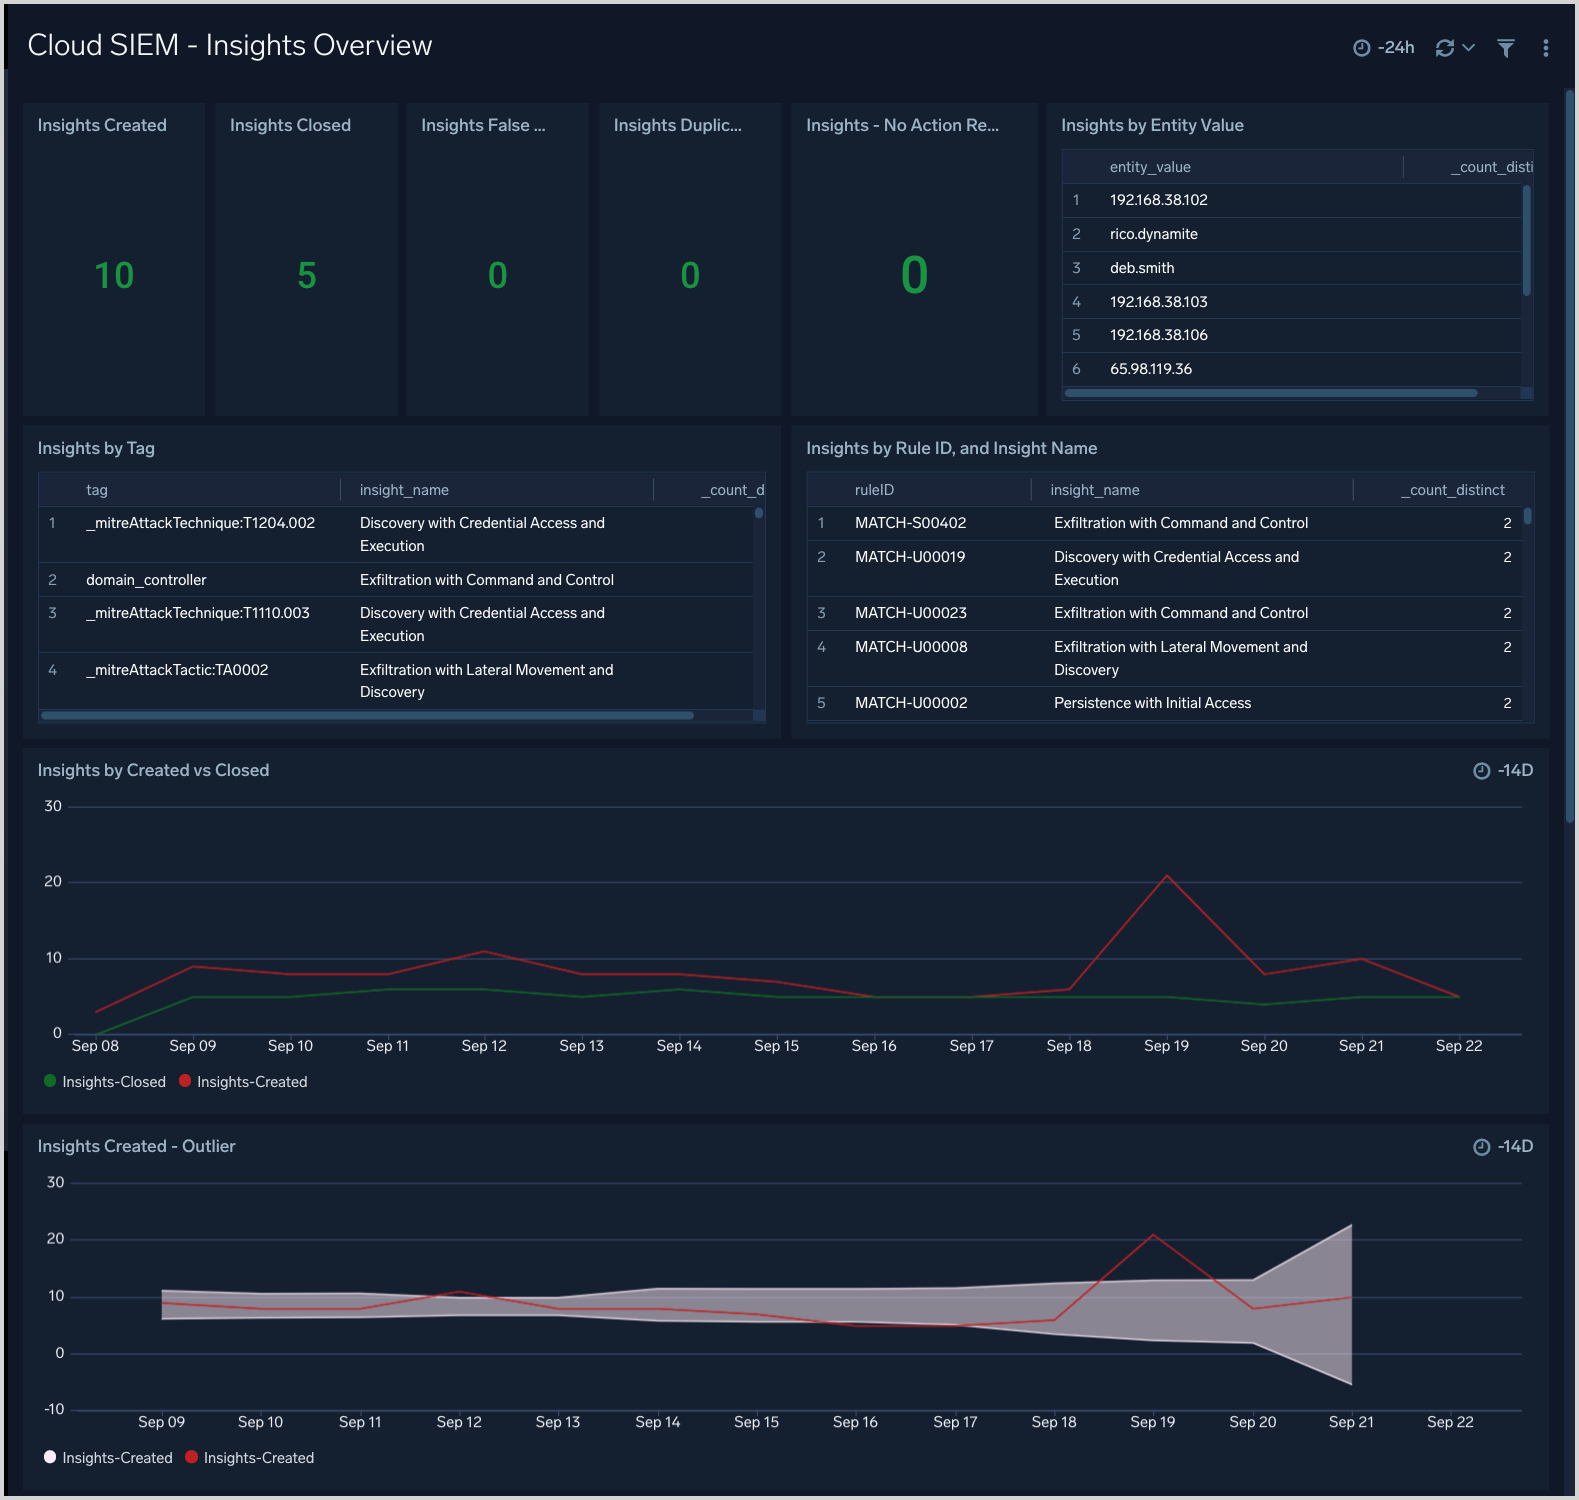
Cloud SIEM - Insights Overview
The Cloud SIEM - Insights Overview dashboard displays a high level view of insight activity in your environment. You can see counts of insights created and closed over time, and the top insights by Confidence Level.
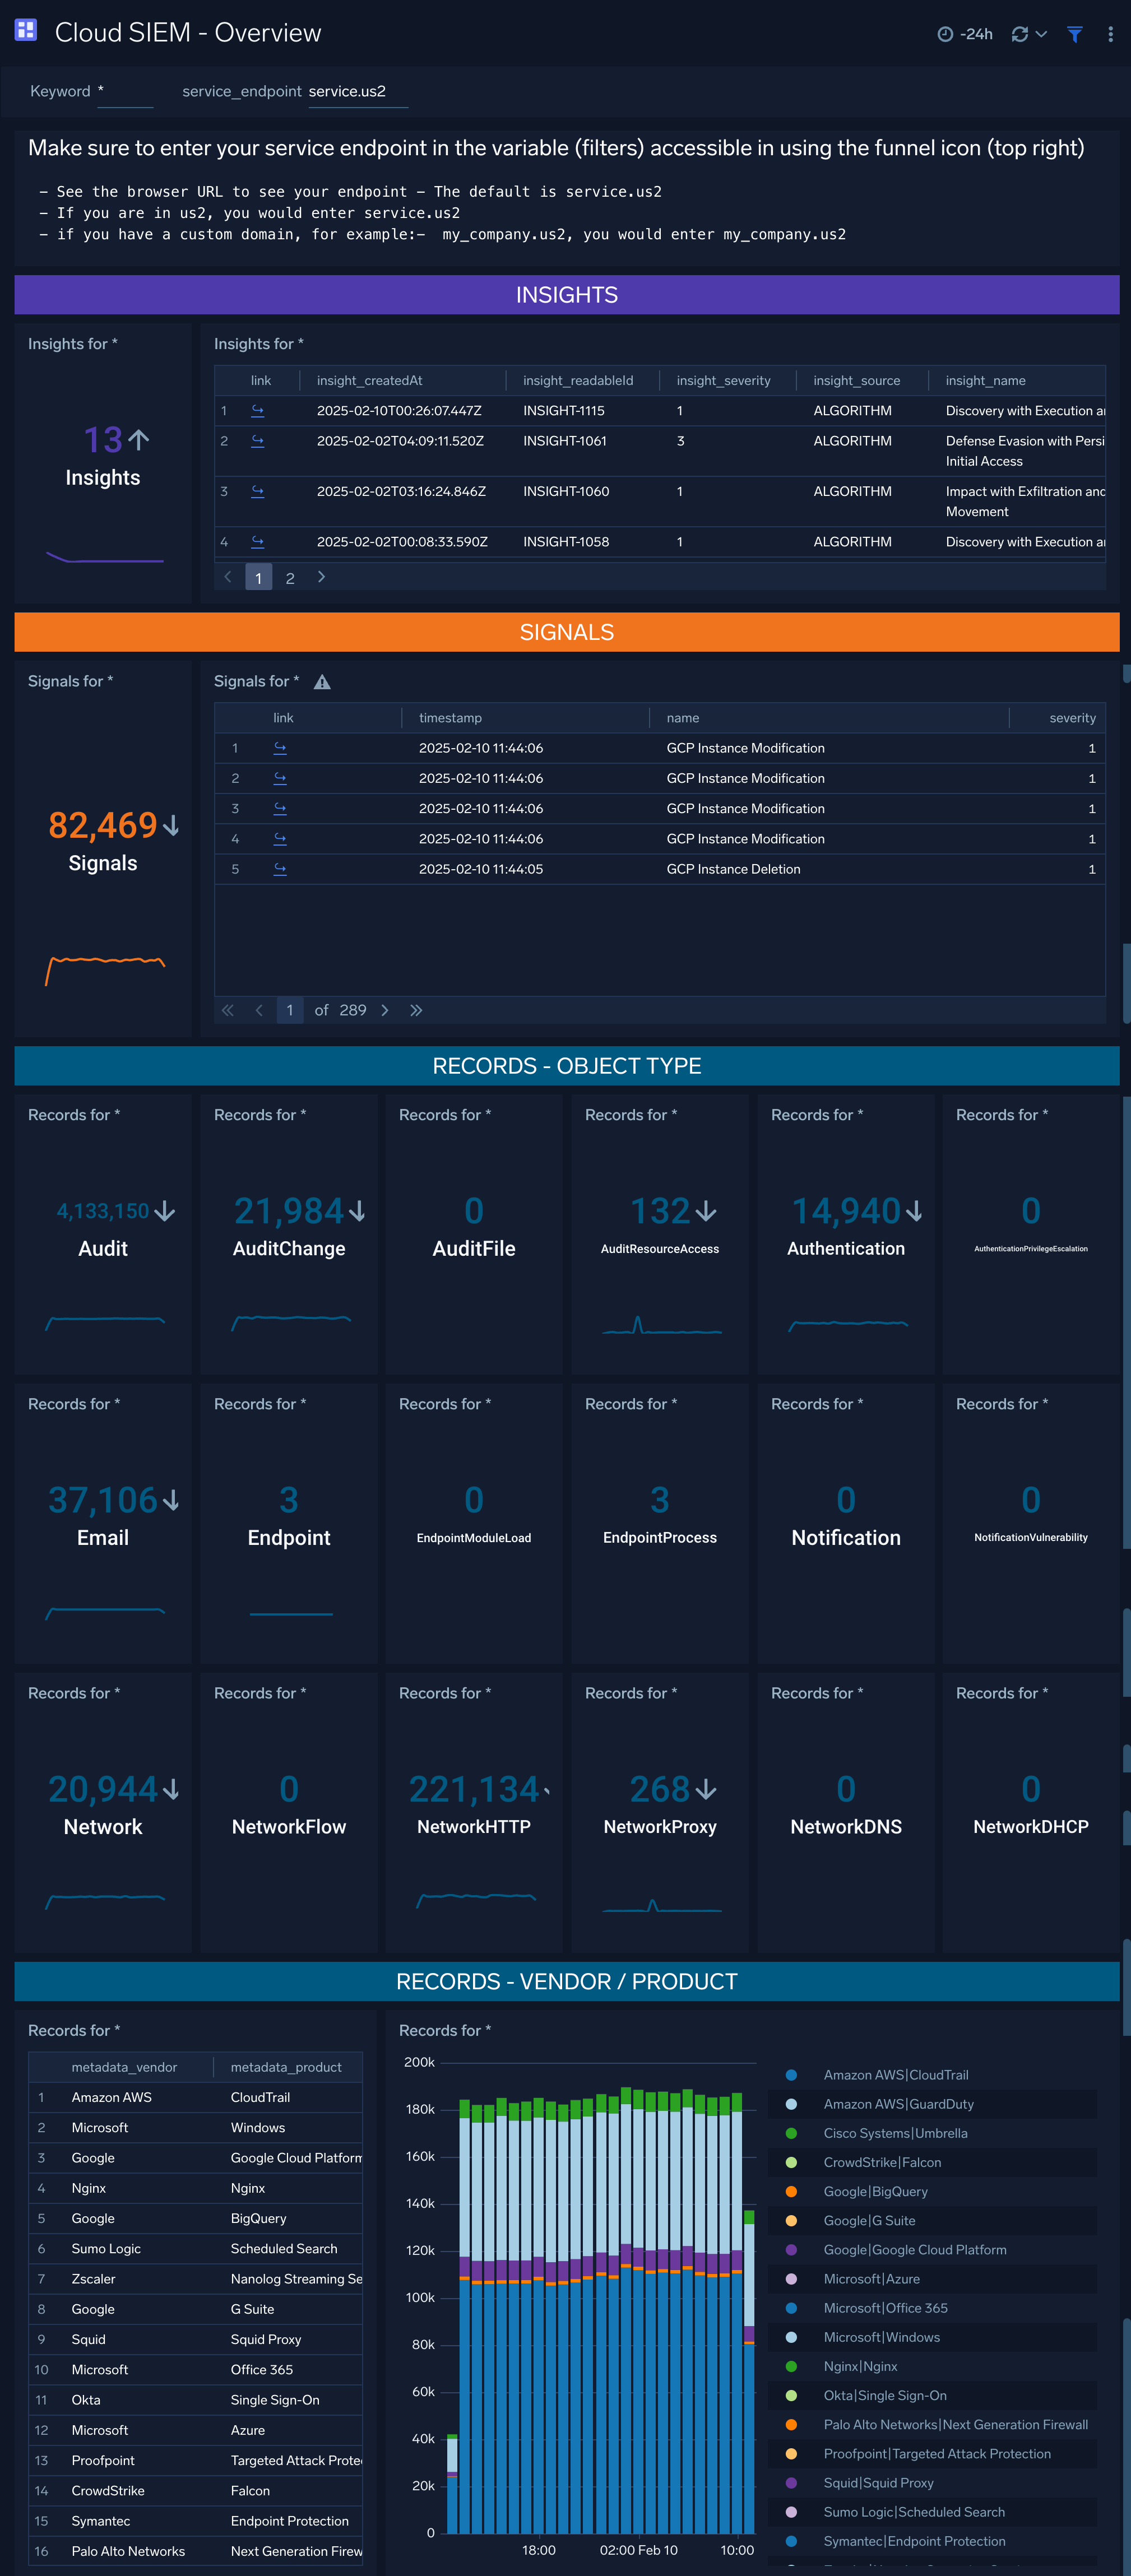
Cloud SIEM - Overview
The Cloud SIEM - Overview dashboard provides metrics related to insight, signals and records. Use dashboard filters to look for specific insight, signals and records.
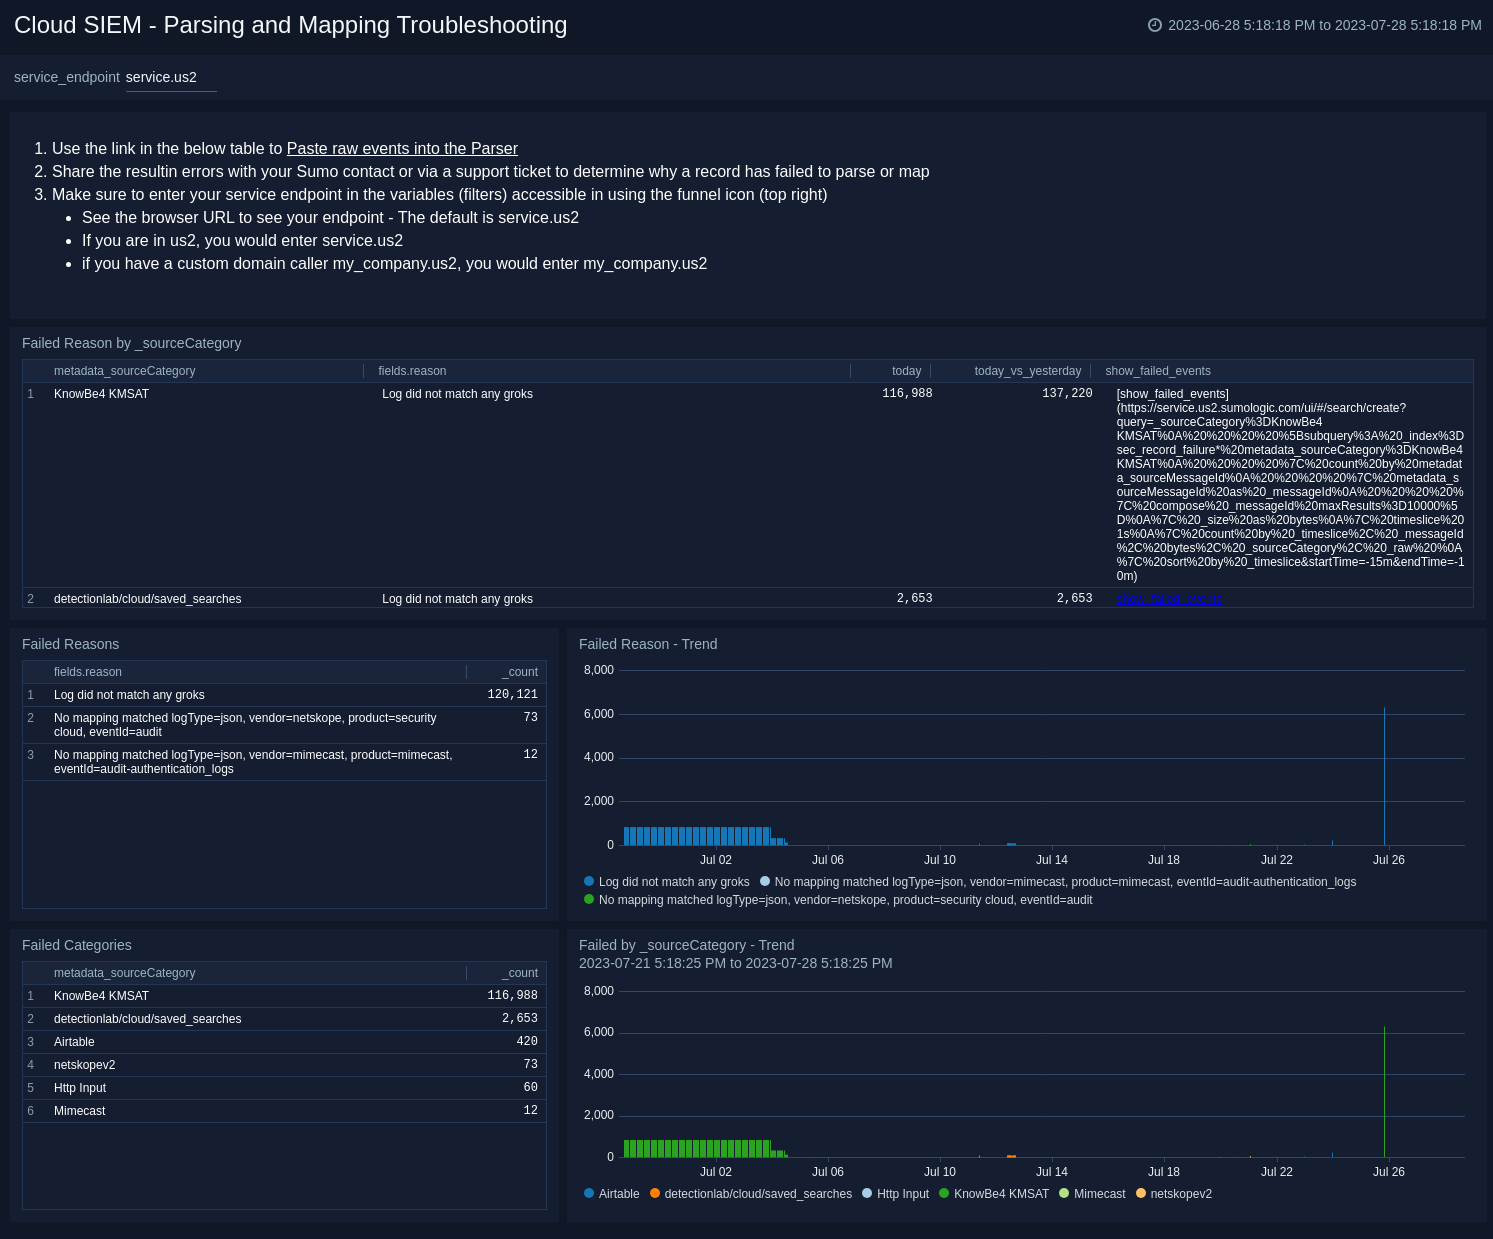
Cloud SIEM - Parsing and Mapping Troubleshooting
The Cloud SIEM - Parsing and Mapping Troubleshooting dashboard shows breakdowns of cloud SIEM parsing and mapping troubleshooting.
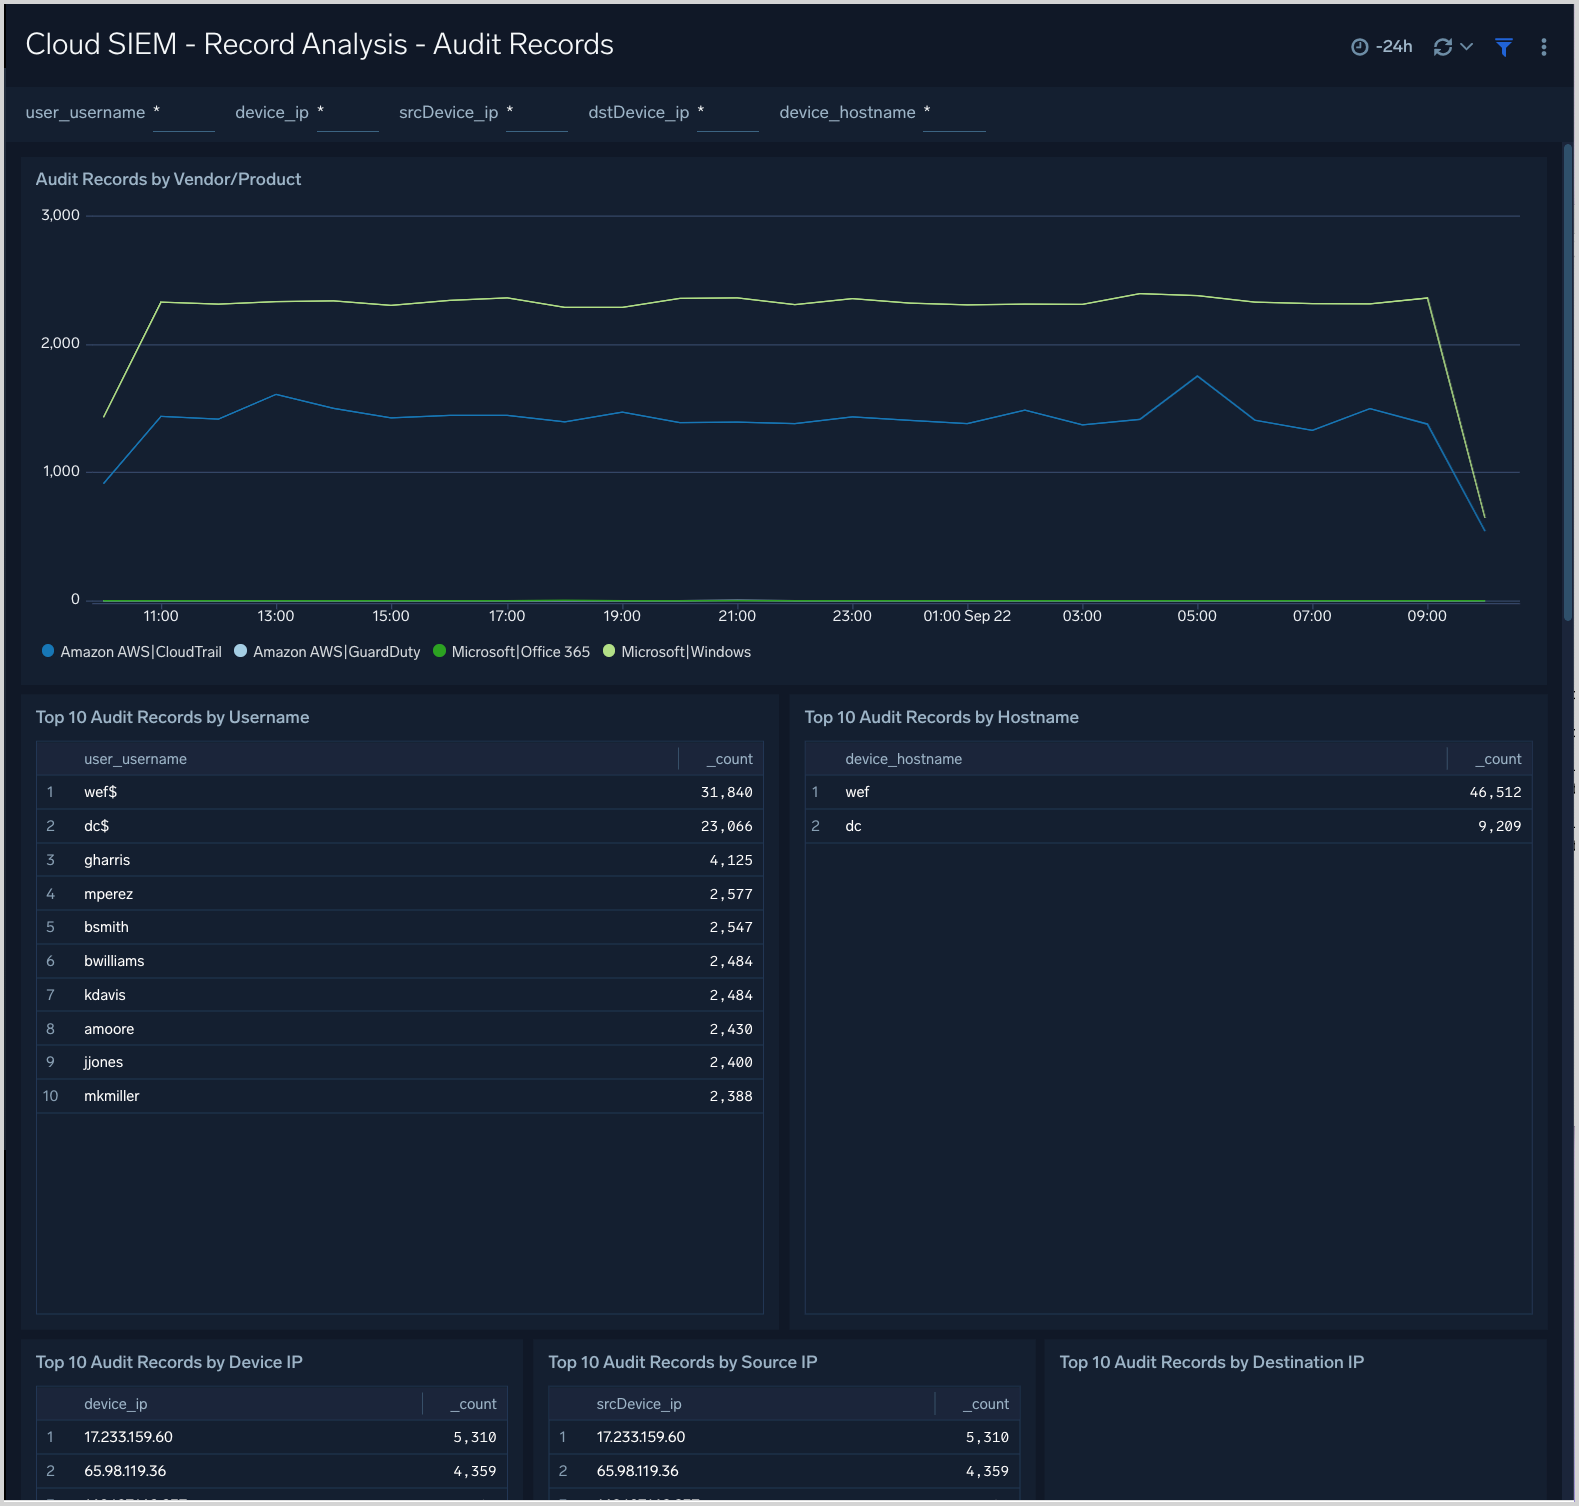
Cloud SIEM - Record Analysis - Audit Records
The Cloud SIEM - Record Analysis - Audit Records dashboard displays metrics about records created by Cloud SIEM of the type Audit. Typically, this record type is used for log sources that leave a basic audit trail.
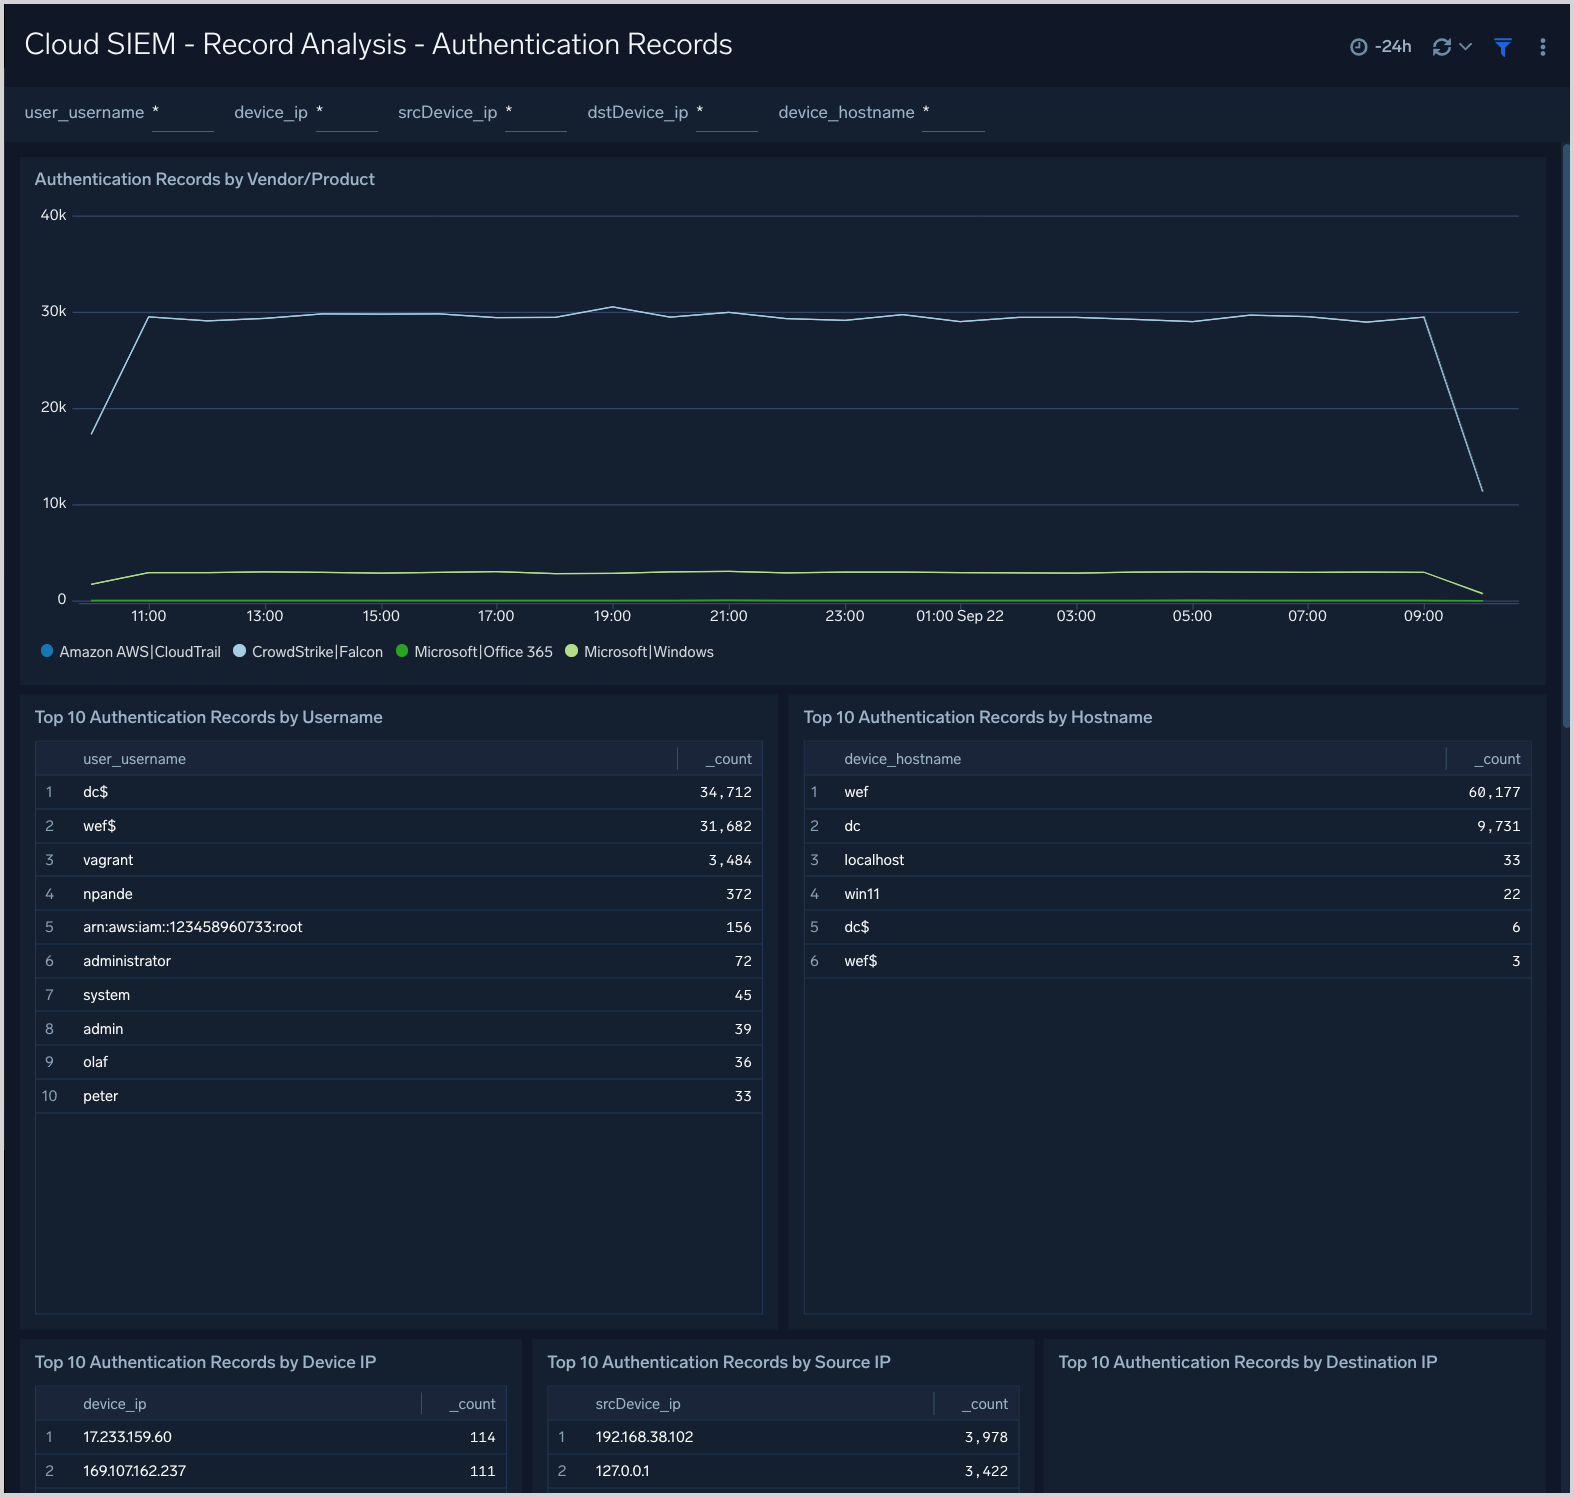
Cloud SIEM - Record Analysis - Authentication Records
The Cloud SIEM - Record Analysis - Authentication Records dashboard displays metrics about records created by Cloud SIEM of the type Authentication. Typically, this record type is used for log sources that report successful or unsuccessful authentication events.
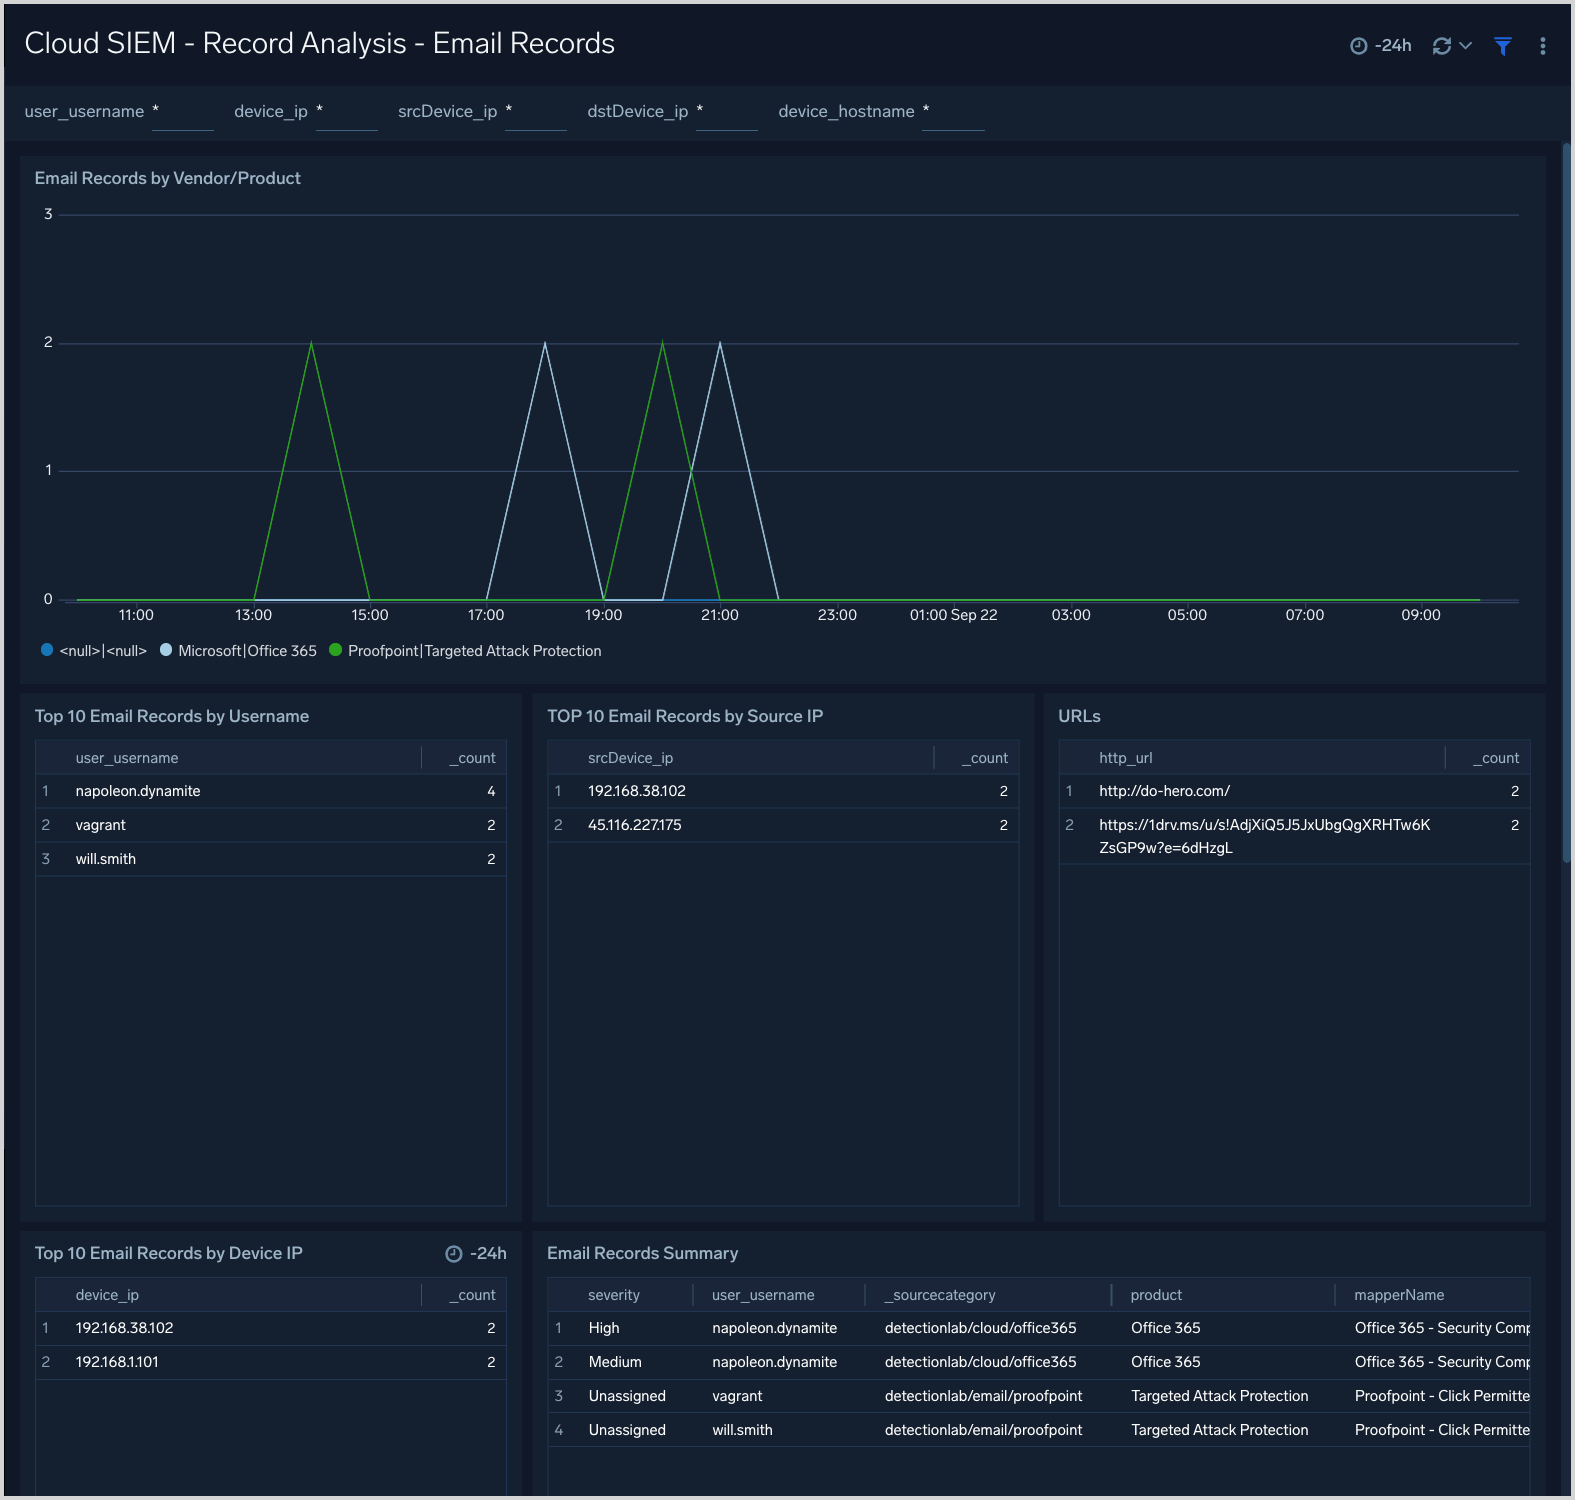
Cloud SIEM - Record Analysis - Email Records
The Cloud SIEM - Record Analysis - Email Records dashboard displays metrics about records created by Cloud SIEM of the type Email. Typically, this record type is used for log sources containing email information such as email protection applications and services.
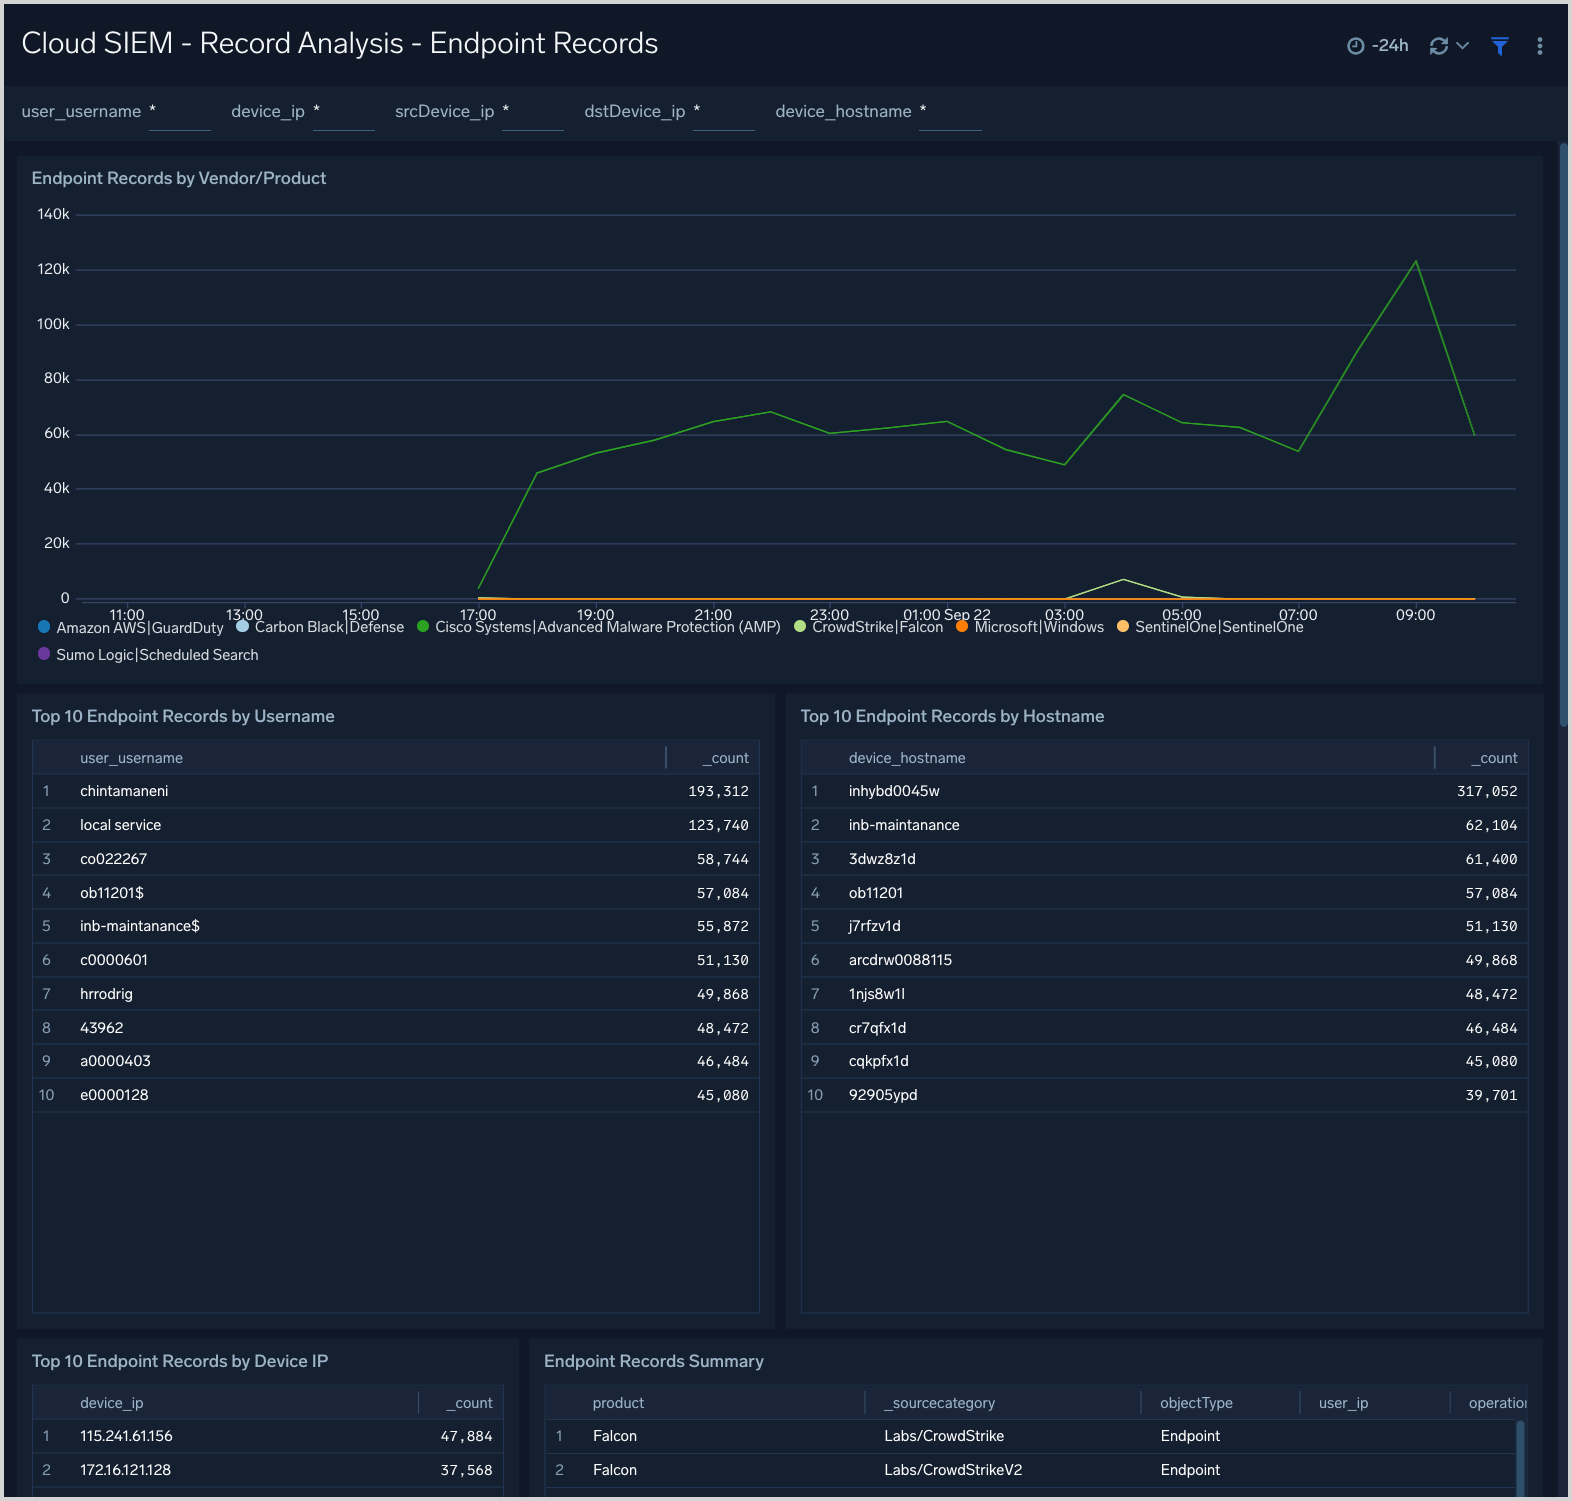
Cloud SIEM - Record Analysis - Endpoint Records
The Cloud SIEM - Record Analysis - Endpoint Records dashboard displays metrics about records created by Cloud SIEM of the type Endpoint. Typically, this record type is used for messages from endpoint security services.
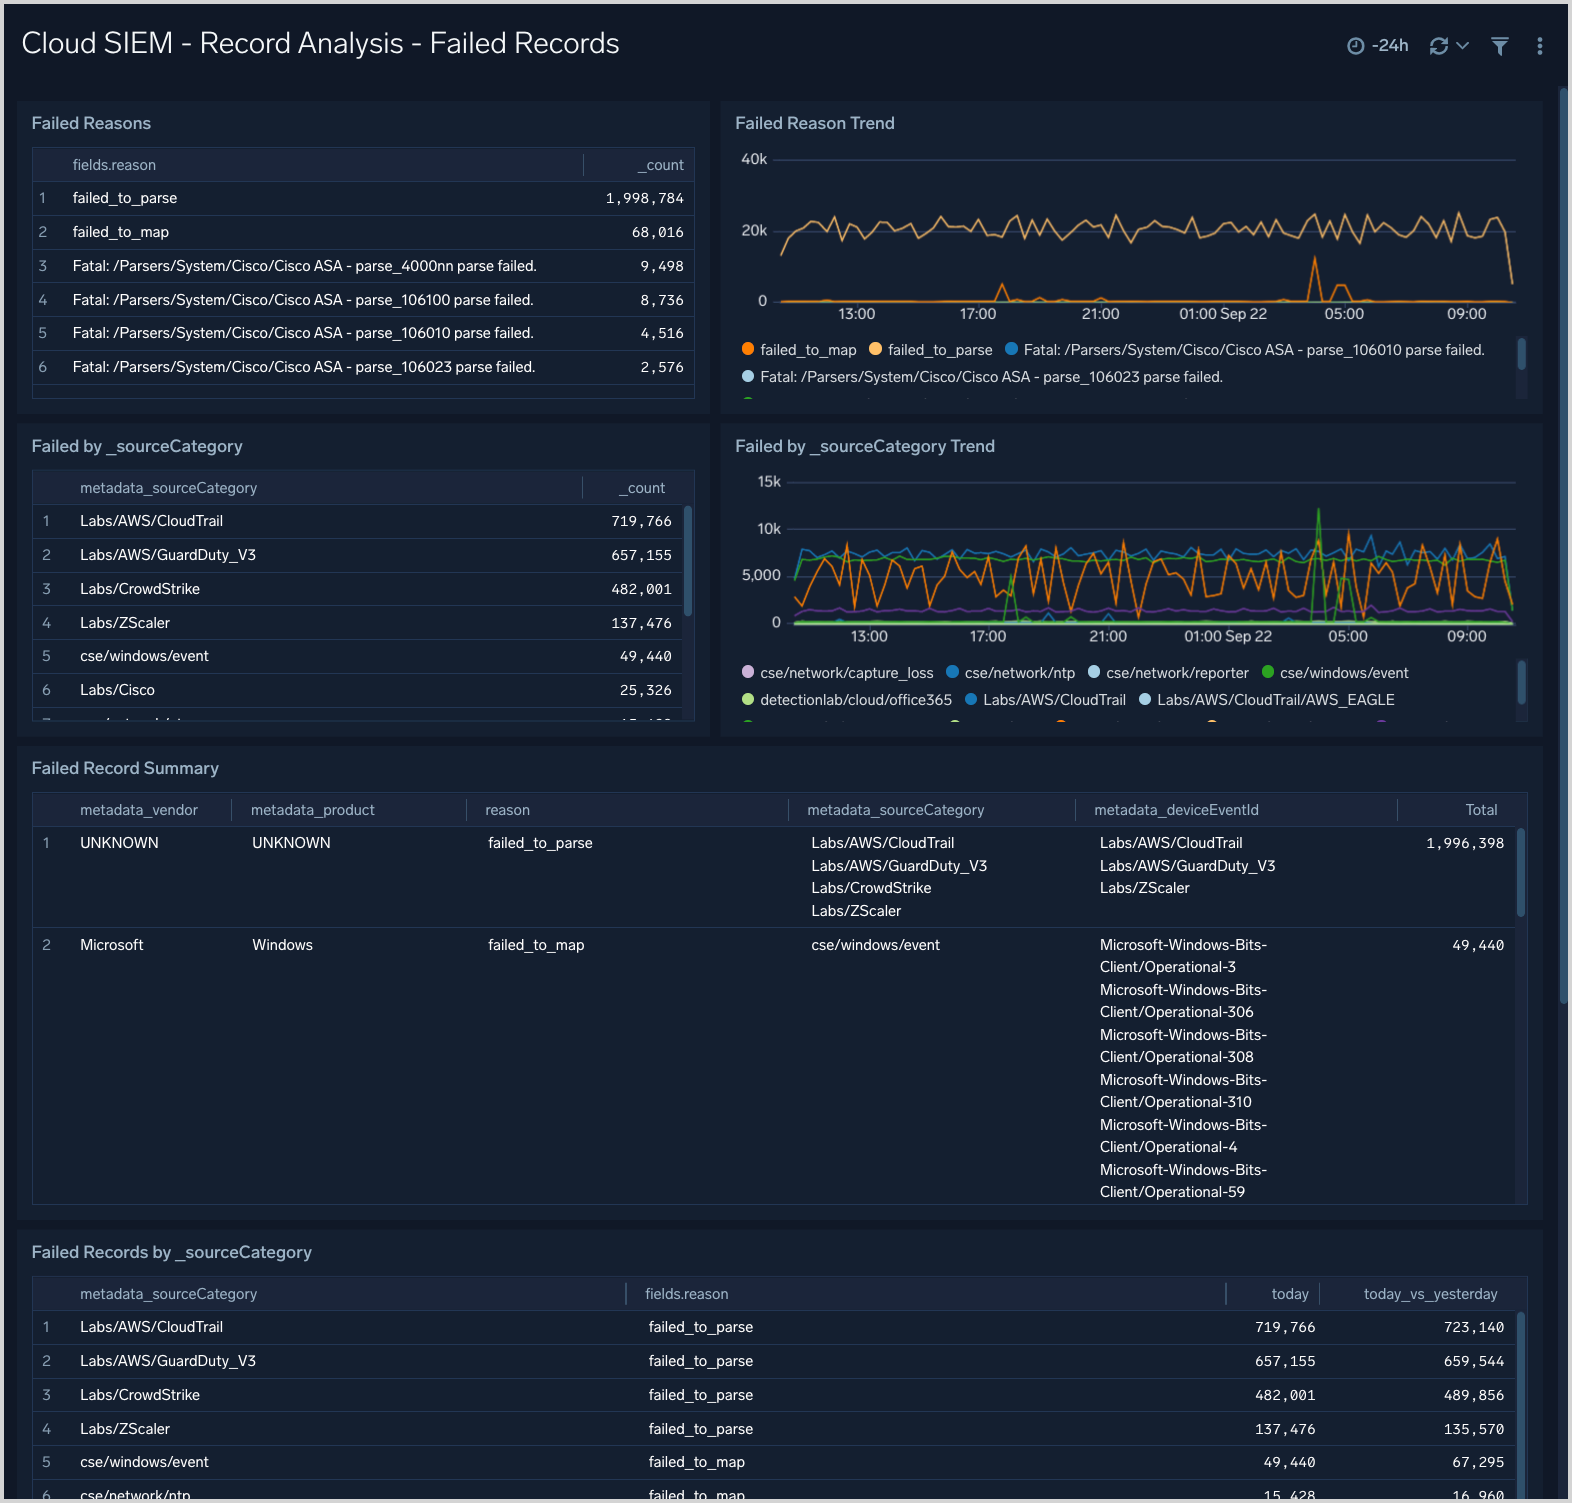
Cloud SIEM - Record Analysis - Failed Records
The Cloud SIEM - Record Analysis - Failed Records dashboard is useful for understanding if you have messages or data sources for which Cloud SIEM is unable to create normalized records.
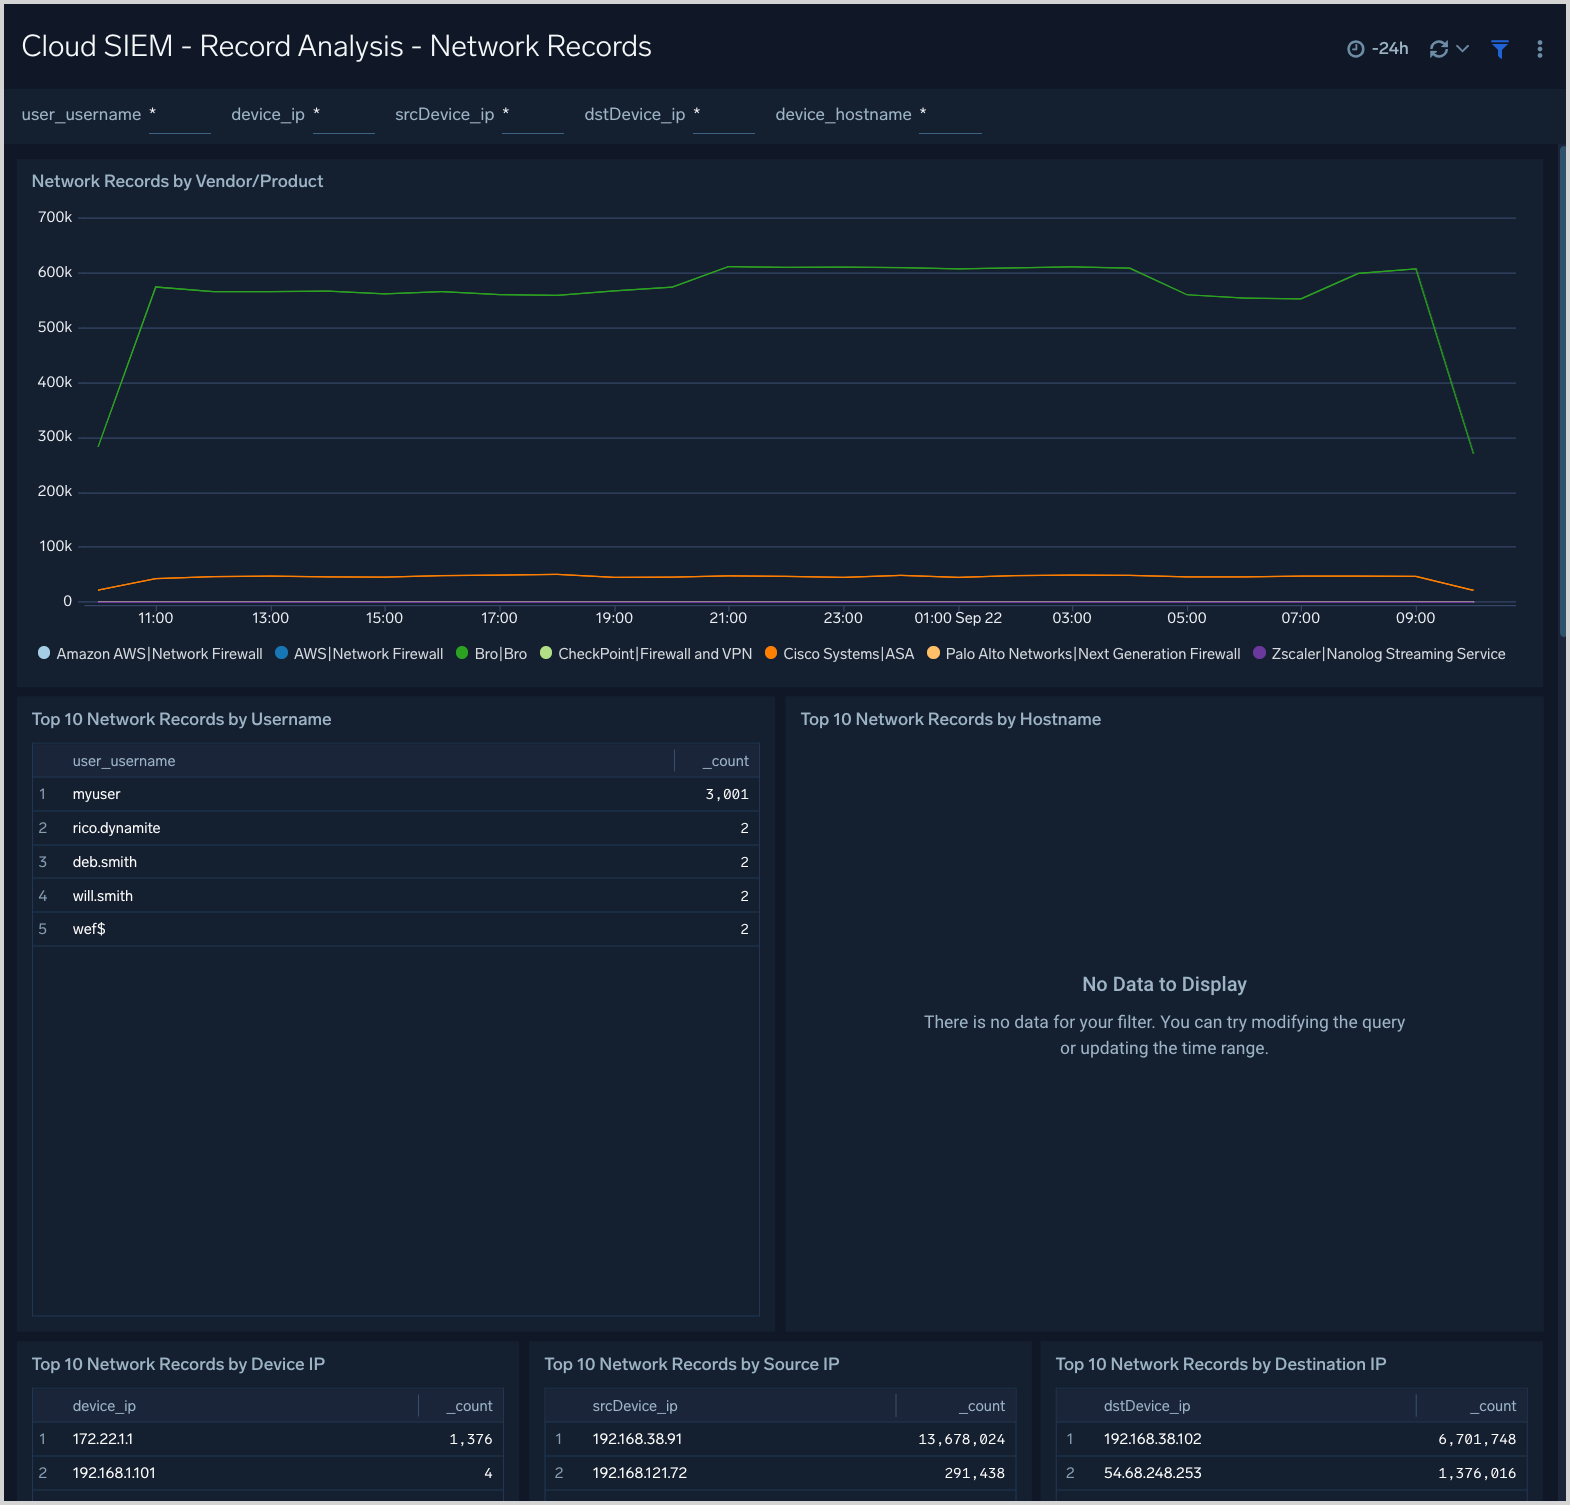
Cloud SIEM - Record Analysis - Network Records
The Cloud SIEM - Record Analysis - Network Records dashboard displays metrics about records created by Cloud SIEM of the type Network. Typically, this record type is used for messages from log sources that describe network events.
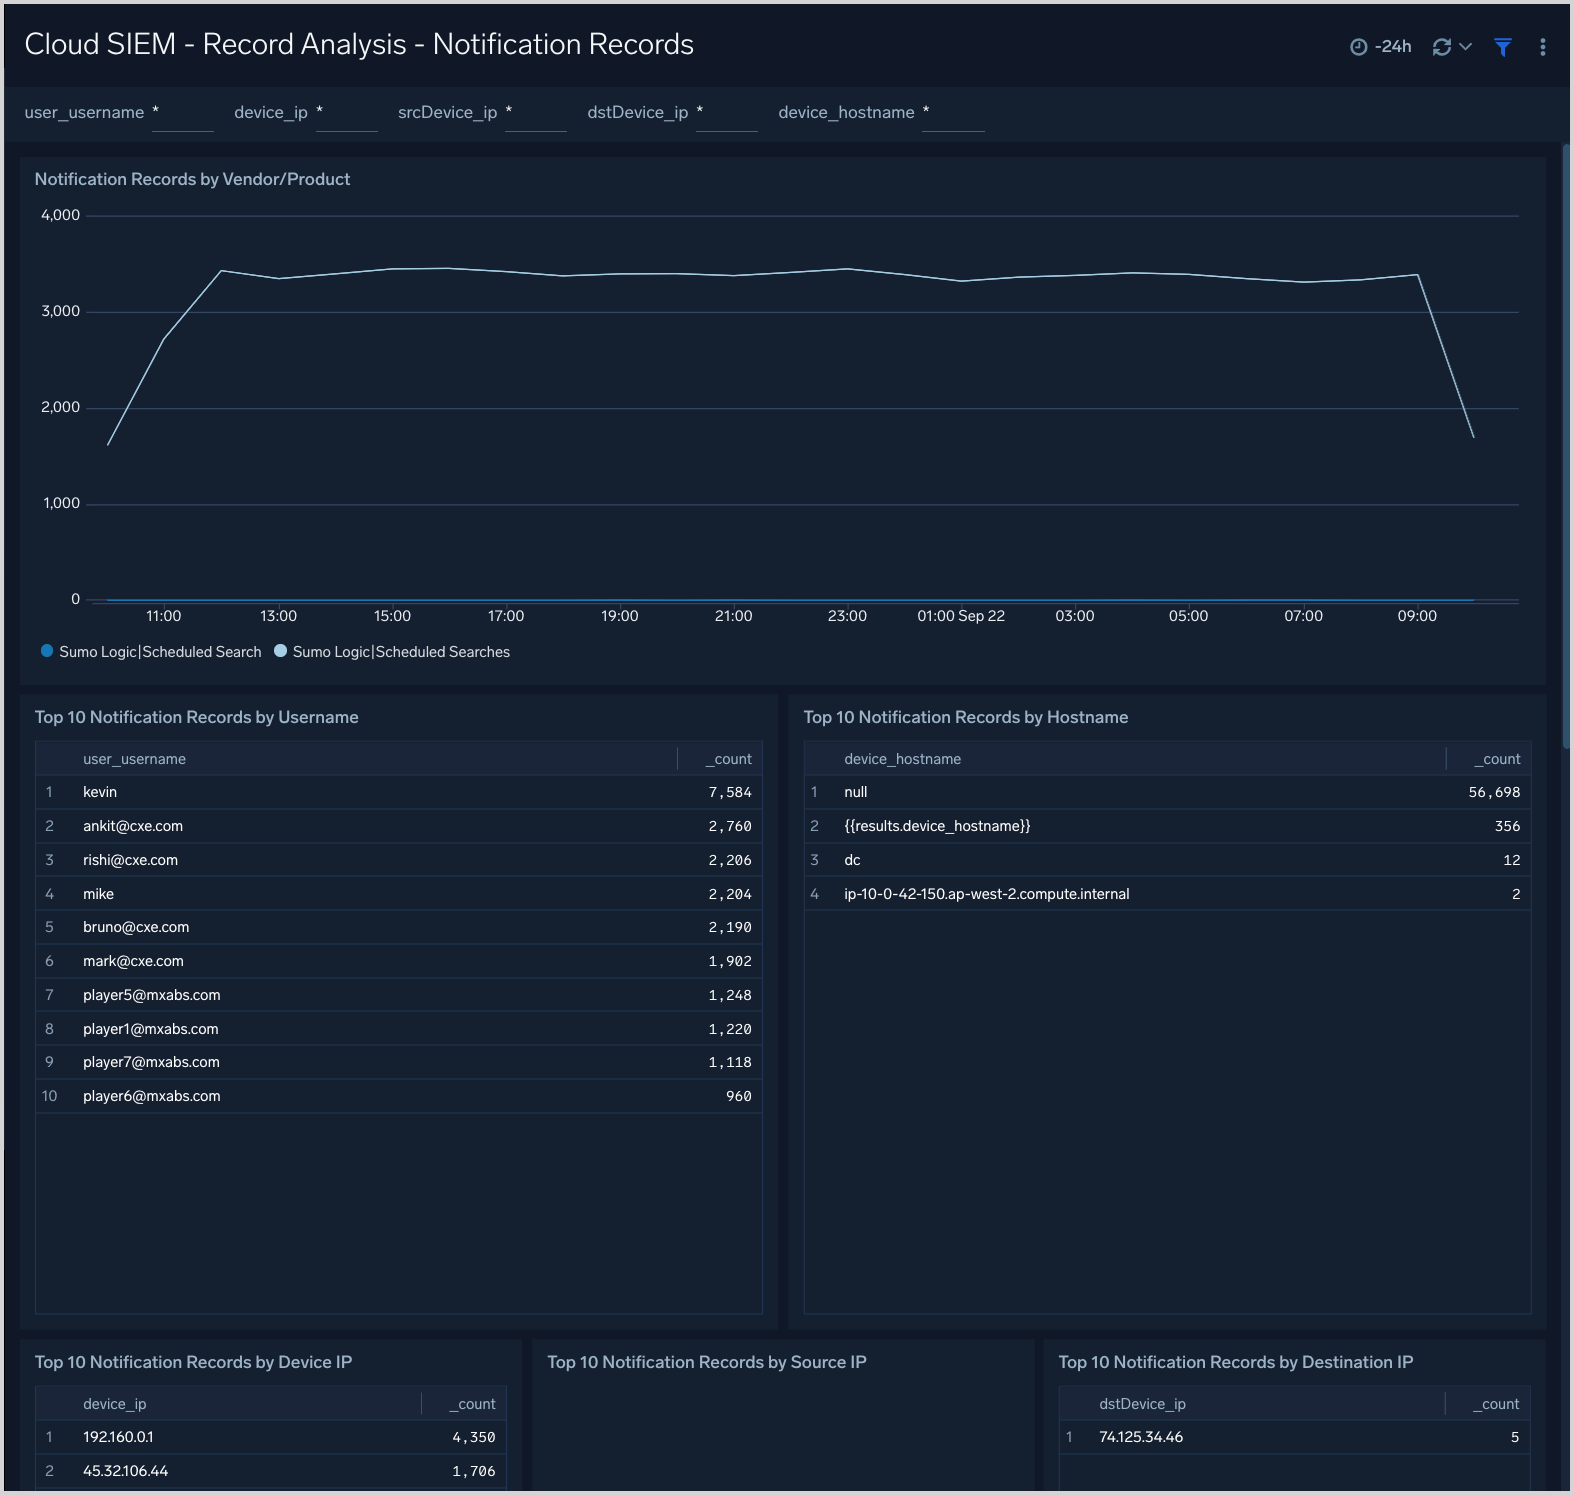
Cloud SIEM - Record Analysis - Notification Records
The Cloud SIEM - Record Analysis - Notification Records dashboard displays metrics about records created by Cloud SIEM of the type Notification. Typically, this record type is used for messages from services that issue notifications or alerts, like threat detection and response systems.
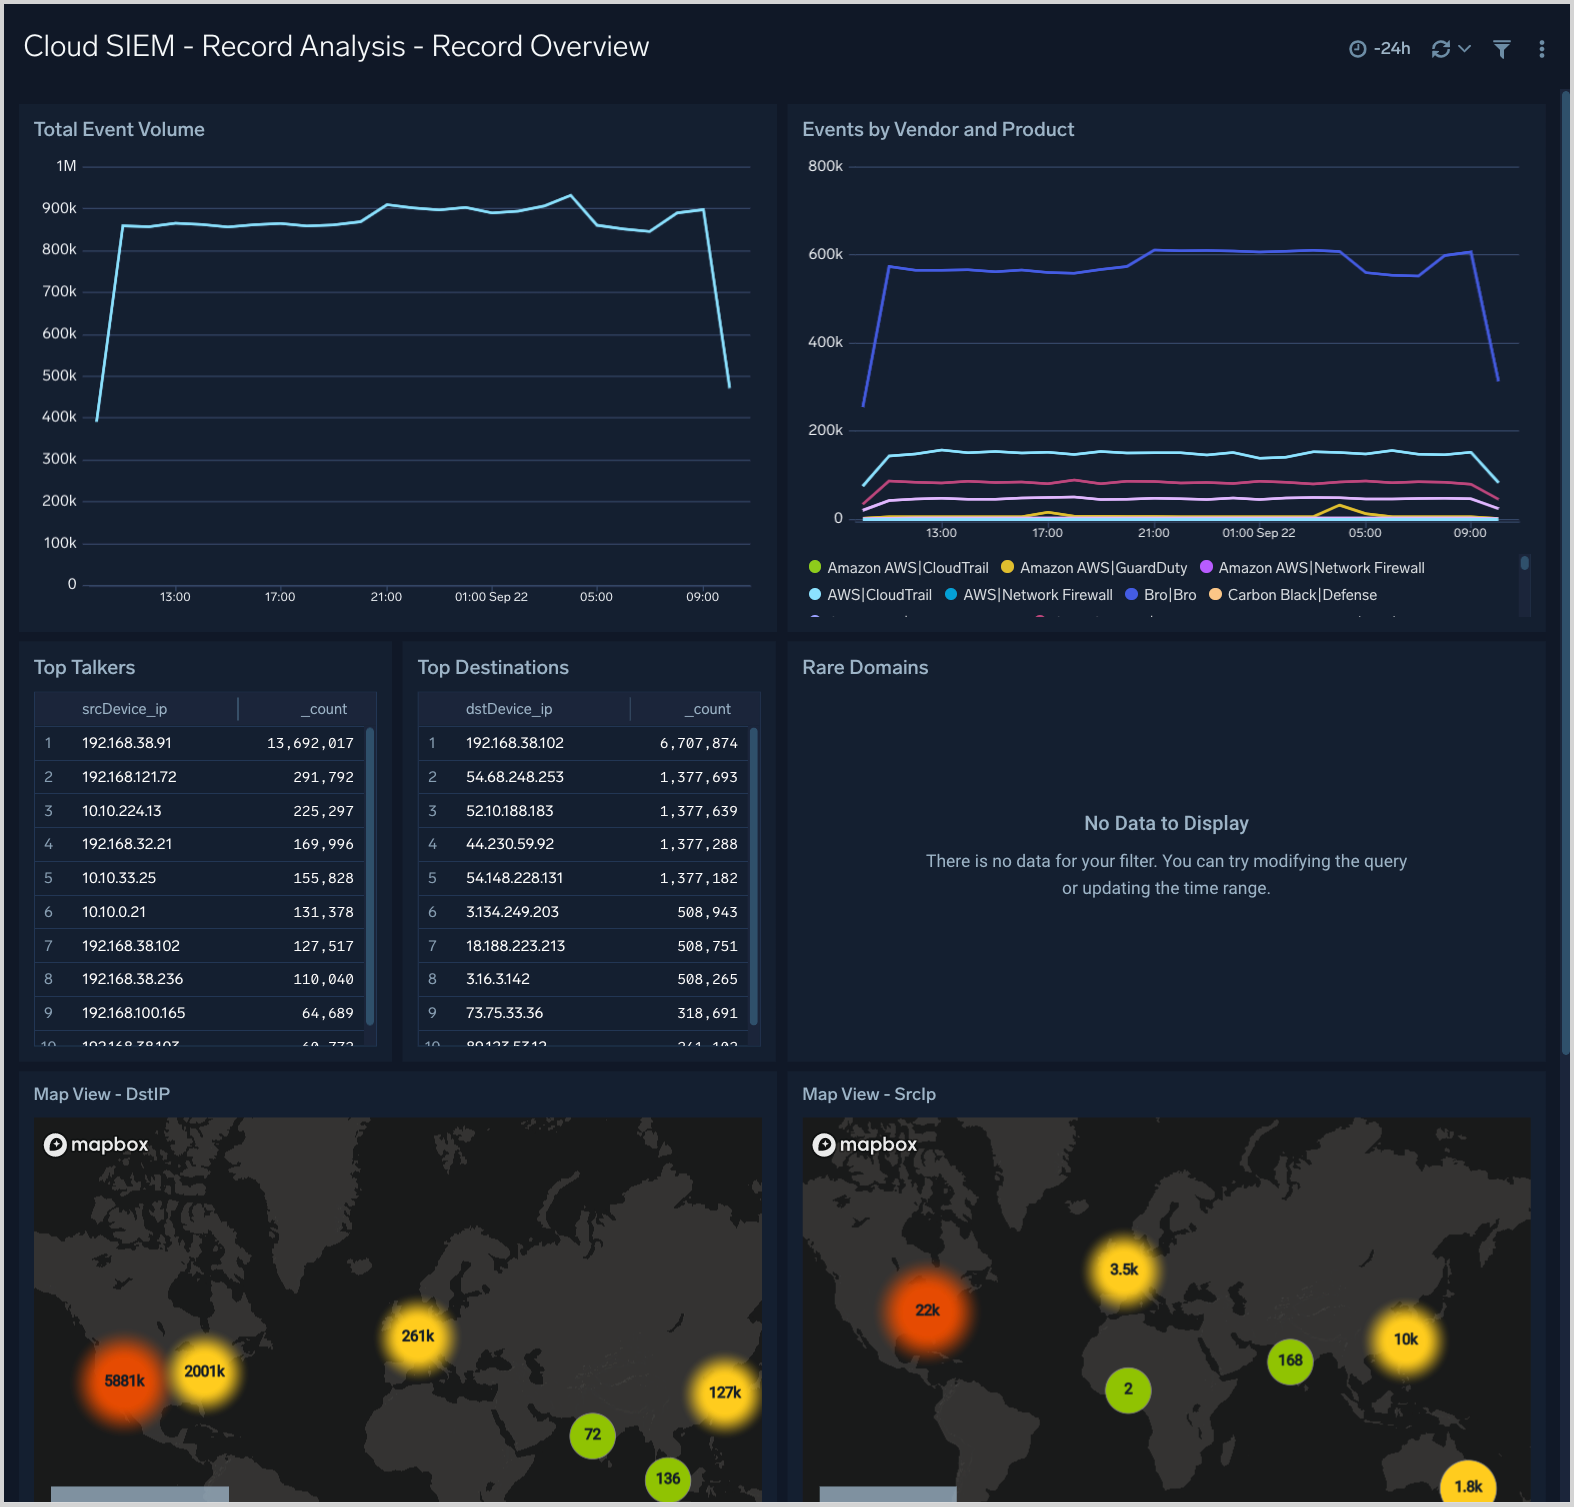
Cloud SIEM - Record Analysis - Record Overview
The Cloud SIEM - Record Analysis - Record Overview dashboard provides an overview of Cloud SIEM records by source, destination, volume, and vendor and product.
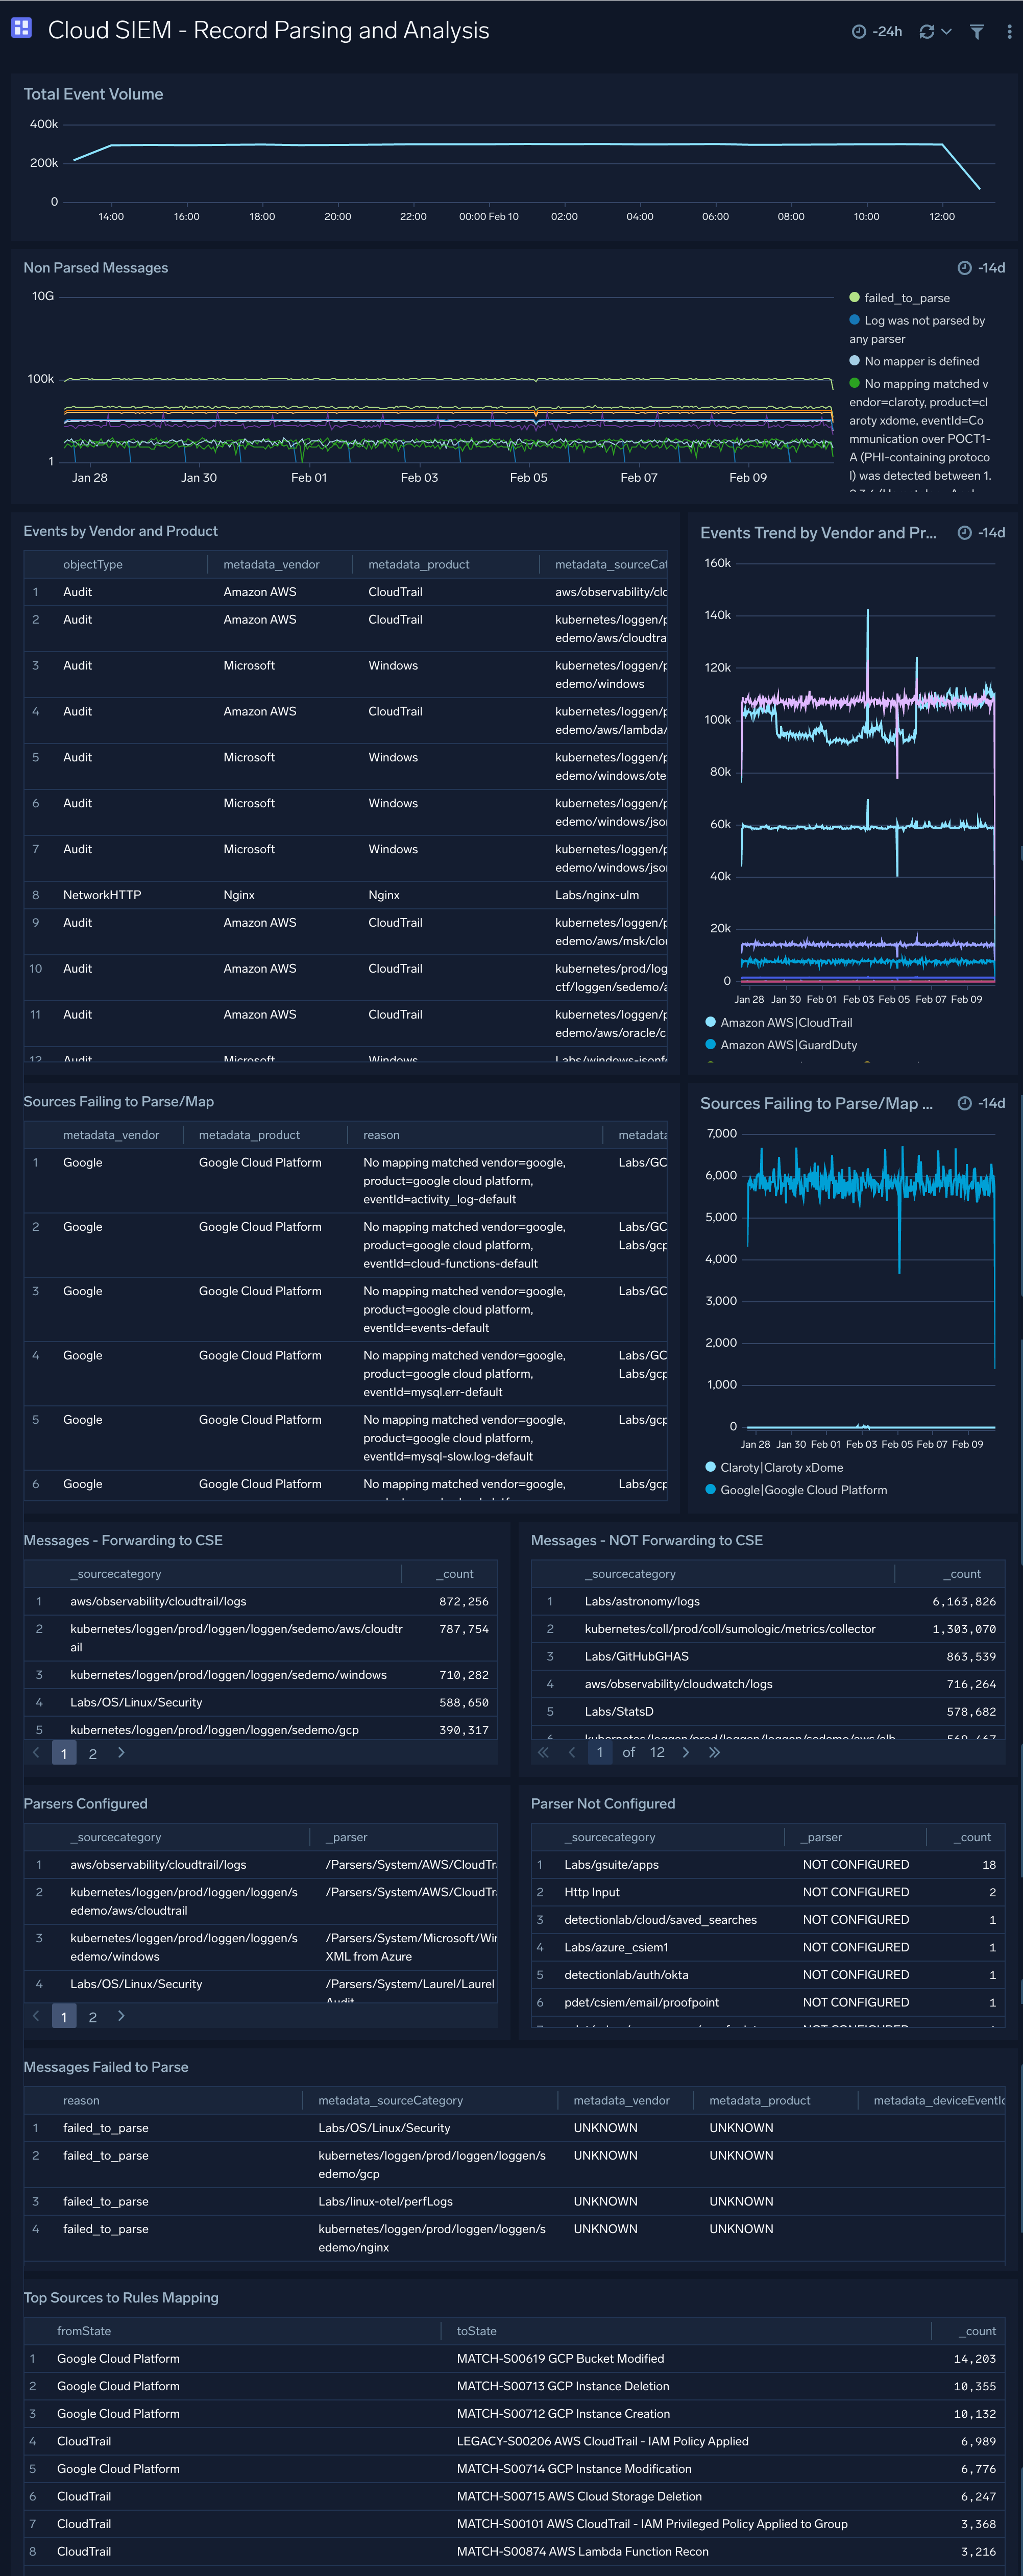
Cloud SIEM - Record Parsing and Analysis
The Cloud SIEM - Record Parsing and Analysis dashboard provides analysis on records parsing.
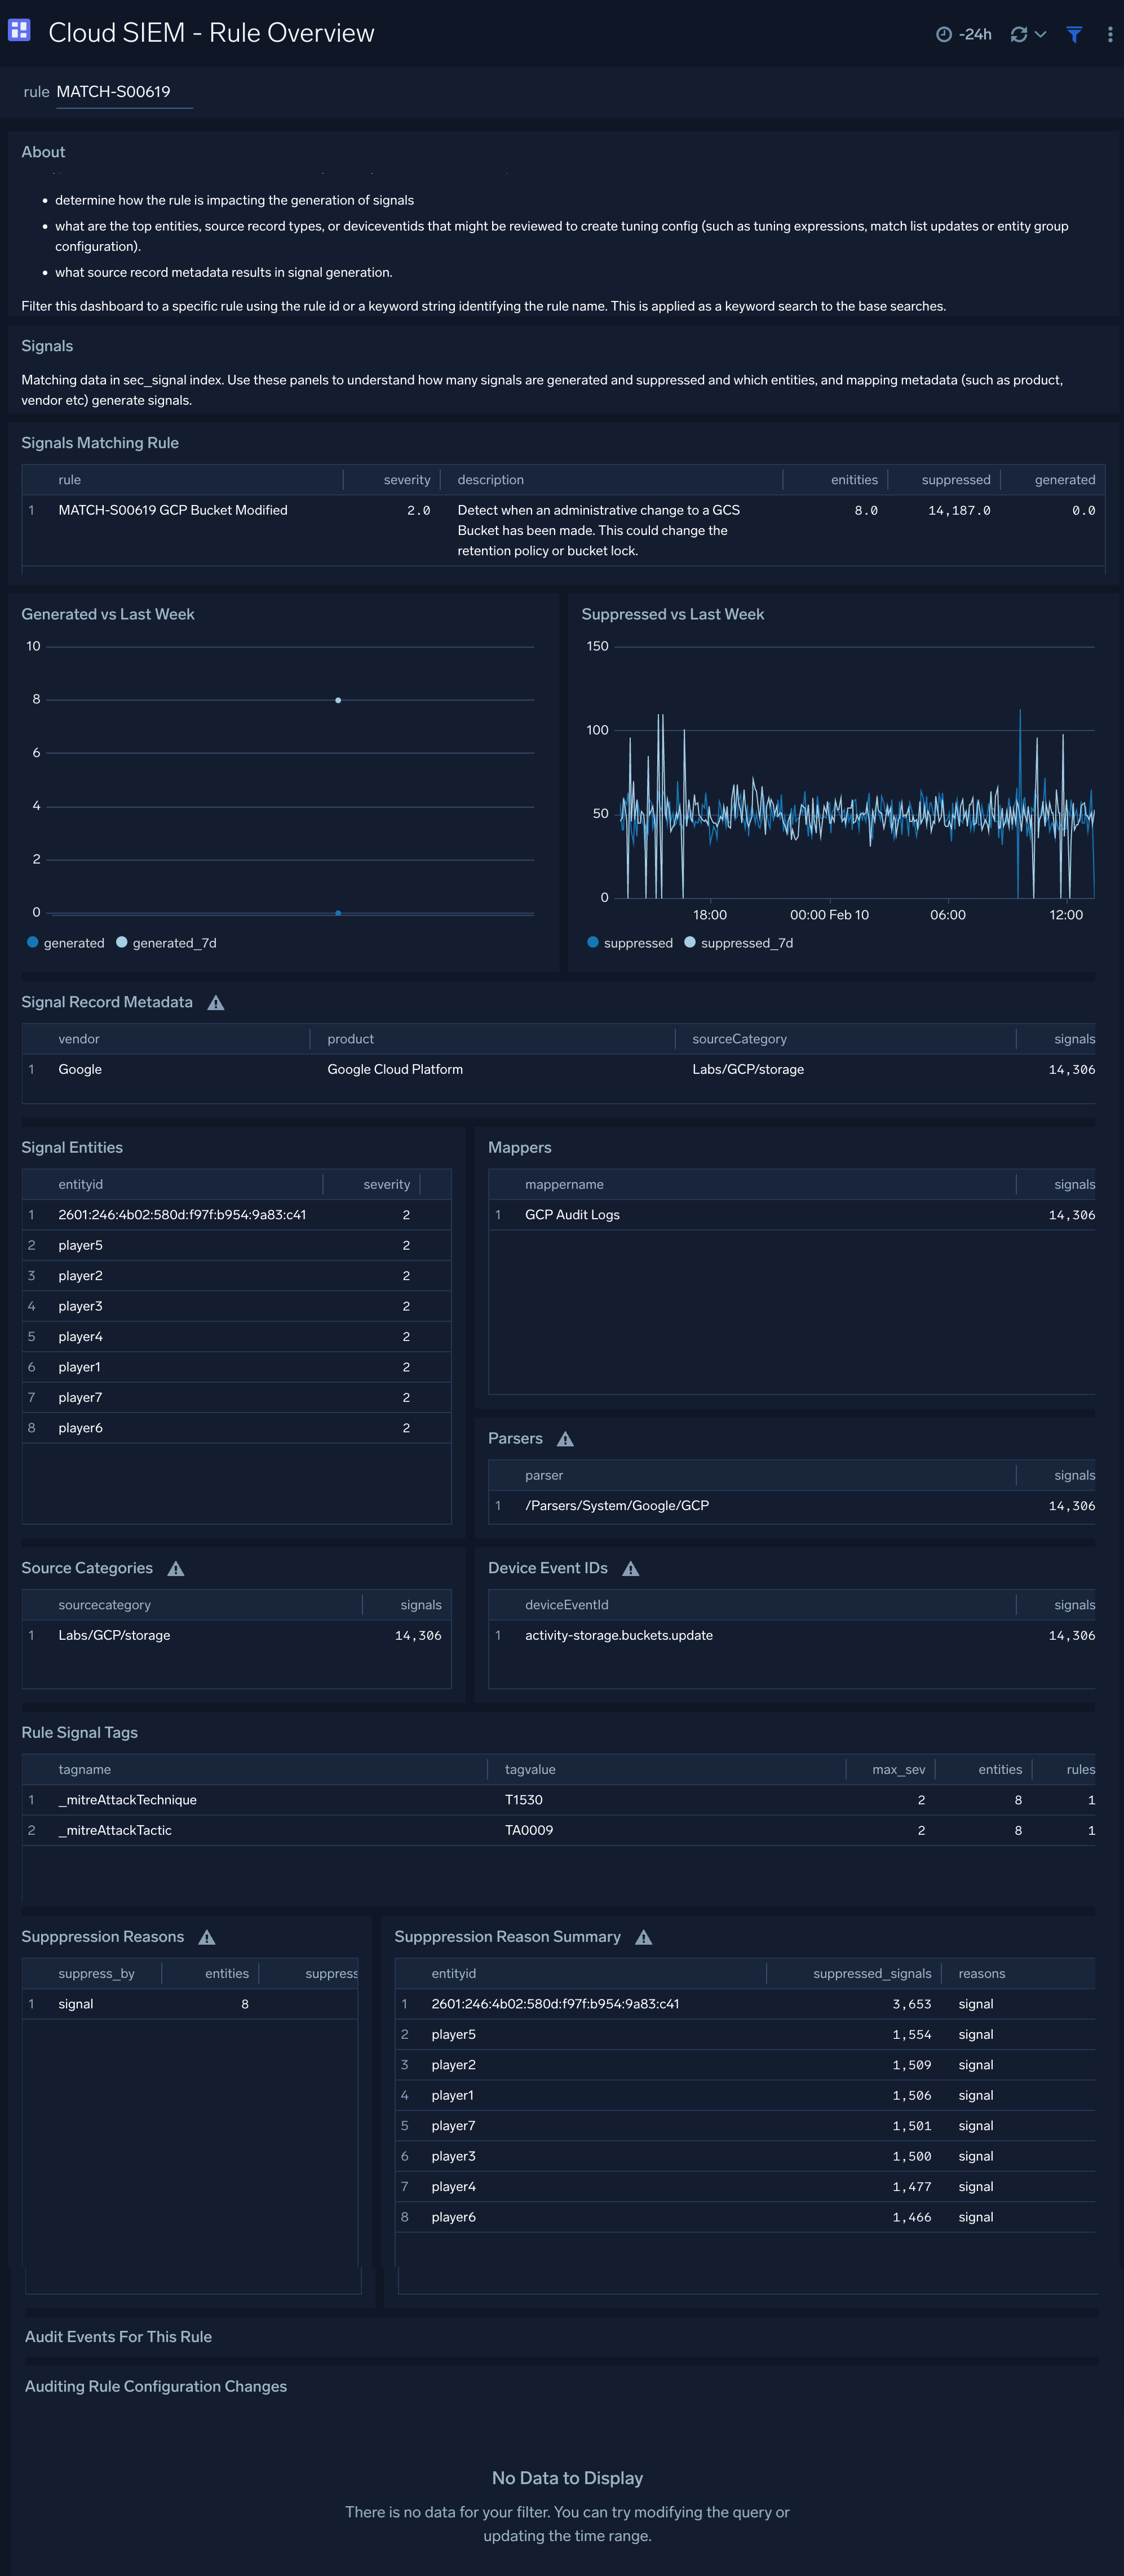
Cloud SIEM - Rule Overview
The Cloud SIEM - Rule Overview dashboard look in depth at a Cloud SIEM rule to assist with rule tuning.
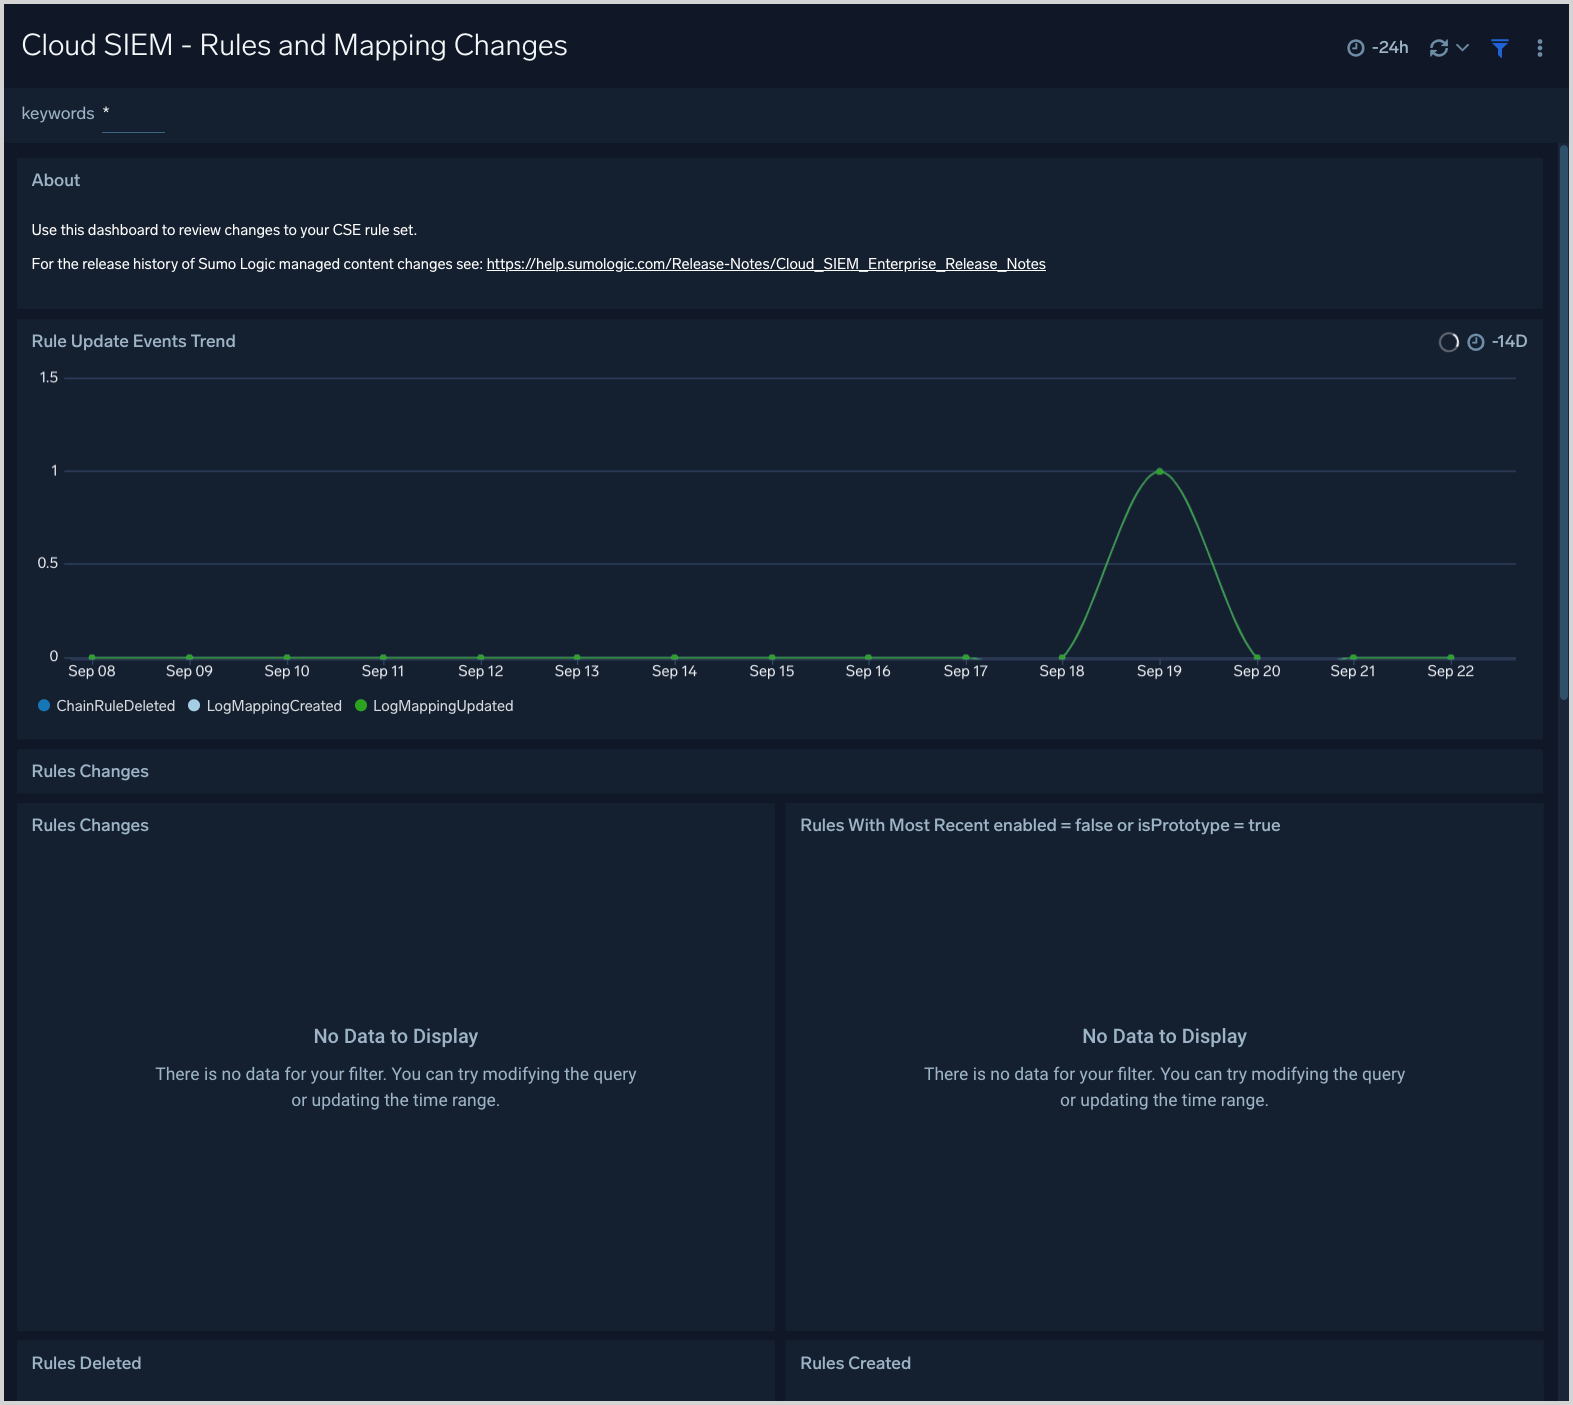
Cloud SIEM - Rules and Mapping Changes
The Cloud SIEM - Rules and Mapping Changes dashboard is useful for monitoring rule management activities. It has information about Cloud SIEM rules, including content management activities like rule creation, modification, and deletion. You can also see more detailed information about rule management events, such as the associated user, and the rule’s enablement and prototype status.
Cloud SIEM - Security Operations Overview
The Cloud SIEM - Security Operations Overview dashboard explores Cloud SIEM insights using Sumo Logic audit events.
Cloud SIEM - Signal Analysis
The Cloud SIEM - Signal Analysis dashboard presents metrics about signals that have been fired, including breakdowns by rule, host, and IP address.
Cloud SIEM - Signal Analysis - Rules
The Cloud SIEM - Signal Analysis - Rules dashboard provides trend analysis of triggered rules, rules by match expression and top rules triggered.
Cloud SIEM - Signal Monitoring
The Cloud SIEM - Signal Monitoring dashboard provides times-based metrics for Cloud SIEM signals, and signal disappearance metrics.
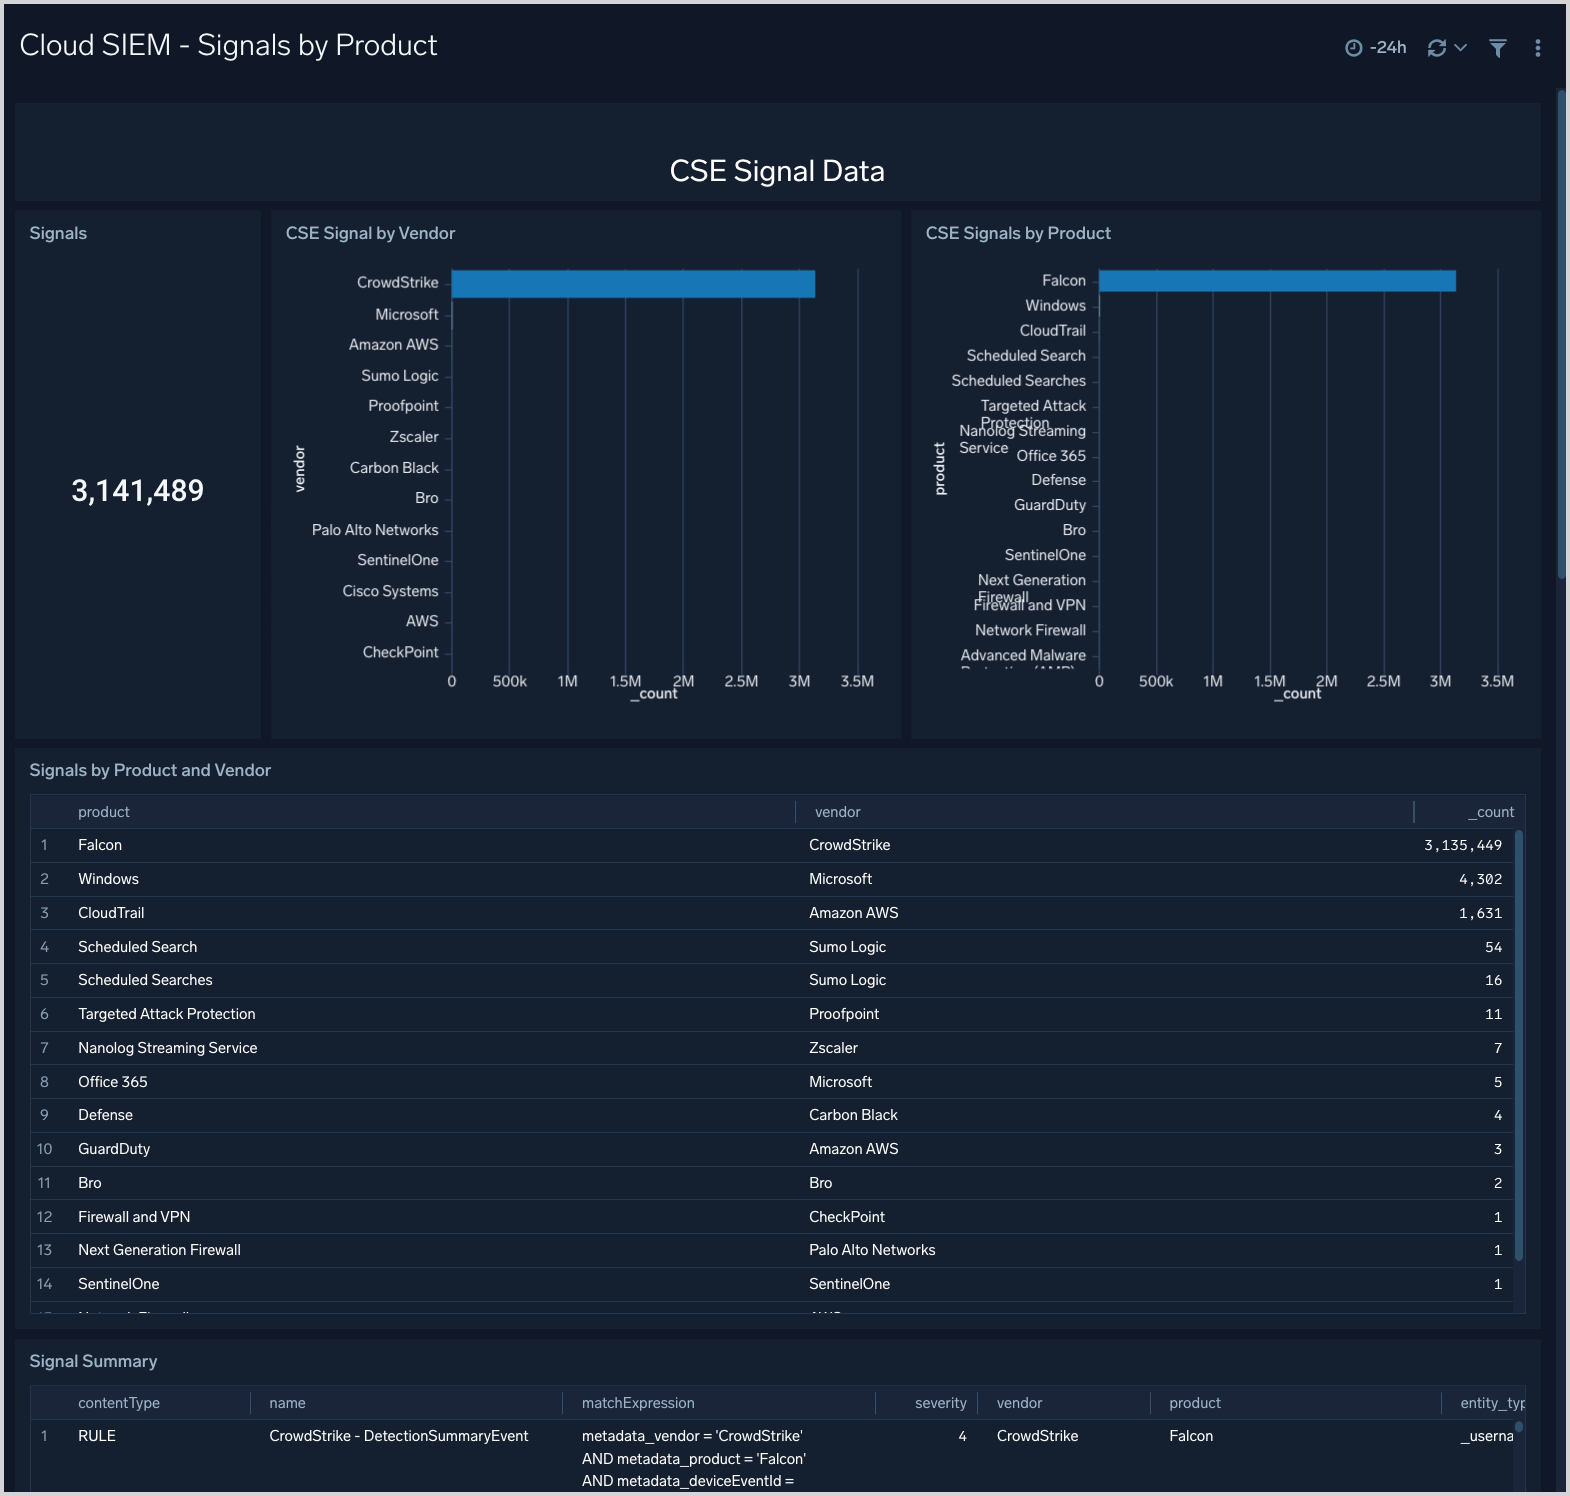
Cloud SIEM - Signals by Product
The Cloud SIEM - Signals by Product dashboard shows breakdowns of signal by product and vendor.
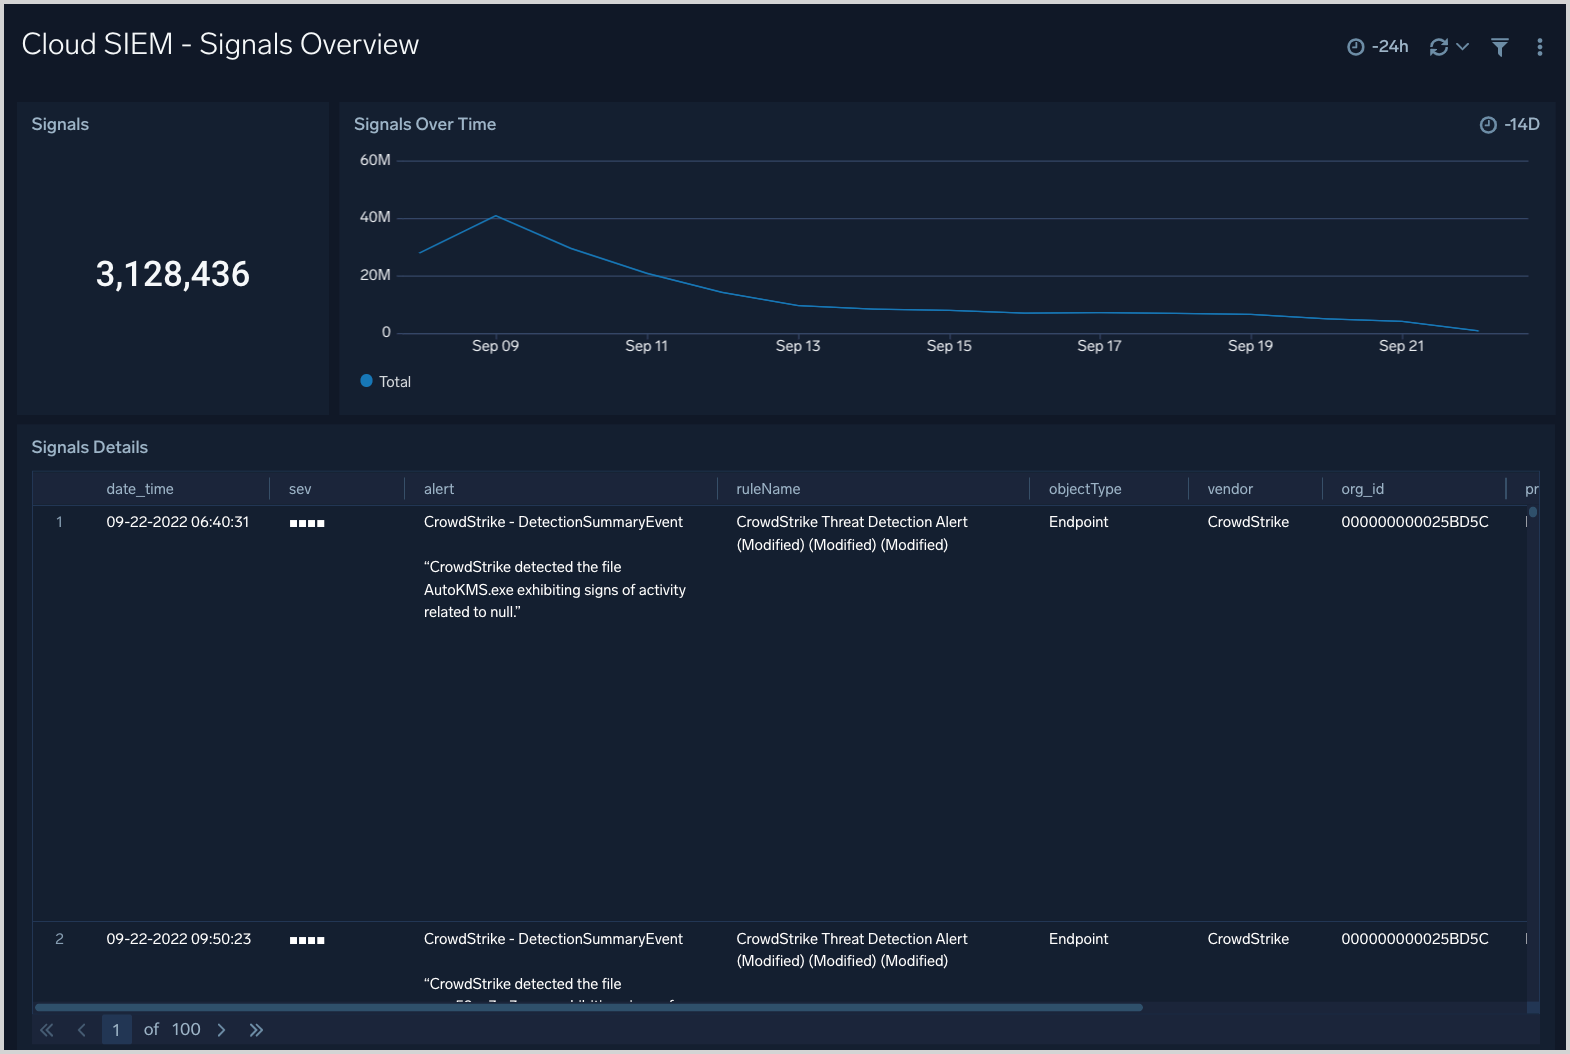
Cloud SIEM - Signals Overview
The Cloud SIEM - Signal Overview dashboard provides an overview of signal activity, including signal count over time, and a table of summary information for generated signals.
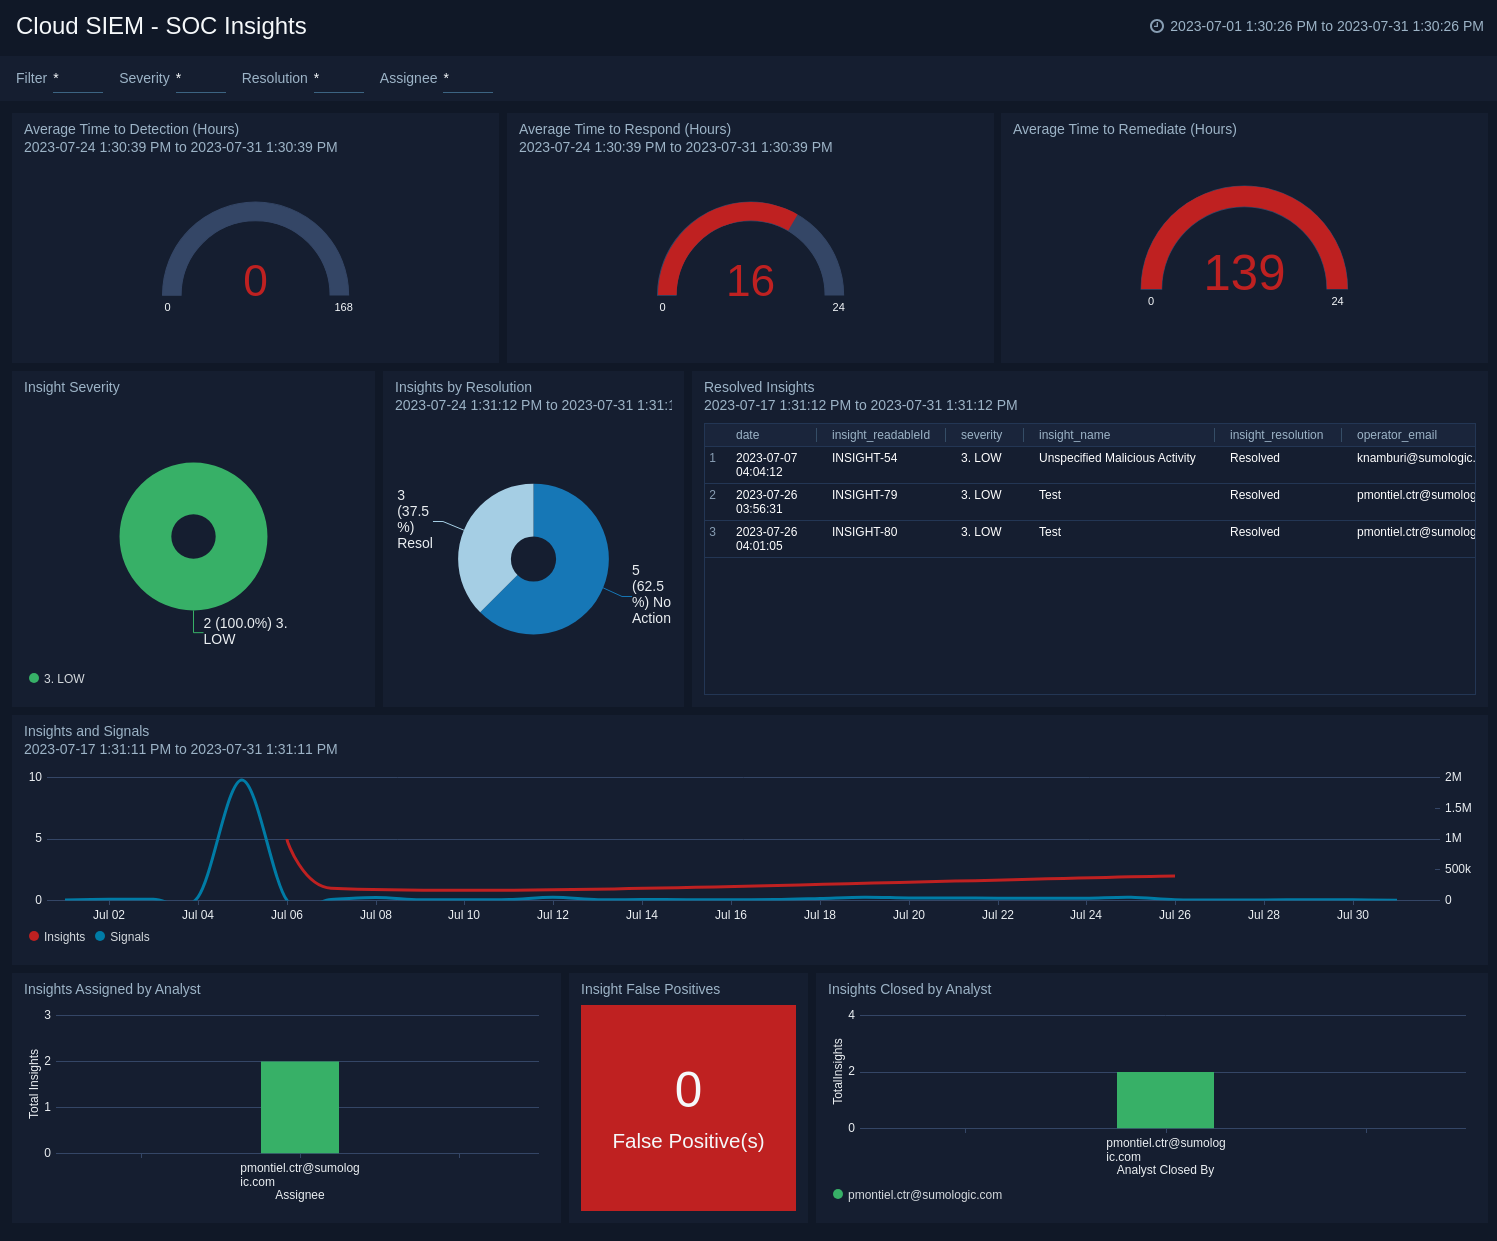
Cloud SIEM - SOC Insights
The Cloud SIEM - SOC Insights dashboard shows breakdowns of SOC insights.
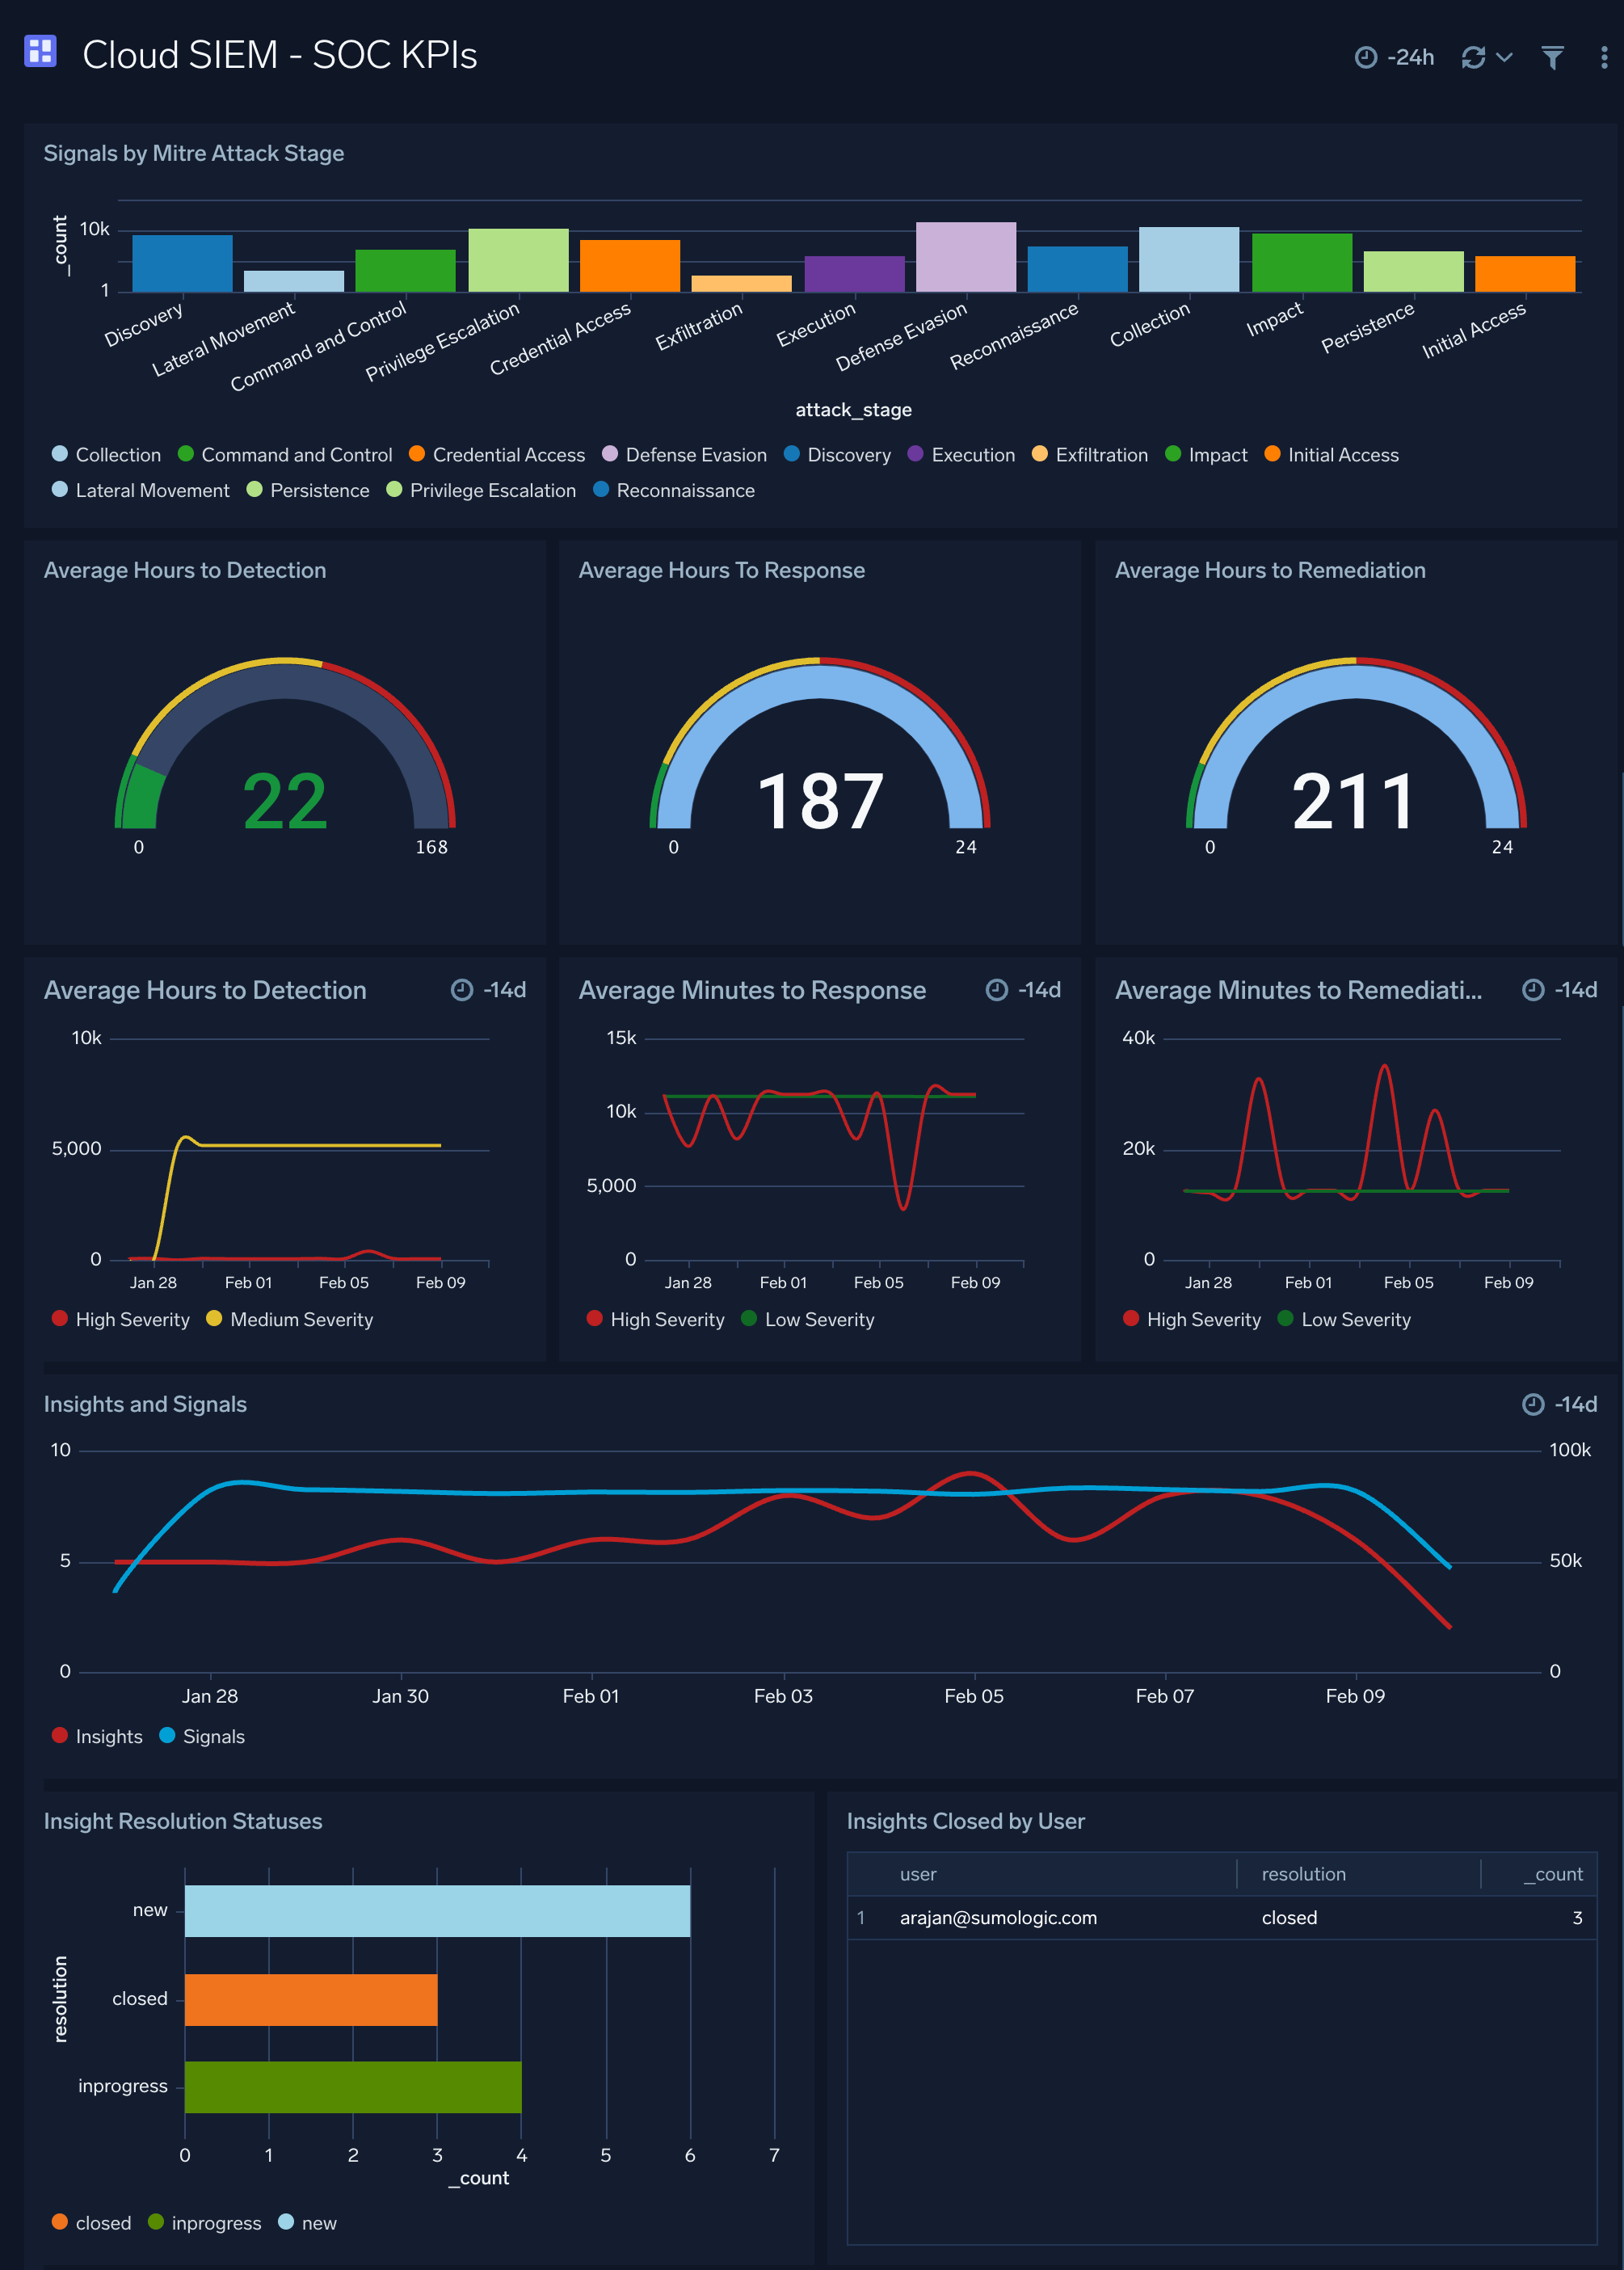
Cloud SIEM - SOC KPIs
The Cloud SIEM - SOC KPIs dashboard provides SOC KPIs related metrics.
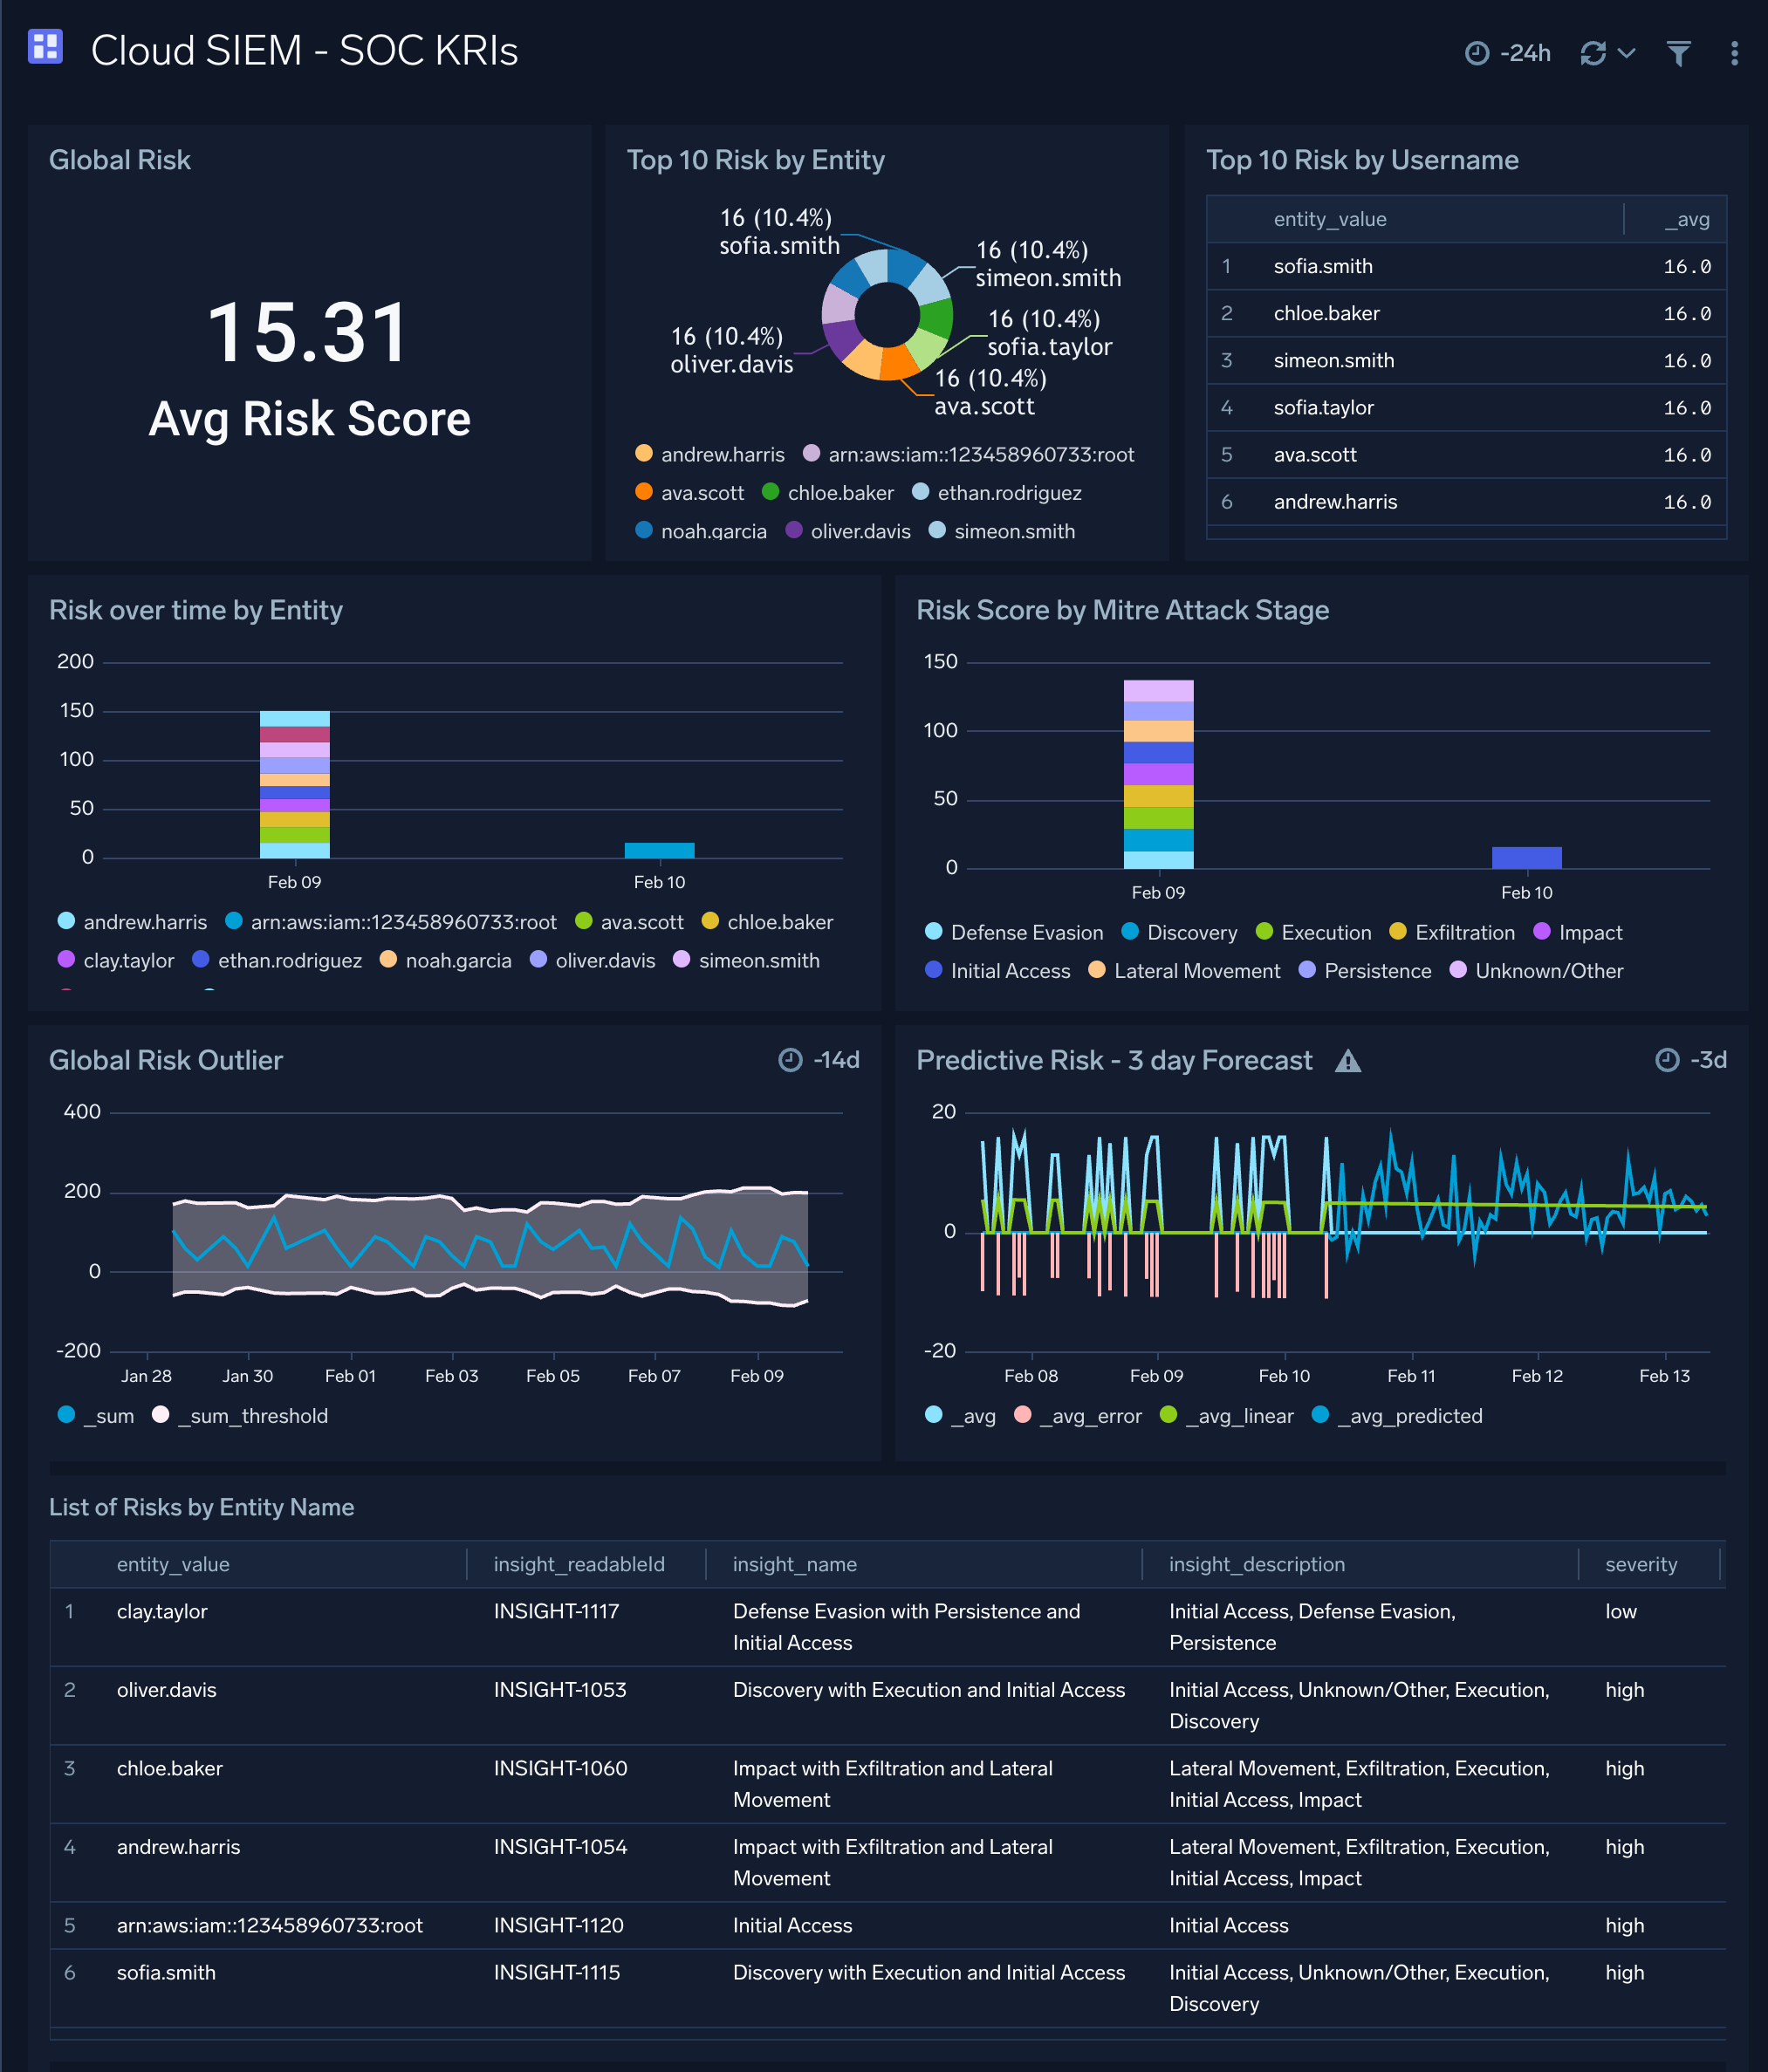
Cloud SIEM - SOC KRIs
The Cloud SIEM - SOC KRIs dashboard provides SOC KRIs related metrics.
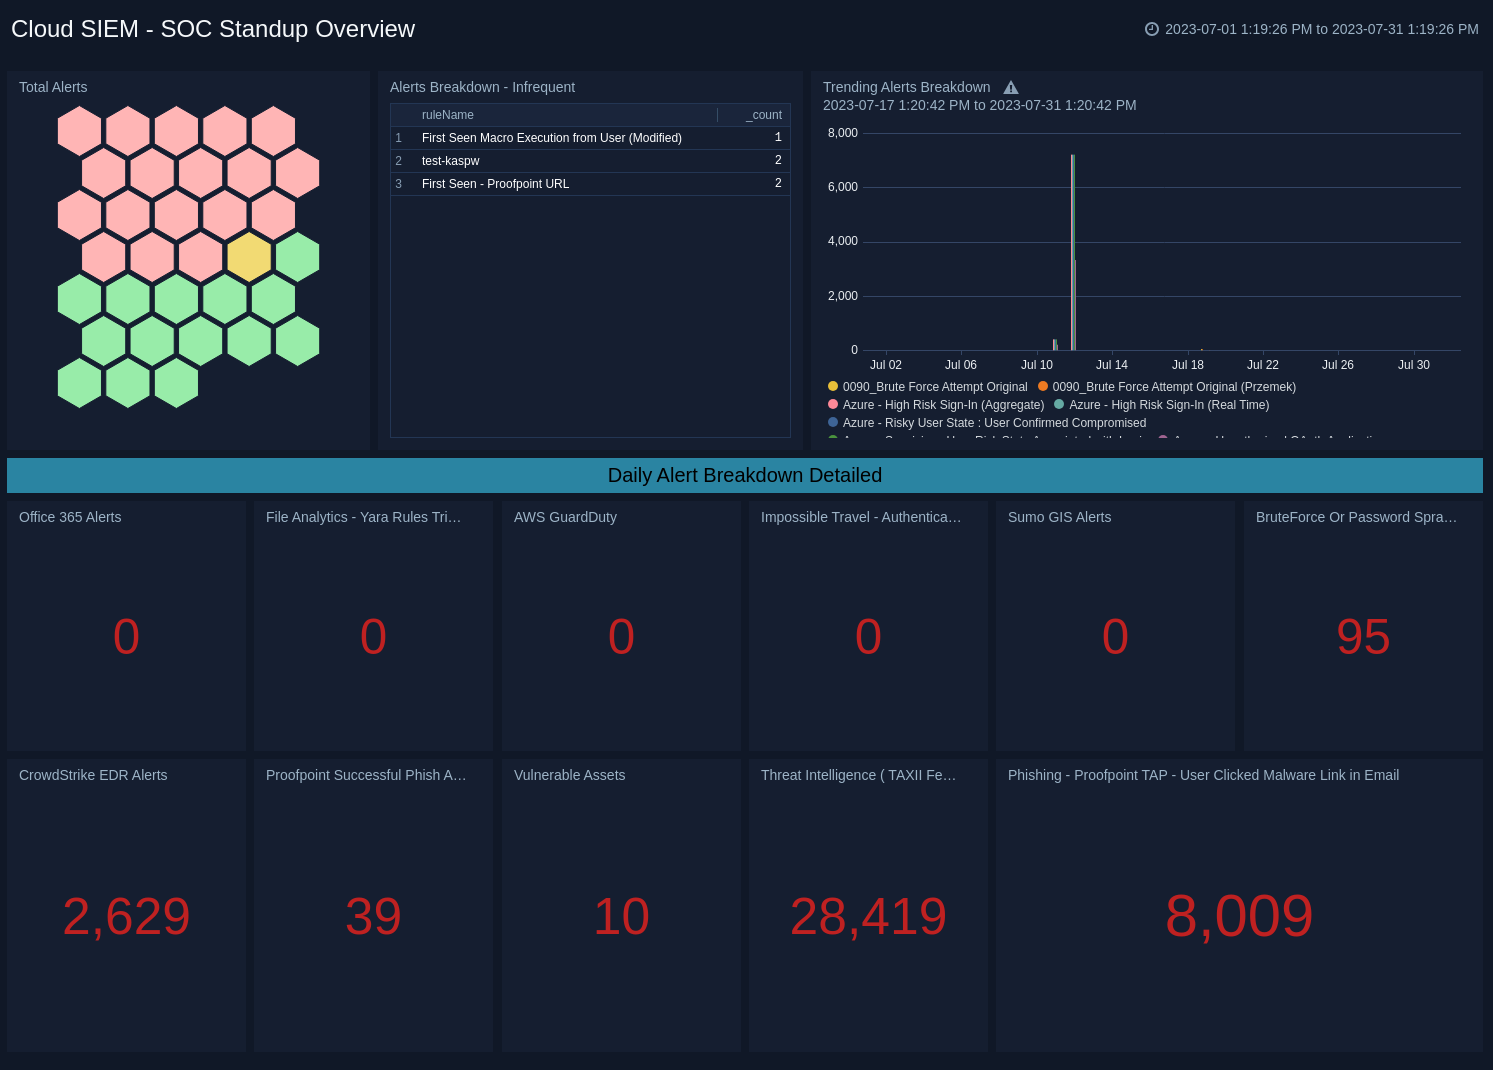
Cloud SIEM - SOC Standup Overview
The Cloud SIEM - SOC Standup Overview dashboard provides an overview of total alerts, infrequent alerts breakdown, trending alerts breakdown, and detailed daily alerts breakdow.
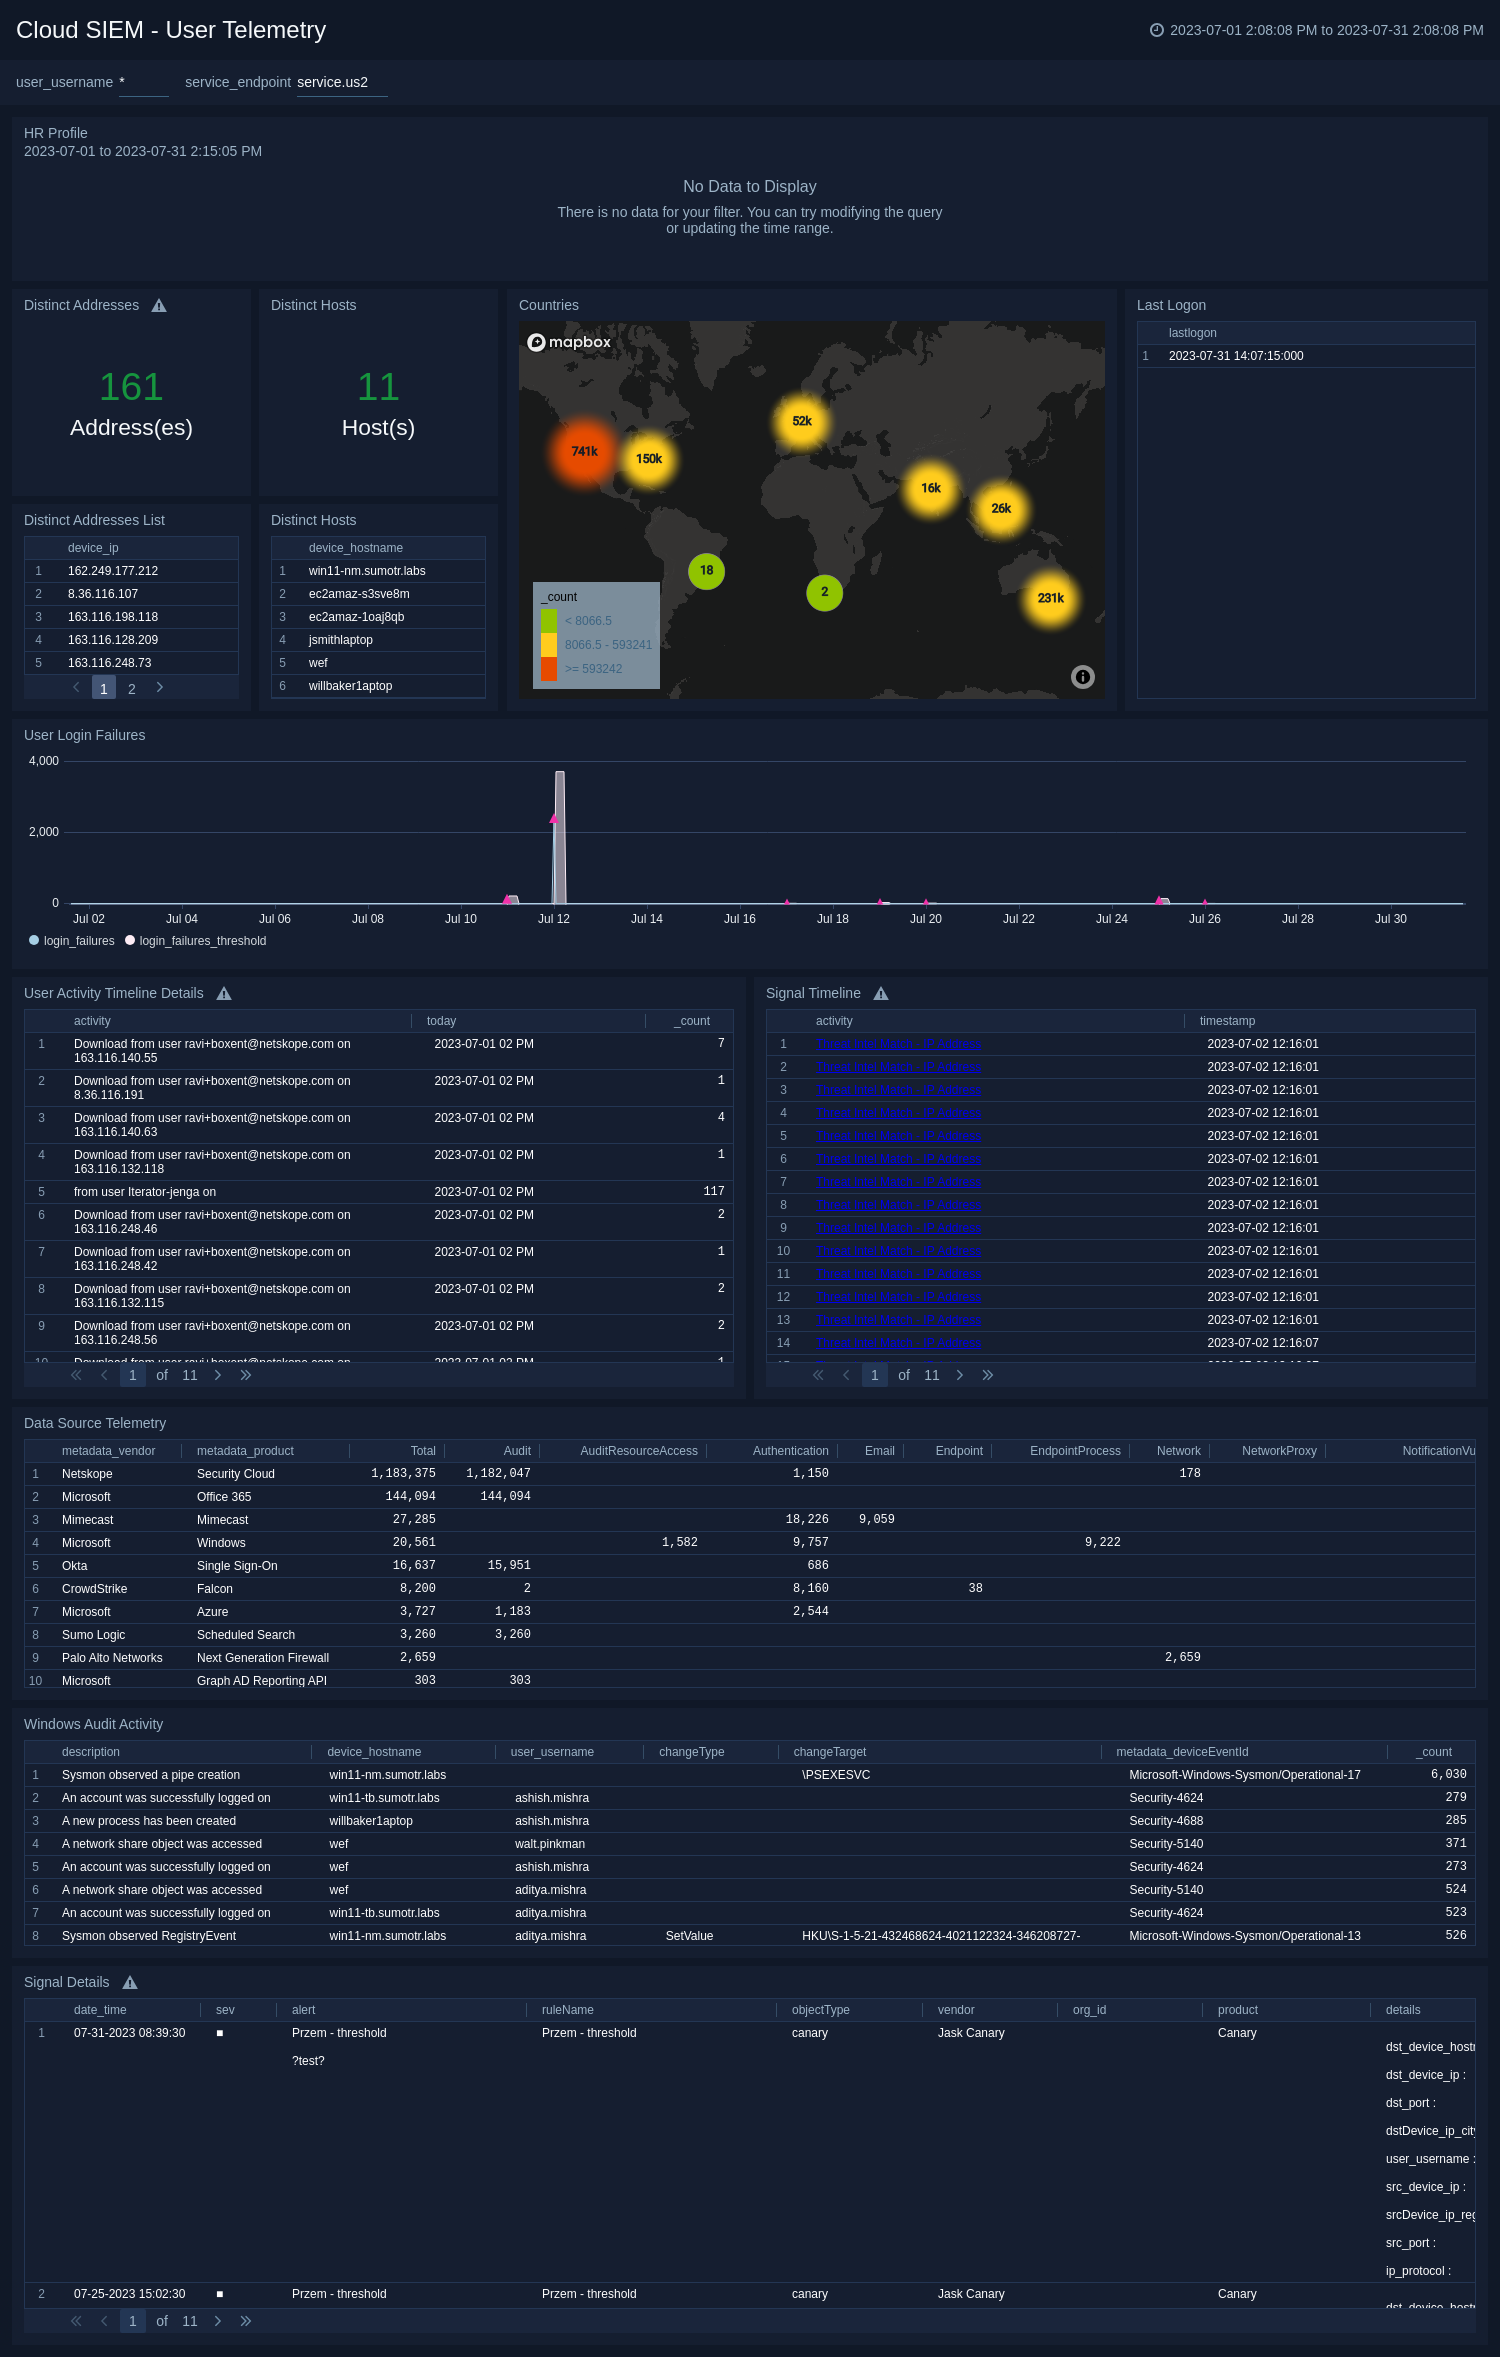
Cloud SIEM - User Telemetry
The Cloud SIEM - User Telemetry dashboard shows breakdowns of Cloud SIEM user telemetry.
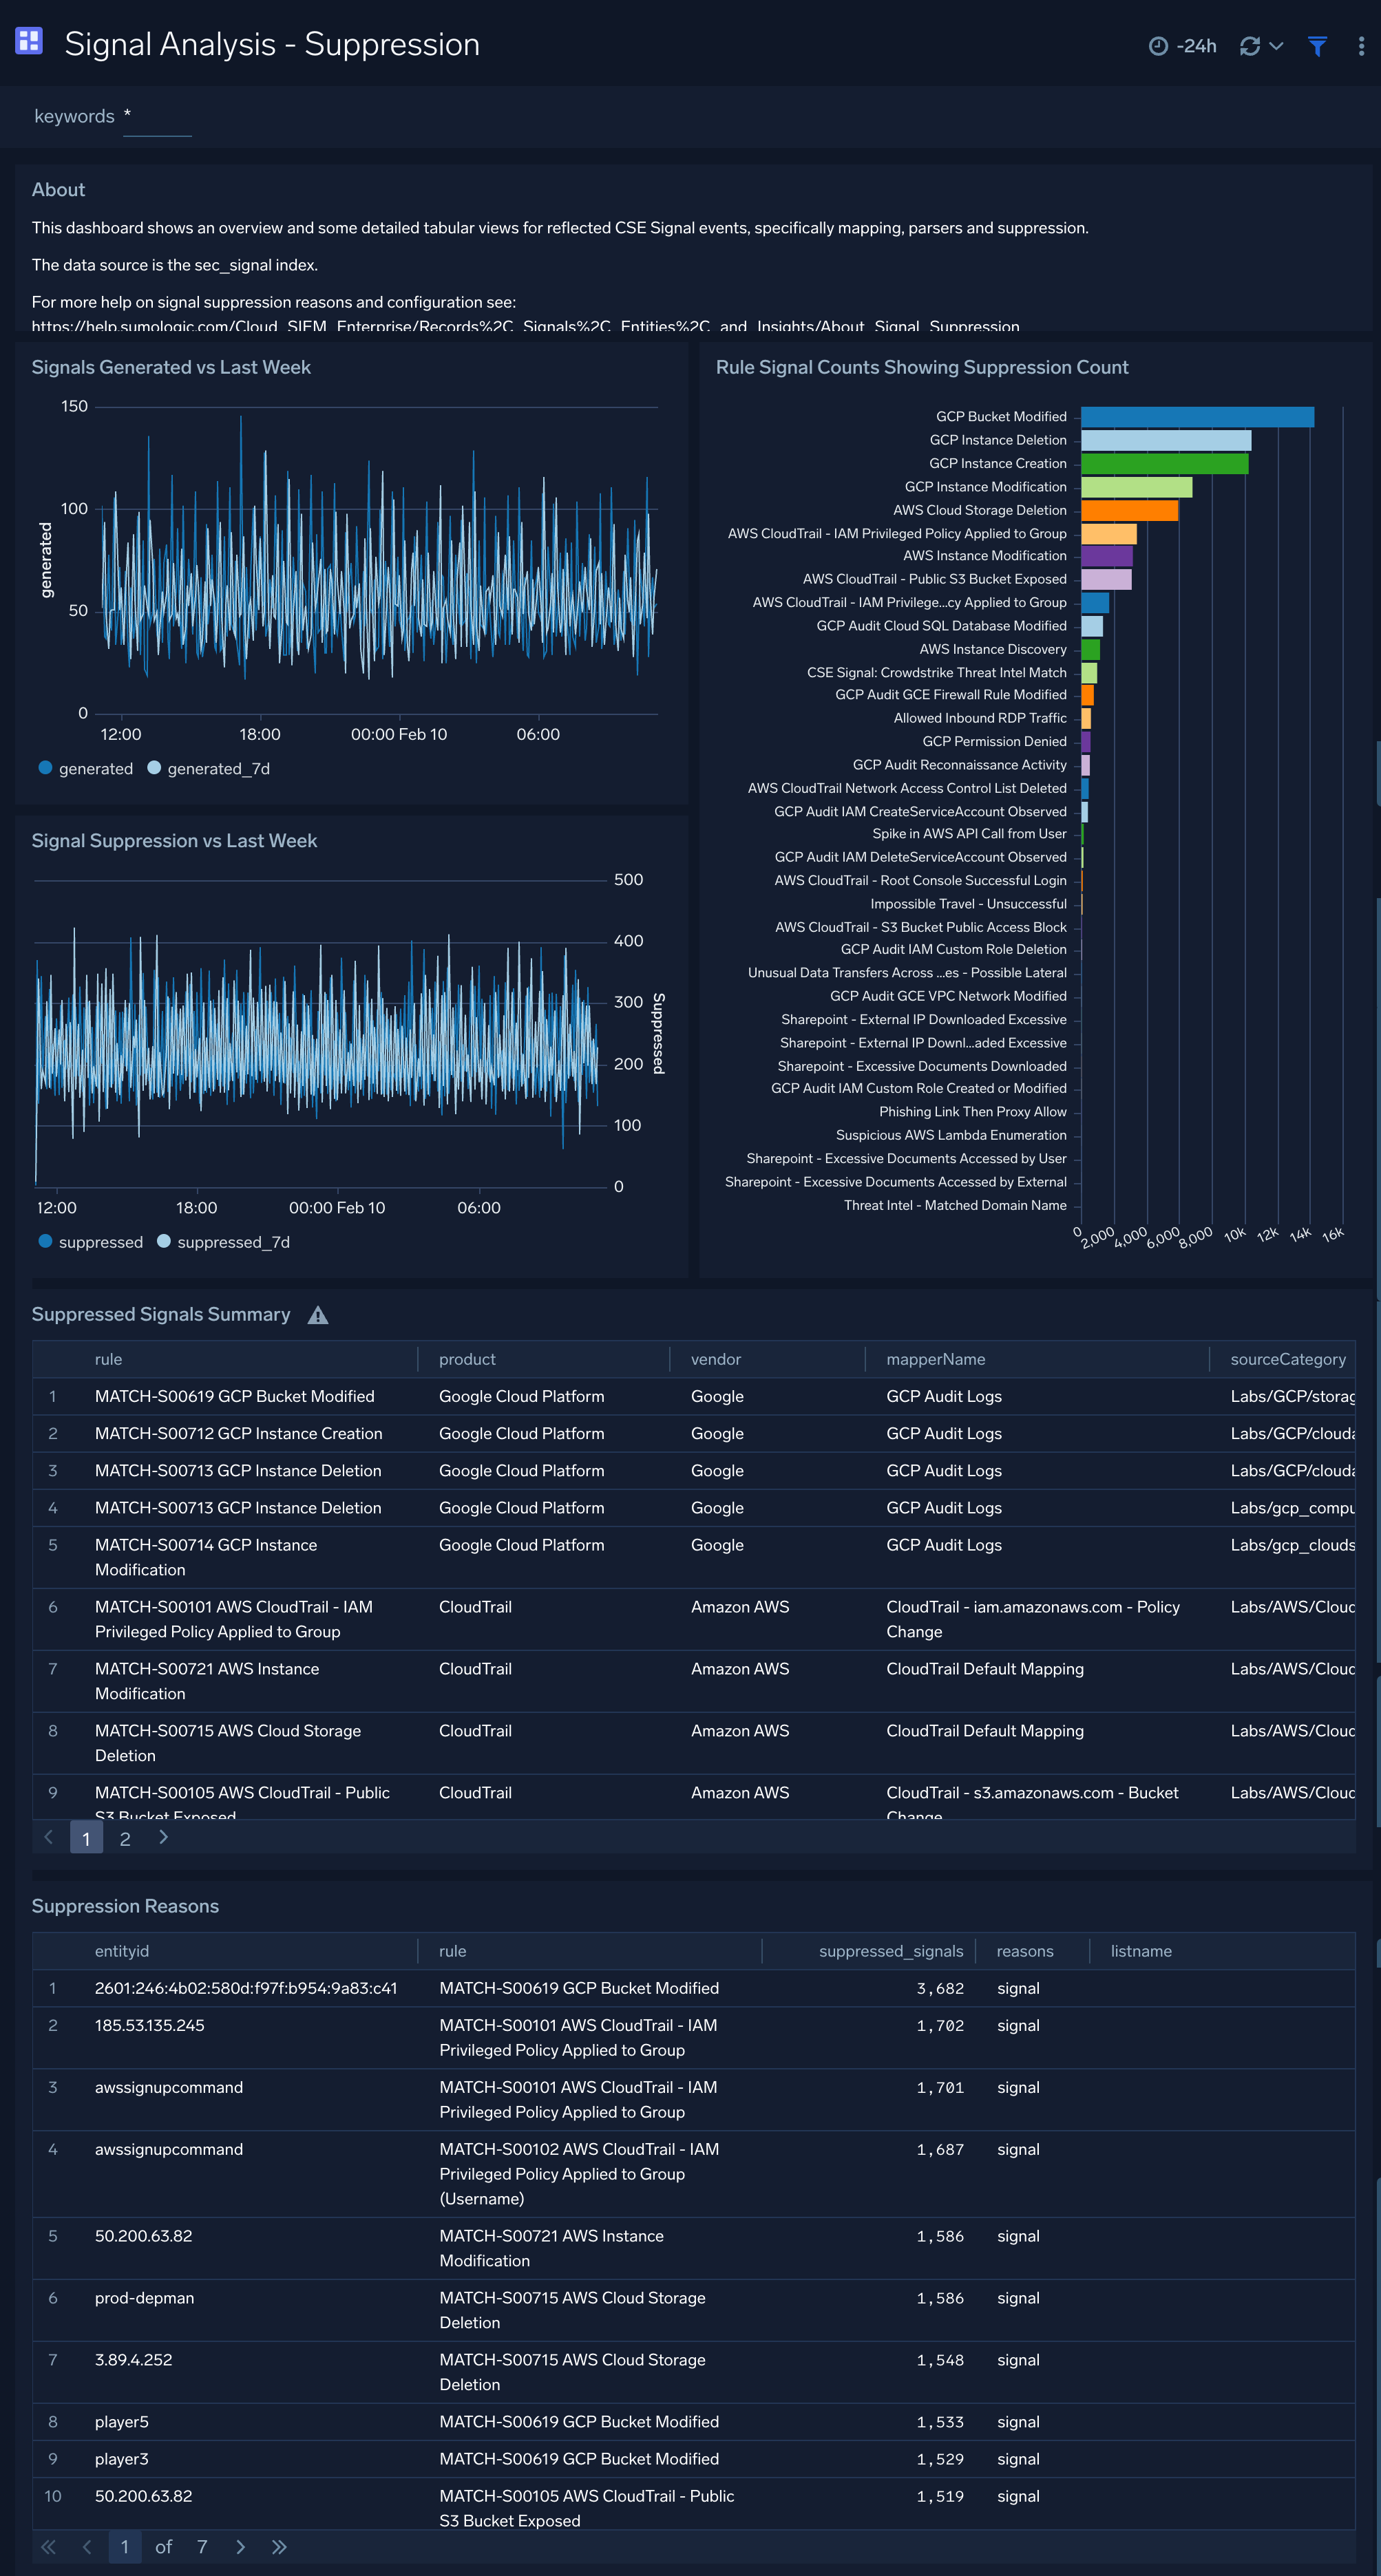
Signal Analysis - Suppression
The Signal Analysis - Suppression dashboard shows an overview and some detailed tabular views for reflected Cloud SIEM signal events, specifically mapping, parsers, and suppression.
Upgrade/Downgrade the Enterprise Audit - Cloud SIEM app (Optional)
To update the app, do the following:
Next-Gen App: To install or update the app, you must be an account administrator or a user with Manage Apps, Manage Monitors, Manage Fields, Manage Metric Rules, and Manage Collectors capabilities depending upon the different content types part of the app.
- Select App Catalog.
- In the Search Apps field, search for and then select your app.
Optionally, you can identify apps that can be upgraded in the Upgrade available section. - To upgrade the app, select Upgrade from the Manage dropdown.
- If the upgrade does not have any configuration or property changes, you will be redirected to the Preview & Done section.
- If the upgrade has any configuration or property changes, you will be redirected to the Setup Data page.
- In the Configure section of your respective app, complete the following fields.
- Field Name. If you already have collectors and sources set up, select the configured metadata field name (eg _sourcecategory) or specify other custom metadata (eg: _collector) along with its metadata Field Value.
- Click Next. You will be redirected to the Preview & Done section.
Post-update
Your upgraded app will be installed in the Installed Apps folder and dashboard panels will start to fill automatically.
See our Release Notes changelog for new updates in the app.
To revert the app to a previous version, do the following:
- Select App Catalog.
- In the Search Apps field, search for and then select your app.
- To version down the app, select Revert to < previous version of your app > from the Manage dropdown.
Uninstalling the Enterprise Audit - Cloud SIEM app (Optional)
To uninstall the app, do the following:
- Select App Catalog.
- In the 🔎 Search Apps field, run a search for your desired app, then select it.
- Click Uninstall.