OpenTelemetry Collector Insights
The Sumo Logic OpenTelemetry Collector Insights app provides comprehensive monitoring and observability for your OpenTelemetry Collector instances. Monitor collector performance, telemetry data flow, resource utilization, and troubleshoot data collection issues with preconfigured dashboards and alerts. Track metrics and logs to ensure your telemetry pipeline is running smoothly and efficiently.
This app supports OpenTelemetry Collector version 0.130.1-sumo-0 and later versions.
We use the OpenTelemetry collector's built-in internal telemetry capabilities to collect metrics and logs about the collector itself. By default, the Collector exposes its own telemetry through internal metrics (via Prometheus interface on port 8888) and logs (emitted to stderr). The collector can also be configured to export its own telemetry data (metrics and logs) to Sumo Logic through OTLP/HTTP endpoints.
Fields creation in Sumo Logic for OpenTelemetry Collector Insights
Following are the fields which will be created as part of OpenTelemetry Collector Insights app installation, if not already present.
sumo.datasource. Has fixed value ofotel_collector._contentType. Has fixed value ofOpenTelemetry.deployment.environment. User configured. Enter a name to identify your deployment environment.
Prerequisites
For OTLP endpoint configuration
Before configuring the OTEL Collector integration, you need to create an OTLP source in your Sumo Logic hosted collector. The OTLP source will provide the endpoint URL that the OTEL Collector will use to send telemetry data. Learn more at Creating a Sumo Logic OTLP Source.
For metrics collection
The OpenTelemetry Collector must be configured to export its own metrics using the built-in telemetry capabilities. This requires:
- OpenTelemetry Collector version 0.130.1-sumo-0 or later
- Collector configured with telemetry metrics enabled at
detailedlevel - Access to OTLP endpoint for metrics export
- Internal metrics exposed on port 8888 (default)
For logs collection
The OpenTelemetry Collector must be configured to export its own logs using the built-in telemetry capabilities. This requires:
- Collector configured with telemetry logs enabled at
debuglevel (automatically configured in the provided template) - JSON encoding for structured log output (automatically configured in the provided template)
- Access to OTLP endpoint for logs export
System Requirements
- OTEL Collector v0.130.1-sumo-0 or later
- Sufficient system resources (CPU, memory) for data processing
- Proper permissions for the collector service to access configured resources
Collection configuration and app installation
As part of data collection setup and app installation, you can select the App from App Catalog and click on Install App. Follow the steps below.
Step 1: Set up collector
If you want to use an existing OpenTelemetry Collector, you can skip this step by selecting the Use an existing Collector option.
To create a new Collector:
- Select the Add a new Collector option.
- Select the platform where you want to install the Sumo Logic OpenTelemetry Collector.
This will generate a command that you can execute in the machine environment you need to monitor. Once executed, it will install the Sumo Logic OpenTelemetry Collector.
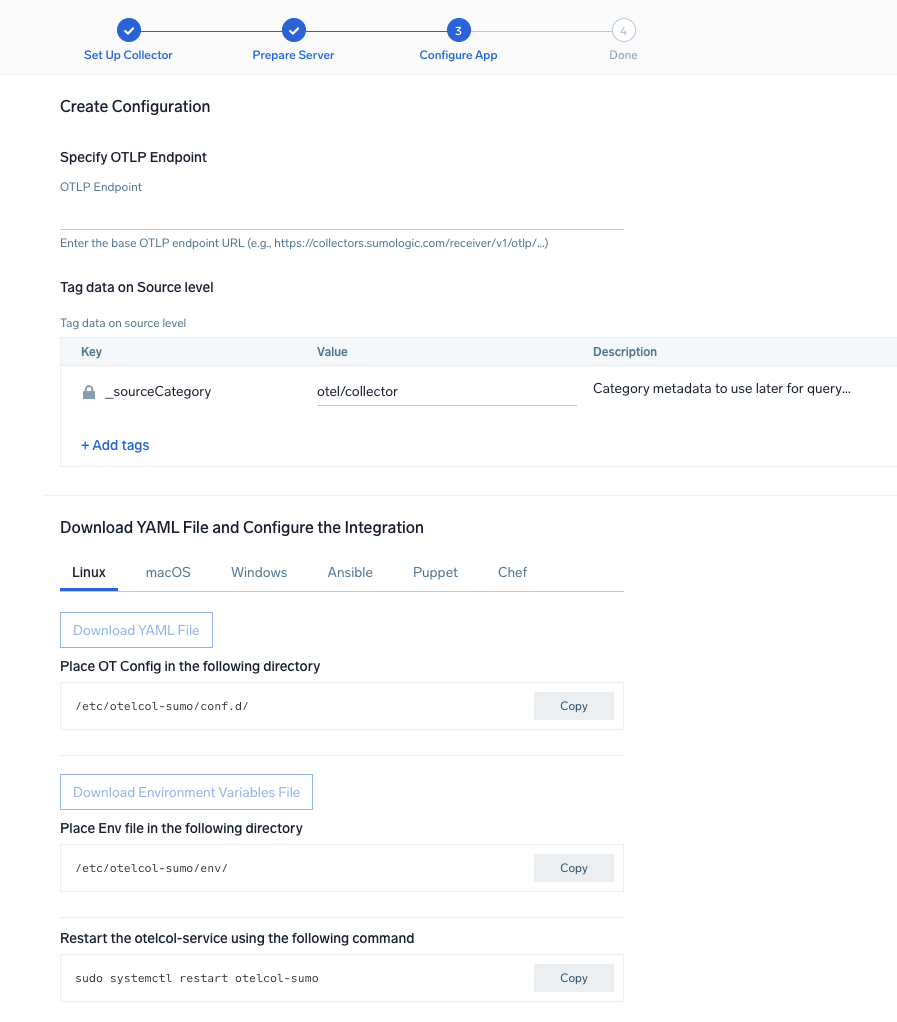
Step 2: Configure integration
OpenTelemetry works with a configuration YAML file with all the details concerning the data that needs to be collected.
In this step, you will configure the OpenTelemetry Collector's built-in telemetry to monitor itself.
Below are the inputs required:
- OTLP Endpoint. Your Sumo Logic OTLP endpoint URL.
service:
  telemetry:
    logs:
      level: debug
      development: false
      encoding: json
      processors:
        - batch:
            exporter:
              otlp:
                protocol: http/protobuf
                endpoint: ${OTLP_ENDPOINT}/v1/logs
    metrics:
      level: detailed
      readers:
        - periodic:
            exporter:
              otlp:
                protocol: http/protobuf
                endpoint: ${OTLP_ENDPOINT}/v1/metrics
    resource:
      _contentType: OpenTelemetry
      sumo.datasource: otel_collector
      deployment.environment: ${DEPLOYMENT_ENVIRONMENT}
You can add any custom fields which you want to tag along with the data ingested in Sumo Logic.
If you're using a username and password with OpenTelemetry Collector version ≥ 0.104, we recommend using the downloaded config with an environment variable, for example: ${environment_variable}.
On Linux, click Download Environment Variables File to get a file that includes the password, which should be set as an environment variable.
Step 3: Send logs and metrics to Sumo Logic
Once you have downloaded the YAML file as described in the previous step, follow the below steps based on your platform.
- Linux
- Windows
- macOS
- Chef
- Ansible
- Puppet
- Add the telemetry configuration to your existing collector configuration file in
/etc/otelcol-sumo/conf.d/or directly in the main configuration file. - Place Env file in the following directory:
/etc/otelcol-sumo/env/ - Restart the collector using:
sudo systemctl restart otelcol-sumo
- Add the telemetry configuration to your existing collector configuration file in
C:\ProgramData\Sumo Logic\OpenTelemetry Collector\config\conf.dor the main configuration file. - Restart the collector using:
Restart-Service -Name OtelcolSumo
- Add the telemetry configuration to your existing collector configuration file in
/etc/otelcol-sumo/conf.d/or the main configuration file. - Restart the otelcol-sumo process using:
otelcol-sumo --config /etc/otelcol-sumo/sumologic.yaml --config "glob:/etc/otelcol-sumo/conf.d/*.yaml"
- Copy the yaml file into your Chef cookbook files directory
files/<downloaded_yaml_file>.` - Use a Chef file resource in a recipe to manage it.
cookbook_file '/etc/otelcol-sumo/conf.d/<downloaded_yaml_file>' do
	mode 0644
    notifies :restart, 'service[otelcol-sumo]', :delayed
end - Use a Chef file resource in a recipe to manage it.
cookbook_file '/etc/otelcol-sumo/env/<downloaded_env_file>' do
    mode 0600
    notifies :restart, 'service[otelcol-sumo]', :delayed
end - Add the recipe to your collector setup to start collecting. Every team typically has their established way of applying the Chef recipe. The resulting Chef recipe should look something like:
cookbook_file '/etc/otelcol-sumo/conf.d/<downloaded_yaml_file>' do
    mode 0644
    notifies :restart, 'service[otelcol-sumo]', :delayed
end

cookbook_file '/etc/otelcol-sumo/env/<downloaded_env_file>' do
    mode 0600
    notifies :restart, 'service[otelcol-sumo]', :delayed
end
- Place the file into your Ansible playbook files directory.
- Run the Ansible playbook using:
ansible-playbook -i inventory install_sumologic_otel_collector.yaml
-e '{"installation_token": "<YOUR_TOKEN>", "collector_tags": {<YOUR_TAGS>}, "src_config_path": "files/conf.d", "src_env_path": "files/env"}'
- Place the file into your Puppet module files directory
modules/install_otel_collector/files/<downloaded_yaml>. - Use a Puppet file resource to manage it
file { '/etc/otelcol-sumo/conf.d/<downloaded_yaml_file>':
    ensure => present,
    source => 'puppet:///modules/install_otel_collector/<downloaded_yaml_file>',
    mode => '0644',
    notify => Service[otelcol-sumo],
} - Use a Puppet file resource to manage it
file { '/etc/otelcol-sumo/env/<downloaded_env_file>'
    ensure => present,
    source => 'puppet:///modules/install_otel_collector/<downloaded_env_file>',
    mode => '0600',
    notify => Service[otelcol-sumo],
} - Apply the Puppet manifest. Every team typically has their established way of applying the Puppet manifes. The resulting Puppet manifest should look something like:
node 'default' {
    class { 'install_otel_collector'
      installation_token => '<YOUR_TOKEN>',
      collector_tags => { <YOUR_TAGS> },
    }

    service { 'otelcol-sumo':
      provider => 'systemd',
      ensure => running,
      enable => true,
      require => Class['install_otel_collector'],
    }

    file { '/etc/otelcol-sumo/conf.d/<downloaded_yaml_file>':
      ensure => present,
      source => 'puppet:///modules/install_otel_collector/<downloaded_yaml_file>',
      mode => '0644',
      notify => Service[otelcol-sumo],
    }

    file { '/etc/otelcol-sumo/env/<downloaded_env_file>':
      ensure => present,
      source => 'puppet:///modules/install_otel_collector/<downloaded_env_file>',
      mode => '0600',
      notify => Service[otelcol-sumo],
    }
  }
After successfully executing the above command, Sumo Logic will start receiving data from your host machine.
Click Next. This will install the app (dashboards and monitors) to your Sumo Logic Org.
Dashboard panels will start to fill automatically. It's important to note that each panel fills with data matching the time range query and received since the panel was created. Results won't immediately be available, but within 20 minutes, you'll see full graphs and maps.
Validation
After installation, verify that:
- The OTEL Collector service is running.
- The configured base endpoint is reachable.
- Data is being successfully sent to both the logs (
/v1/logs) and metrics (/v1/metrics) endpoints. - Resource attributes are properly applied to the telemetry data.
- Internal metrics are accessible at
http://localhost:8888/metrics.
Sample log messages
{
  "timestamp": "2024-01-15T10:30:45.123Z",
  "level": "info",
  "msg": "Batch processor started",
  "component": "batch",
  "pipeline": "metrics"
}
{
  "timestamp": "2024-01-15T10:30:46.456Z",
  "level": "warn",
  "msg": "Dropping data because sending_queue is full",
  "component": "sumologicexporter",
  "pipeline": "logs"
}
Sample metrics
{
  "metric": "otelcol_processor_batch_batch_send_size",
  "sumo.datasource": "otel_collector",
  "_contentType": "OpenTelemetry",
  "deployment.environment": "production",
  "processor": "batch",
  "value": 100,
  "timestamp": "2024-01-15T10:30:45.123Z"
}
{
  "metric": "otelcol_exporter_queue_size",
  "sumo.datasource": "otel_collector",
  "_contentType": "OpenTelemetry",
  "deployment.environment": "production",
  "exporter": "sumologic",
  "value": 150,
  "timestamp": "2024-01-15T10:30:45.123Z"
}
Key Internal Metrics
The OpenTelemetry Collector emits comprehensive internal metrics categorized by verbosity levels. For a complete list of internal metrics and their descriptions, see the OpenTelemetry Collector Internal Telemetry documentation.
Sample queries
This sample query is from the Pipeline Health Overview panel.
sumo.datasource=otel_collector
| json auto maxdepth 1 nodrop
| if (isEmpty(log), _raw, log) as _raw
| parse "* * * *" as timestamp, level, component, msg
| where level in ("error", "warn", "info", "debug")
| count by level, component
| transpose row component column level
This sample metrics query is from the Collector Resource Usage panel.
sumo.datasource=otel_collector metric=otelcol_process_memory_rss deployment.environment=* | avg by deployment.environment
This sample query monitors queue health from the Exporter Queue Health panel.
sumo.datasource=otel_collector metric=otelcol_exporter_queue_size deployment.environment=*
| avg by exporter, deployment.environment
Viewing OpenTelemetry Collector Insights dashboards
All dashboards have a set of filters that you can apply to the entire dashboard. Use these filters to drill down and examine the data to a granular level.
- You can change the time range for a dashboard or panel by selecting a predefined interval from a drop-down list, choosing a recently used time range, or specifying custom dates and times. Learn more.
- You can use template variables to drill down and examine the data on a granular level. For more information, see Filtering Dashboards with Template Variables.
- Log-based dashboards use the
_sourceHostfilter to identify specific collector instances. - Metrics-based dashboards use the
service.instance.idfilter to identify specific collector instances.
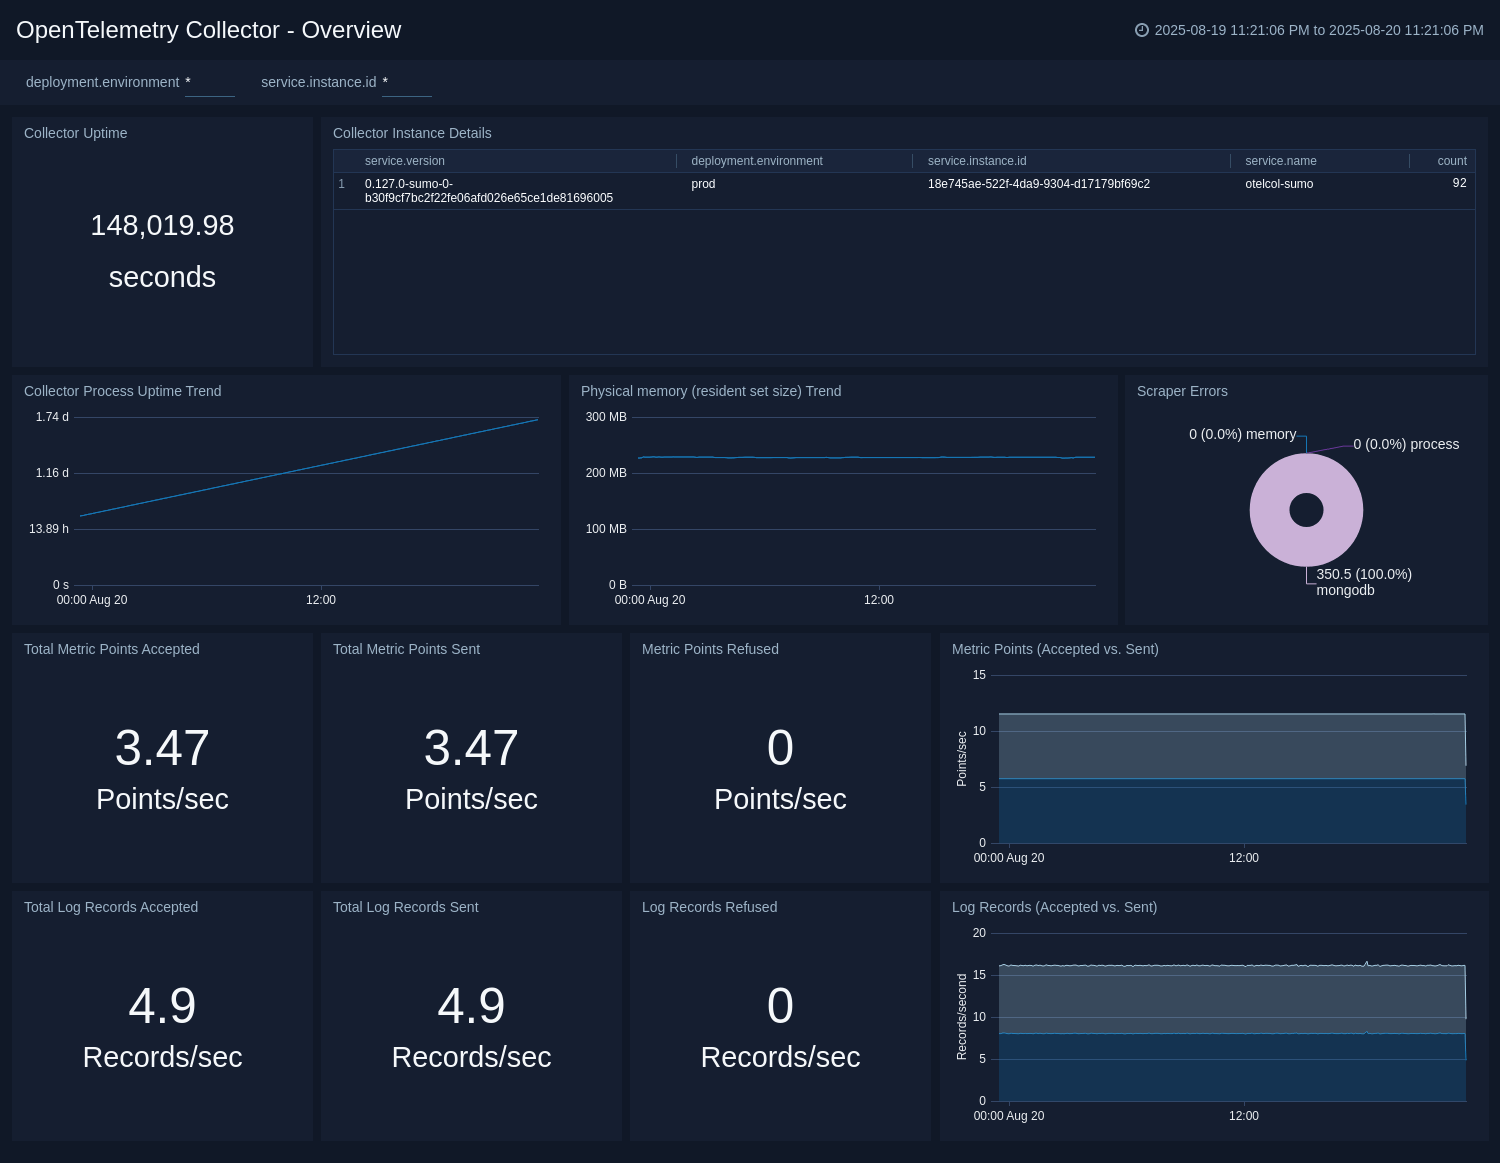
Overview
The OpenTelemetry Collector Insights - Overview dashboard provides a high-level view of your OpenTelemetry Collector fleet's health and performance. This is your starting point for monitoring collector instances.
Use this dashboard to:
- Monitor the overall health of your collector fleet.
- Identify performance bottlenecks and resource constraints.
- Track data flow and processing rates across collectors.
- Quickly spot collectors experiencing issues.
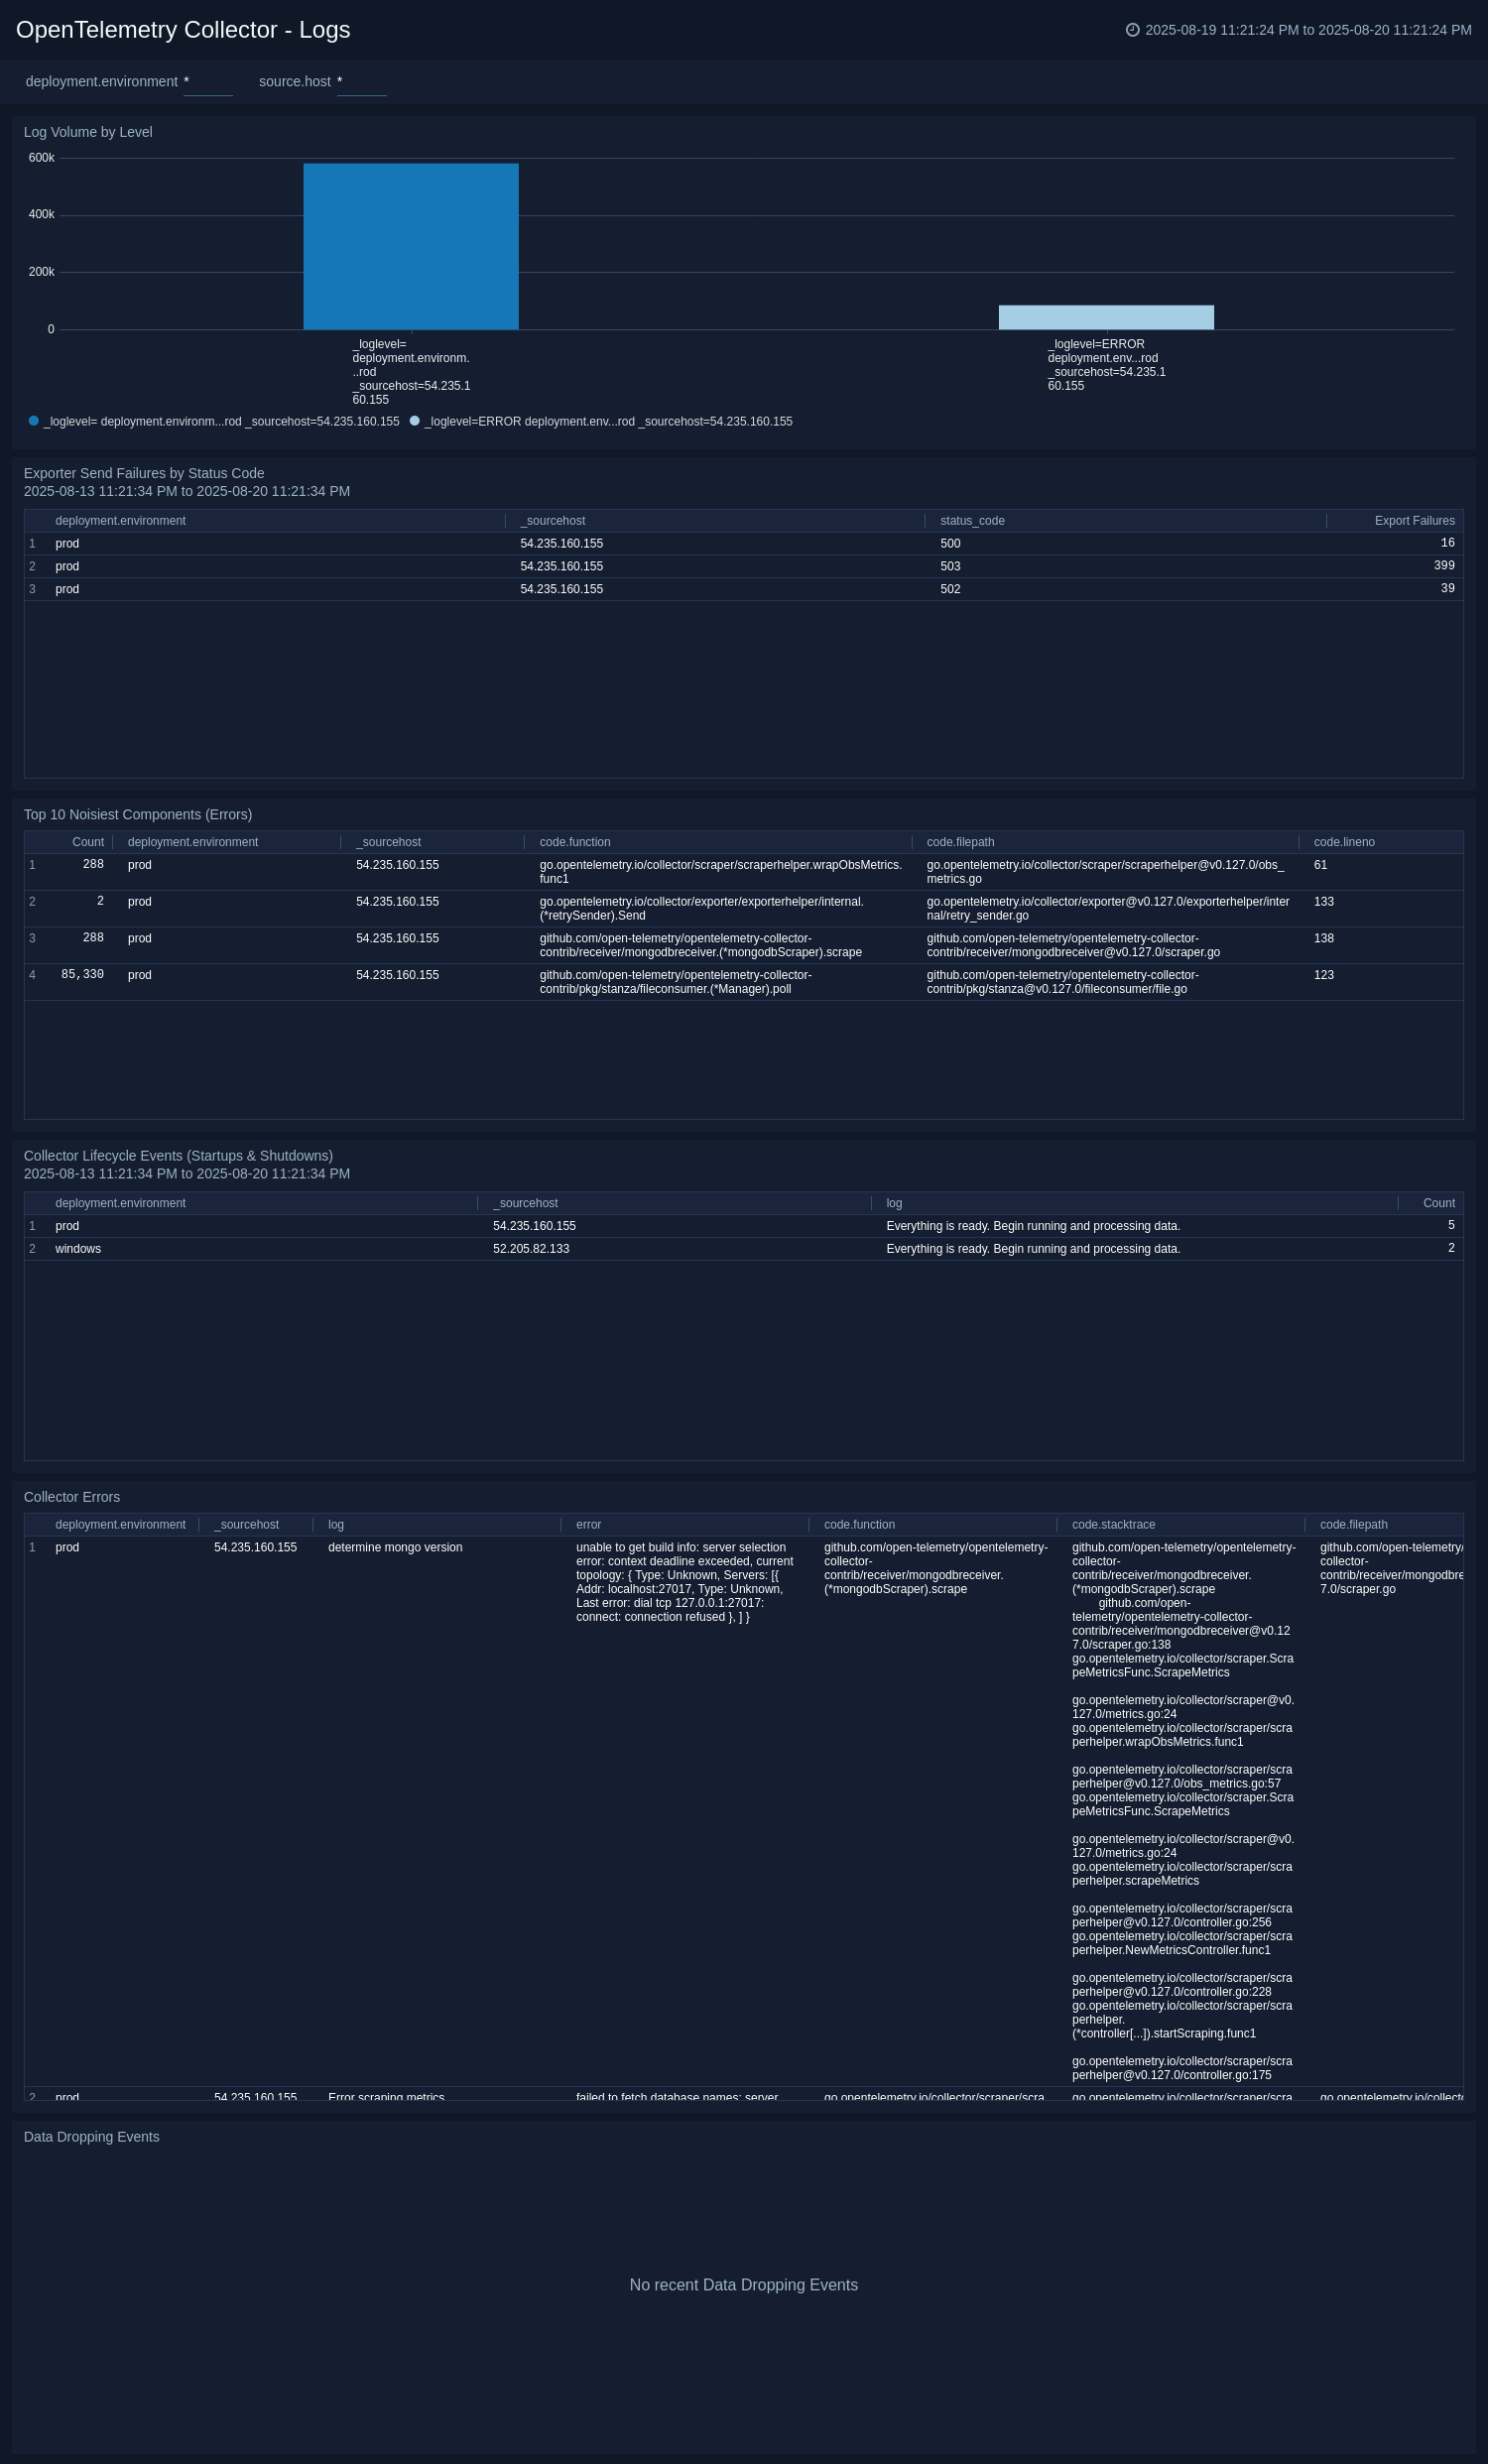
Logs
The OpenTelemetry Collector Insights - Logs dashboard provides detailed insights into collector log output for root-cause analysis of errors, data dropping events, and restarts.
Use this dashboard to:
- Analyze error patterns and troubleshoot issues.
- Monitor collector startup and shutdown events.
- Identify data loss or processing problems.
- Track log severity trends across your collector fleet.
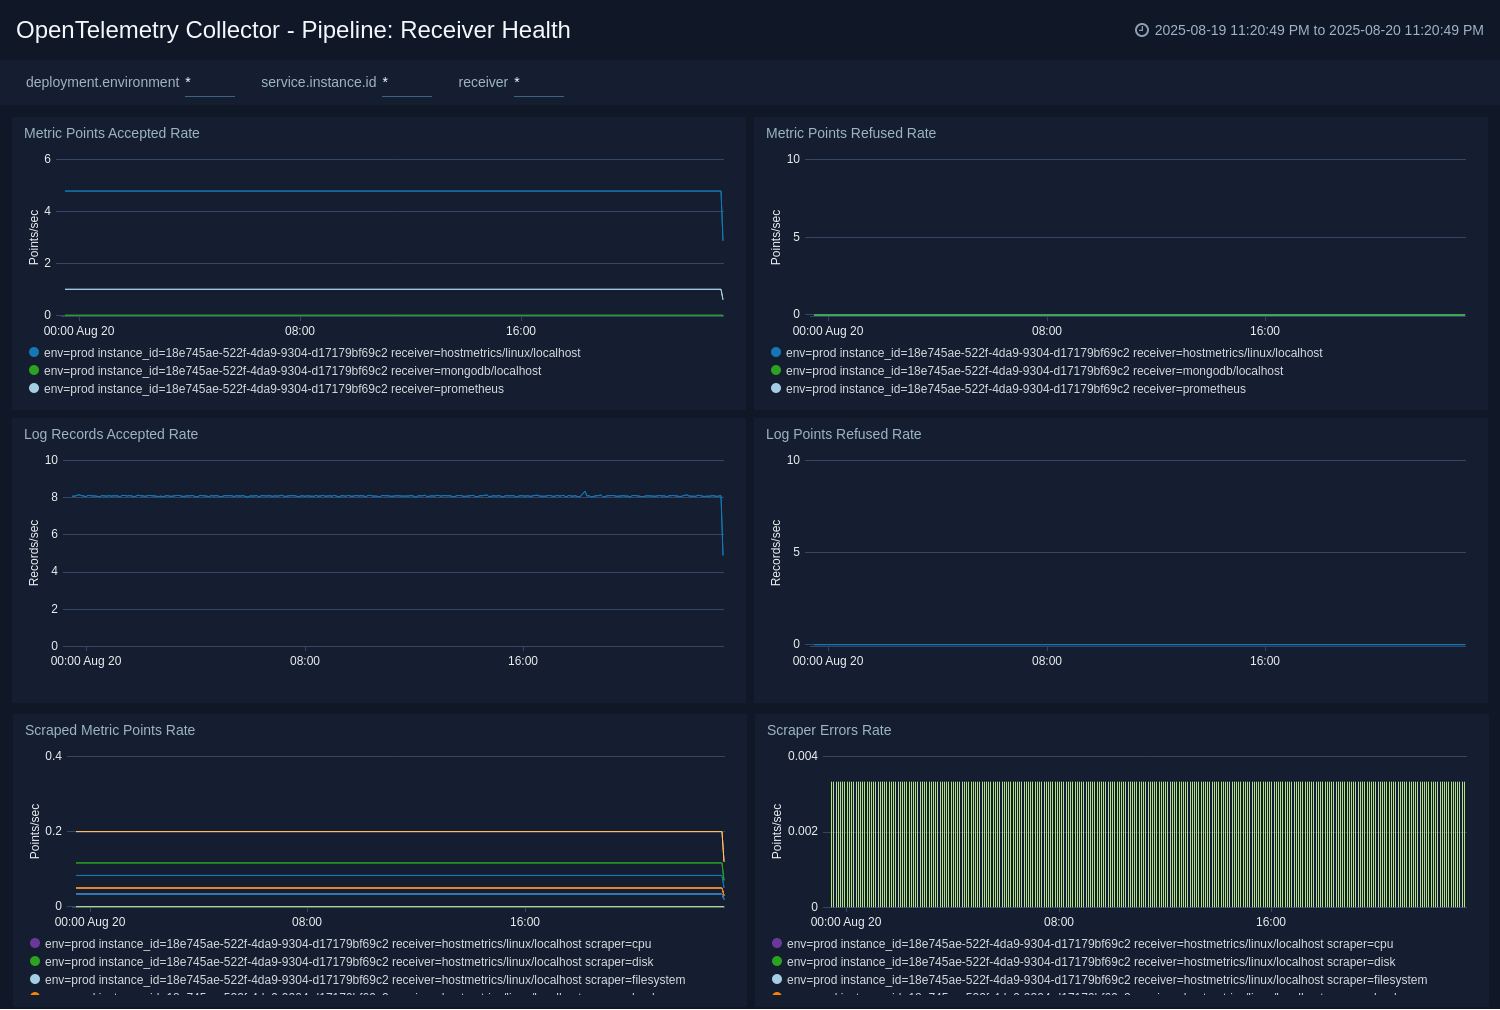
Pipeline: Receiver Health
The OpenTelemetry Collector Insights - Pipeline: Receiver Health dashboard focuses exclusively on the data ingestion stage of the pipeline to monitor data sources and receiver performance.
Use this dashboard to:
- Monitor receiver performance and data ingestion rates.
- Identify issues with data sources and input connections.
- Track receiver-specific errors and failures.
- Analyze accepted vs refused data points.
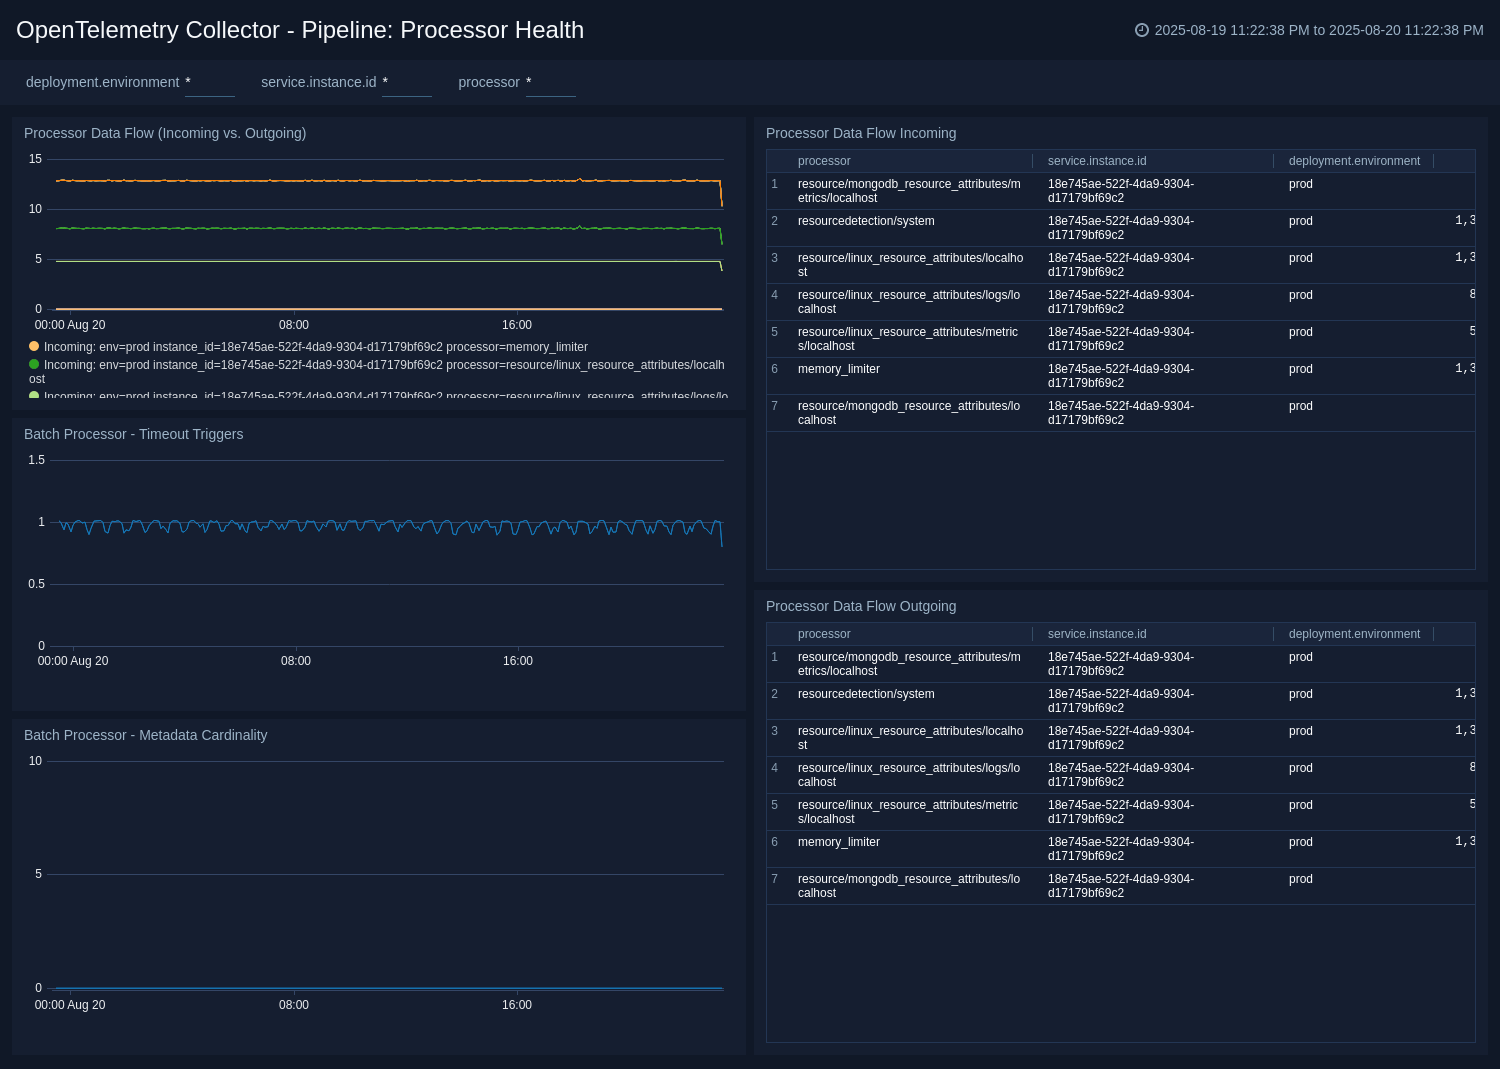
Pipeline: Processor Health
The OpenTelemetry Collector Insights - Pipeline: Processor Health dashboard is crucial for understanding if any processors (like batch, memory_limiter, or resourcedetection) are dropping data or causing performance issues.
Use this dashboard to:
- Monitor processor performance and throughput.
- Identify data drops or processing bottlenecks.
- Track processor-specific configurations and health.
- Analyze batch processing efficiency and triggers.
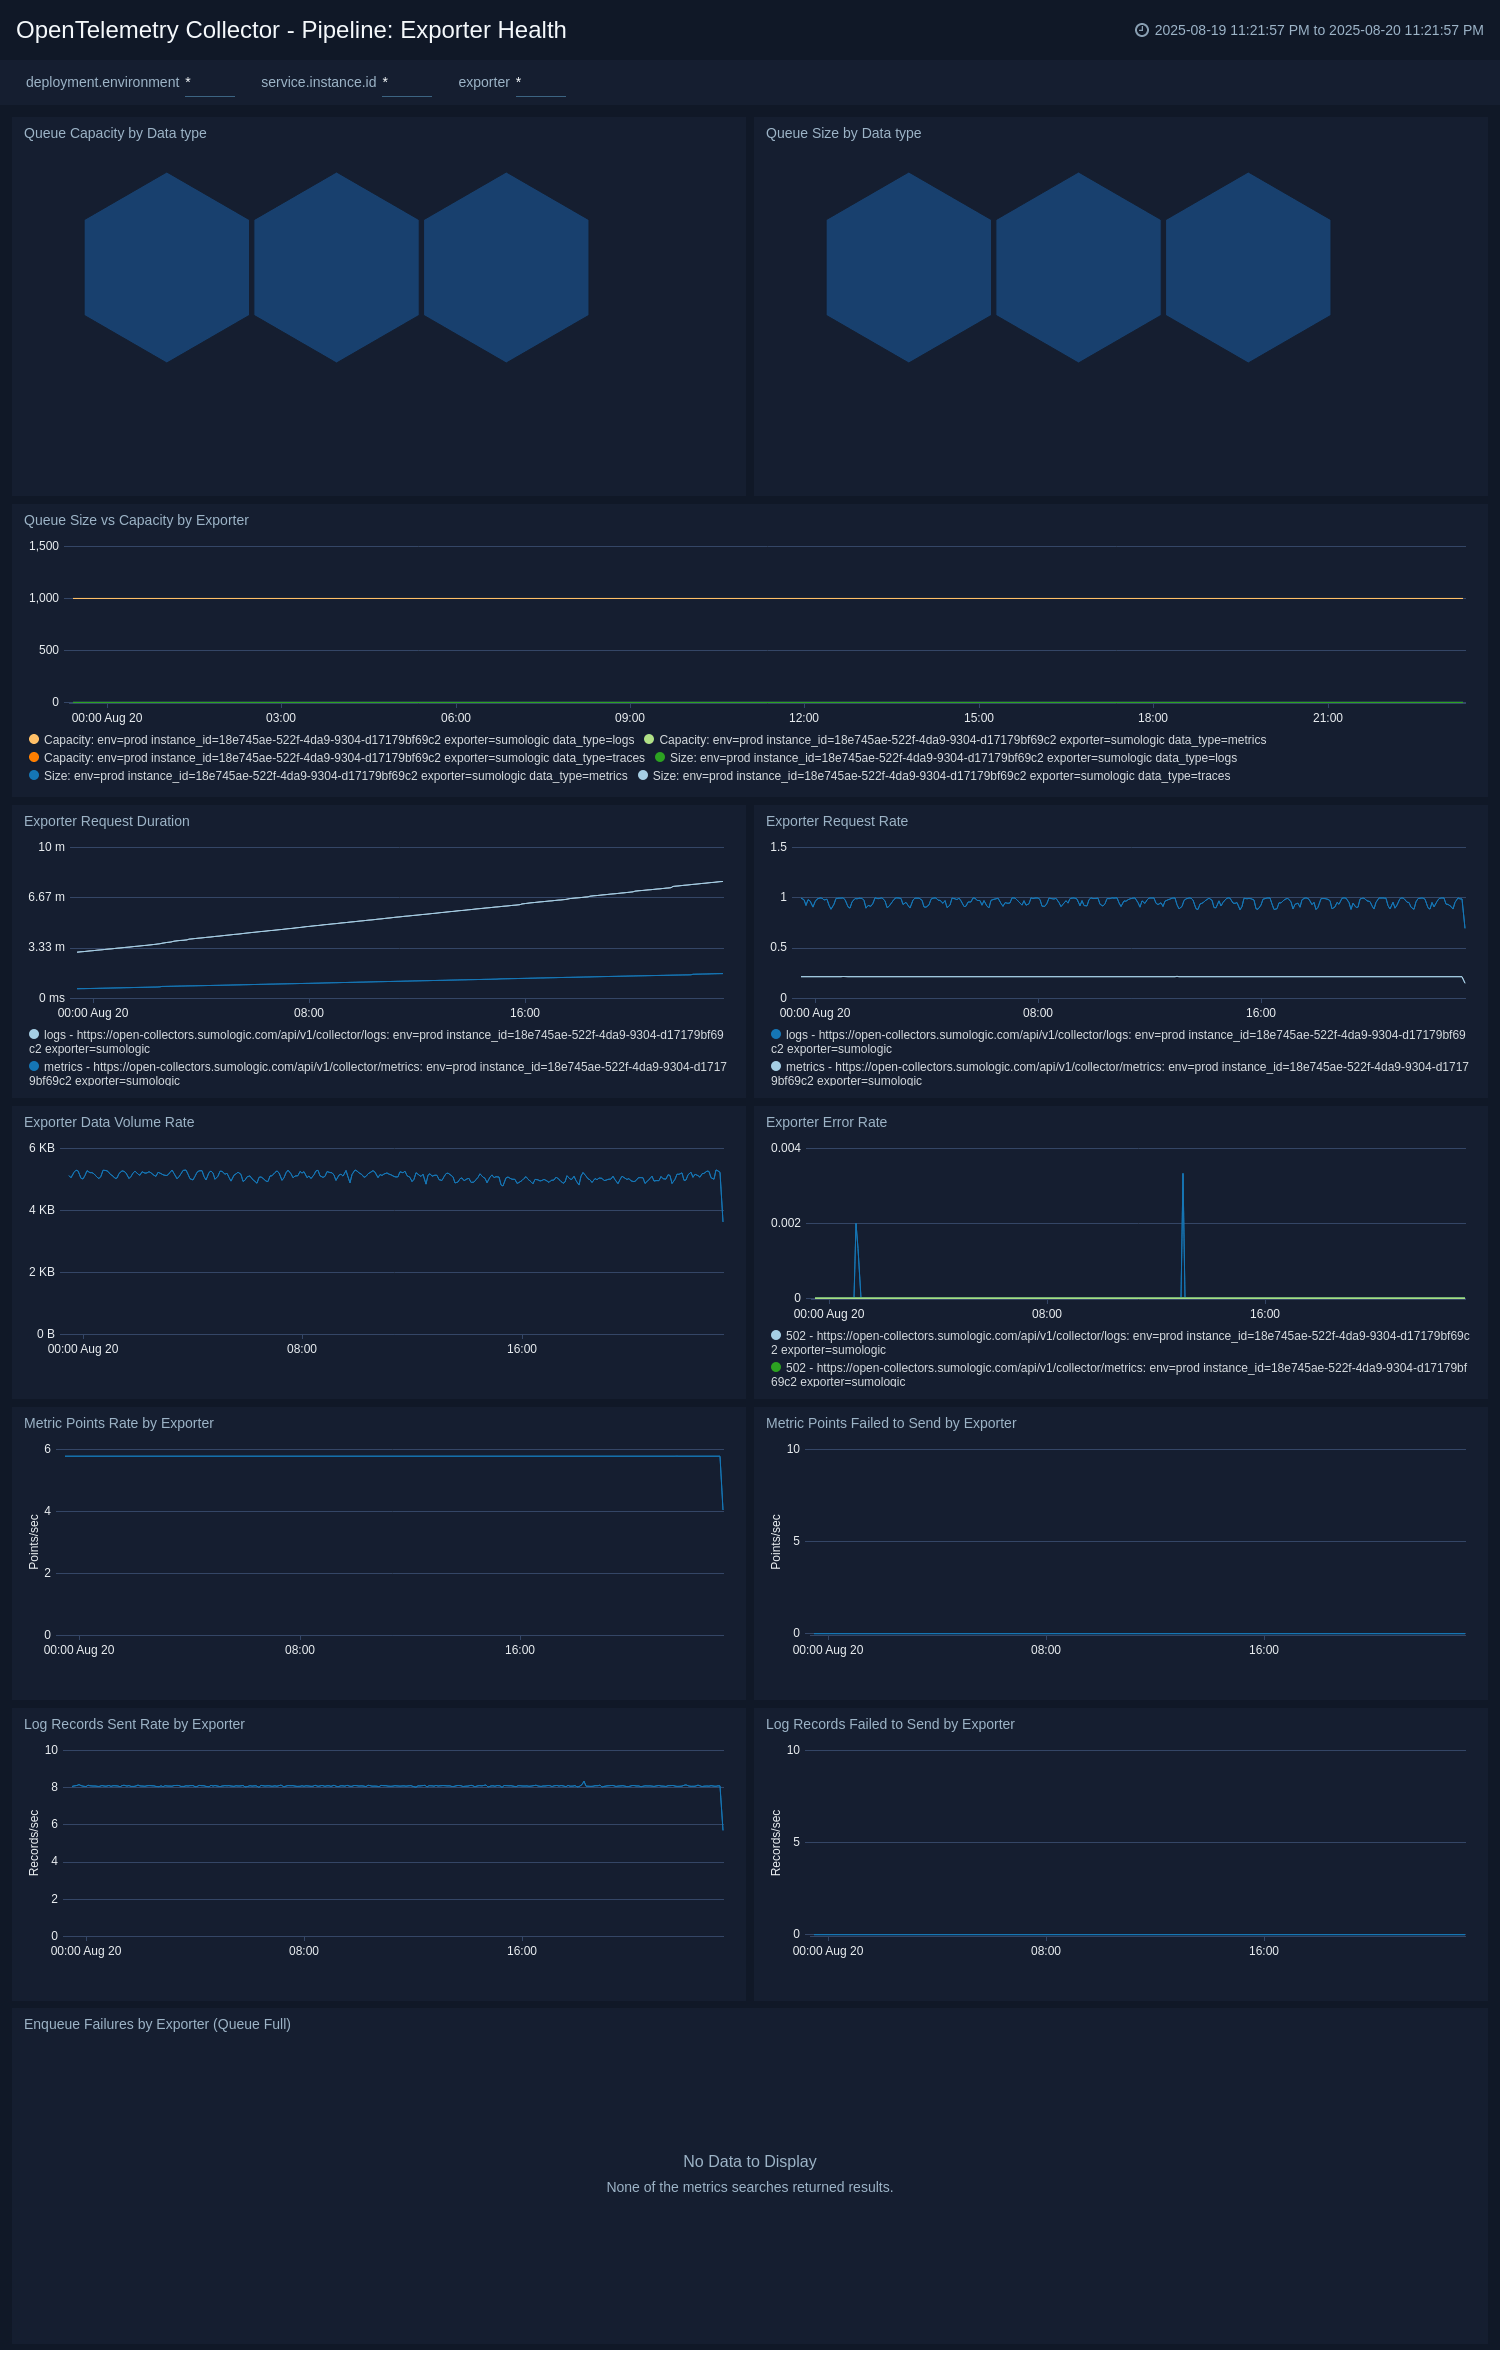
Pipeline: Exporter Health
The OpenTelemetry Collector Insights - Pipeline: Exporter Health dashboard is the most critical dashboard for diagnosing backpressure and data loss at the egress stage of the pipeline.
Use this dashboard to:
- Monitor exporter performance and success rates.
- Identify backpressure issues and export failures.
- Track data delivery to downstream systems.
- Analyze queue utilization and capacity.
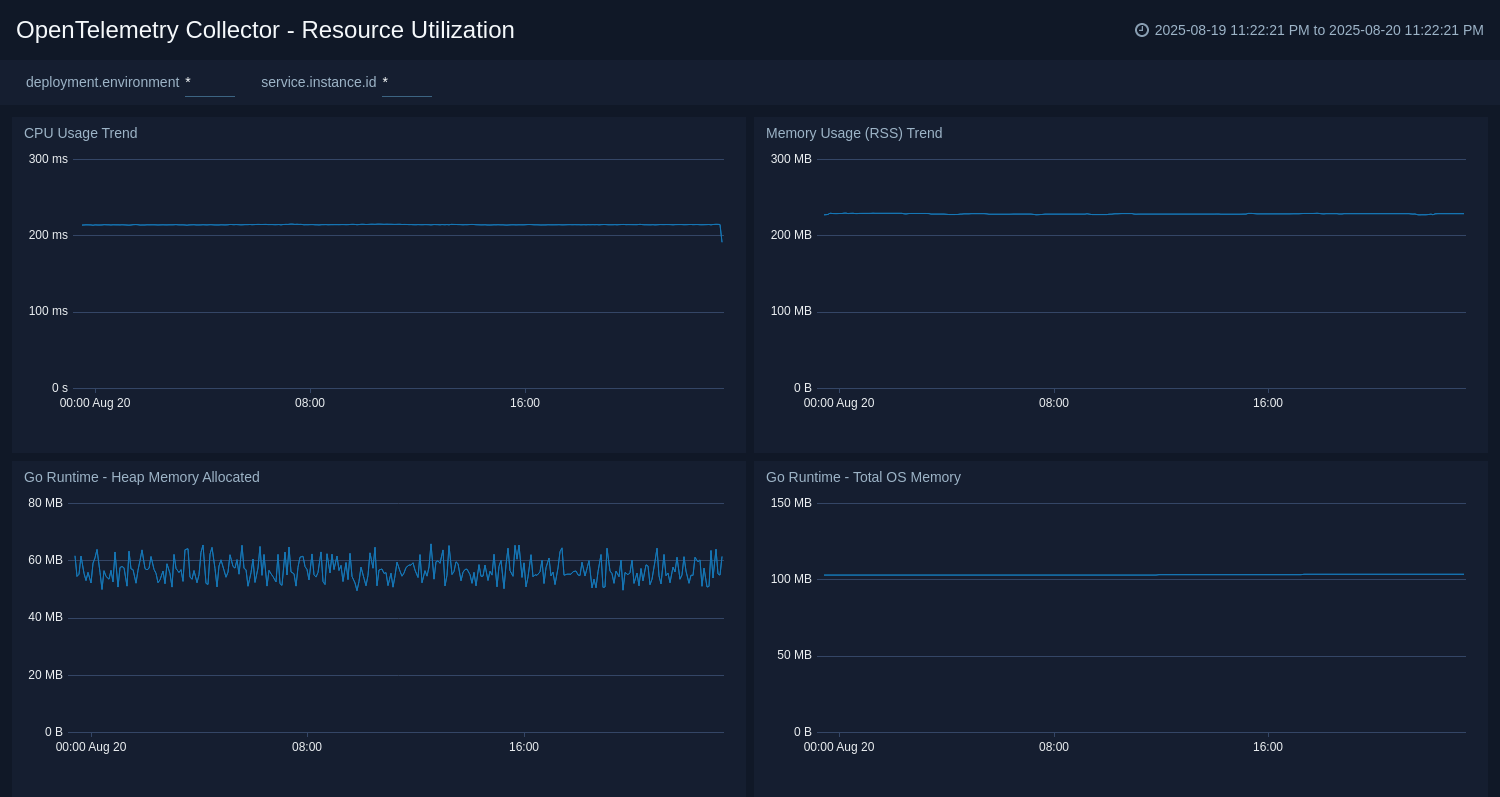
Resource Utilization
The OpenTelemetry Collector Insights - Resource Utilization dashboard provides a deep dive into the collector's own resource consumption to diagnose performance issues and plan for capacity.
Use this dashboard to:
- Monitor CPU, memory, and disk usage by collectors.
- Plan capacity and resource allocation.
- Identify resource constraints and optimization opportunities.
- Track heap allocation and garbage collection patterns.
Troubleshooting
Common issues
Collector connection failure
If your collector fails to connect to Sumo Logic, you may need to configure proxy settings. Check the collector's logs for connection errors:
# On systemd systems
journalctl --unit otelcol-sumo

# Look for errors like "Unable to get a heartbeat"
High queue utilization
Monitor the otelcol_exporter_queue_size and otelcol_exporter_queue_capacity metrics. If the queue is consistently full, you may need to:
- Reduce data ingestion rate
- Increase queue capacity
- Scale horizontally with more collectors
Data dropping
Watch for logs containing "Dropping data because sending_queue is full" and monitor failed enqueue metrics:
otelcol_exporter_enqueue_failed_spansotelcol_exporter_enqueue_failed_metric_pointsotelcol_exporter_enqueue_failed_log_records
Accessing collector metrics directly
By default, the collector's internal metrics are available in Prometheus format at http://localhost:8888/metrics. You can access them using:
curl http://localhost:8888/metrics
Log levels and configuration
Configure different log levels for troubleshooting:
- DEBUG. Most verbose, includes detailed trace information
- INFO. Standard operational information (default)
- WARN. Warning messages about potential issues
- ERROR. Error conditions that need attention
Create monitors for OpenTelemetry Collector Insights app
From your App Catalog:
- From the Sumo Logic navigation, select App Catalog.
- In the Search Apps field, search for and then select your app.
- Make sure the app is installed.
- Navigate to What's Included tab and scroll down to the Monitors section.
- Click Create next to the pre-configured monitors. In the create monitors window, adjust the trigger conditions and notifications settings based on your requirements.
- Scroll down to Monitor Details.
- Under Location click on New Folder.
note
By default, monitor will be saved in the root folder. So to make the maintenance easier, create a new folder in the location of your choice.
- Enter Folder Name. Folder Description is optional.
tip
Using app version in the folder name will be helpful to determine the versioning for future updates.
- Click Create. Once the folder is created, click on Save.
OpenTelemetry Collector Insights Alerts
| Name | Description | Alert Condition | Recover Condition |
|---|---|---|---|
OpenTelemetry Collector Insights - Collector Instance is Down | This alert fires when a Collector instance stops sending telemetry for more than 10 minutes, indicating it is down or has a connectivity issue. | Missing Data | Data Found |
OpenTelemetry Collector Insights - Exporter Queue Nearing Capacity | This alert fires when an exporter's sending queue is over 90% full. This is a strong leading indicator of back pressure and imminent data loss. | Count > = 90 | Count < 90 |
OpenTelemetry Collector Insights - High Memory Usage (RSS) | This alert fires when a Collector's memory usage (RSS) exceeds 2GB. This could be an early indicator of a memory leak or an under-provisioned host. | Count > 2000000000 | Count < = 2000000000 |
OpenTelemetry Collector Insights - High Metadata Cardinality | This alert fires when the batch processor is handling more than 1000 unique combinations of metadata. This is a known cause of performance degradation, high CPU, and high memory usage. | Count > 1000 | Count < = 1000 |