Sumo Logic Security Analytics App

The Sumo Logic App for Security Analytics provides Dashboards that allow you to easily see and manage your system's status, including a security operations overview, network, system and change, user monitoring, and vulnerabilities on endpoints. This data is collected from your Collectors and Sources.
Prerequisites
- For Sumo Logic Enterprise Security and Enterprise Suite accounts only. For more information, see Apps for Sumo Logic.
Security Analytics App Dashboards
This data is collected from your Collectors and Sources for instant analysis of any events.
Security Operations Overview
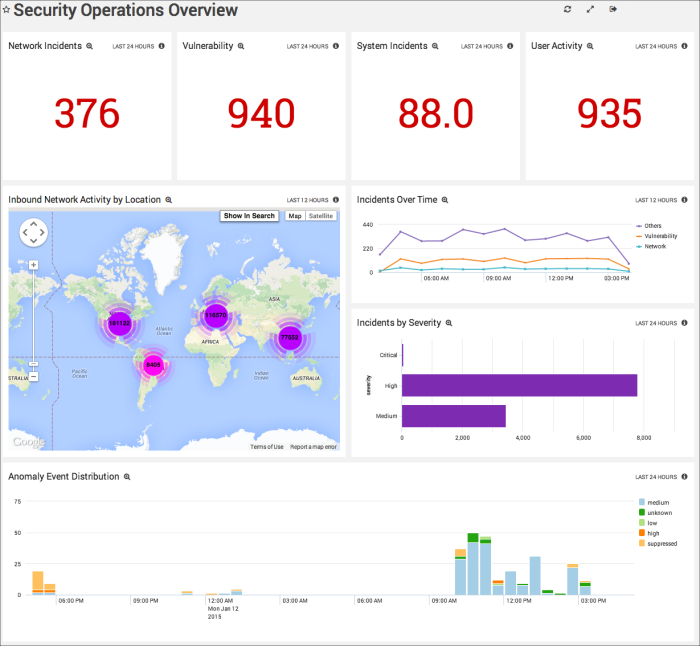
Network Incidents. Displays the number of incidents detected over the last 24 hours in a single value chart. Click the chart to drill down to the Network Overview Dashboard for more information.
Vulnerability. Provides the incident count by severity High or Critical for the past 24 hours in a single value chart. Click the chart to drill down to the Vulnerabilities on Endpoints Dashboard for more information.
System Incidents. Shows the number of system incidents over the last 24 hours in a single value chart. Click the chart to drill down to the System and Change Dashboard for more information.
User Activity. Displays the amount of user activity in kbytes for the past 24 hours in a single value chart. Click the chart to drill down to the User Monitoring Dashboard for more information.
Inbound Network Activity by Location. Performs a geo lookup search and displays the inbound network activity by location for the last 12 hours on a map of the world.
Incidents Over Time. Displays the type and number of incidents in a timeline using timeslices of one hour for the last 12 hours.
Incidents by Severity. Shows the number of incidents by their severity designation in a bar chart for the last 12 hours.
Anomaly Event Distribution. Provides information on the distribution of Anomaly events in column chart on a timeline for the past 24 hours. Click the chart to drill down into the Anomaly Detection Summary Dashboard.
Network Status
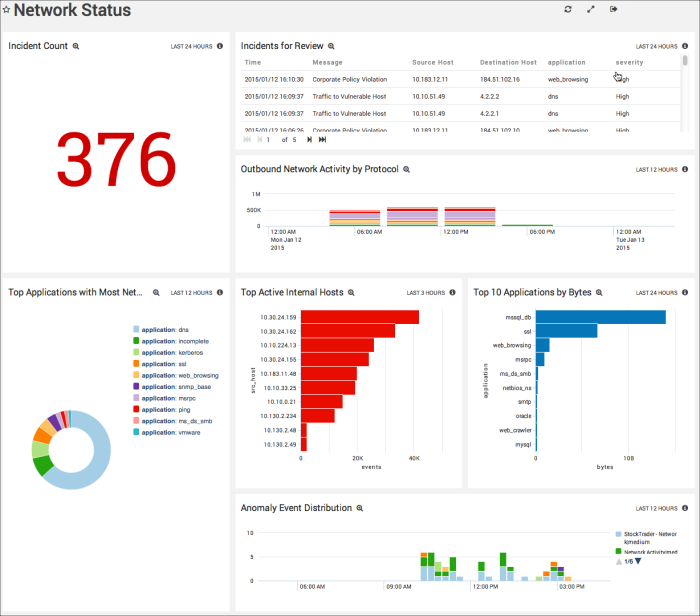
Incident Count. Counts the number of incidents detected over the last 24 hours and displays them in a single value chart.
Incidents for Review. Displays important incidents from the last 24 hours in a table with columns that list the incident's time, message text, source host IP address, destination host IP address, application, and severity. Scroll to see the entire table contents.
Outbound Network Activity by Protocol. Provides information on outbound and inbound network traffic by protocol, displayed in a stacked column chart on a time line in timeslices of four hours for the last 12 hours.
Top Applications with Most Network Activities. Shows the top 10 applications with the most network activity displayed in a pie chart.
Top Active Internal Hosts. Lists the top 10 active internal hosts and their number of events for the last three hours, displayed in a bar chart.
Top 10 Applications by Bytes. Shows the top 10 applications and their network use in bytes over the last 24 hours.
Anomaly Event Distribution. Displays the distribution of Anomaly events for the last 12 hours, using a column chart on a timeline using timeslices of 15 minutes.
System and Change
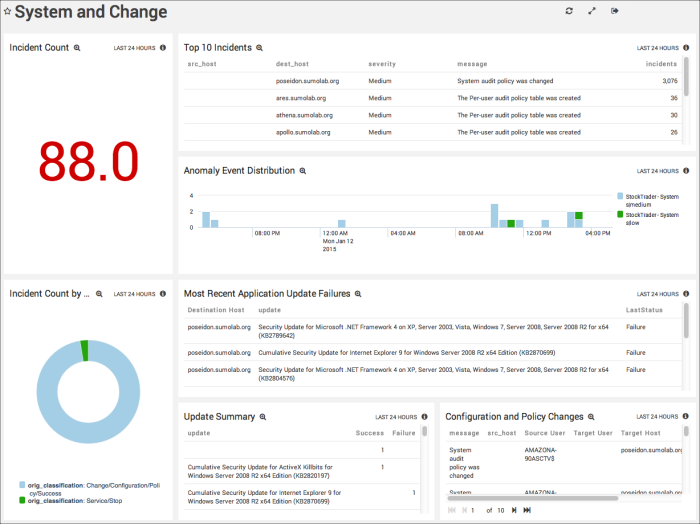
Incident Count. Displays the number of incidents detected as a change in a single value chart for the last 24 hours.
Top 10 Incidents. Shows the top 10 incidents in a table that includes the source host, destination host, severity, log message text, and the number of incidents for the past 24 hours.
Anomaly Event Distribution. Displays the distribution of Anomaly events in a column chart using timeslices of 30 minutes on a timeline for the last 24 hours.
Incident Count by Classification. Displays the number an type of incidents by classification for the last 24 hours in a pie chart.
Most Recent Application Update Failures. Provides information on any recent application update failures for the past 12 hours in a table, including the destination host, the update type, and the latest status.
Update Summary. Displays a summary of updates for the last 24 hours in a table including the update text, and its success or failure.
Configuration and Policy Changes. Shows any configuration and policy changes for the last 24 hours in a table, including information on the message text, source host, source user, target user, target host, and severity.
User Monitoring
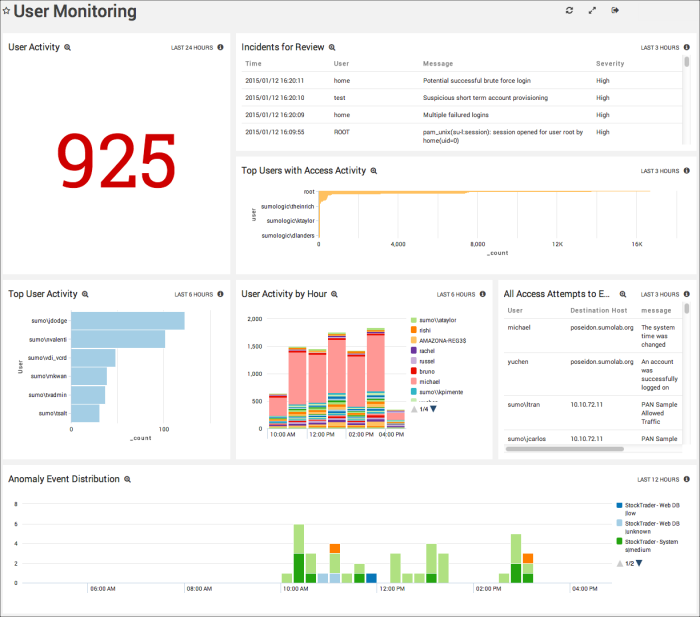
User Activity. Displays user activity in kbytes for the last 24 hours in a single value chart.
Incidents for Review. Provides information on incidents that have occurred in the last three hours. in a table including time, user, message text and the severity.
Top Users with Access Activity. Shows the top users of the system and their activity for the last three hours in a bar chart.
Top User Activity. Displays the top 10 users of the system and their activity for the last six hours in a bar chart.
User Activity by Hour. Provides information on user activity by user by hour in a stacked column cart on a timeline using timeslices of one hour for the last six hours.
All Access Attempts to Environment. Lists all attempts to access the environment in a table for the last three hours, including the user name, destination host, message text, time of the latest attempt, and the time of the earliest attempt.
Anomaly Event Distribution. Displays the distribution of Anomaly events in a column chart using timeslices of 30 minutes on a timeline for the last 12 hours.
Vulnerabilities on Endpoints
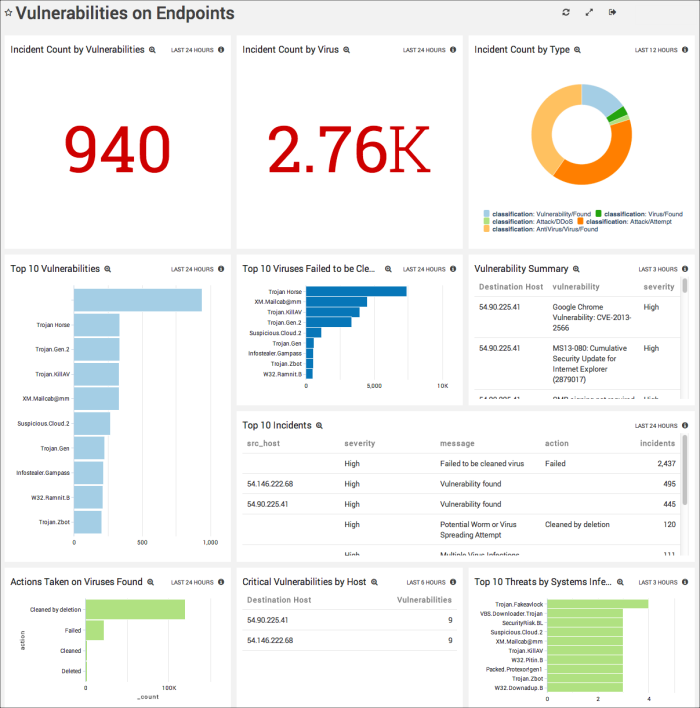
Incident Count by Vulnerabilities. Displays the number of incidents reported as High or Critical for the past 24 hours in a single value chart.
Incident Count by Virus. Shows the number of virus incidents reported for the last 24 hours in a single value chart.
Incident Count by Type. Provides the number of incidents by type for the last 12 hours in a pie chart.
Top 10 Vulnerabilities. Counts the top 10 vulnerabilities by name displayed in a bar chart for the past 24 hours.
Top 10 Viruses Failed to be Cleaned. Lists names and number of the top 10 viruses that were unable to be removed from the environment for the last 24 hours, displayed in a bar chart.
Vulnerability Summary. Shows the summary of vulnerabilities detected over the last three hours in a table, including information on the destination host, the described vulnerability, and its severity designation.
Top 10 Incidents. Details the top 10 incidents in a table for the past 24 hours, including information on the source host, severity, message, action, and the number of incidents.
Actions Taken on Viruses Found. Details the number of actions taken to remedy viruses found in the environment for the last 24 hours, displayed in a bar chart.
Critical Vulnerabilities by Host. Displays incidents with a severity of critical for the past six hours in a table, including information on the destination host and the number of vulnerabilities.
Top 10 Threats by Systems Infected. Lists the names and number of top 10 threats by systems that are infected with viruses in the last three hours, displayed in a bar chart.
Anomaly Detection Summary
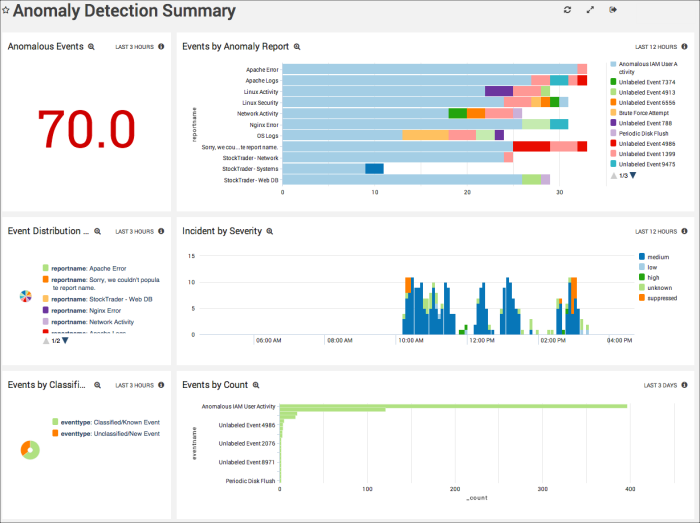
Anomalous Events. Counts the number of Anomaly events detected for the last three hours, and displays them in a single value chart.
Events by Anomaly Report. Displays the results of Anomaly Reports by report name and the count of events by number for the last 12 hours in a bar chart.
Event Distribution by Report. Displays the number of events by report name for the last three hours in a pie chart.
Incident by Severity. Shows the number of Anomaly events by severity in timeslices of 5 minutes for the past 12 hours. Displayed in a column chart on a timeline.
Events by Classification. Counts the events by type, either classified or known event, or unclassified new event, for the last three hours. Displays the information in a pie chart.
Events by Count. Counts the number of events and displays them in a bar chart in timeslices of 24 hours for the past three days.
Using the Sumo Logic App for Security Analytics
This App is available for Sumo Logic Enterprise accounts only, and requires a paid Professional Services contract to install and configure. You may upgrade your account at any time. If you'd like more information on this App, please request it by clicking the Request button in the Apps section of the Library, or contact your Sumo Logic sales representative at sales@sumologic.com.
The Sumo Logic app for Security Analytics provides Dashboards that allow you to easily see and manage your system's status, including a security operations overview, network, system and change, user monitoring, and vulnerabilities on endpoints. This data is collected from your Collectors and Sources, and Sumo Logic Anomaly Detection is applied to it, for instant analysis of any events.
For complete details, see Sumo Logic App for Security Analytics.
Getting Security Incident Details
In the Security Analytics App, on the Network Status Dashboard, the Incident Count or Incidents for Review Panels provide information on all security incidents. You can also drill down from these Panels to the Search page and see more details on those incidents in the Messages tab.
To see incident details in the Messages tab:
- Click the Incidents for Review Panel to open the query in the Search page.
- Click the Messages tab.
- More details for the incident are included in the Message field.
Security Use Cases
The following table provides a list of security use cases, incidents covered, and relevant devices and sources.
| Security Analytics Use Case | Security Incidents | Relevant Devices and Sources |
| User Monitoring |
| Windows 2008 servers, Active Directory, Linux, Google Apps, Novell Access Manager, RSA |
| User Monitoring |
| Windows, Active Directory, Google Apps |
| User Monitoring |
| Windows, Active Directory, Google Apps, Linux |
| Systems and Changes |
| Windows, Active Directory, Linux |
| Network Overview |
| Checkpoint |
| Vulnerabilities on Endpoints |
| Qualys |
| Vulnerabilities on Endpoints |
| Forefront |
Incident Messages and Searches
This table maps incident messages to the preconfigured Security Analytics App searches that report on them.
| Incident Message Value | Incident Search |
| Brute Force Login | SA - Incident - Brute Force Login Attempt |
| Excessive firewall denies | SA - Incident - Excessive Firewall Denies |
| High number of malware IDS alerts | SA - Incident - High Number of Malware IDS Alerts |
| Large number of denied connections | SA - Incident - High Volume of Denied Connections |
| Increased failed remote logins | SA - Incident - Increase in Failed Remote Login Attempts |
| Multiple failed logins | SA - Incident - Multiple Failed Logins by a User in Last 15mins |
| Potential DDos attacks | SA - Incident - Potential DDos Attack |
| Potential scan or attack through multiple attack vectors | SA - Incident - Potential Scan or Attack through Multiple Vectors |
| Potential web application scan or attack | SA - Incident - Potential Web Application Attack |
| Potential successful brute force login | SA - Incident - Successful Login after Multiple Failed Logins |
| Suspicious SSL Traffic Hike from ... | SA - Incident - Suspicious SSL Traffic |