Apache - Classic Collector

The Apache app is a unified logs and metrics app that helps you monitor the availability, performance, health, and resource utilization of Apache web server farms. Preconfigured dashboards and searches provide visibility into your environment for real-time or historical analysis: visitor locations, visitor access types, traffic patterns, errors, web server operations, resource utilization, and access from known malicious sources.
Log types and metrics
The Sumo Logic app for Apache assumes:
-
The NCSA extended/combined log file format has been configured for Apache access logs and the default error log format for Apache Access logs and Apache Error logs. For a list of metrics that are collected and used by the app, see Apache Metrics.
-
The Apache - Overview dashboard is based on both Apache logs and metrics.
-
Dashboards in the Metrics folder are based on Apache metrics alone.
-
Dashboards and searches in the Logs folder are based on Apache access and error logs
Sample log messages
- Kubernetes environments
- Non-Kubernetes environments
{
	"timestamp":1620630466883,
	"log":"192.168.29.177 - - [10/May/2021:07:07:44 +0000] \"GET / HTTP/1.1\" 200 45",
	"stream":"stdout",
	"time":"2021-05-10T07:07:44.649858568Z"
}
{
	"timestamp":1620125665927,
	"log":"[Tue May 04 10:54:25.460469 2021] [ssl:error] [pid 53] [client 192.168.85.135:52327] AH02042: rejecting client initiated renegotiation",
	"stream":"stderr",
	"time":"2021-05-04T10:54:25.460664201Z"
}
192.168.29.177 - - [26/Apr/2021:12:18:32 +0530] "GET /server-status HTTP/1.1" 404 196
[Mon Apr 26 09:52:58.188858 2021] [core:notice] [pid 530] AH00094: Command line: '/usr/sbin/httpd -D FOREGROUND'
Sample queries
This sample Query is from the Top 5 Clients Causing 4xx Errors panel of the Apache - Web server Operations dashboard.
webserver_system=apache webserver_farm=* HTTP (40* OR 41* OR 42* OR 43* OR 44* or 45* or 49*)
| json "log" nodrop | if (_raw matches "{*", log, _raw) as mesg
| parse regex field=mesg "^(?<src_ip>\d{1,3}\.\d{1,3}\.\d{1,3}\.\d{1,3})" nodrop
| parse regex field=mesg "(?<method>[A-Z]+)\s(?<url>\S+)\sHTTP\/[\d\.]+[\\n]*\"\s(?<status_code>\d+)\s(?<size>[\d-]+)" nodrop
| parse regex field=mesg "(?<method>[A-Z]+)\s(?<url>\S+)\sHTTP\/[\d\.]+[\\n]*\"\s(?<status_code>\d+)\s(?<size>[\d-]+)\s\"(?<referrer>.*?)\"\s\"(?<user_agent>.+?)\".*" nodrop
| where status_code matches "4*"
| count as count by src_ip
| sort count, src_ip asc
| limit 5
Apache app Searches
The predefined searches in the Apache app are based on the Apache Access logs and Apache Error logs.
Searches based on Apache Access logs
- Apache - All HTTP Response codes with their count
- Apache - Client Errors (4xx response codes) per day
- Apache - HTTP status code summary over time
- Apache - Malicious URL requests
- Apache - Robots
- Apache - Slowest URLs by average time
- Apache - Time taken to serve requests
- Apache - Top 404 referrers
- Apache - Top browsers
- Apache - Top clients
- Apache - Top clients causing errors responses
- Apache - Top URLs by bytes served
- Apache - Traffic volume and bytes served per day
Search based on Apache Error logs
- Apache - Critical log messages
- Apache - Log Level counts
- Apache - Server start and stop events
- Apache - Server stops and starts over time
- Apache - Top error reasons
- Apache - Top files causing errors
- Apache - Top Referrers causing errors
Collecting logs and metrics for Apache
Sumo Logic supports the collection of logs and metrics data from Apache in both Kubernetes and non-Kubernetes environments. Please click on the appropriate link below based on the environment where your Apache farms are hosted.
- Kubernetes environments
- Non-Kubernetes environments
In Kubernetes environments, we use the Telegraf Operator, which is packaged with our Kubernetes collection. You can learn more about it here.The diagram below illustrates how data is collected from Apache in Kubernetes environments. In the architecture shown below, there are four services that make up the metric collection pipeline: Telegraf, Telegraf Operator, Prometheus, and Sumo Logic Distribution for OpenTelemetry Collector.
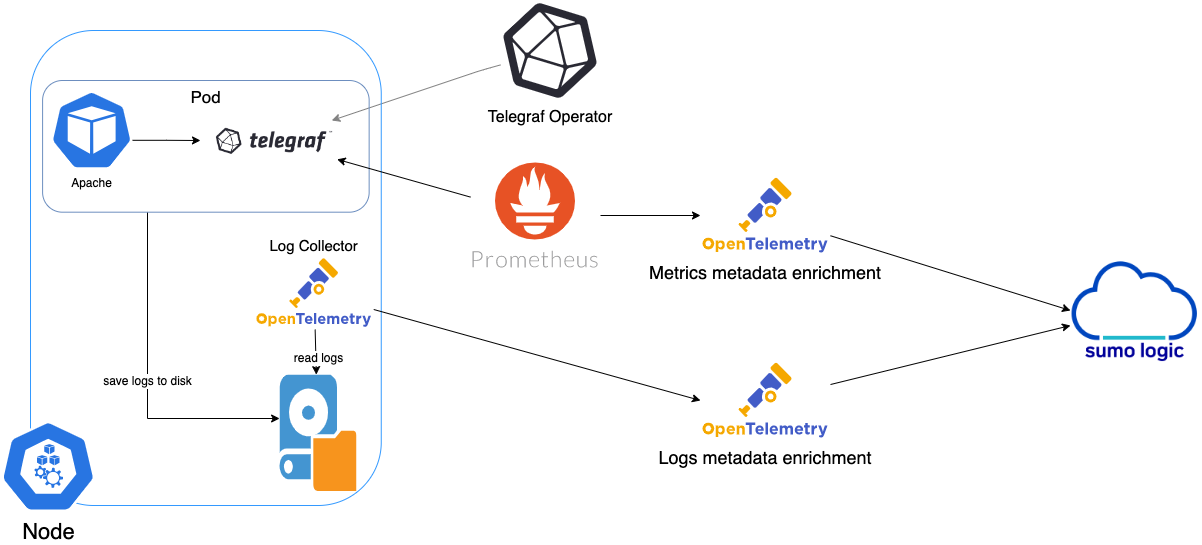
The first service in the pipeline is Telegraf. Telegraf collects metrics from Apache. Note that we’re running Telegraf in each pod we want to collect metrics from as a sidecar deployment, meaning, Telegraf runs in the same pod as the containers it monitors.
Telegraf uses the Apache input plugin to obtain metrics. For simplicity, the diagram doesn’t show the input plugins. The injection of the Telegraf sidecar container is done by the Telegraf Operator. Prometheus pulls metrics from Telegraf and sends them to Sumo Logic Distribution for OpenTelemetry Collector, which enriches metadata and sends metrics to Sumo Logic.
In the logs pipeline, Sumo Logic Distribution for OpenTelemetry Collector collects logs written to standard out and forwards them to another instance of Sumo Logic Distribution for OpenTelemetry Collector, which enriches metadata and sends logs to Sumo Logic.
Ensure that you are monitoring your Kubernetes clusters with the Telegraf operator. If you're not, see these instructions to do so.
Configure metrics collection
Follow the steps below to collect metrics from a Kubernetes environment:
- Add configuration to enable metrics on Apache pods:
configuration: |-
ServerName localhost:8080
  <IfModule status_module>
    ExtendedStatus On
    <Location /server-status>
      Sethandler server-status
      order deny,allow
      allow from all
    </Location>
  </IfModule>
- Add annotations on your Apache pods:
annotations:
 telegraf.influxdata.com/class: sumologic-prometheus
  prometheus.io/scrape: "true"
  prometheus.io/port: "9273"
  telegraf.influxdata.com/inputs: |+
    [[inputs.apache]]
    < urls = ["http://localhost:8080/server-status?auto"] >
      [inputs.apache.tags]
        environment = "<prod_CHANGE_ME>"
        component = "webserver"
        webserver_system = "apache"
        webserver_farm = "<app1apacheeks_CHANGE_ME>"
-
Enter in values for the parameters marked in brackets (
< >) above.telegraf.influxdata.com/inputs: This contains the required configuration for the Telegraf Apache Input plugin. Please refer to this doc for more information on configuring the Apache input plugin for Telegraf. Note: As telegraf will be run as a sidecar the host should always be localhost.- In the input plugins section:
urls: The URL to the Apache server- In the tags section
[inputs.apache.tags] environment: This is the deployment environment where the Apache webserver farm identified by the value ofurlsresides. For example: dev, prod or qa. While this value is optional we highly recommend setting it.webserver_farm: Enter a name to uniquely identify this Apache Webserver farm. This Apache webserver farm name will be shown in the Sumo Logic dashboards.
- In the input plugins section:
warningDo not modify the following values Modifying these values will cause the Sumo Logic apps to function incorrectly.
telegraf.influxdata.com/class: sumologic-prometheus: Instructs the Telegraf operator on what output to use.prometheus.io/scrape: "true": Ensures our Prometheus will scrape the metrics.prometheus.io/port: "9273": Tells Prometheus what ports to scrape on.telegraf.influxdata.com/inputs- In the tags section
[inputs.apache.tags] component: “webserver”: Used by Sumo Logic apps to identify application components.webserver_system: “apache”: Identifies the webserver system.
- In the tags section
- For more information on other parameters and properties that you can configure in the Telegraf agent globally, see Configuring_Telegraf.
- For more information on configuring the Apache input plugin for Telegraf, see this doc.
-
Sumo Logic Kubernetes collection will automatically start collecting metrics from the pods having the configuration and annotations defined in the previous step.
-
Verify metrics in Sumo Logic by running the following metrics query:
webserver_farm=<your_apache_webserver_farmname> \
component="webserver" and webserver_system="apache"
Configure logs collection
This section explains the steps to collect Apache logs from a Kubernetes environment.
-
Collect Apache logs written to standard output and standard error. If your Apache helm chart/pod is writing the logs to standard output or standard error then follow the steps listed below to collect the logs:
- On your Apache pods, add the following pod labels:
environment: "<prod_CHANGE_ME>"
component: "webserver"
webserver_system: "apache"
webserver_farm: "<app1apacheeks_CHANGE_ME>"- Enter in values for the parameters marked in brackets (
< >) above.environment: This is the deployment environment where the Apache webserver farm identified by the value ofurlsresides. For example: dev, prod or qa. While this value is optional we highly recommend setting it.webserver_farm: Enter a name to identify this Apache webserver farm. This Apache webserver farm name will be shown in the Sumo Logic dashboards.
warningDo not modify the following values Modifying these values will cause the Sumo Logic apps to function incorrectly
component: “webserver”: This value is used by Sumo Logic apps to identify application components.webserver_system: “apache”: This value identifies the webserver system.
- For all other parameters, please see this doc for more parameters that can be configured in the Telegraf agent globally.
- Make sure that the Apache pods are running and annotations are applied by using the command:
kubectl describe pod <apache_pod_name>The Sumo Logic Kubernetes Collection process will automatically capture the logs from
stdout/stderrand will send the logs to Sumo Logic. For more information on deploying the Sumo Logic-Kubernetes-Collection, please see this page.
FER to normalize the fields in Kubernetes environments. Labels created in Kubernetes environments automatically are prefixed with pod_labels. To normalize these for our app to work, a Field Extraction Rule named AppObservabilityApacheWebserverFER is automatically created for Apache Web Server Application Components.
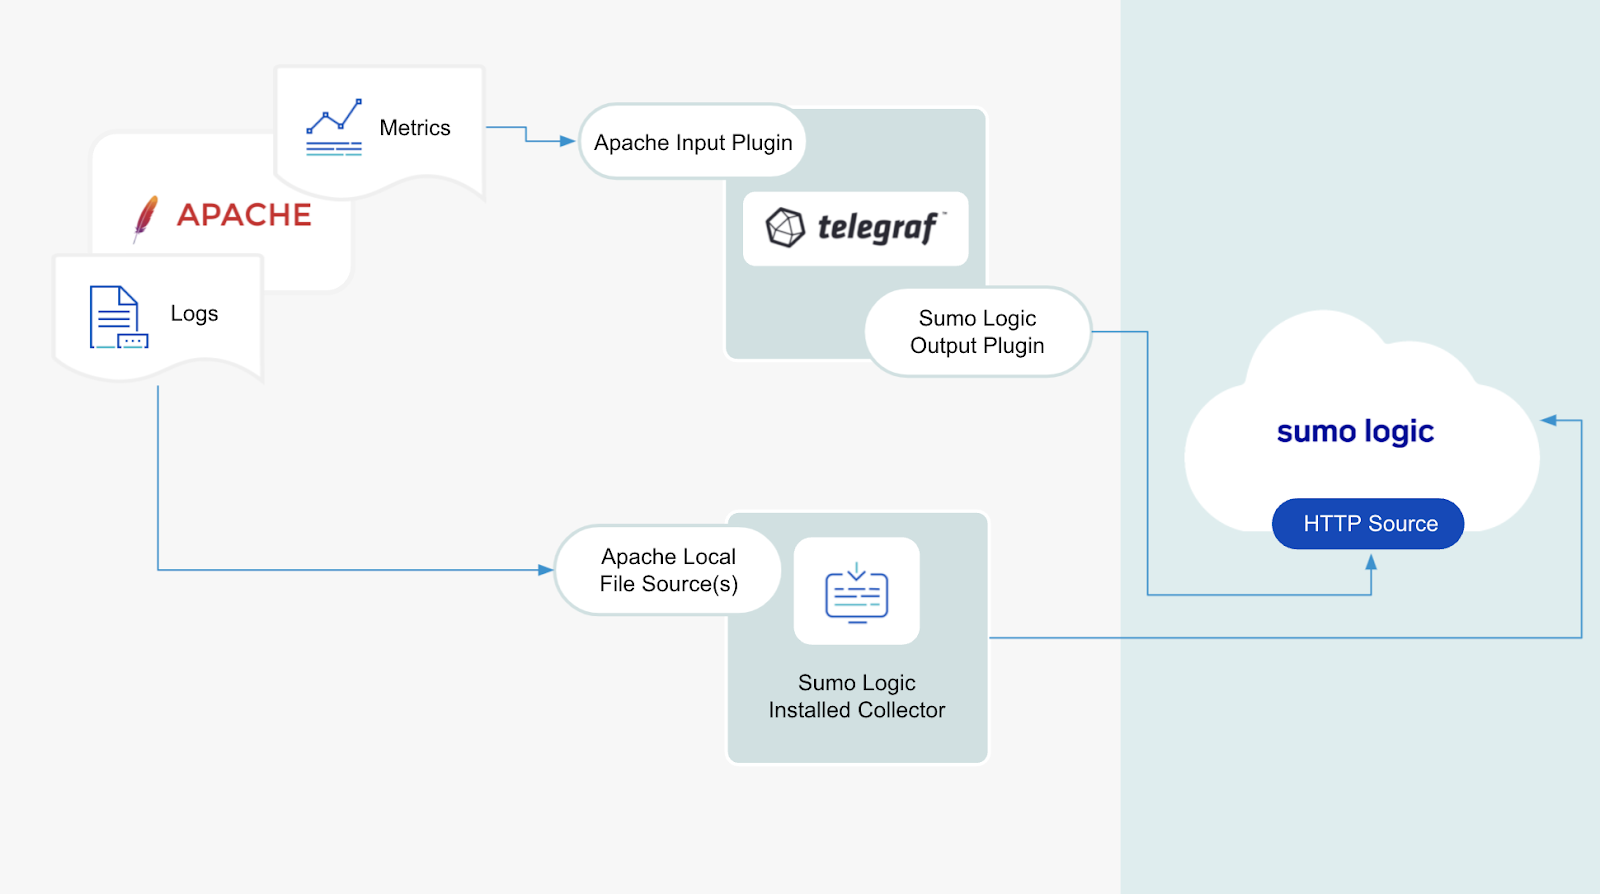
We use the Telegraf Operator for Apache metrics collection and the Sumo Logic Installed Collector for collecting Apache logs. The diagram below illustrates the components of the Apache collection in a non-Kubernetes environment for each web server. Telegraf runs on the same host as Apache, and uses the Apache input plugin to obtain Apache metrics, and the Sumo Logic output plugin to send the metrics to Sumo Logic. Apache logs are sent to a Sumo Logic Local File source of an installed collector.
This section provides instructions for configuring metrics collection for the Sumo Logic app for Apache. Follow the instructions to set up metrics collection for each server belonging to a Apache server farm:
Configure metrics collection from an Apache server
-
Configure Metrics in Apache. Before you can configure Sumo Logic to ingest metrics, you must turn on server-status for Apache. For this, edit the Apache conf file (httpd.conf).
- Uncomment this line if not already done in the httpd.conf:
LoadModule status_module libexec/apache2/mod_status.so - Add the following lines in the httpd.conf after that
<IfModule status_module>
  ExtendedStatus On
 <Location /server-status>
    Sethandler server-status
    order deny,allow
    allow from localhost
  </Location>
</IfModule>- You may need to update ServerName in the httpd.conf file. For example:
ServerName localhost:80. - Save httpd.conf file
- Verify configuration is working as expected by running the following command:
apachectl configtest
# Syntax OK- Restart httpd
apachectl restart - To test, enter the following urls in the web-browser. You should see the standard Apache output.
- Uncomment this line if not already done in the httpd.conf:
-
Configure a Hosted Collector. To create a new Sumo Logic hosted collector, perform the steps in the Configure a Hosted Collector section of the Sumo Logic documentation.
-
Configure an HTTP Logs and Metrics Source. Create a new HTTP Logs and Metrics Source in the hosted collector created above by following these instructions.. Make a note of the HTTP Source URL.
-
Install Telegraf. Follow the steps in this document to install Telegraf.
-
Configure and start Telegraf. As part of collecting metrics data from Telegraf, we will use the Apache input plugin to get data from Telegraf and the Sumo Logic output plugin to send data to Sumo Logic.
-
Create or modify the telegraf.conf file and copy and paste the text below in the relevant sections:
[[inputs.apache]]
  urls = ["http://localhost/server-status?auto"]
  response_timeout = "5s"
  [inputs.apache.tags]
    environment = "prod"
    component = "webserver"
    webserver_system = "apache"
    webserver_farm = "your_apache_webserver_farmname"

[[outputs.sumologic]]
  url = "<URL Created in Step 3>"
  data_format = "prometheus"

[agent]
  interval = "60s"
flush_interval = "60s" -
Enter values for the following parameters (marked
CHANGEMEabove):- In the input plugins section:
urls: The URL to the Apache server. Please see this doc for more information on additional parameters for configuring the Apache input plugin for Telegraf.
- Configure metrics to collect by uncommenting the following lines. Please see this document for more information
response_timeout = "5s"
- In the tags section
[inputs.apache.tags]webserver_farm: Enter a name to uniquely identify this Apache web server farm. This web server farm name will be shown in the Sumo Logic dashboards.environment: This is the deployment environment where the Apache web server farm identified by the value ofurlsresides. For example: dev, prod or qa. While this value is optional we highly recommend setting it.
- In the output plugins section:
url: This is the HTTP source URL created in step 3. Please see this doc for more information on additional parameters for configuring the Sumo Logic Telegraf output plugin.
- In the
[agent]section, setintervalandflush_intervalto“60s”to collect metric every 60 seconds.
warningDo not modify the following values Modifying these values will cause the Sumo Logic apps to function incorrectly
data_format = “prometheus”, In the output plugins section, Metrics are sent in the Prometheus format to Sumo Logiccomponent = “webserver”: In the input plugins section, This value is used by Sumo Logic apps to identify application components.webserver_system = “apache”: In the input plugins section, This value identifies the webserver system.
- In the input plugins section:
For all other parameters, see this doc for more parameters that can be configured in the Telegraf agent globally.
- Once you have finalized your telegraf.conf file, you can start or reload the telegraf service via the instructions described in their documentation.
-
At this point, Apache metrics should start flowing into Sumo Logic.
Configure logs collection from an Apache server
This section provides instructions for configuring a collection of logs from Apache running on a non-Kubernetes environment.
Apache logs (access logs and error logs) are stored in log files.
Sumo Logic supports collecting logs via a local log file. Local log files can be collected via Sumo Logic Installed collectors, which requires you to allow outbound traffic to Sumo Logic endpoints for collection to work.
- Configure Apache to log to a local file(s). Apache logs written to a log file can be collected via the Local File Source of a Sumo Logic Installed collector. Before you can configure Sumo Logic to ingest logs, you must configure the logging of access logs and error logs via the instructions described in their documentation.
To configure the Apache log file(s), locate your local httpd.conf configuration file in the Apache directory. After determining the location of the conf file, modify the httpd.conf configuration file logging parameters if required.
For access logs, the following directive is to be noted:
- CustomLog: access log file path and format (standard common and combined)
For error logs, the following directives are to be noted:
- ErrorLog: error log file path
- LogLevel: to control the number of messages logged to the error_log
- Configure an Installed Collector. To add an Installed collector, perform the steps as defined on the page Configure an Installed Collector.
- Configure a Local File Source for Apache access logs. To add a Local File Source for the Apache access log do the following
- Add a Local File Source in the installed collector configured in the previous step.
- Configure the Local File Source fields as follows:
- Name. (Required)
- Description. (Optional)
- File Path (Required). Enter the path to your Apache access logs. The files are typically located in
/var/log/apache2/access_log. If you're using a customized path, check the httpd.conf file for this information. - Source Host. Sumo Logic uses the hostname assigned by the OS unless you enter a different hostname.
- Source Category. Enter any string to tag the output collected from this Source, such as Prod/Apache/Access. (The Source Category metadata field is a fundamental building block to organize and label Sources. For details, see Best Practices.)
- Fields. Set the following fields. For more information on fields please see this document:
component = webserverwebserver_system = apachewebserver_farm = <your_apache_webserver_farmname>environment = <Environment_Name>, such as dev, qa, or prod.- The values of
webserver_farmandenvironmentshould be the same as they were configured in the Configure and start telegraf section. - Configure the Advanced Options for Logs section:
- Enable Timestamp Parsing. Select Extract timestamp information from log file entries.
- Time Zone. Select Use time zone from the log file, if none is detected use “Use Collector Default”
- Timestamp Format. Select Automatically detect the format.
- Encoding. Select UTF-8 (Default).
- Apache Access logs are single-line logs, uncheck Detect messages spanning multiple lines.
- Click Save. At this point, Apache access logs should start flowing into Sumo Logic.
- Configure a Local File Source for Apache error logs. To add a Local File Source for the Apache error log do the following:
- Add a Local File Source in the installed collector configured in the previous step.
- Configure the Local File Source fields as follows:
- Name. (Required)
- Description. (Optional)
- File Path (Required). Enter the path to your error_log. The files are typically located in
/var/log/apache2/error_log. If you're using a customized path, check the httpd.conf file for this information. - Source Host. Sumo Logic uses the hostname assigned by the OS unless you enter a different hostname.
- Source Category. Enter any string to tag the output collected from this Source, such as Prod/Apache/Error. (The Source Category metadata field is a fundamental building block to organize and label Sources. For details, see Best Practices.)
- Fields. Set the following fields. For more information on fields please see this document:
component = webserver
webserver_system = apache
webserver_farm = <your_apache_webserver_farmname>
environment = <Environment_Name>--such as dev, qa or prod- The values of
webserver_farmandenvironmentshould be the same as they were configured in the Configure and start telegraf section. - Configure the Advanced Options for Logs section:
- Enable Timestamp Parsing. Select Extract timestamp information from log file entries.
- Time Zone. Select Use time zone from the log file, if none is detected use “Use Collector Default”
- Timestamp Format. Select Automatically detect the format.
- Encoding. Select UTF-8 (Default).
- Apache Error logs are multiline-line logs, Select Detect messages spanning multiple lines and Boundary Regex: Expression to match message boundary.
- If error messages starts like
[Mon May 17 14:12:14.462704 2021]then use boundary regex as below
^\[\S{3}\s\S{3}\s\d{1,2}\s[^\]]+\].*- Click Save. At this point, Apache Error logs should start flowing into Sumo Logic.
Installing the Apache app
To install the app, do the following:
Next-Gen App: To install or update the app, you must be an account administrator or a user with Manage Apps, Manage Monitors, Manage Fields, Manage Metric Rules, and Manage Collectors capabilities depending upon the different content types part of the app.
- Select App Catalog.
- In the 🔎 Search Apps field, run a search for your desired app, then select it.
- Click Install App.
note
Sometimes this button says Add Integration.
- Click Next in the Setup Data section.
- In the Configure section of your respective app, complete the following fields.
- Field Name. If you already have collectors and sources set up, select the configured metadata field name (eg _sourcecategory) or specify other custom metadata (eg: _collector) along with its metadata Field Value.
- Is K8S deployment involved. Specify if resources being monitored are partially or fully deployed on Kubernetes (K8s)
- Click Next. You will be redirected to the Preview & Done section.
Post-installation
Once your app is installed, it will appear in your Installed Apps folder, and dashboard panels will start to fill automatically.
Each panel slowly fills with data matching the time range query received since the panel was created. Results will not immediately be available but will be updated with full graphs and charts over time.
As part of the app installation process, the following fields will be created by default:
componentenvironmentwebserver_systemwebserver_farm
Additionally, if you're using Apache in the Kubernetes environment, the following additional fields will be created by default during the app installation process:
pod_labels_componentpod_labels_environmentpod_labels_webserver_systempod_labels_webserver_farm
Viewing Apache dashboards
All dashboards have a set of filters that you can apply to the entire dashboard. Use these filters to drill down and examine the data to a granular level.
- You can change the time range for a dashboard or panel by selecting a predefined interval from a drop-down list, choosing a recently used time range, or specifying custom dates and times. Learn more.
- You can use template variables to drill down and examine the data on a granular level. For more information, see Filtering Dashboards with Template Variables.
- Most Next-Gen apps allow you to provide the scope at the installation time and are comprised of a key (
_sourceCategoryby default) and a default value for this key. Based on your input, the app dashboards will be parameterized with a dashboard variable, allowing you to change the dataset queried by all panels. This eliminates the need to create multiple copies of the same dashboard with different queries.
Overview
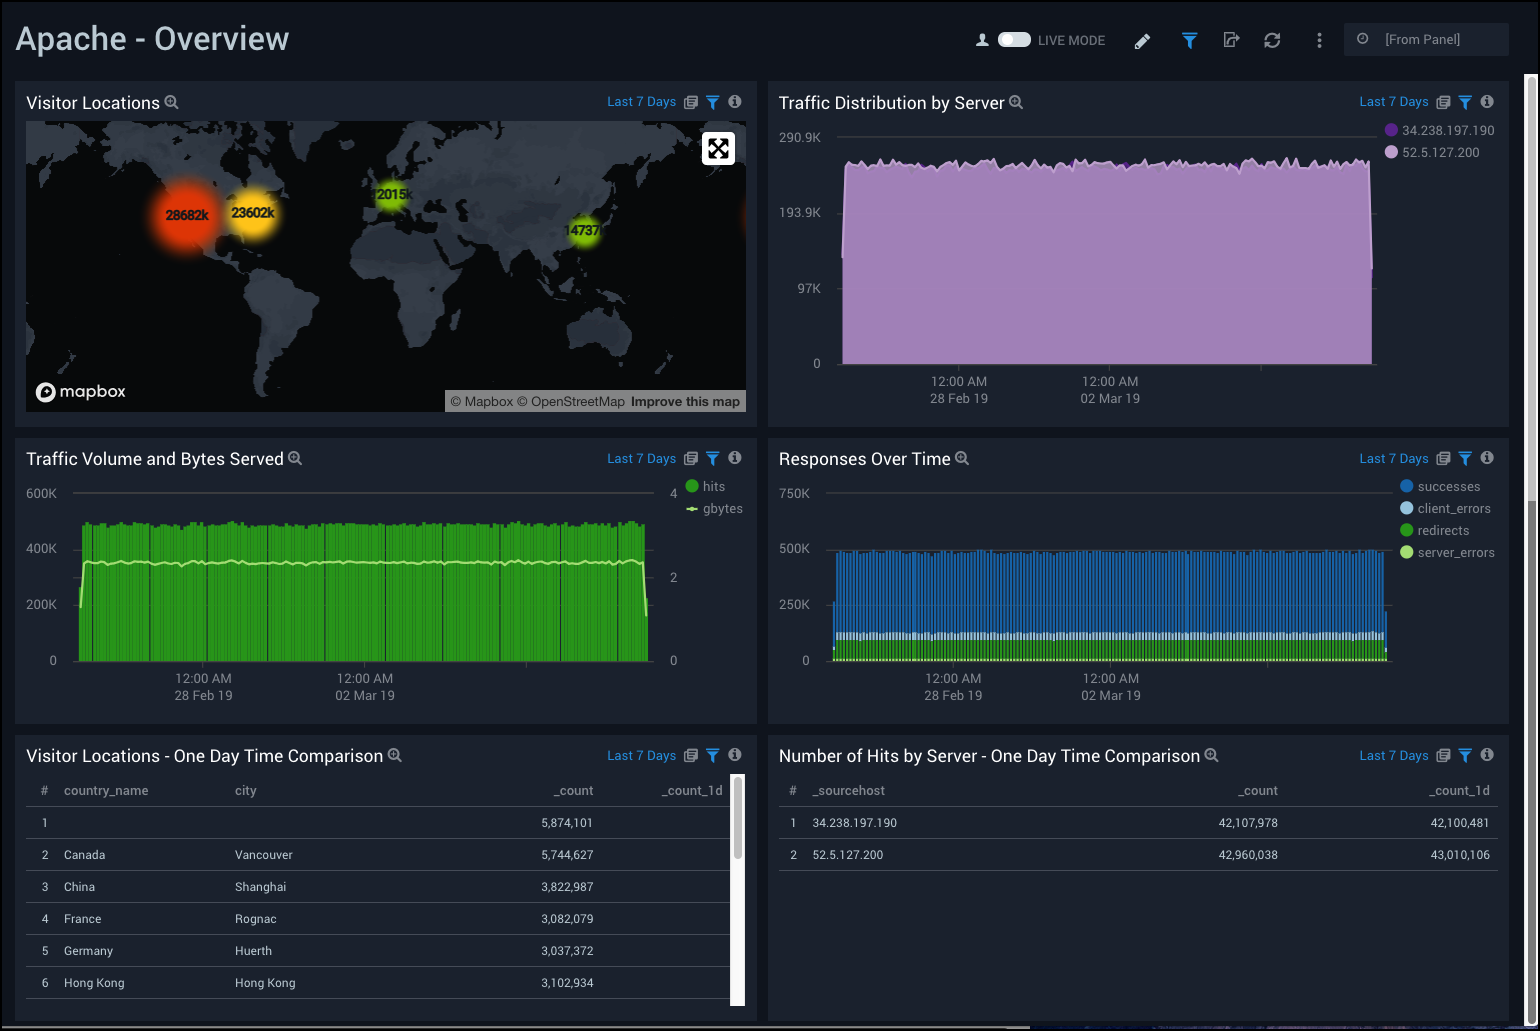
The Apache - Overview Dashboard provides an at-a-glance view of the activity and health of the Apache web server farms, and servers by monitoring uptime, requests, response, traffic, visitor geographic locations, and critical error messages.
Use this dashboard to:
- Get an at-a-glance view of the state of all your Apache web servers.
- Identify the top URLs causing errors.
- Identify the top critical error messages.
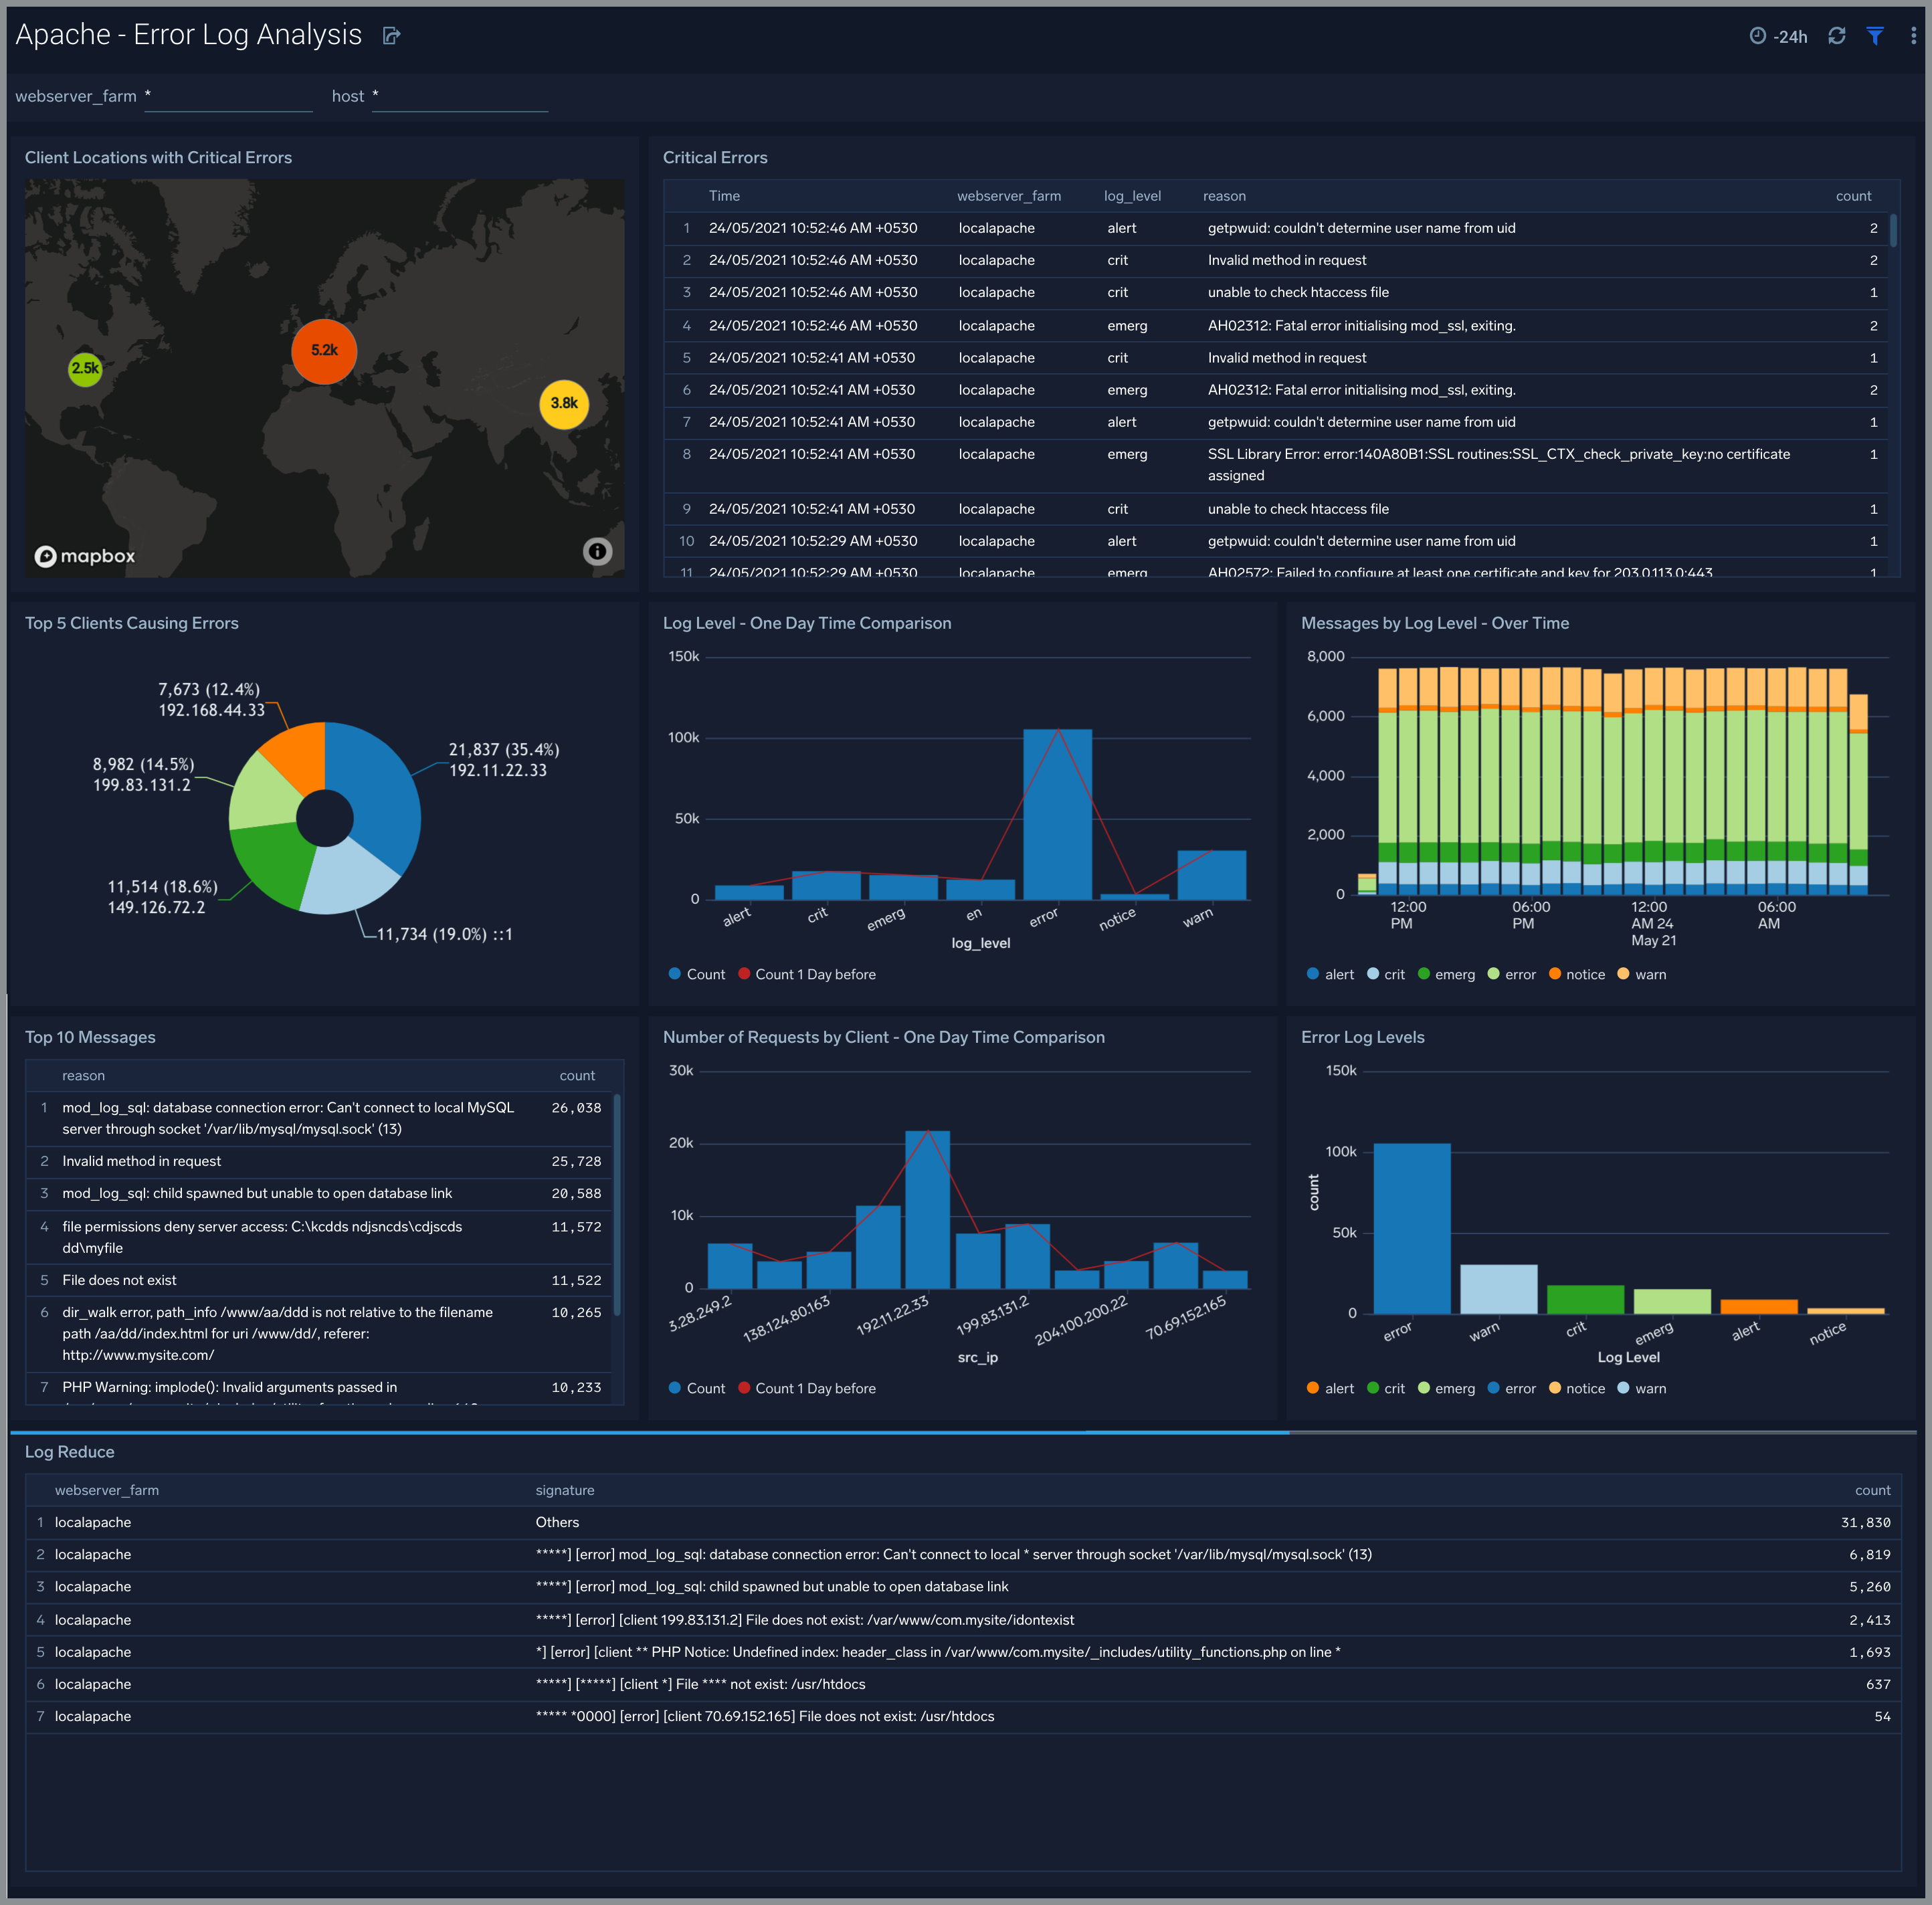
Error log analysis
The Apache - Error Log Analysis dashboard provides a high-level view of error log levels, clients causing errors, critical error messages and trends.
Use this dashboard to:
- Quickly identify critical errors affecting your Apache web servers.
- Analyze types and patterns of log messages in your Apache web servers.
- Identify clients causing the most errors.
- Monitor trends in error logs and identify outliers.
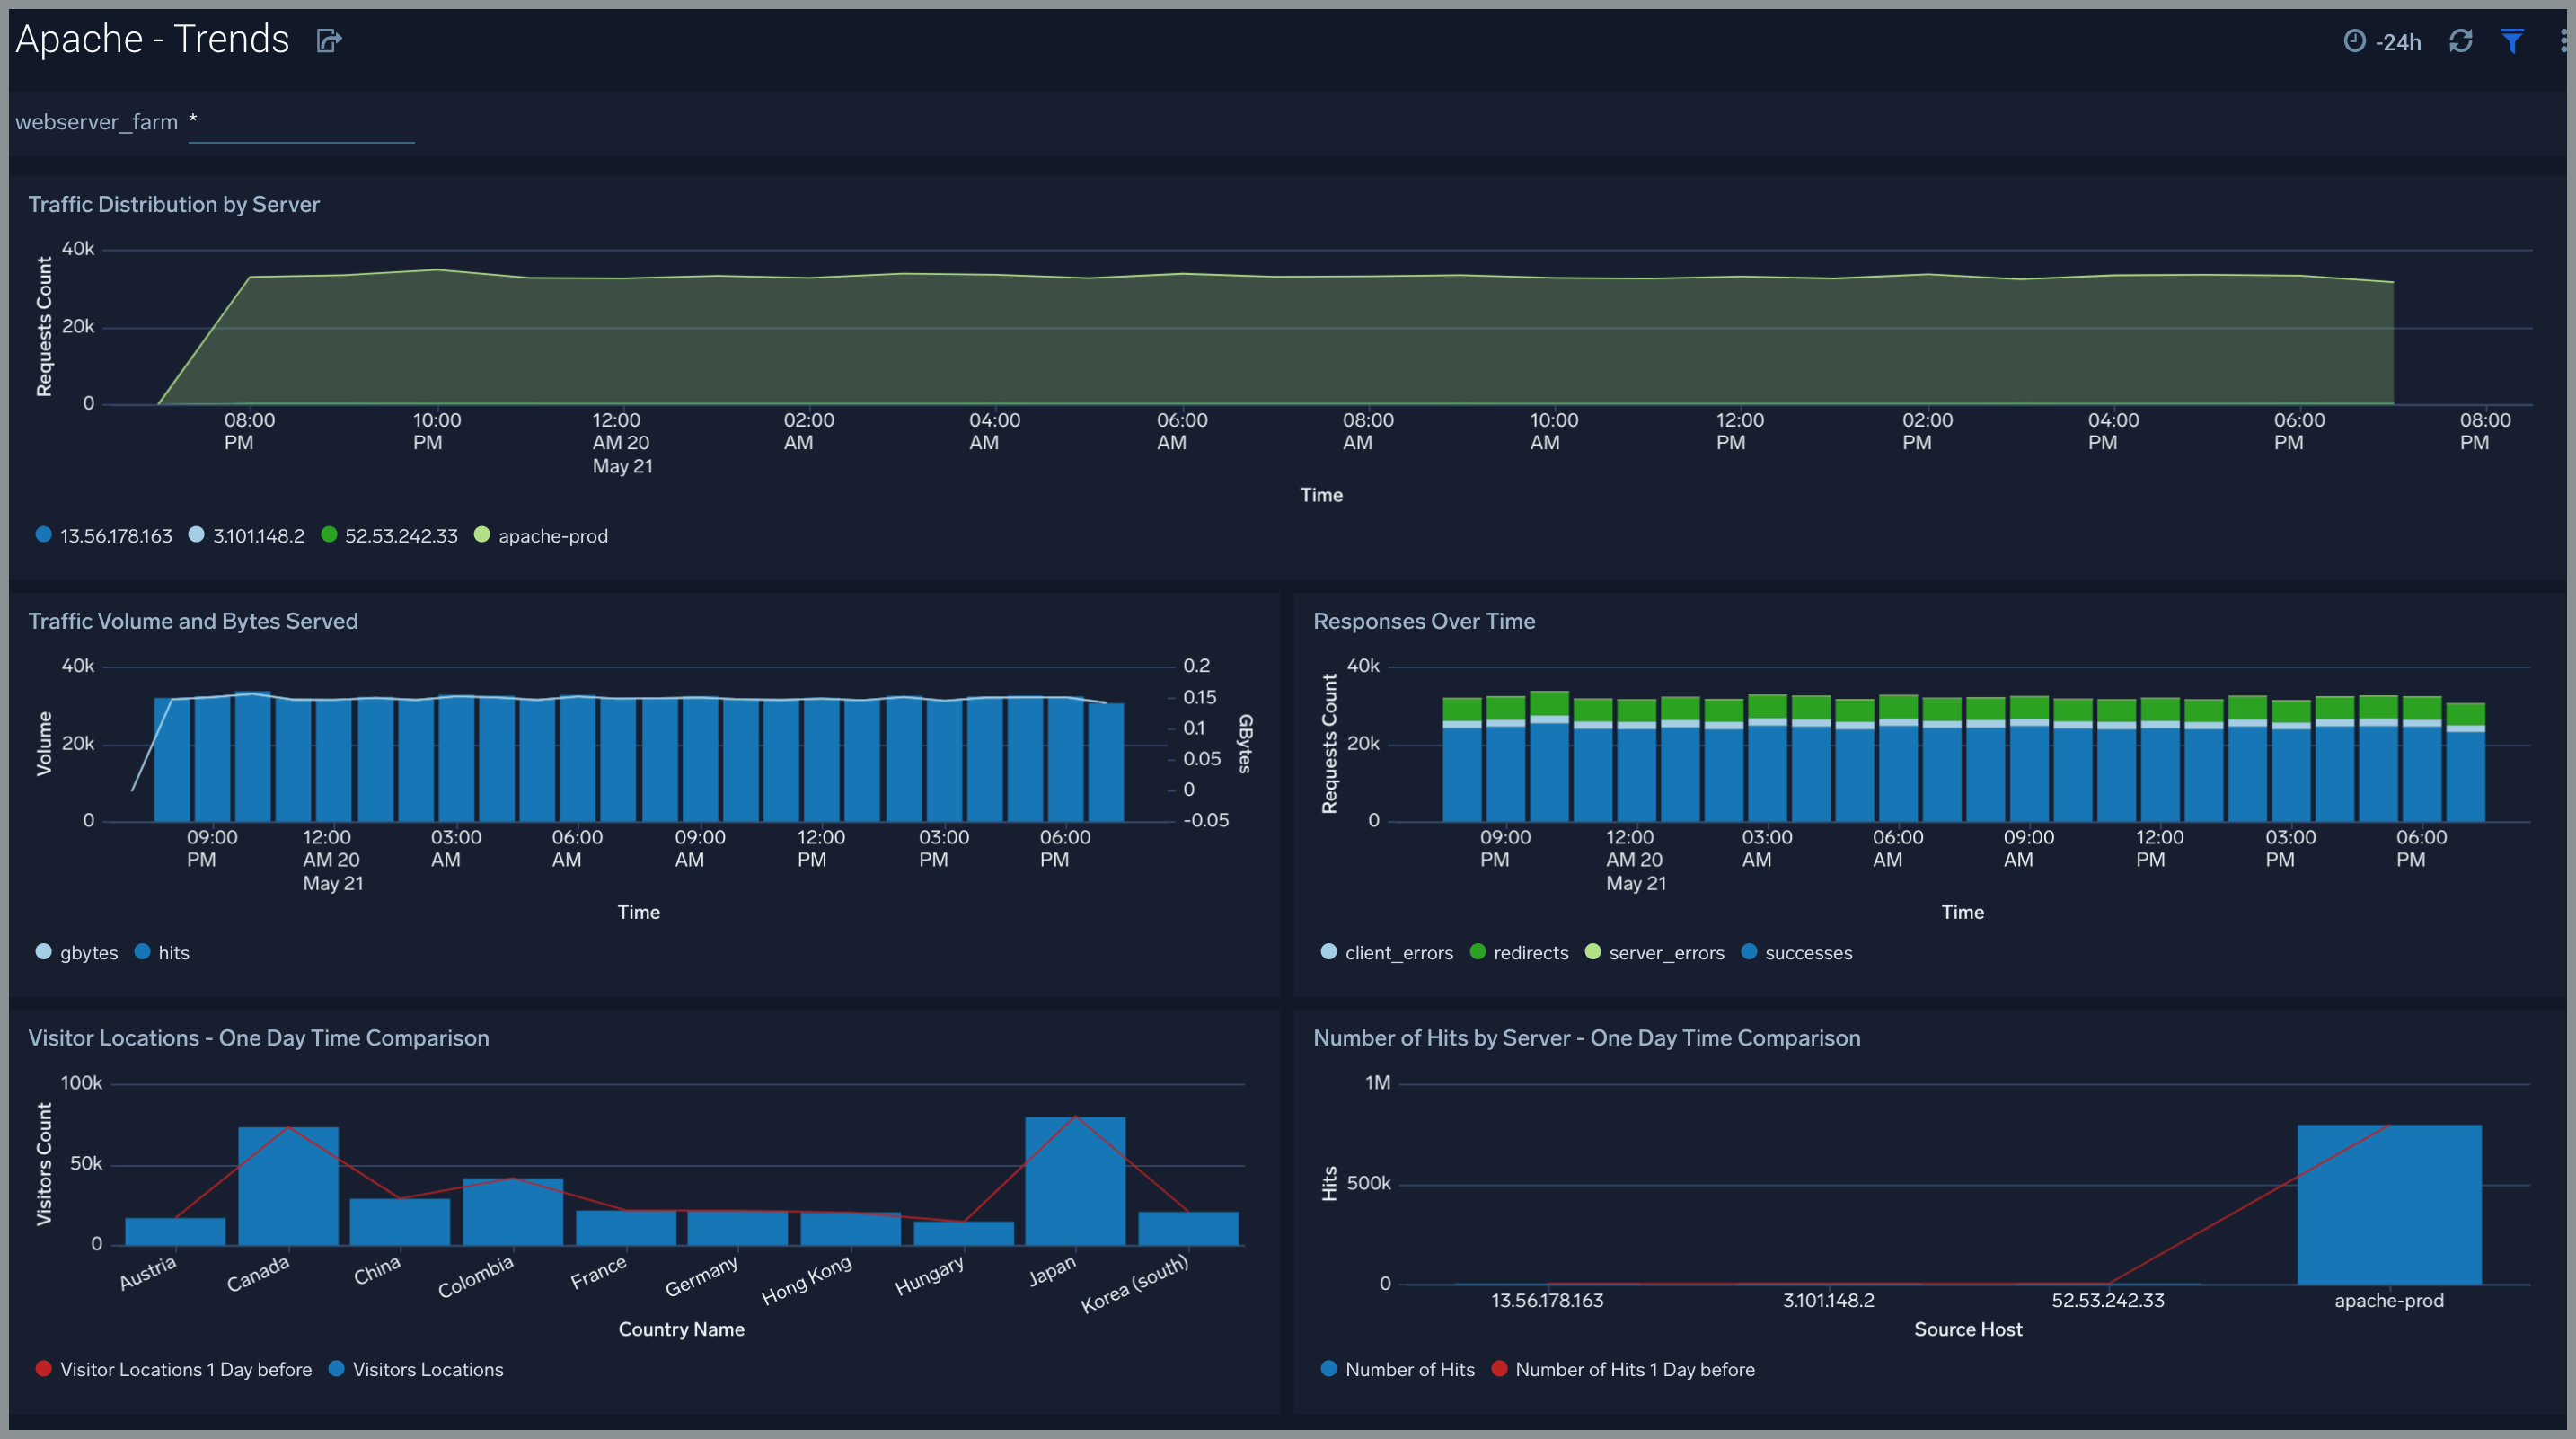
Trends
The Apache - Trends dashboard provides trends around HTTP responses, server hits, visitor locations, traffic volume, and distribution.
Use this dashboard to:
- Monitor trends and identify outliers.
Outlier Analysis
The Apache - Outlier Analysis dashboard helps you quickly identify outliers for key Apache metrics such as bytes served, number of visitors, server errors, and client errors.
Use this dashboard to:
- Automatically detect outliers in the operations of your Apache web servers and take corrective actions if needed.
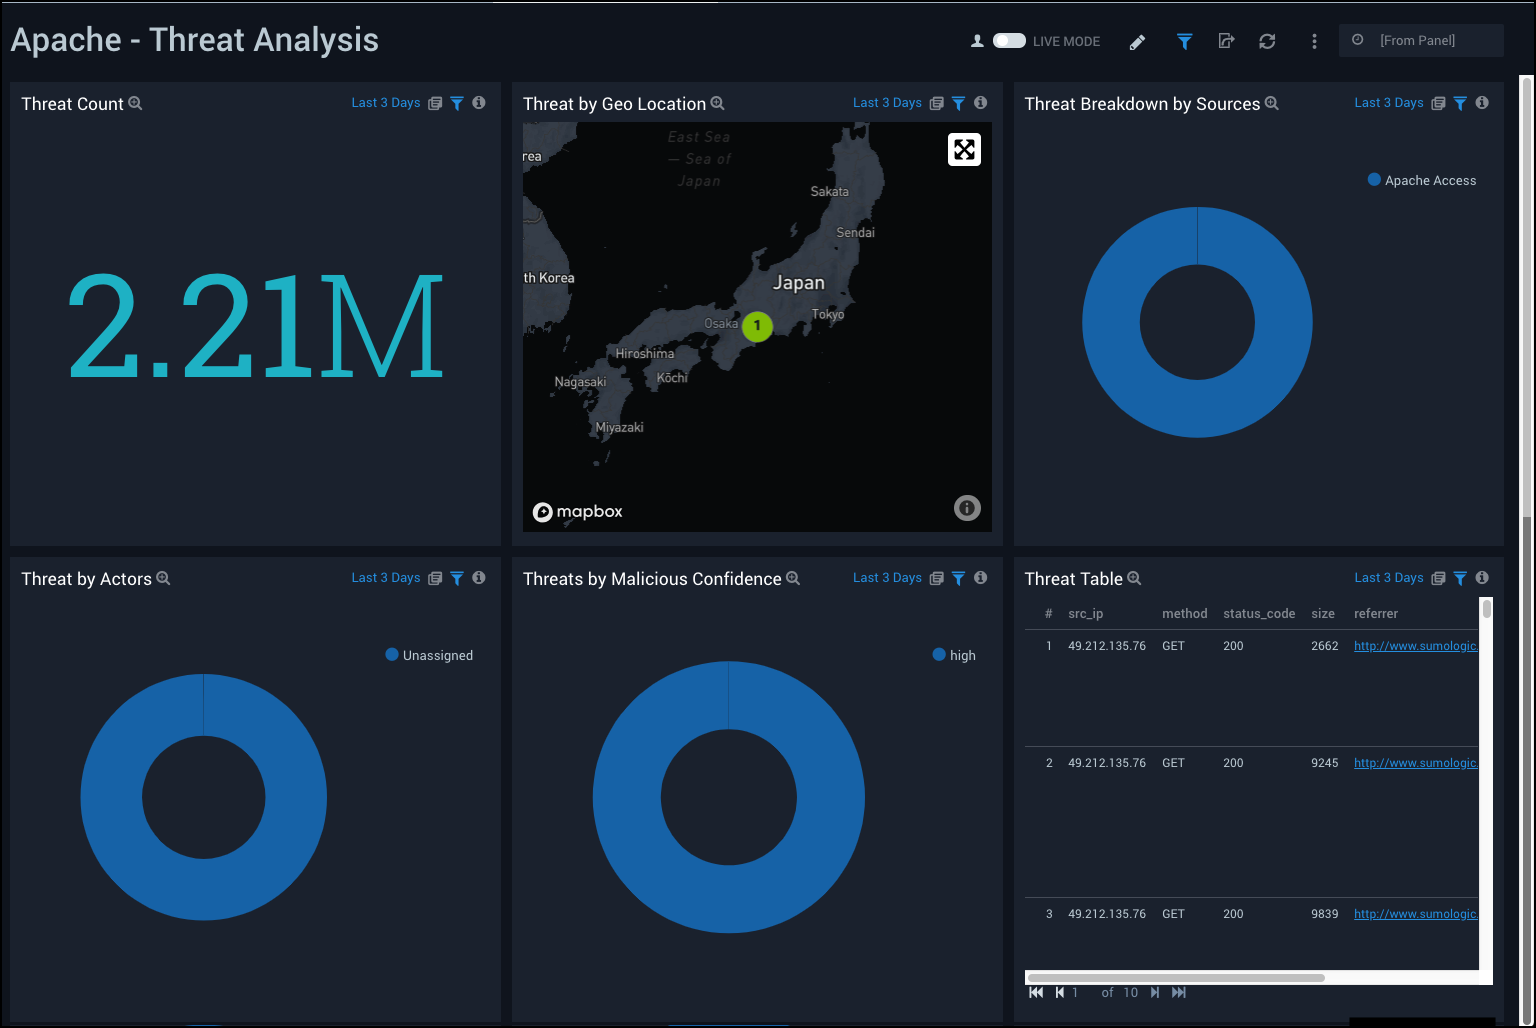
Threat Analysis
The Apache - Threat Intel dashboard provides an at-a-glance view of incoming threats to your Apache servers based on known malicious IP addresses.
Dashboard panels show threat counts, geographic locations, actors, threat severity, and URLS accessed.
Use this dashboard to:
- Identify threats from incoming traffic based on incoming client IP addresses and discover potential IOCs.
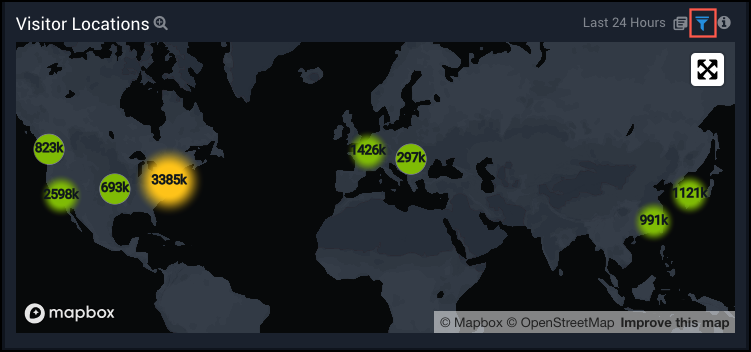
Visitor Locations
The Apache - Visitor Locations dashboard provides a high-level view of Apache visitor geographic locations both worldwide and in the United States.
Use this dashboard to:
- Get insights into the geographic locations of your user base.
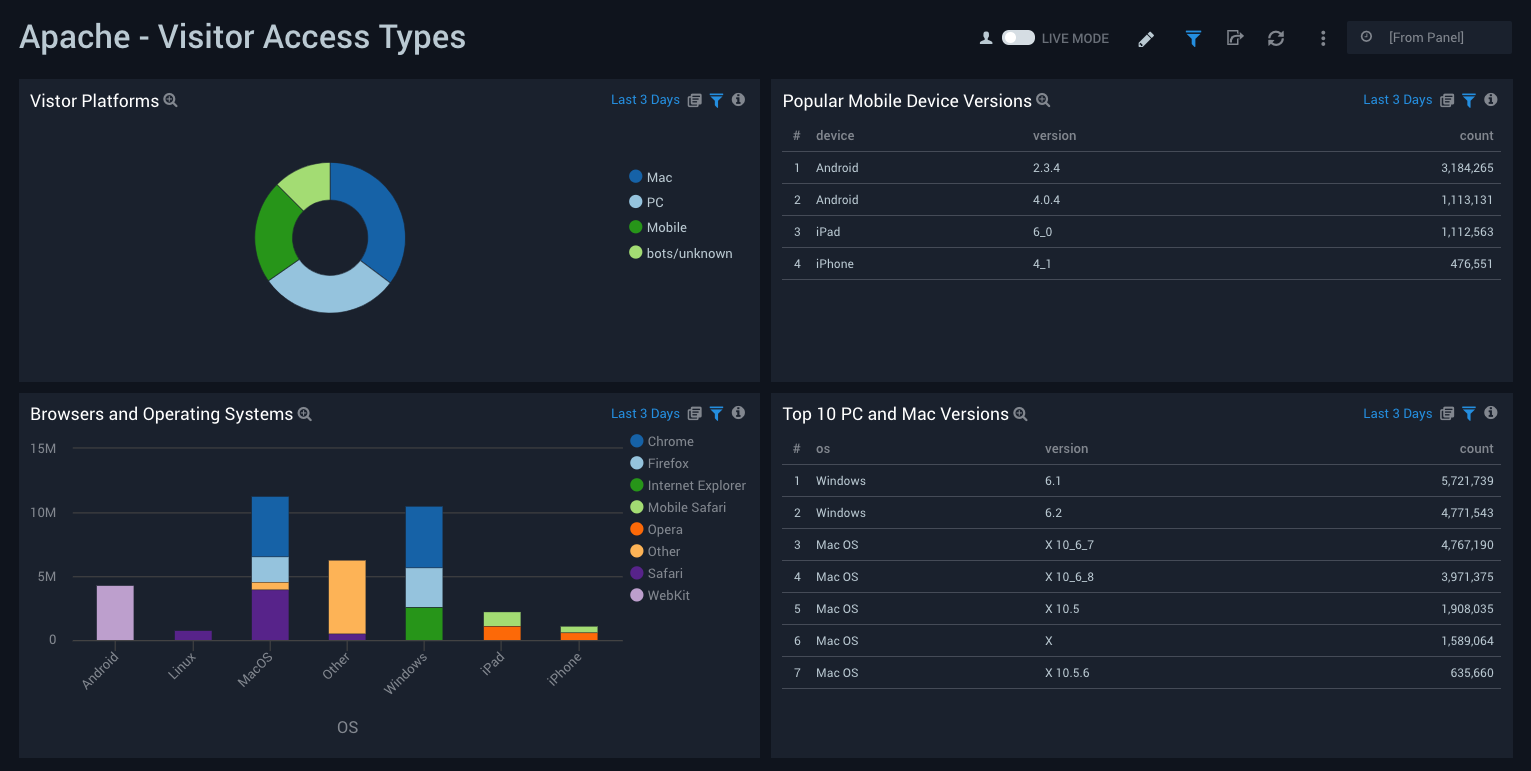
Visitor Access Types
The Apache - Visitor Access Types dashboard provides insights into visitor platform types, browsers, device types, and operating systems.
Use this dashboard to:
- Understand which platform and browsers are being used to access your applications.
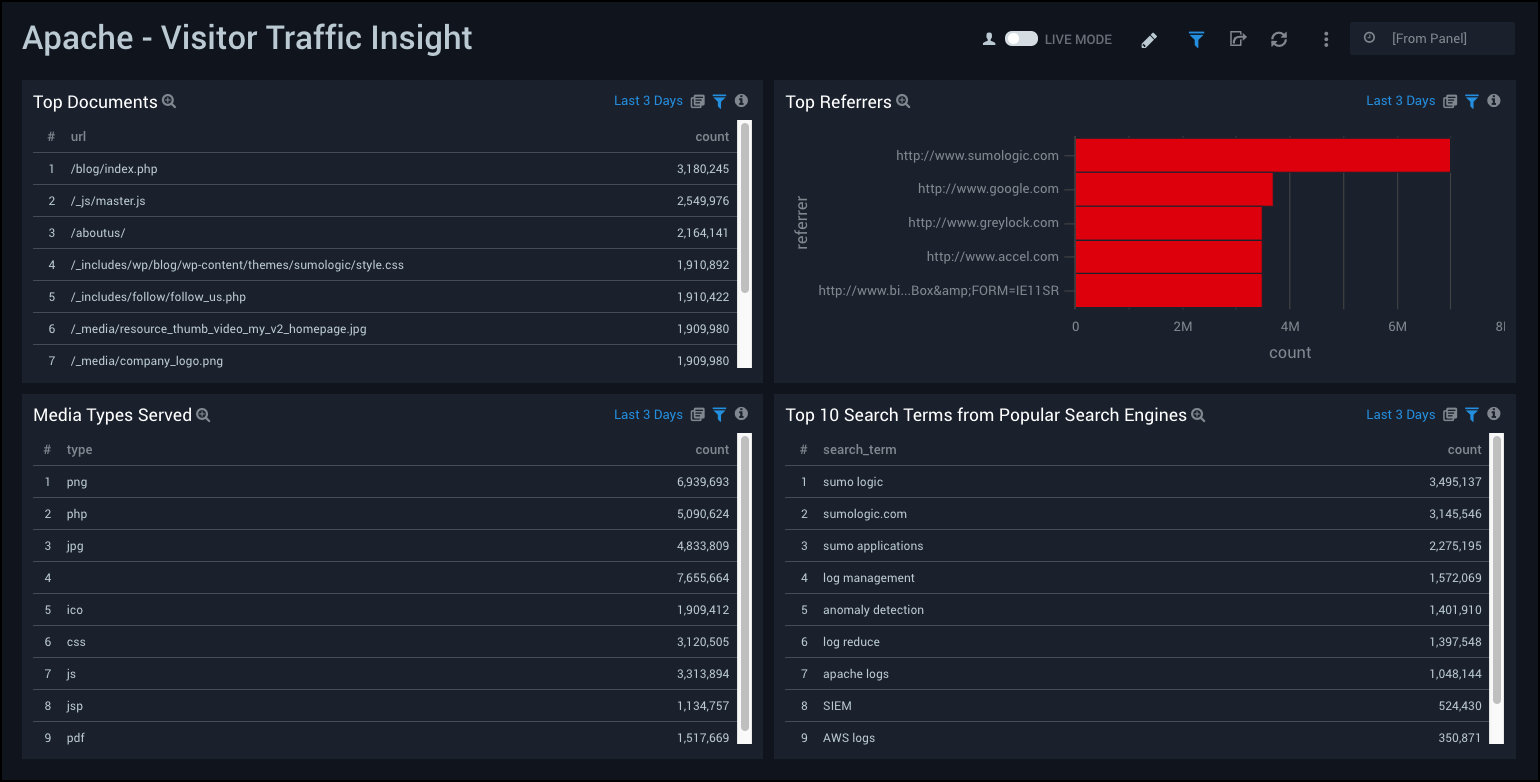
Visitor Traffic Insight
The Apache - Visitor Traffic Insight dashboard provides summarized information on the top URLs, referrers, search terms, and media types served.
Use this dashboard to:
- To understand content types of content that are frequently requested by users.
Web Server Operations
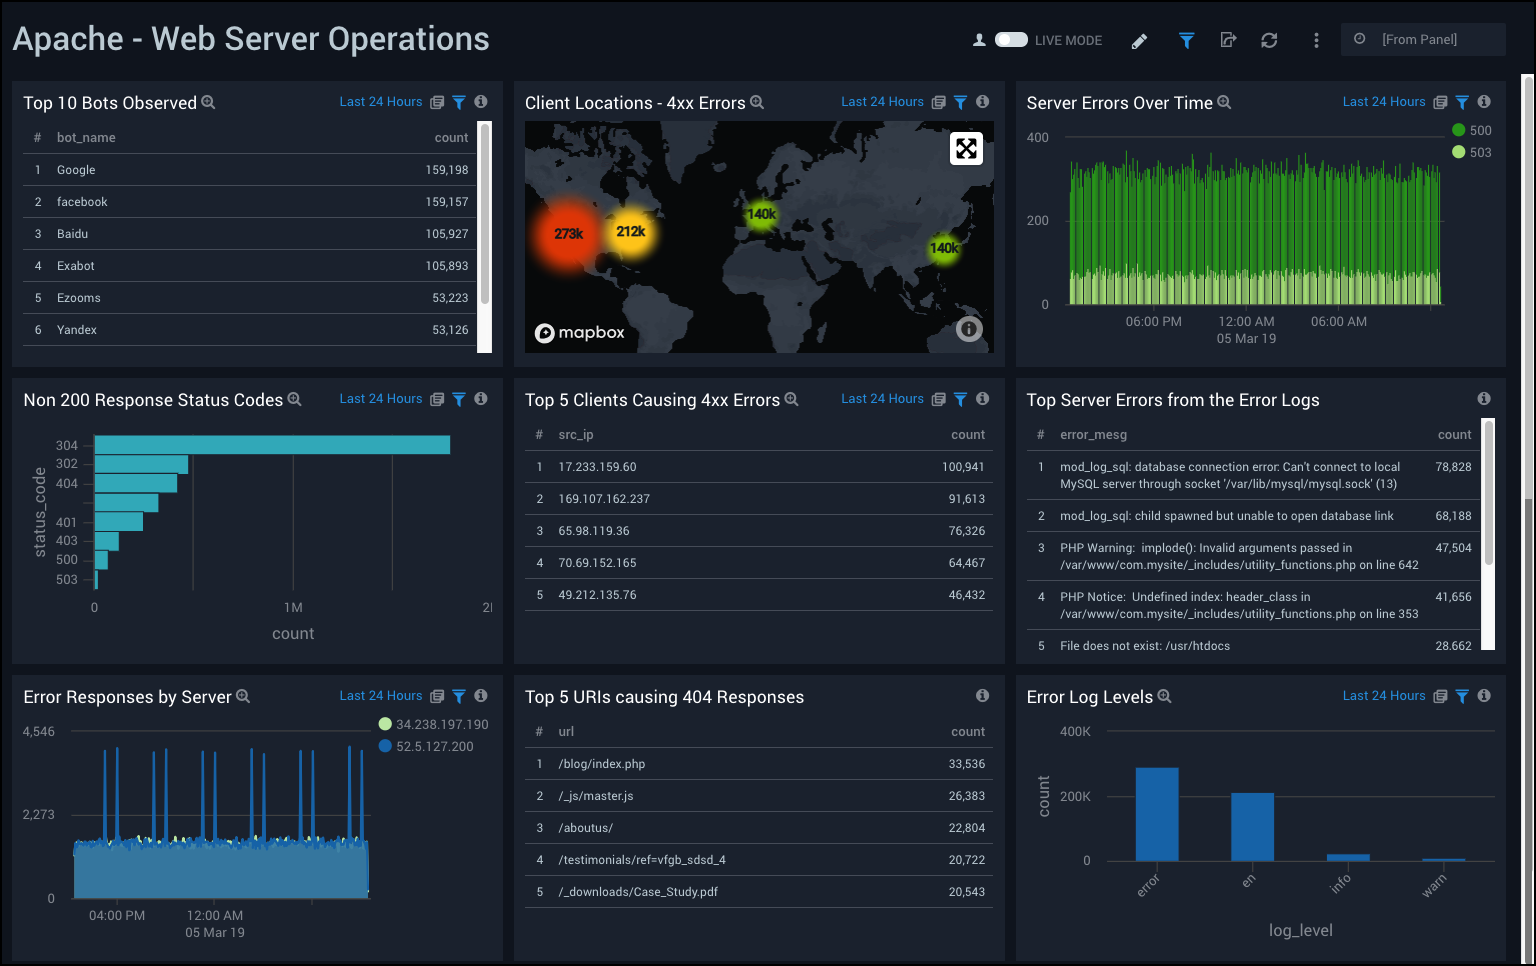
The Apache - Web Server Operations Dashboard provides an at-a-glance view of the operations of your Apache web servers. Dashboard panels show information on bots, geographic locations, errors and URLs.
Use this dashboard to:
- Get insights into client locations, bots, and response codes.
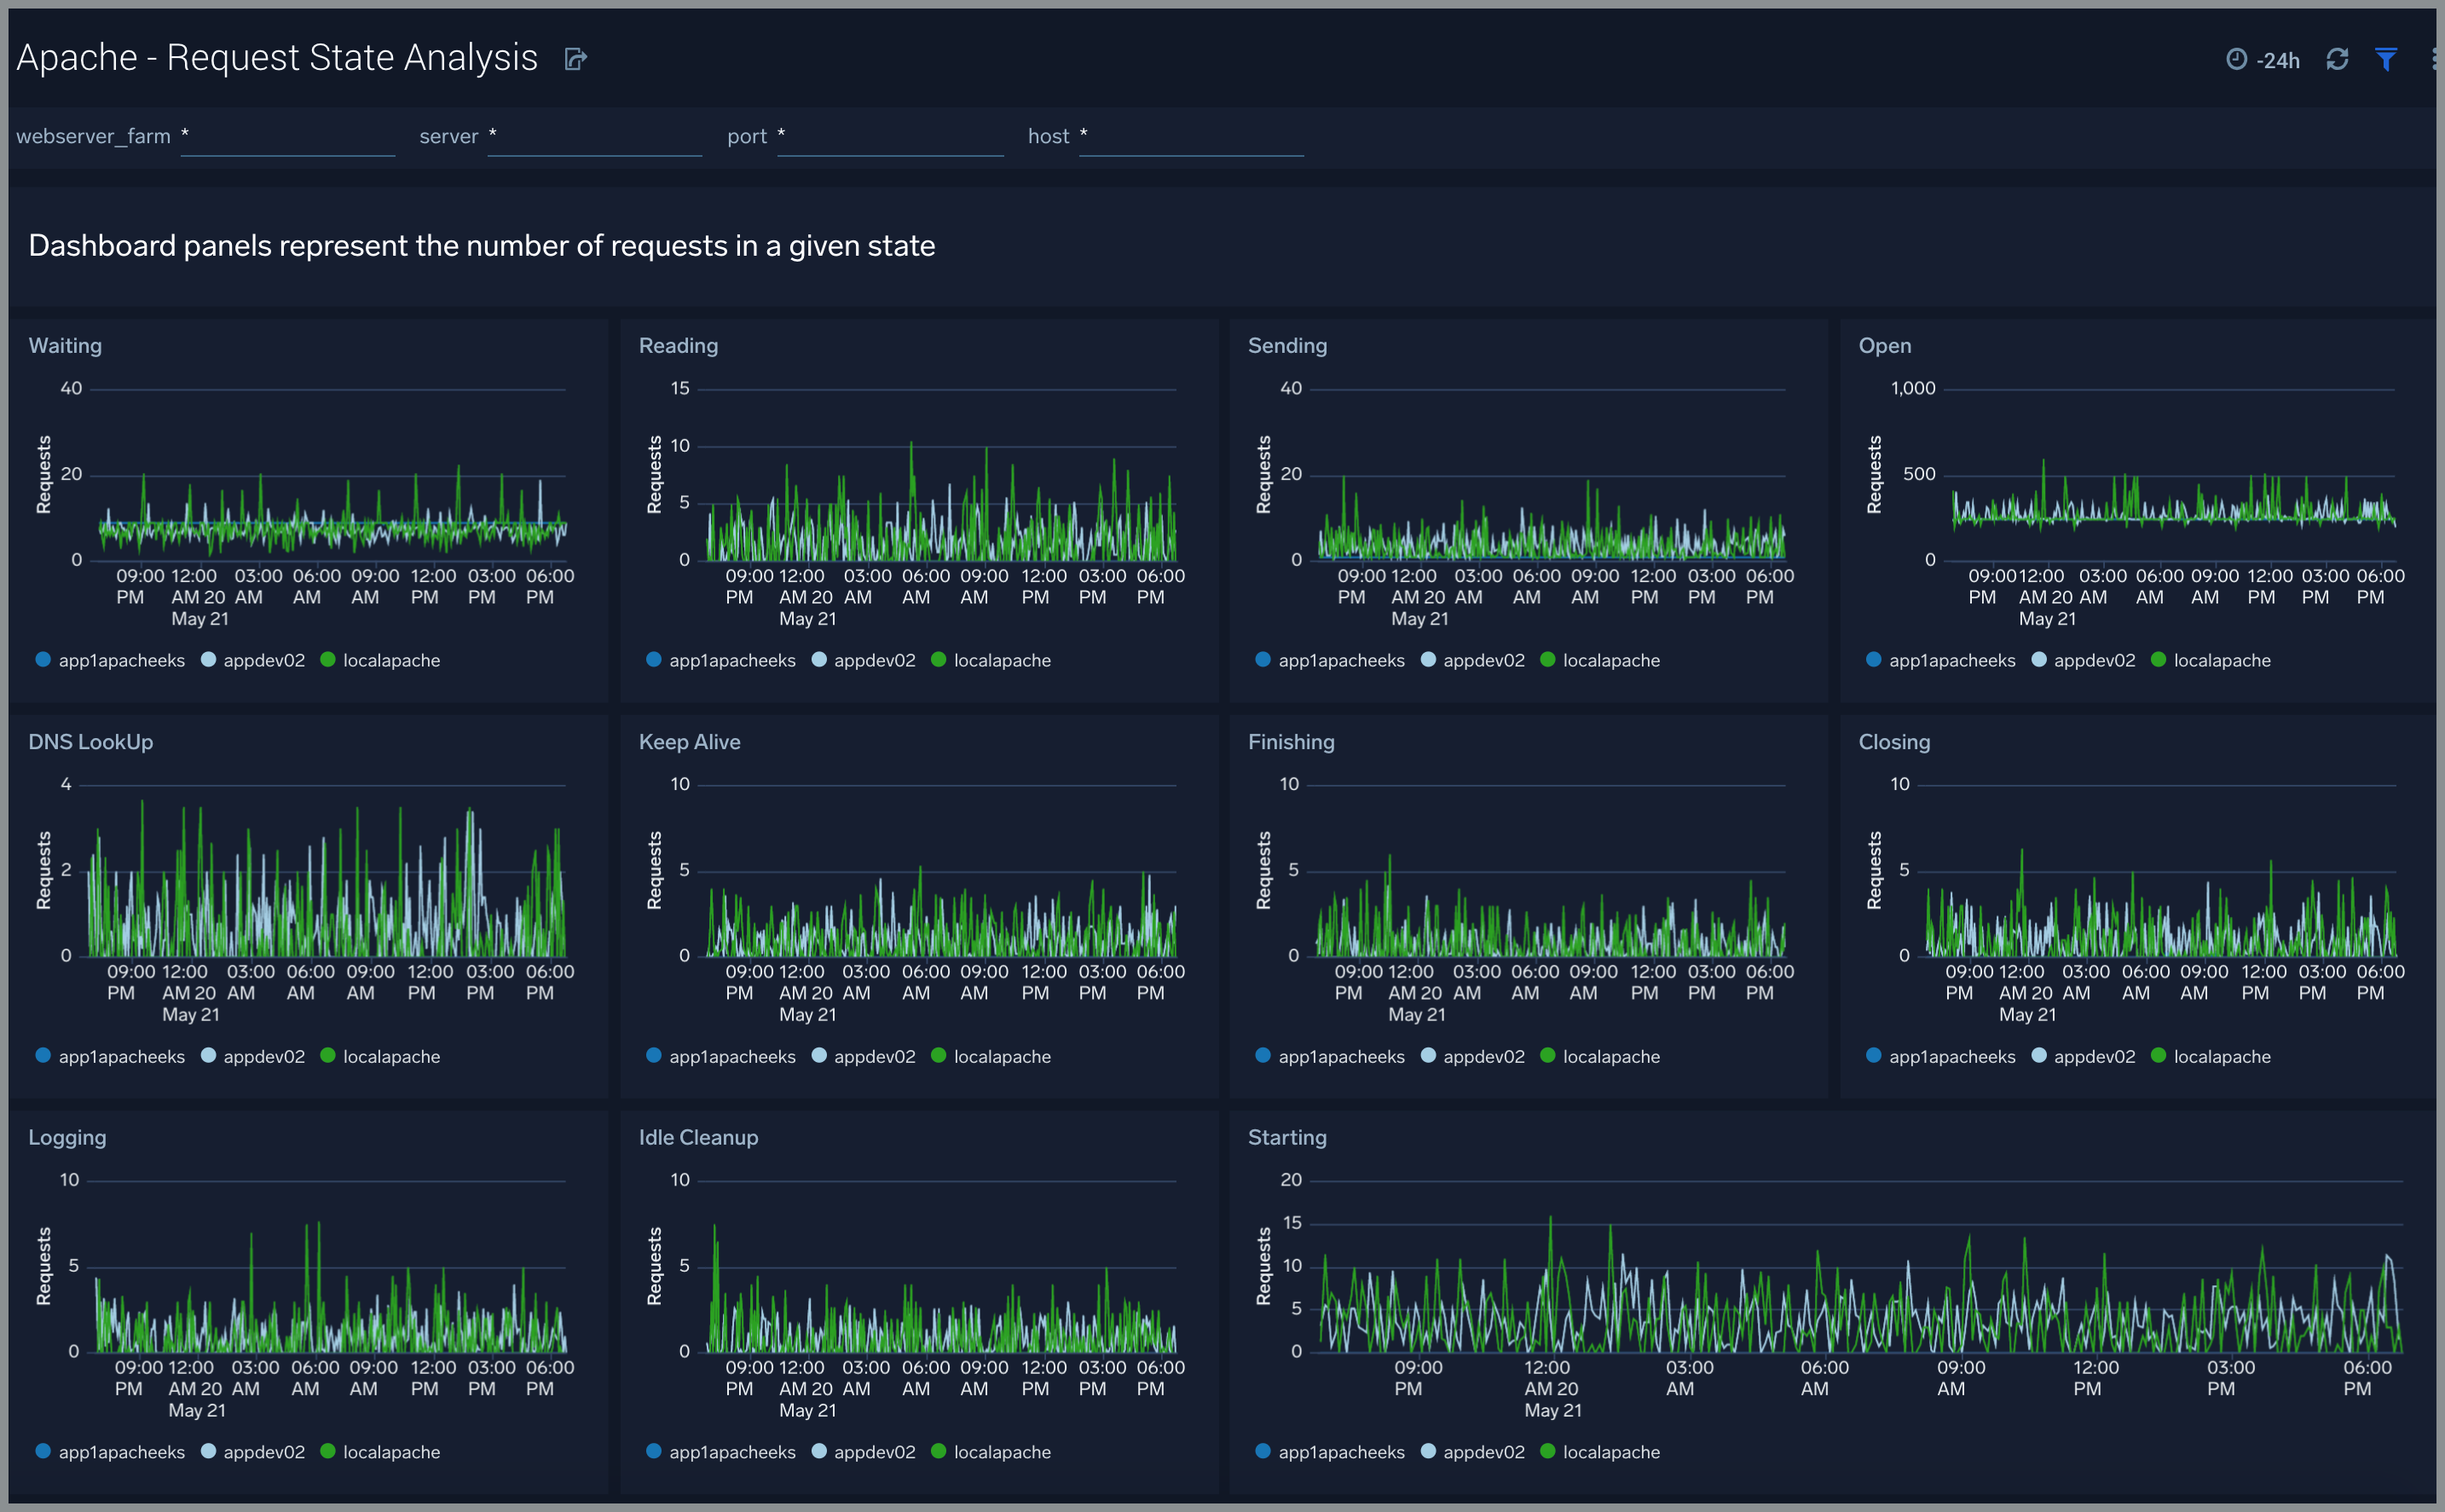
Request State Analysis
The Apache - Request State Analysis dashboard shows trends around the state of incoming requests to your Apache web servers.
Use this dashboard to:
- Monitor the state of requests being handled by worker threads over time and take remedial actions to optimize your web servers if needed.
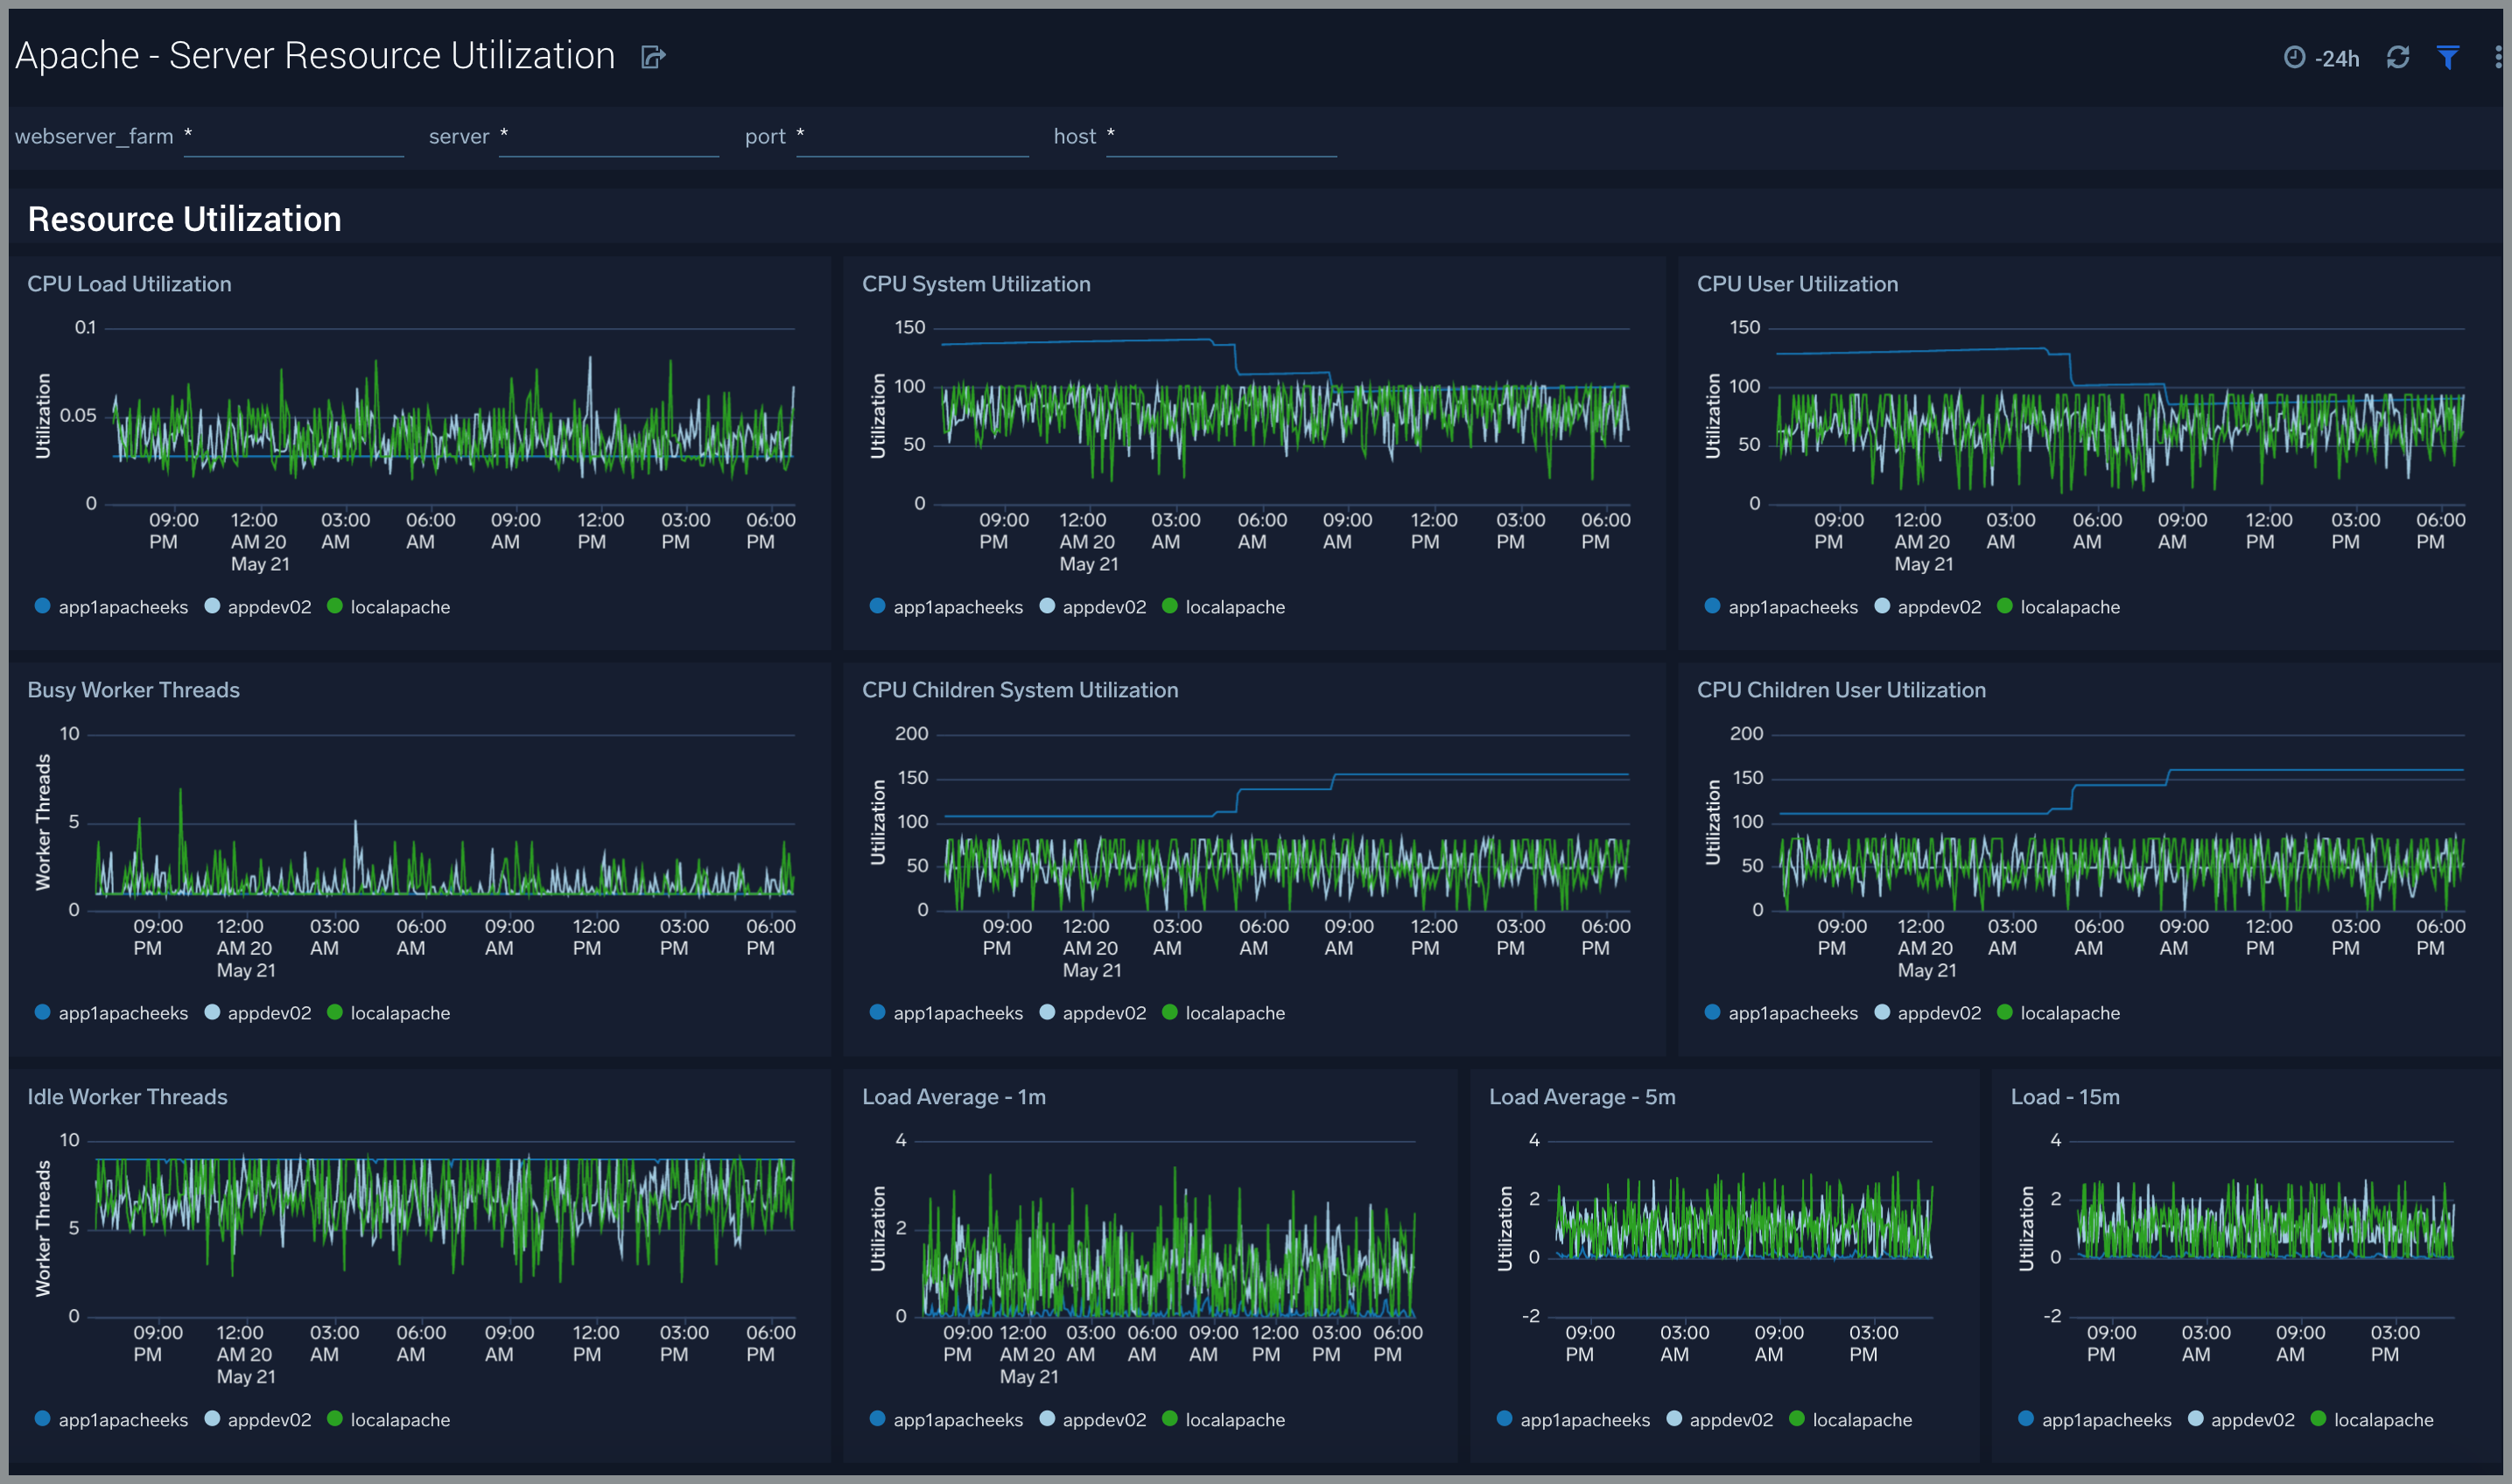
Server Resource Utilization
The Apache - Server Resource Utilization dashboard shows the CPU resource utilization and load across threads and CPU of your Apache web servers.
Use this dashboard to:
- Monitor CPU utilization and load on your Apache web servers.
- Monitor the number of workers and idle threads.
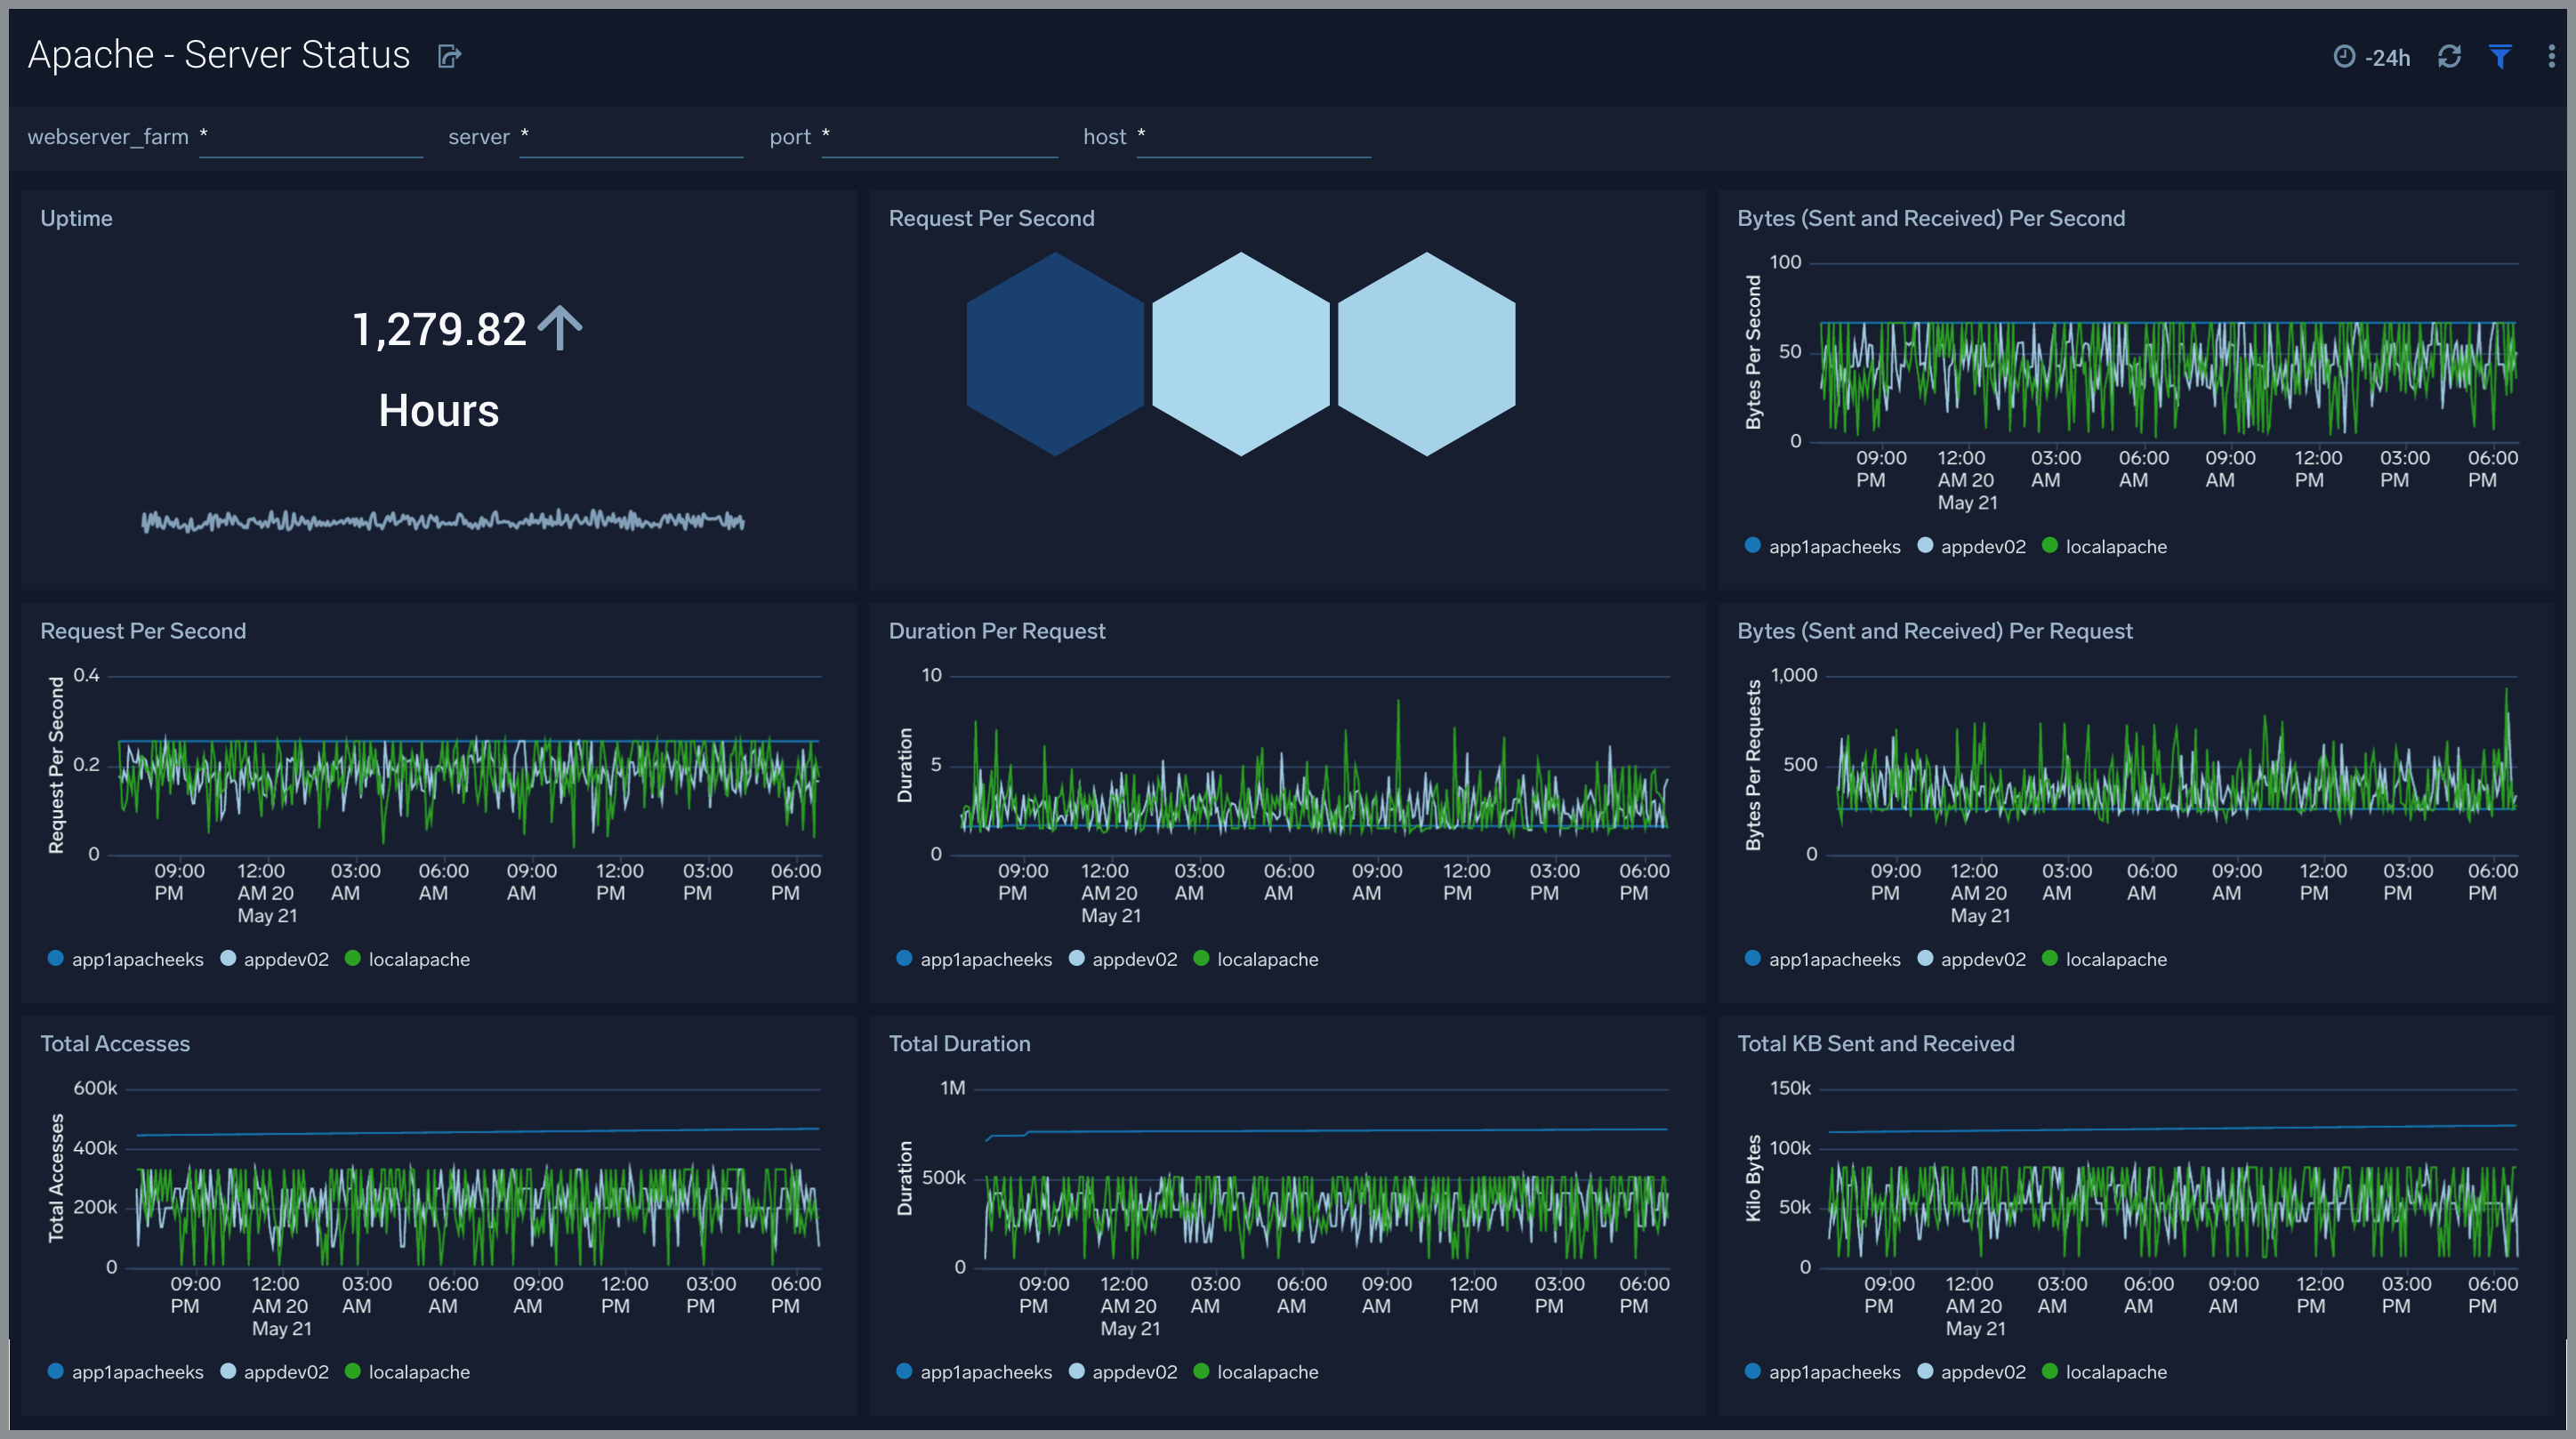
Server Status
The Apache - Server Status dashboard shows information related to the state of your Apache server and includes information such as requests and bytes served and latency information on the number of requests served, time taken to serve the request, and bytes served.
Use this dashboard to:
- Monitor server uptime.
- Monitor web server performance.
Create monitors for Apache app
From your App Catalog:
- From the Sumo Logic navigation, select App Catalog.
- In the Search Apps field, search for and then select your app.
- Make sure the app is installed.
- Navigate to What's Included tab and scroll down to the Monitors section.
- Click Create next to the pre-configured monitors. In the create monitors window, adjust the trigger conditions and notifications settings based on your requirements.
- Scroll down to Monitor Details.
- Under Location click on New Folder.
note
By default, monitor will be saved in the root folder. So to make the maintenance easier, create a new folder in the location of your choice.
- Enter Folder Name. Folder Description is optional.
tip
Using app version in the folder name will be helpful to determine the versioning for future updates.
- Click Create. Once the folder is created, click on Save.
Apache alerts
Here are the alerts available for Apache (click to expand).
| Alert Name | Alert Description | Alert Condition | Recover Condition |
|---|---|---|---|
| Apache - Critical Error Messages | This alert fires when we detect critical error messages for a given Apache server. | > 0 | 0 |
| Apache - Access from Highly Malicious Sources | This alert fires when an Apache is accessed from highly malicious IP addresses. | > 0 | 0 |
| Apache - High Client (HTTP 4xx) Error Rate | This alert fires when there are too many HTTP requests (>5%) with a response status of 4xx. | > 0 | 0 |
| Apache - High Server (HTTP 5xx) Error Rate | This alert fires when there are too many HTTP requests (>5%) with a response status of 5xx. | > 0 | 0 |
| Apache - High CPU Utilization | This alert fires when the average CPU utilization within a 5-minute interval for an Apache Webserver farm instance is high (>= 85%). | >= 85 | < 85 |
| Apache - Server Restarted | This alert fires when we detect low uptime (<= 10 minutes) for a given Apache server within a 5-minute interval. | <= 600 | > 600 |
Apache Metrics
Here are the metrics available for Apache (click to expand).
apache_BusyWorkers
apache_BytesPerReq
apache_BytesPerSec
apache_CPUChildrenSystem
apache_CPUChildrenUser
apache_CPULoad
apache_CPUSystem
apache_CPUUser
apache_DurationPerReq
apache_IdleWorkers
apache_Load1
apache_Load5
apache_Load15
apache_ParentServerConfigGeneration
apache_ParentServerMPMGeneration
apache_ReqPerSec
apache_ServerUptimeSeconds
apache_TotalAccesses
apache_TotalDuration
apache_TotalkBytes
apache_Uptime
apache_scboard_closing
apache_scboard_dnslookup
apache_scboard_finishing
apache_scboard_idle_cleanup
apache_scboard_keepalive
apache_scboard_logging
apache_scboard_open
apache_scboard_reading
apache_scboard_sending
apache_scboard_starting
apache_scboard_waiting