Apache Tomcat - Classic Collector

The Apache Tomcat app is a unified logs and metrics app that helps you monitor the availability, performance, health and resource utilization of your Apache Tomcat servers. Preconfigured dashboards provide insight into visitor locations, traffic patterns, errors, resource utilization, garbage collection, web server operations and access from known malicious sources.
Collecting logs and metrics for Apache Tomcat
Before installing the Sumo Logic app, Apache Tomcat must be set up and configured to log events.
This section provides instructions for configuring log and metric collection for the Sumo Logic app for Apache Tomcat. Configuring log and metric collection for the Apache Tomcat app includes the following tasks.
Configure Collection for Apache Tomcat
- Kubernetes environments
- Non-Kubernetes environments
In Kubernetes environments, we use the Telegraf Operator, which is packaged with our Kubernetes collection. You can learn more about it here. The diagram below illustrates how data is collected from Apache Tomcat in the Kubernetes environment. Four services in the architecture shown below make up the metric collection pipeline: Telegraf, Telegraf Operator, Prometheus, and Sumo Logic Distribution for OpenTelemetry Collector.
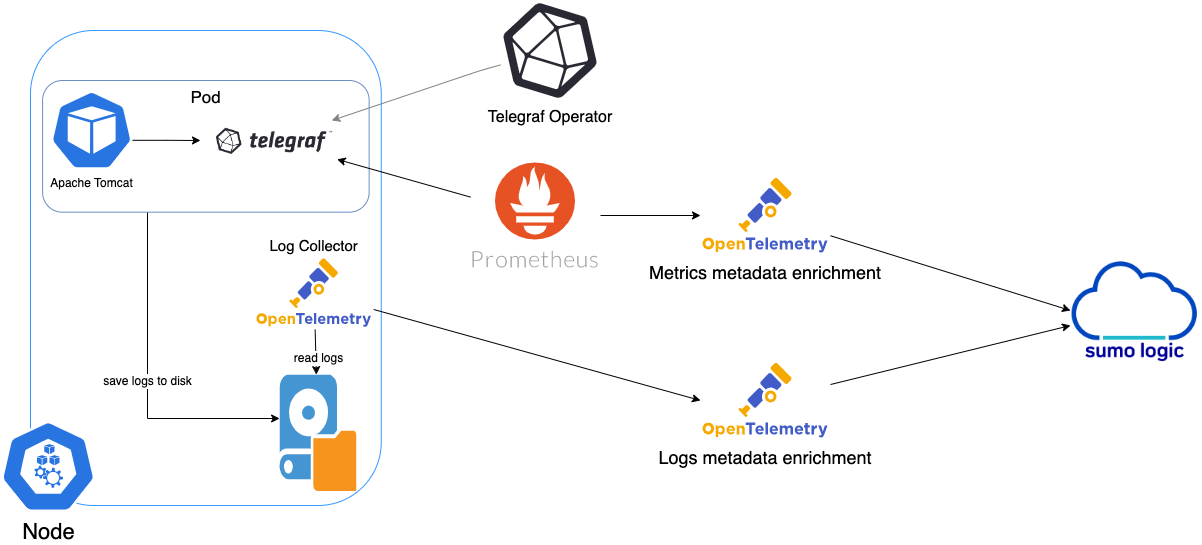
The first service in the pipeline is Telegraf. Telegraf collects metrics from Apache Tomcat. Note that we’re running Telegraf in each pod we want to collect metrics from as a sidecar deployment, for example, Telegraf runs in the same pod as the containers it monitors. Telegraf uses the Apache Tomcat and Jolokia2 input plugins to obtain metrics. For simplicity, the diagram doesn’t show the input plugins. The injection of the Telegraf sidecar container is done by the Telegraf Operator. Prometheus pulls metrics from Telegraf and sends them to Sumo Logic Distribution for OpenTelemetry Collector, which enriches metadata and sends metrics to Sumo Logic.
In the logs pipeline, Sumo Logic Distribution for OpenTelemetry Collector collects logs written to standard out and forwards them to another instance of Sumo Logic Distribution for OpenTelemetry Collector, which enriches metadata and sends logs to Sumo Logic.
Follow the below instructions to set up metrics collection:
Step 1: Configure Metrics Collection
- Set up Kubernetes Collection with the Telegraf operator.
- Add annotations on your Apache Tomcat pods.
Step 2: Configure Logs Collection
- Configure logging in Apache Tomcat.
- Add labels on your Apache Tomcat pods to capture logs from standard output.
- Collecting Apache Tomcat Logs from a Log file.
Prerequisites
It’s assumed that you are using the latest helm chart version. If not, upgrade using the instructions here.
Step 1: Configure metrics collection
This section explains the steps to collect Apache Tomcat metrics from a Kubernetes environment.
In Kubernetes environments, we use the Telegraf Operator, which is packaged with our Kubernetes collection. You can learn more on this here. Follow the steps listed below to collect metrics from a Kubernetes environment:
- Set up Kubernetes Collection with the Telegraf Operator. Ensure that you are monitoring your Kubernetes clusters with the Telegraf operator enabled. If you are not, then please follow these instructions to do so.
- Install Jolokia on your Tomcat Pod to use the Jolokia Telegraf Input Plugin:
- Download the latest version of the Jolokia war file from: https://jolokia.org/download.html.
- Rename the file from jolokia-war-X.X.X.war to jolokia.war.
- Create a configMap jolokia from the binary file
kubectl create configmap jolokia --from-file=jolokia.jar. - Create volume mount the jolokia.war file to
${TOMCAT_HOME}/webapps.
spec:
  volumes:
    - name: jolokia
      configMap:
        name: jolokia
  containers:
    - name: XYZ
      image: XYZ
      env:
      - name: TOMCAT_OPTS
        value: "-javaagent:/opt/jolokia/jolokia.jar=port=8778,host=0.0.0.0"
      volumeMounts:
        - mountPath: "/opt/jolokia"
name: jolokia- Add jolokia as role in tomcat-users.xml
Verification Step: You can ssh to the Tomcat pod and run the following commands to make sure Telegraf (and Jolokia) is scraping metrics from your Tomcat Pod:<tomcat-users>
<role rolename="manager-jmx"/>
<user name="admin" password="admin" roles="admin-gui,admin-script,manager-gui,manager-status,manager-script,manager-jmx"/>
</tomcat-users>curl localhost:9273/metrics- Add annotations on your Apache Tomcat pods. On your Apache Tomcat Pods, add the following annotations:
annotations:
  telegraf.influxdata.com/class: sumologic-prometheus
  prometheus.io/scrape: "true"
  prometheus.io/port: "9273"
  telegraf.influxdata.com/inputs: |+
       [[inputs.tomcat]]
          url = "http://127.0.0.1:8080/manager/status/all?XML=true"
          username = "<username-CHANGEME>"
          password = "<password-CHANEGME>"
          [inputs.tomcat.tags]
            environment="dev_CHANGEME"
            component="webserver"
            webserver_system="tomcat"
            webserver_farm="tomcat_on_k8s_CHANGEME"
[[inputs.jolokia2_agent]]
  name_prefix = "tomcat_jmx_"
  urls = ["http://localhost:8088/jolokia"]
  username = "username-CHANGME"
  password = "password-CHANGME"
[inputs.jolokia2_agent.tags]
    environment="dev_CHANGEME"
    component="webserver"
    webserver_system="tomcat"
    webserver_farm="tomcat_on_k8s_CHANGEME"
  JVM Generic
  [[inputs.jolokia2_agent.metric]]
    name  = "OperatingSystem"
    mbean = "java.lang:type=OperatingSystem"
    paths = ["ProcessCpuLoad","SystemLoadAverage","SystemCpuLoad","TotalPhysicalMemorySize","FreeSwapSpaceSize","TotalSwapSpaceSize","FreePhysicalMemorySize","AvailableProcessors"]
  [[inputs.jolokia2_agent.metric]]
    name  = "jvm_runtime"
    mbean = "java.lang:type=Runtime"
    paths = ["Uptime"]
  [[inputs.jolokia2_agent.metric]]
    name  = "jvm_memory"
    mbean = "java.lang:type=Memory"
    paths = ["HeapMemoryUsage", "NonHeapMemoryUsage", "ObjectPendingFinalizationCount"]
  [[inputs.jolokia2_agent.metric]]
    name     = "jvm_garbage_collector"
    mbean    = "java.lang:name=*,type=GarbageCollector"
    paths    = ["CollectionTime", "CollectionCount"]
    tag_keys = ["name"]
  [[inputs.jolokia2_agent.metric]]
    name       = "jvm_memory_pool"
    mbean      = "java.lang:name=*,type=MemoryPool"
    paths      = ["Usage", "PeakUsage", "CollectionUsage"]
    tag_keys   = ["name"]
    tag_prefix = "pool_"
  [[inputs.jolokia2_agent.metric]]
    name     = "GlobalRequestProcessor"
    mbean    = "Catalina:name=*,type=GlobalRequestProcessor"
    paths    = ["requestCount","bytesReceived","bytesSent","processingTime","errorCount"]
    tag_keys = ["name"]
  [[inputs.jolokia2_agent.metric]]
    name     = "JspMonitor"
    mbean    = "Catalina:J2EEApplication=*,J2EEServer=*,WebModule=*,name=jsp,type=JspMonitor"
    paths    = ["jspReloadCount","jspCount","jspUnloadCount"]
    tag_keys = ["J2EEApplication","J2EEServer","WebModule"]
  [[inputs.jolokia2_agent.metric]]
    name     = "ThreadPool"
    mbean    = "Catalina:name=*,type=ThreadPool"
    paths    = ["maxThreads","currentThreadCount","currentThreadsBusy"]
    tag_keys = ["name"]
  [[inputs.jolokia2_agent.metric]]
    name     = "Servlet"
    mbean    = "Catalina:J2EEApplication=*,J2EEServer=*,WebModule=*,j2eeType=Servlet,name=*"
    paths    = ["processingTime","errorCount","requestCount"]
    tag_keys = ["name","J2EEApplication","J2EEServer","WebModule"]
  [[inputs.jolokia2_agent.metric]]
    name     = "Cache"
    mbean    = "Catalina:context=*,host=*,name=Cache,type=WebResourceRoot"
    paths    = ["hitCount","lookupCount"]
tag_keys = ["context","host"]telegraf.influxdata.com/inputs. This contains the required configuration for the Telegraf Tomcat Input plugin. Refer to this doc for more information on configuring the Tomcat input plugin for Telegraf. Note: As Telegraf will be run as a sidecar, the host should always be localhost.- In the input plugins section, which is
[[inputs.Tomcat]]:servers- The URL to the Tomcat server. This can be a comma-separated list to connect to multiple Tomcat servers. Please see this doc for more information on additional parameters for configuring the Tomcat input plugin for Telegraf.
- In the tags section, which is
[inputs.Tomcat.tags]:environment. This is the deployment environment where the Tomcat farm identified by the value ofserversresides. For example: dev, prod, or qa. While this value is optional we highly recommend setting it.webserver_farm- Enter a name to identify this Tomcat farm. This farm name will be shown in the Sumo Logic dashboards.
- In the input plugins section, which is
[[inputs.jolokia2_agent]]:urls- The URL to the Tomcat server. This can be a comma-separated list to connect to multiple Tomcat servers. See this doc for more information on additional parameters for configuring the Tomcat input plugin for Telegraf.
- In the tags section, which is
[inputs.jolokia2_agent.tags]environment. This is the deployment environment where the Tomcat farm identified by the value of servers resides. For example: dev, prod, or qa. While this value is optional we highly recommend setting it.webserver_farm. Enter a name to identify this Tomcat farm. This farm name will be shown in the Sumo Logic dashboards.
- Do not modify additional values set by this configuration as they will cause the Sumo Logic apps to not function correctly.
telegraf.influxdata.com/class: sumologic-prometheus. This instructs the Telegraf operator what output to use. This should not be changed.prometheus.io/scrape: "true". This ensures our Prometheus will scrape the metrics.prometheus.io/port: "9273". This tells Prometheus what ports to scrape on. This should not be changed.telegraf.influxdata.com/inputs- In the tags section, which is [inputs.Tomcat.tags]
component: “webserver”- This value is used by Sumo Logic apps to identify application components.webserver_system: “tomcat”- This value identifies the web server system.
- In the tags section, which is
[inputs.jolokia2_agent.tags]component: “webserver”- This value is used by Sumo Logic apps to identify application components.webserver_system: “tomcat”- This value identifies the web server system.
- In the tags section, which is [inputs.Tomcat.tags]
- For all other parameters, see this doc for more parameters that can be configured in the Telegraf agent globally.
- Sumo Logic Kubernetes collection will automatically start collecting metrics from the pods having the labels and annotations defined in the previous step.
- Verify metrics in Sumo Logic.
Step 2: Configure logs collection
This section explains the steps to collect Apache Tomcat logs from a Kubernetes environment.
(Recommended Method) Add labels on your Apache Tomcat pods to capture logs from standard output. Follow the instructions below to capture Apache Tomcat logs from stdout on Kubernetes.
- Apply the following labels to the Apache Tomcat pods:
   environment: "prod_CHANGEME"
    component: "webserver"
    webserver_system: "tomcat"
webserver_farm: "tomcat_prod__CHANGEME"- Enter in values for the following parameters (marked
CHANGEMEin the snippet above):environment. This is the deployment environment where the Tomcat farm identified by the value of servers resides. For example: dev, prod, or qa. While this value is optional we highly recommend setting it.Webserver_farm- Enter a name to identify this Tomcat farm. This farm name will be shown in the Sumo Logic dashboards.
- Do not modify additional values set by this configuration as they will cause the Sumo Logic apps to not function correctly.
component: “webserver”- This value is used by Sumo Logic apps to identify application components.webserver_system: “tomcat”- This value identifies the webserver system.
- For all other parameters, see this doc for more parameters that can be configured in the Telegraf agent globally.
- Enter in values for the following parameters (marked
- The Sumologic-Kubernetes-Collection will automatically capture the logs from stdout and will send the logs to Sumologic. For more information on deploying Sumologic-Kubernetes-Collection, visit here .
- Verify logs in Sumo Logic.
(Optional) Collecting Apache Tomcat Logs from a Log File. Follow the steps below to capture Apache Tomcat logs from a log file on Kubernetes.
- Determine the location of the Apache Tomcat log file on Kubernetes. This can be determined from the Tomcat.conf for your Tomcat farm along with the mounts on the Tomcat pods.
- Install the Sumo Logic tailing sidecar operator.
- Add the following annotation in addition to the existing annotations.
annotations:
tailing-sidecar: sidecarconfig;<mount>:<path_of_Tomcat_log_file>/<Tomcat_log_file_name>Exampleannotations:
tailing-sidecar: sidecarconfig;data:/opt/tomcat/logs/tomcat.log - Make sure that the Tomcat pods are running and annotations are applied by using the command:
kubectl describe pod <Tomcat_pod_name> - Sumo Logic Kubernetes collection will automatically start collecting logs from the pods having the annotations defined above.
- Verify logs in Sumo Logic.
FER to normalize the fields in Kubernetes environments. Labels created in Kubernetes environments automatically are prefixed with pod_labels. To normalize these for our app to work, we will have a Field Extraction Rule automatically created for Apache Tomcat Web Server Application Components named AppObservabilityApacheTomcatWebserverFER.
We use the Telegraf operator for Apache Tomcat metric collection and Sumo Logic Installed Collector for collecting Apache Tomcat logs. The diagram below illustrates the components of the Apache Tomcat collection in a non-Kubernetes environment.
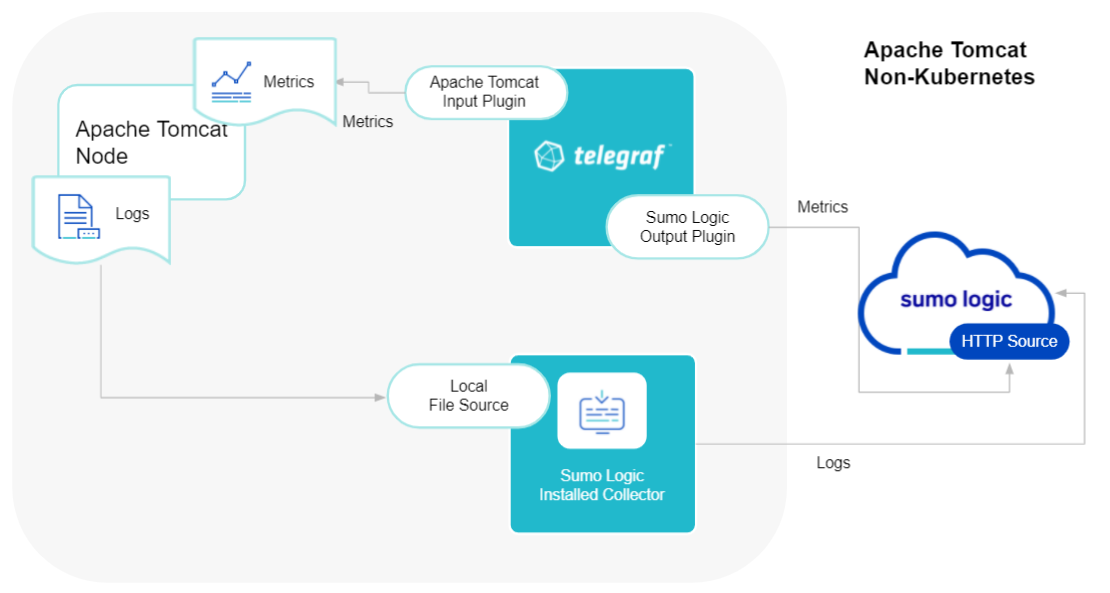
Telegraf runs on the same system as Apache Tomcat and uses the Apache Tomcat and Jolokia2 input plugin to obtain Apache Tomcat metrics, and the Sumo Logic output plugin to send the metrics to Sumo Logic. Logs from Apache Tomcat on the other hand are sent to a Sumo Logic Local File source.
This section provides instructions for configuring metrics collection for the Sumo Logic app for Apache Tomcat. Follow the below instructions to set up the metric collection:
- Configure Metrics Collection
- Configure a Hosted Collector
- Configure HTTP Logs and Metrics Source
- Install Telegraf
- Download and setup Jolokia on each Apache Tomcat node
- Configure and start Telegraf
- Configure Logs Collection
- Configure logging in Apache Tomcat
- Configure Sumo Logic Installed Collector
Step 1: Configure metrics collection
- Configure a Hosted Collector. To create a new Sumo Logic hosted collector, perform the steps in the Create a Hosted Collector section of the Sumo Logic documentation.
- Configure an HTTP Logs and Metrics Source. Create a new HTTP Logs and Metrics Source in the hosted collector created above by following these instructions. Make a note of the HTTP Source URL.
- Install Telegraf. Follow these steps to install Telegraf.
- Download and setup Jolokia on each Apache Tomcat node. As part of collecting metrics data from Telegraf, we will use the Jolokia input plugin to get data from Telegraf and the Sumo Logic output plugin to send data to Sumo Logic.
- Download the latest version of the Jolokia JVM-Agent from Jolokia.
- Rename the downloaded Jar file to jolokia.jar.
- Save the file jolokia.jar on your Apache Tomcat server in
${TOMCAT_HOME}/webapps. - Configure Apache Tomcat to use Jolokia.
- Add the following to tomcat-users.xml:
- Start or Restart the Apache Tomcat Service.
- Verify the Jolokia agent installation by curl-ing this URL:
http://<tomcat_address>:<tomcat_port>/jolokia/version.
The result looks similar to this:curl -v -u **username-CHANGEME**:**password-CHANGEME** "`http://APACHE_TOMCAT_SERVER_IP_ADDRESS:<TOMCAT_PORT>/jolokia/version`"{
"request":
{
"type":"version"
},
"value":
{
"agent":"1.6.2",
"protocol":"7.2",
"config":
{
"listenForHttpService":"true",
"maxCollectionSize":"0",
"authIgnoreCerts":"false",
"agentId":"10.0.50.64-6867-1ed563ab-servlet",
"agentType":"servlet",
"policyLocation":"classpath:\/jolokia-access.xml",
"agentContext":"\/jolokia",
"mimeType":"text\/plain",
"discoveryEnabled":"false",
"streaming":"true",
"historyMaxEntries":"10",
"allowDnsReverseLookup":"true",
"maxObjects":"0",
"debug":"false",
"serializeException":"false",
"detectorOptions":"{}",
"dispatcherClasses":"org.jolokia.http.Jsr160ProxyNotEnabledByDefaultAnymoreDispatcher",
"maxDepth":"15",
"authMode":"basic",
"authMatch":"any",
"canonicalNaming":"true",
"allowErrorDetails":"true",
"realm":"jolokia",
"includeStackTrace":"true",
"useRestrictorService":"false",
"debugMaxEntries":"100"
},
"info":
{
"product":"tomcat",
"vendor":"Apache",
"version":"7.0.76"
}
},
"timestamp":1625232354,
"status":200
}
- Configure and start Telegraf. As part of collecting metrics data from Telegraf, we will use the Apache Tomcat input plugin and jolokia2 input plugin to get data from Telegraf and the Sumo Logic output plugin to send data to Sumo Logic.
Create or modify telegraf.conf and copy and paste the text below:
[[inputs.tomcat]]
  url = "http://127.0.0.1:80/manager/status/all?XML=true"
  username = "<username>"
  password = "<password>"
  [inputs.tomcat.tags]
    environment="dev_CHANGEME"
    component="webserver"
    webserver_system="tomcat"
    webserver_farm="tomcat_on_premise"
[[inputs.jolokia2_agent]]
  name_prefix = "tomcat_jmx_"
  urls = ["http://localhost:80/jolokia"]
  username = "<username>"
  password = "<password>"
  [inputs.jolokia2_agent.tags]
    environment="dev_CHANGEME"
    component="webserver"
         webserver_system="tomcat"
         webserver_farm="tomcat_on_premise"
  ### JVM Generic
  [[inputs.jolokia2_agent.metric]]
    name  = "OperatingSystem"
    mbean = "java.lang:type=OperatingSystem"
    paths = ["ProcessCpuLoad","SystemLoadAverage","SystemCpuLoad","TotalPhysicalMemorySize","FreeSwapSpaceSize","TotalSwapSpaceSize","FreePhysicalMemorySize","AvailableProcessors"]
  [[inputs.jolokia2_agent.metric]]
    name  = "jvm_runtime"
    mbean = "java.lang:type=Runtime"
    paths = ["Uptime"]
  [[inputs.jolokia2_agent.metric]]
    name  = "jvm_memory"
    mbean = "java.lang:type=Memory"
    paths = ["HeapMemoryUsage", "NonHeapMemoryUsage", "ObjectPendingFinalizationCount"]

  [[inputs.jolokia2_agent.metric]]
    name     = "jvm_garbage_collector"
    mbean    = "java.lang:name=*,type=GarbageCollector"
    paths    = ["CollectionTime", "CollectionCount"]
    tag_keys = ["name"]
  [[inputs.jolokia2_agent.metric]]
    name       = "jvm_memory_pool"
    mbean      = "java.lang:name=*,type=MemoryPool"
    paths      = ["Usage", "PeakUsage", "CollectionUsage"]
    tag_keys   = ["name"]
    tag_prefix = "pool_"
  [[inputs.jolokia2_agent.metric]]
    name     = "GlobalRequestProcessor"
    mbean    = "Catalina:name=*,type=GlobalRequestProcessor"
    paths    = ["requestCount","bytesReceived","bytesSent","processingTime","errorCount"]
    tag_keys = ["name"]
  [[inputs.jolokia2_agent.metric]]
    name     = "JspMonitor"
    mbean    = "Catalina:J2EEApplication=*,J2EEServer=*,WebModule=*,name=jsp,type=JspMonitor"
    paths    = ["jspReloadCount","jspCount","jspUnloadCount"]
    tag_keys = ["J2EEApplication","J2EEServer","WebModule"]
  [[inputs.jolokia2_agent.metric]]
    name     = "ThreadPool"
    mbean    = "Catalina:name=*,type=ThreadPool"
    paths    = ["maxThreads","currentThreadCount","currentThreadsBusy"]
    tag_keys = ["name"]
  [[inputs.jolokia2_agent.metric]]
    name     = "Servlet"
    mbean    = "Catalina:J2EEApplication=*,J2EEServer=*,WebModule=*,j2eeType=Servlet,name=*"
    paths    = ["processingTime","errorCount","requestCount"]
    tag_keys = ["name","J2EEApplication","J2EEServer","WebModule"]
  [[inputs.jolokia2_agent.metric]]
    name     = "Cache"
    mbean    = "Catalina:context=*,host=*,name=Cache,type=WebResourceRoot"
    paths    = ["hitCount","lookupCount"]
    tag_keys = ["context","host"]
[[outputs.sumologic]]
  url = "<URL Created in Step 3>"
  data_format = "prometheus"
For multiple instances of Tomcat on a single server, including multiple input sections of
[inputs.tomcat]]
  url = "http://127.0.0.1:80/manager/status/all?XML=true"
  username = "<username>"
  password = "<password>"
  [inputs.tomcat.tags]
    environment="dev_CHANGEME"
    component="webserver"
    webserver_system="tomcat"
    webserver_farm="tomcat_on_premise"
[[inputs.jolokia2_agent]]
  name_prefix = "tomcat_jmx_"
  urls = ["http://localhost:80/jolokia"]
  username = "<username-CHANGEME>"
  password = "<password-CHANGEME>"
  [inputs.jolokia2_agent.tags]
    environment="dev_CHANGEME"
    component="webserver"
         webserver_system="tomcat"
         webserver_farm="tomcat_on_premise"
[[inputs.tomcat]]
  url = "http://127.0.0.1:8080/manager/status/all?XML=true"
  username = "<username>"
  password = "<password>"
  [inputs.tomcat.tags]
    environment="dev_CHANGEME"
    component="webserver"
    webserver_system="tomcat"
    webserver_farm="tomcat_on_premise"
[[inputs.jolokia2_agent]]
  name_prefix = "tomcat_jmx_"
  urls = ["http://localhost:8080/jolokia"]
  username = "username-CHANGEME"
  password = "password-CHANGEME"
  [inputs.jolokia2_agent.tags]
    environment="dev_CHANGEME"
    component="webserver"
         webserver_system="tomcat"
         webserver_farm="tomcat_on_premise"
[[outputs.sumologic]]
  url = "<URL Created in Step 3>"
  data_format = "prometheus"
Enter values for the following parameters (marked CHANGEME above):
- In the input plugins section, which is
[[inputs.tomcat]]:servers- The URL to the Tomcat server. This can be a comma-separated list to connect to multiple Tomcat servers. See this doc for more information on additional parameters for configuring the Tomcat input plugin for Telegraf.- In the tags section, which is
[inputs.tomcat.tags]environment. This is the deployment environment where the Tomcat farm identified by the value of servers resides. For example: dev, prod, or qa. While this value is optional we highly recommend setting it.Webserver_farm- Enter a name to identify this Tomcat farm. This farm name will be shown in the Sumo Logic dashboards.
- In the input plugins section, which is
[[inputs.jolokia2_agent]]:servers- The URL to the Tomcat server. This can be a comma-separated list to connect to multiple Tomcat servers. See this doc for more information on additional parameters for configuring the Tomcat input plugin for Telegraf.- In the tags section, which is
[inputs.jolokia2_agent.tags]:environment. This is the deployment environment where the Tomcat farm identified by the value ofserversresides. For example: dev, prod, or qa. While this value is optional we highly recommend setting it.webserver_farm- Enter a name to identify this Tomcat farm. This farm name will be shown in the Sumo Logic dashboards.
- In the output plugins section, which is
[[outputs.sumologic]]:url- This is the HTTP source URL created in step 3. See this doc for more information on additional parameters for configuring the Sumo Logic Telegraf output plugin.
Here’s an explanation for additional values set by this Telegraf configuration.
Do not modify the configuration, as it will cause the SumoLogic apps to not function correctly.
data_format - “prometheus”In the output plugins section, which is[[outputs.sumologic]]. Metrics are sent in the Prometheus format to Sumo Logic.Component: “webserver”- In the input plugins section, which are[[inputs.tomcat]]and[[inputs.jolokia2_agent]]- This value is used by Sumo Logic apps to identify application components.webserver_system: “tomcat”- In the input plugins sections. In other words, this value identifies the web server system.- For all other parameters, see this doc for more parameters that can be configured in the Telegraf agent globally.
Once you have finalized your telegraf.conf file, you can start or reload the telegraf service using instructions from the doc.
At this point, Tomcat metrics should start flowing into Sumo Logic.
Step 2 Configure logs collection
This section provides instructions for configuring log collection for Apache Tomcat running on a non-kubernetes environment for the Sumo Logic App for Apache Tomcat.
By default, Apache Tomcat logs are stored in a log file. Sumo Logic supports collecting logs via a local log file. Local log files can be collected via Installed collectors. An Installed collector will require you to allow outbound traffic to Sumo Logic endpoints for collection to work. For detailed requirements for Installed collectors, see this page.
Based on your infrastructure and networking setup choose one of these methods to collect Tomcat logs and follow the instructions below to set up log collection:
-
Configure logging in Apache Tomcat
Varnish supports logging via the following methods: local text log files
The Sumo Logic app for Apache Tomcat uses three types of logs
-
Tomcat Access logs
Log format description: https://tomcat.apache.org/tomcat-8.0-doc/config/valve.html
Recommended pattern used is pattern="common" -
Tomcat Catalina.out logs
Log format description: https://docs.oracle.com/javase/8/docs/api/java/util/logging/SimpleFormatter.html -
Tomcat Garbage Collection (GC) logs
Log format description: https://stackoverflow.com/questions/4468546/explanation-of-tomcat-gc-log-statements -
Configure Tomcat to log to a Local file. By default, Tomcat logs are stored in /usr/share/tomcat/logs/ The default directory for log files is listed in the /usr/share/tomcat/conf/logging.properties file. Logs from the Tomcat log file can be collected via a Sumo Logic Installed collector and a Local File Source as explained in the next section.
-
Configuring a Collector. To collect logs directly from the Tomcat machine, configure an Installed Collector.
-
Configuring a Source. To add a Local File Source source for Apache Tomcat, do the following. To collect logs directly from your Tomcat machine, use an Installed Collector and a Local File Source.
-
Add a Local File Source.
-
Configure the Local File Source fields as follows:
- Name. (Required)
- Description. (Optional)
- File Path (Required). Enter the path to your error.log or access.log. The files are typically located in /usr/share/tomcat/logs/*. If you're using a customized path, check the Tomcat.conf file for this information.
- Source Host. Sumo Logic uses the hostname assigned by the OS unless you enter a different hostname.
- Source Category. Enter any string to tag the output collected from this Source, such as Tomcat/Logs. (The Source Category metadata field is a fundamental building block to organize and label Sources. For details, see Best Practices.
- Fields. Set the following fields:
* component = websystem
* webserver_system = tomcat
* webserver_farm = <Your_Tomcat_Farm_Name>
* environment = <Environment_Name> #such as Dev, QA, or Prod. -
Configure the Advanced section:
- Enable Timestamp Parsing. Select Extract timestamp information from log file entries.
- Time Zone. Choose the option, Ignore time zone from log file and instead use, and then select your Tomcat Server’s time zone.
- Timestamp Format. The timestamp format is automatically detected. Encoding. Select UTF-8 (Default).
- Enable Multiline Processing. Detect messages spanning multiple lines.
- Infer Boundaries - Detect message boundaries automatically.
-
Click Save.
At this point, Tomcat logs should start flowing into Sumo Logic.
Installing the Apache Tomcat app
To install the app, do the following:
Next-Gen App: To install or update the app, you must be an account administrator or a user with Manage Apps, Manage Monitors, Manage Fields, Manage Metric Rules, and Manage Collectors capabilities depending upon the different content types part of the app.
- Select App Catalog.
- In the 🔎 Search Apps field, run a search for your desired app, then select it.
- Click Install App.
note
Sometimes this button says Add Integration.
- Click Next in the Setup Data section.
- In the Configure section of your respective app, complete the following fields.
- Field Name. If you already have collectors and sources set up, select the configured metadata field name (eg _sourcecategory) or specify other custom metadata (eg: _collector) along with its metadata Field Value.
- Is K8S deployment involved. Specify if resources being monitored are partially or fully deployed on Kubernetes (K8s)
- Click Next. You will be redirected to the Preview & Done section.
Post-installation
Once your app is installed, it will appear in your Installed Apps folder, and dashboard panels will start to fill automatically.
Each panel slowly fills with data matching the time range query received since the panel was created. Results will not immediately be available but will be updated with full graphs and charts over time.
As part of the app installation process, the following fields will be created by default:
componentenvironmentwebserver_systemwebserver_farmpod
Additionally, if you are using Apache Tomcat in the Kubernetes environment, the following additional fields will be created by default during the app installation process:
pod_labels_componentpod_labels_environmentpod_labels_webserver_systempod_labels_webserver_farm
For information on setting up fields, see Fields.
Viewing Apache Tomcat dashboards
All dashboards have a set of filters that you can apply to the entire dashboard. Use these filters to drill down and examine the data to a granular level.
- You can change the time range for a dashboard or panel by selecting a predefined interval from a drop-down list, choosing a recently used time range, or specifying custom dates and times. Learn more.
- You can use template variables to drill down and examine the data on a granular level. For more information, see Filtering Dashboards with Template Variables.
- Most Next-Gen apps allow you to provide the scope at the installation time and are comprised of a key (
_sourceCategoryby default) and a default value for this key. Based on your input, the app dashboards will be parameterized with a dashboard variable, allowing you to change the dataset queried by all panels. This eliminates the need to create multiple copies of the same dashboard with different queries.
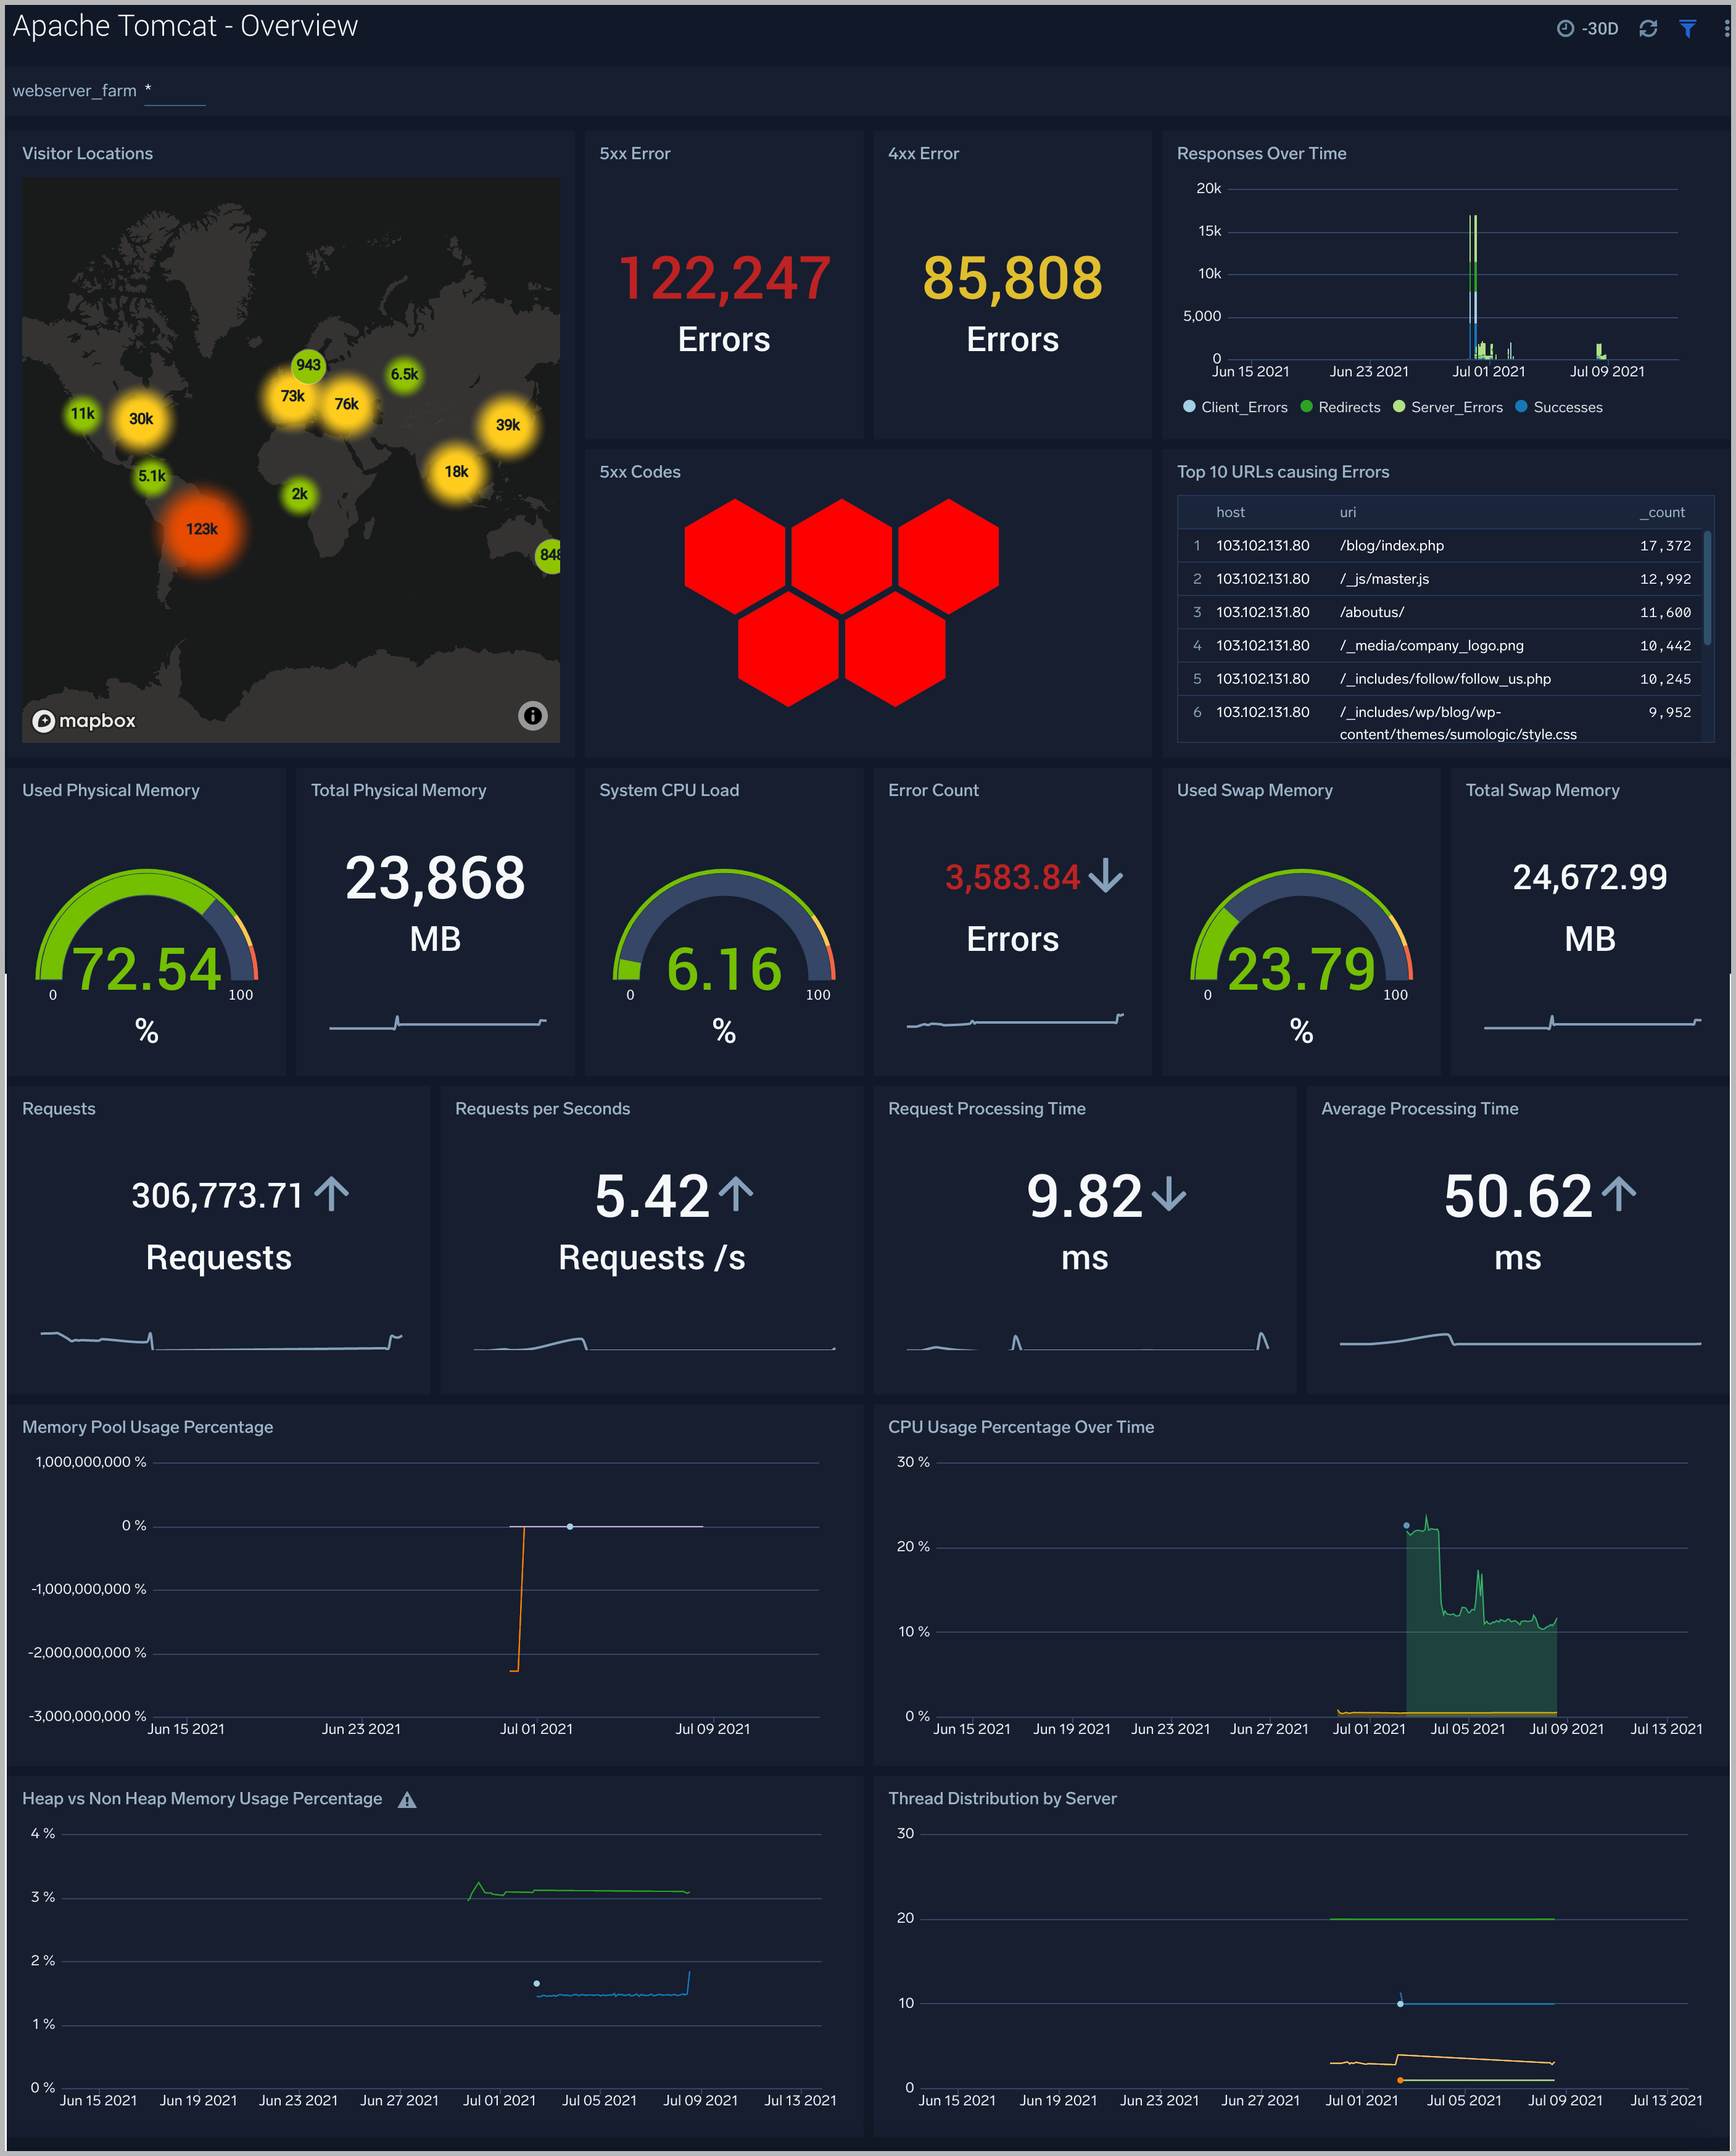
Overview
The Apache Tomcat - Overview dashboard provides a high-level view of the activity and health of Tomcat servers on your network. Dashboard panels display visual graphs and detailed information on visitor geographic locations, traffic volume and distribution, responses over time, as well as time comparisons for visitor locations and CPU and memory.
Use this dashboard to:
- Analyze CPU, Memory, and disk utilization.
- Analyze the HTTP request about the status code.
- Gain insights into Network traffic for your Tomcat server.
- Gain insights into originated traffic location by region. This can help you allocate computer resources to different regions according to their needs.
- Gain insights into Client and Server Responses on the Tomcat Server. This helps you identify errors in the Tomcat Server.
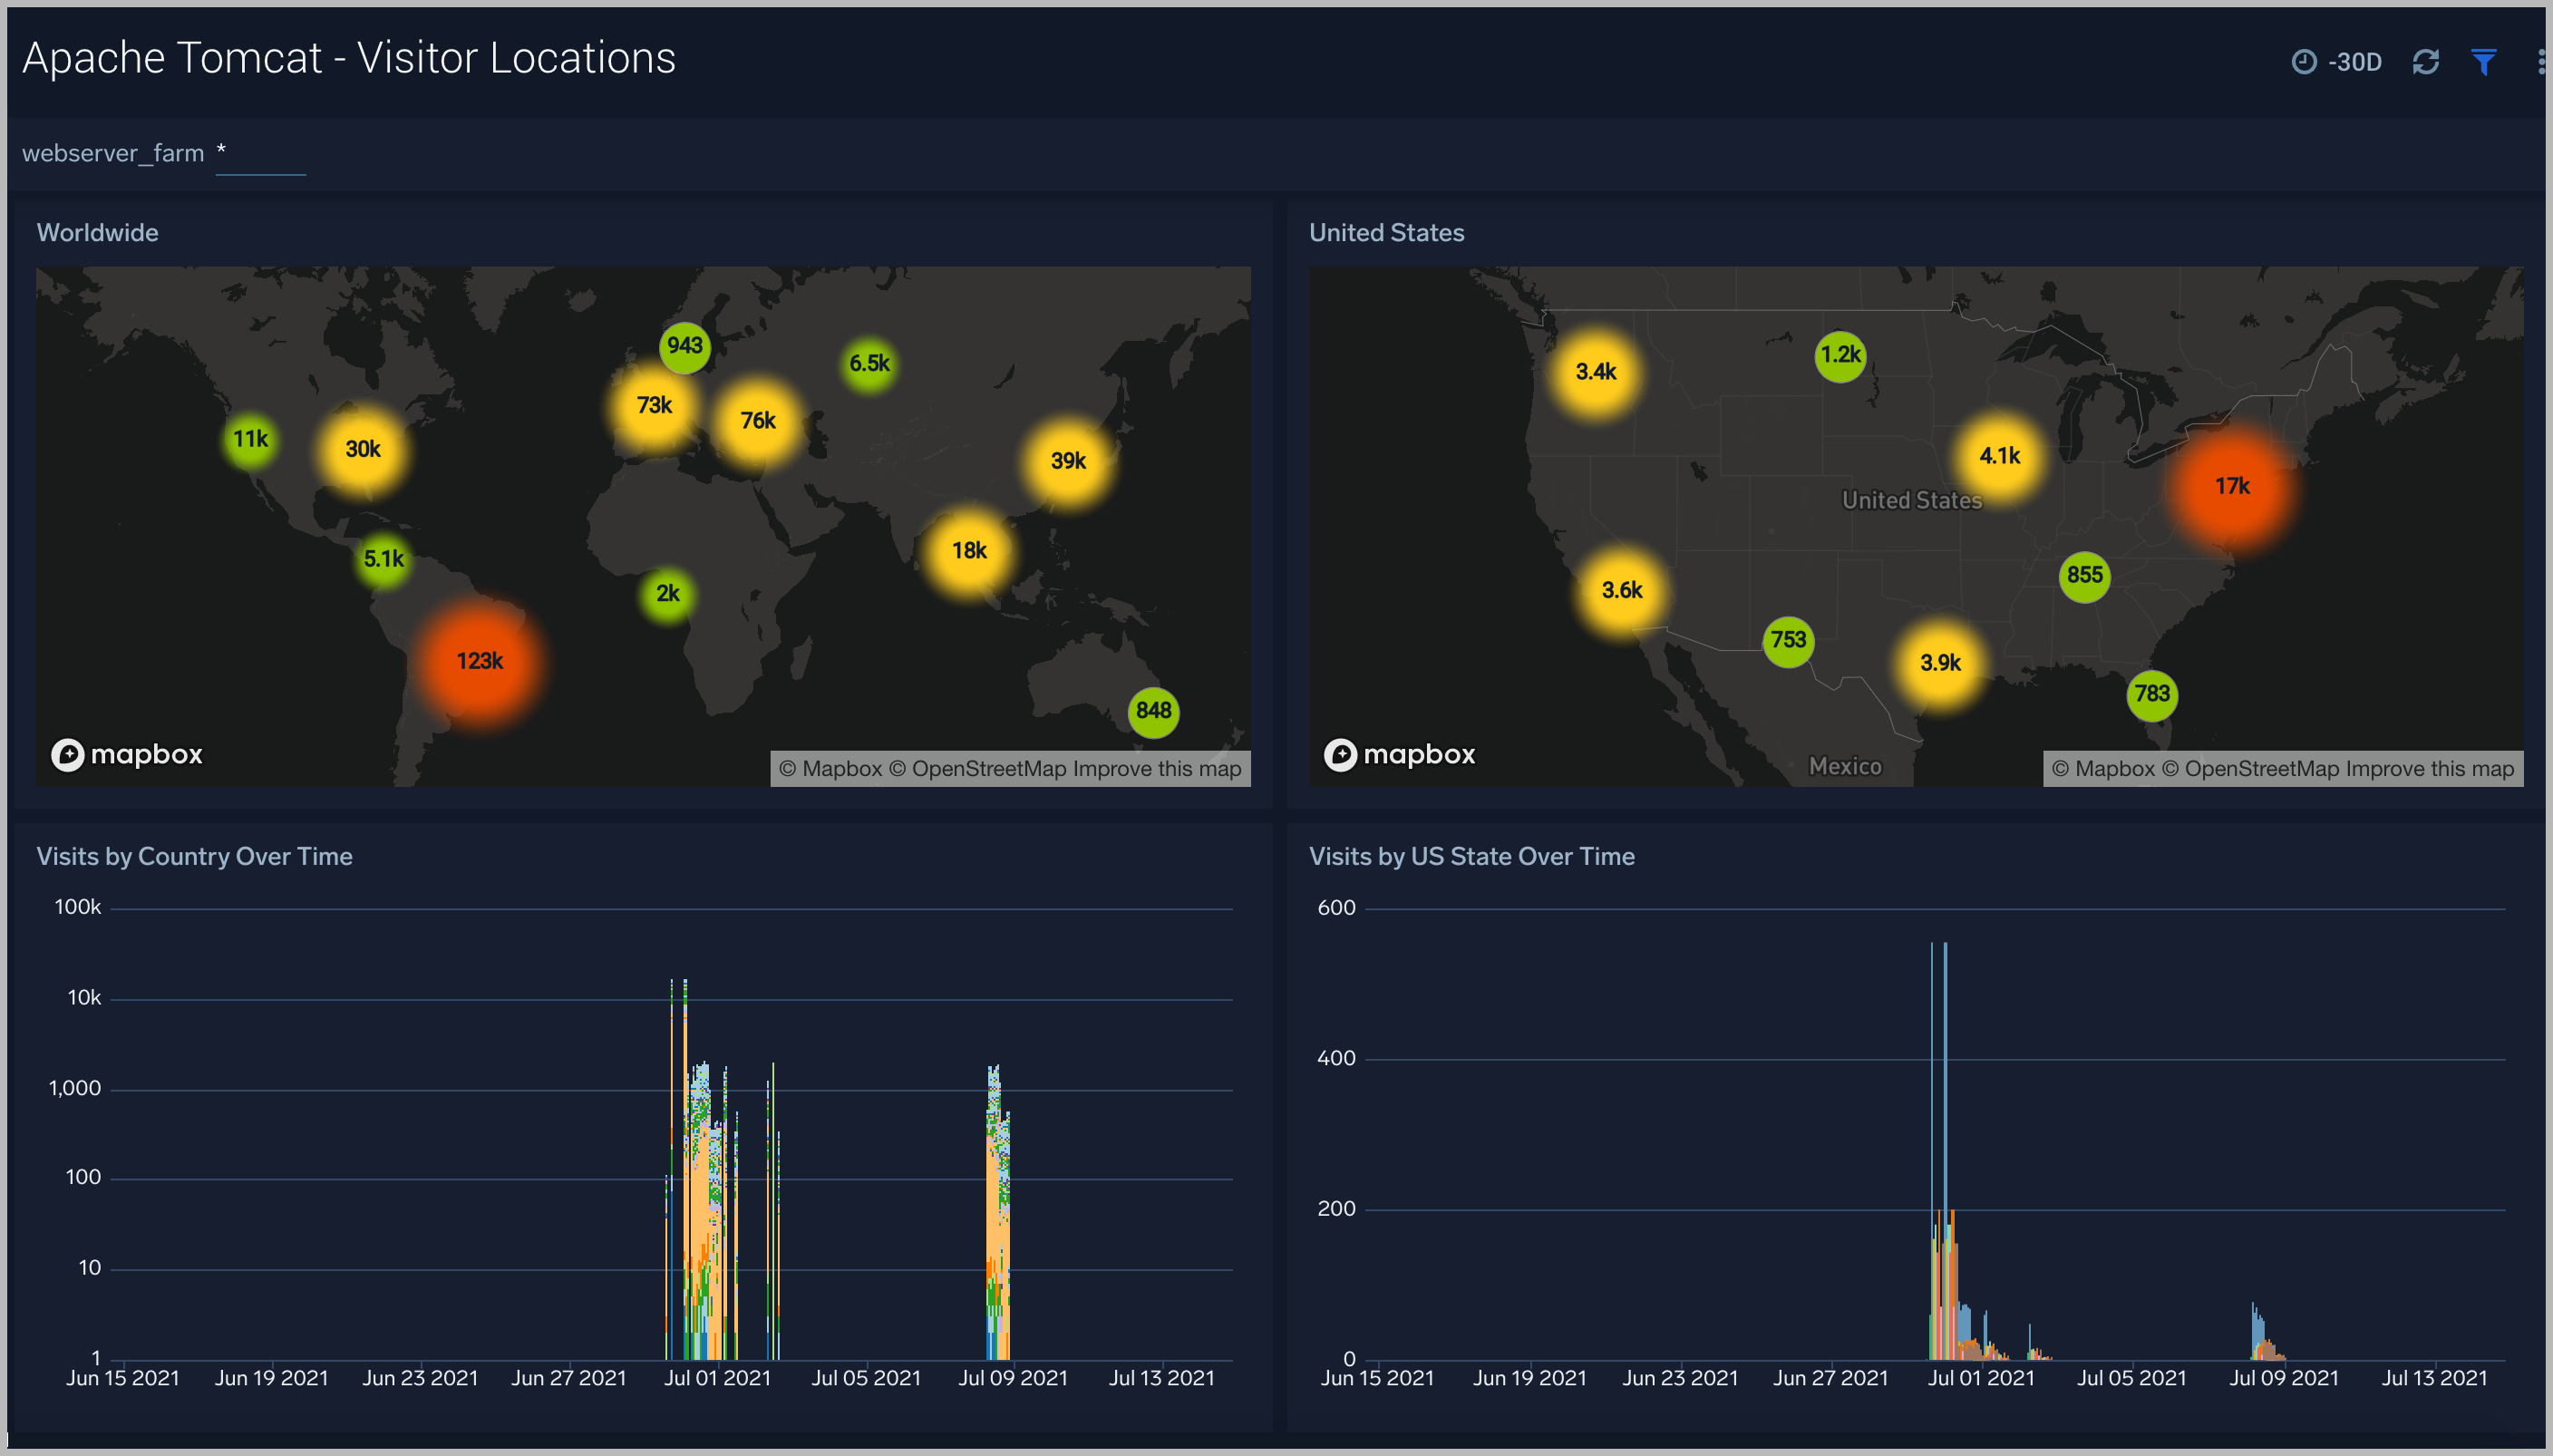
Visitor Locations
The Apache Tomcat - Visitor Locations dashboard provides a high-level view of Tomcat visitor geographic locations both worldwide and in the United States. Dashboard panels also show graphic trends for visits by country over time and visits by US region over time.
- Worldwide. Uses a geo lookup operation to display worldwide visitor locations by IP address on a map of the world, which allows you to see a count of hits per location for the last 24 hours.
- Visits by Country Over Time. Displays the number of visitors by country in a stacked column chart on a timeline for the last hour.
- United States. Uses a geo lookup operation to display US visitor locations by IP address on a map of the world, which allows you to see a count of hits per location for the last 24 hours.
- Visits by US State Over Time. Displays the number of US visitors by state in a stacked column chart on a timeline for the last hour.
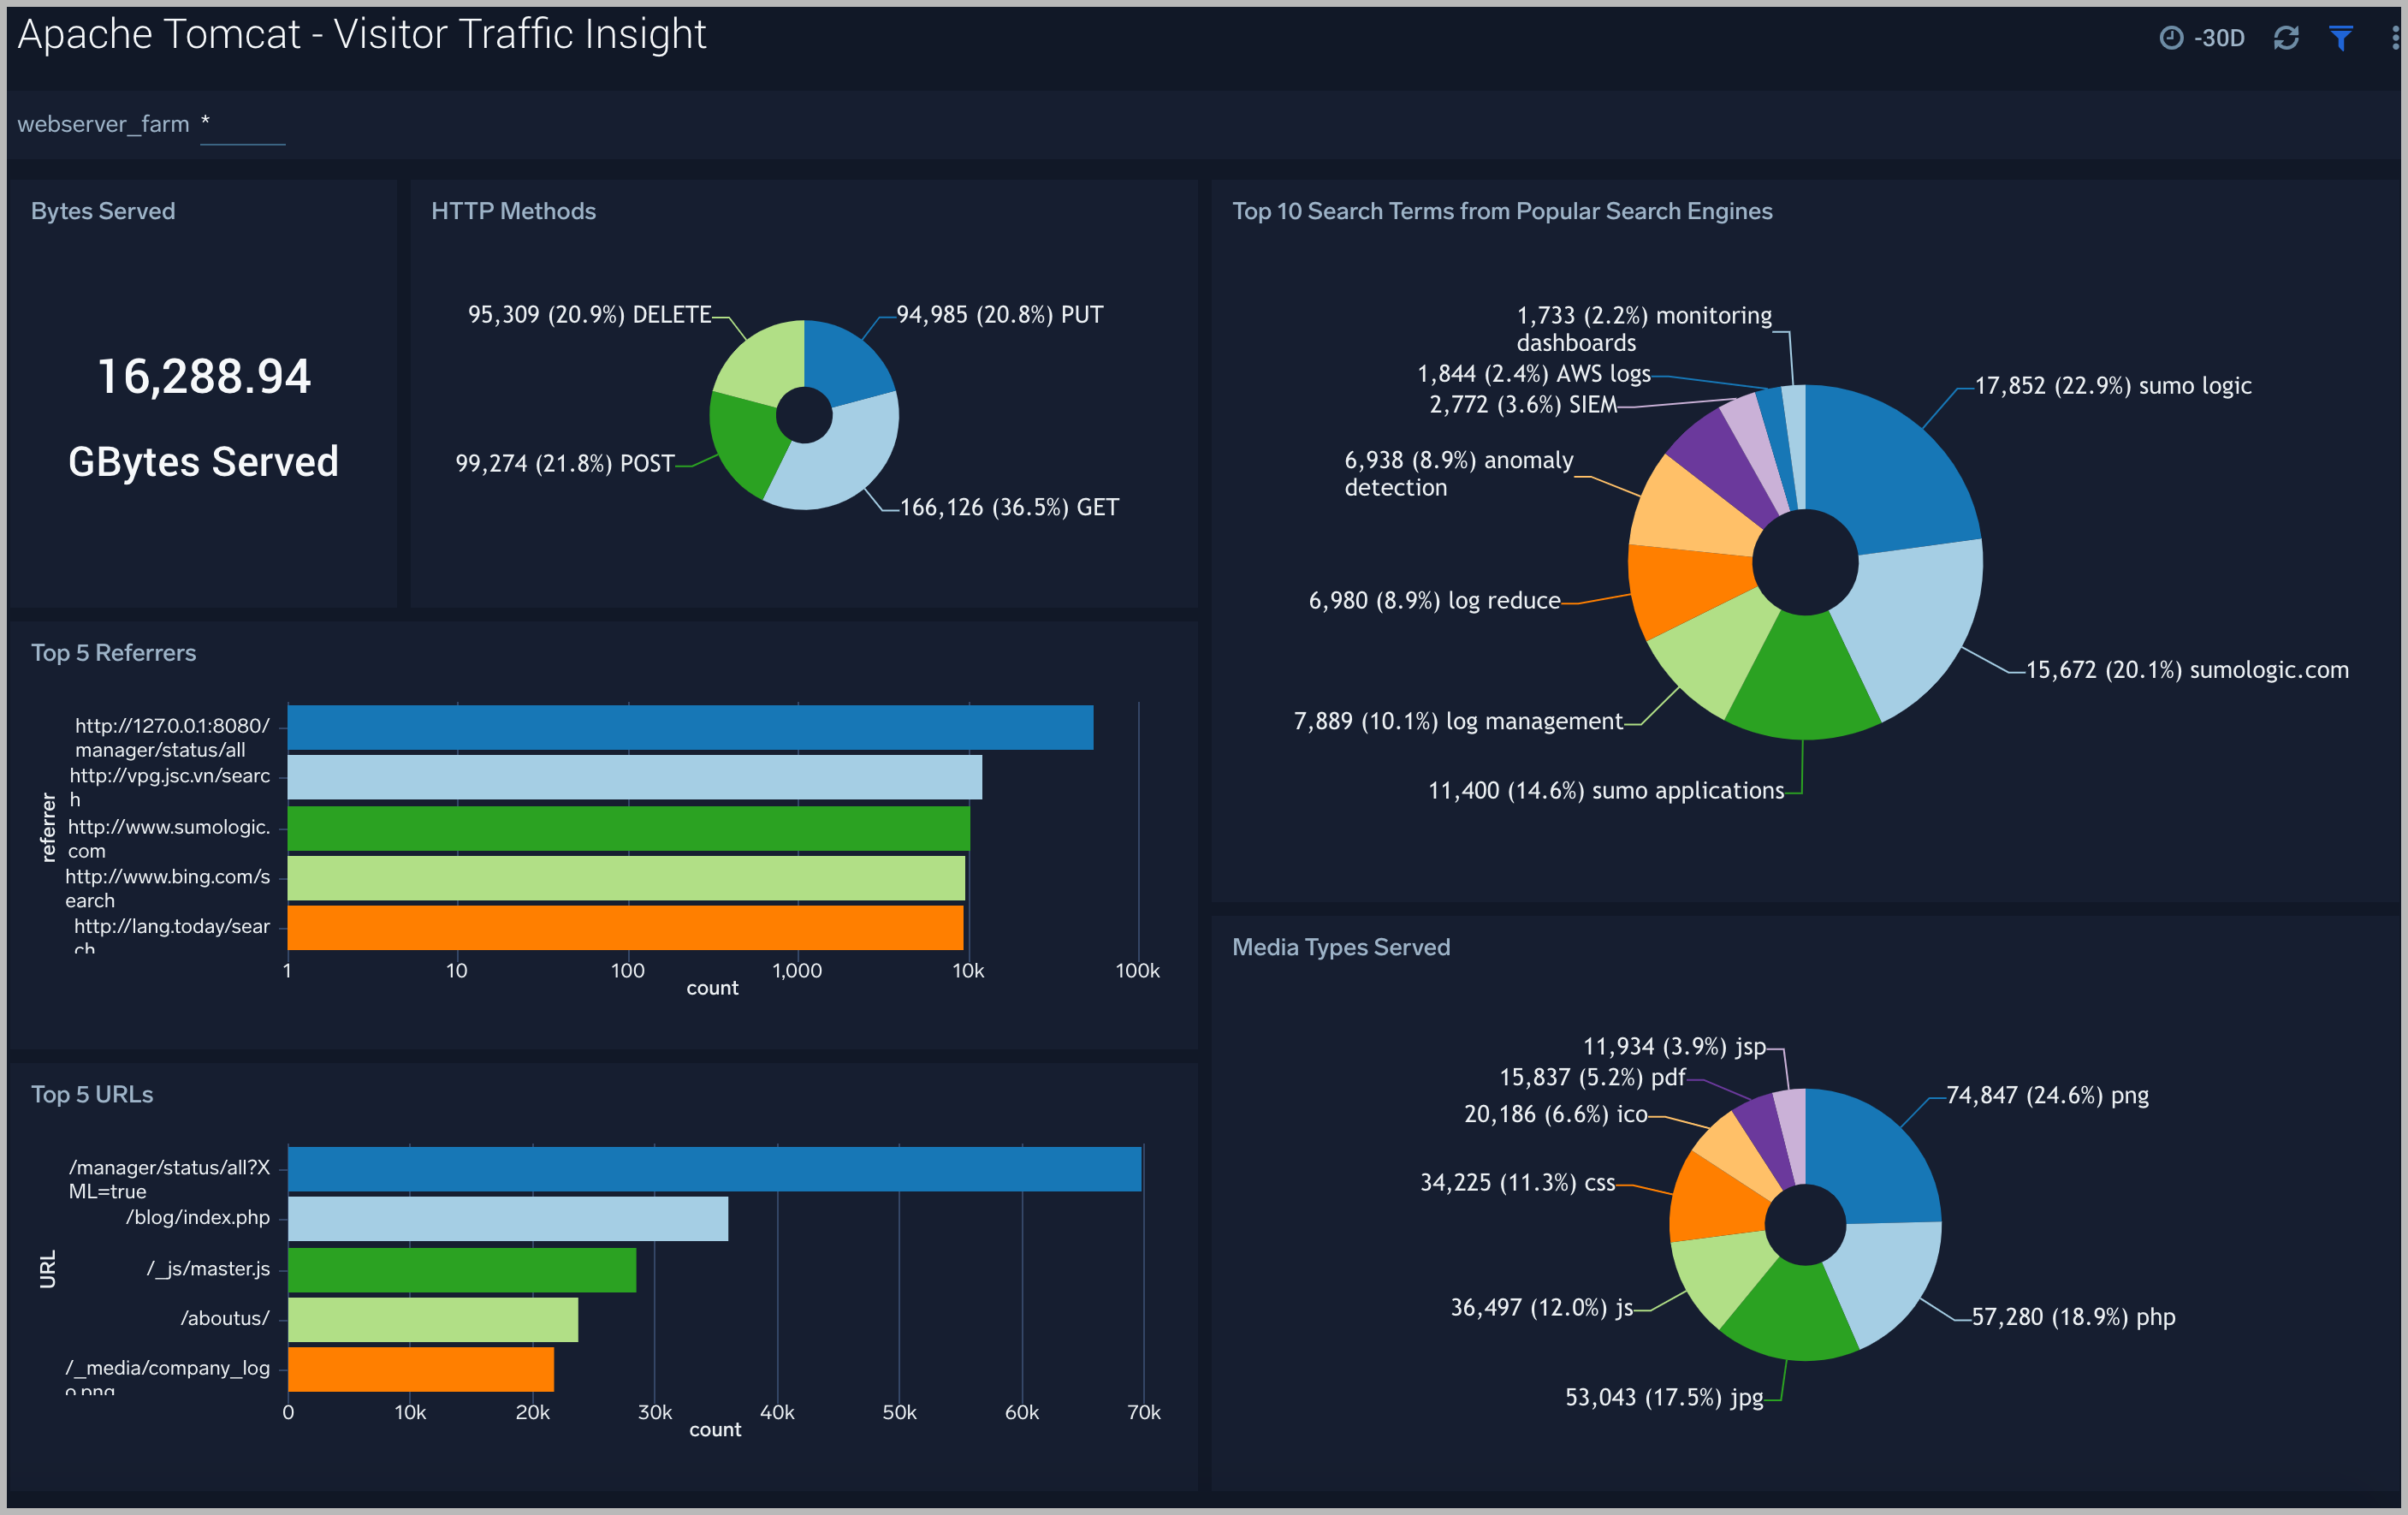
Visitor Traffic Insight
The Apache Tomcat - Visitor Traffic Insight dashboard provides detailed information on the top documents accessed, top referrers, top search terms from popular search engines, and the media types served.
- Bytes Served. Displays bytes served in a single chart on a timeline for the last 60 minutes.
- HTTP Methods. Shows the number of methods over time in a pie chart on a timeline for the last 60 minutes.
- Top 5 url. Provides a list of the top 5 URLs being accessed by your visitors in a bar chart for the 60 minutes.
- Media Types Served. Displays a list of file types being served in a pie chart for the 60 minutes.
- Top 5 Referrers. Shows a list of the top 5 referring websites by URL in a bar chart for 60 minutes.
- Top 10 Search Terms from Popular Search Engines. Displays a list of the top 10 search terms and their count from search engines such as Google, Bing, and Yahoo in an aggregation table for the past hour.
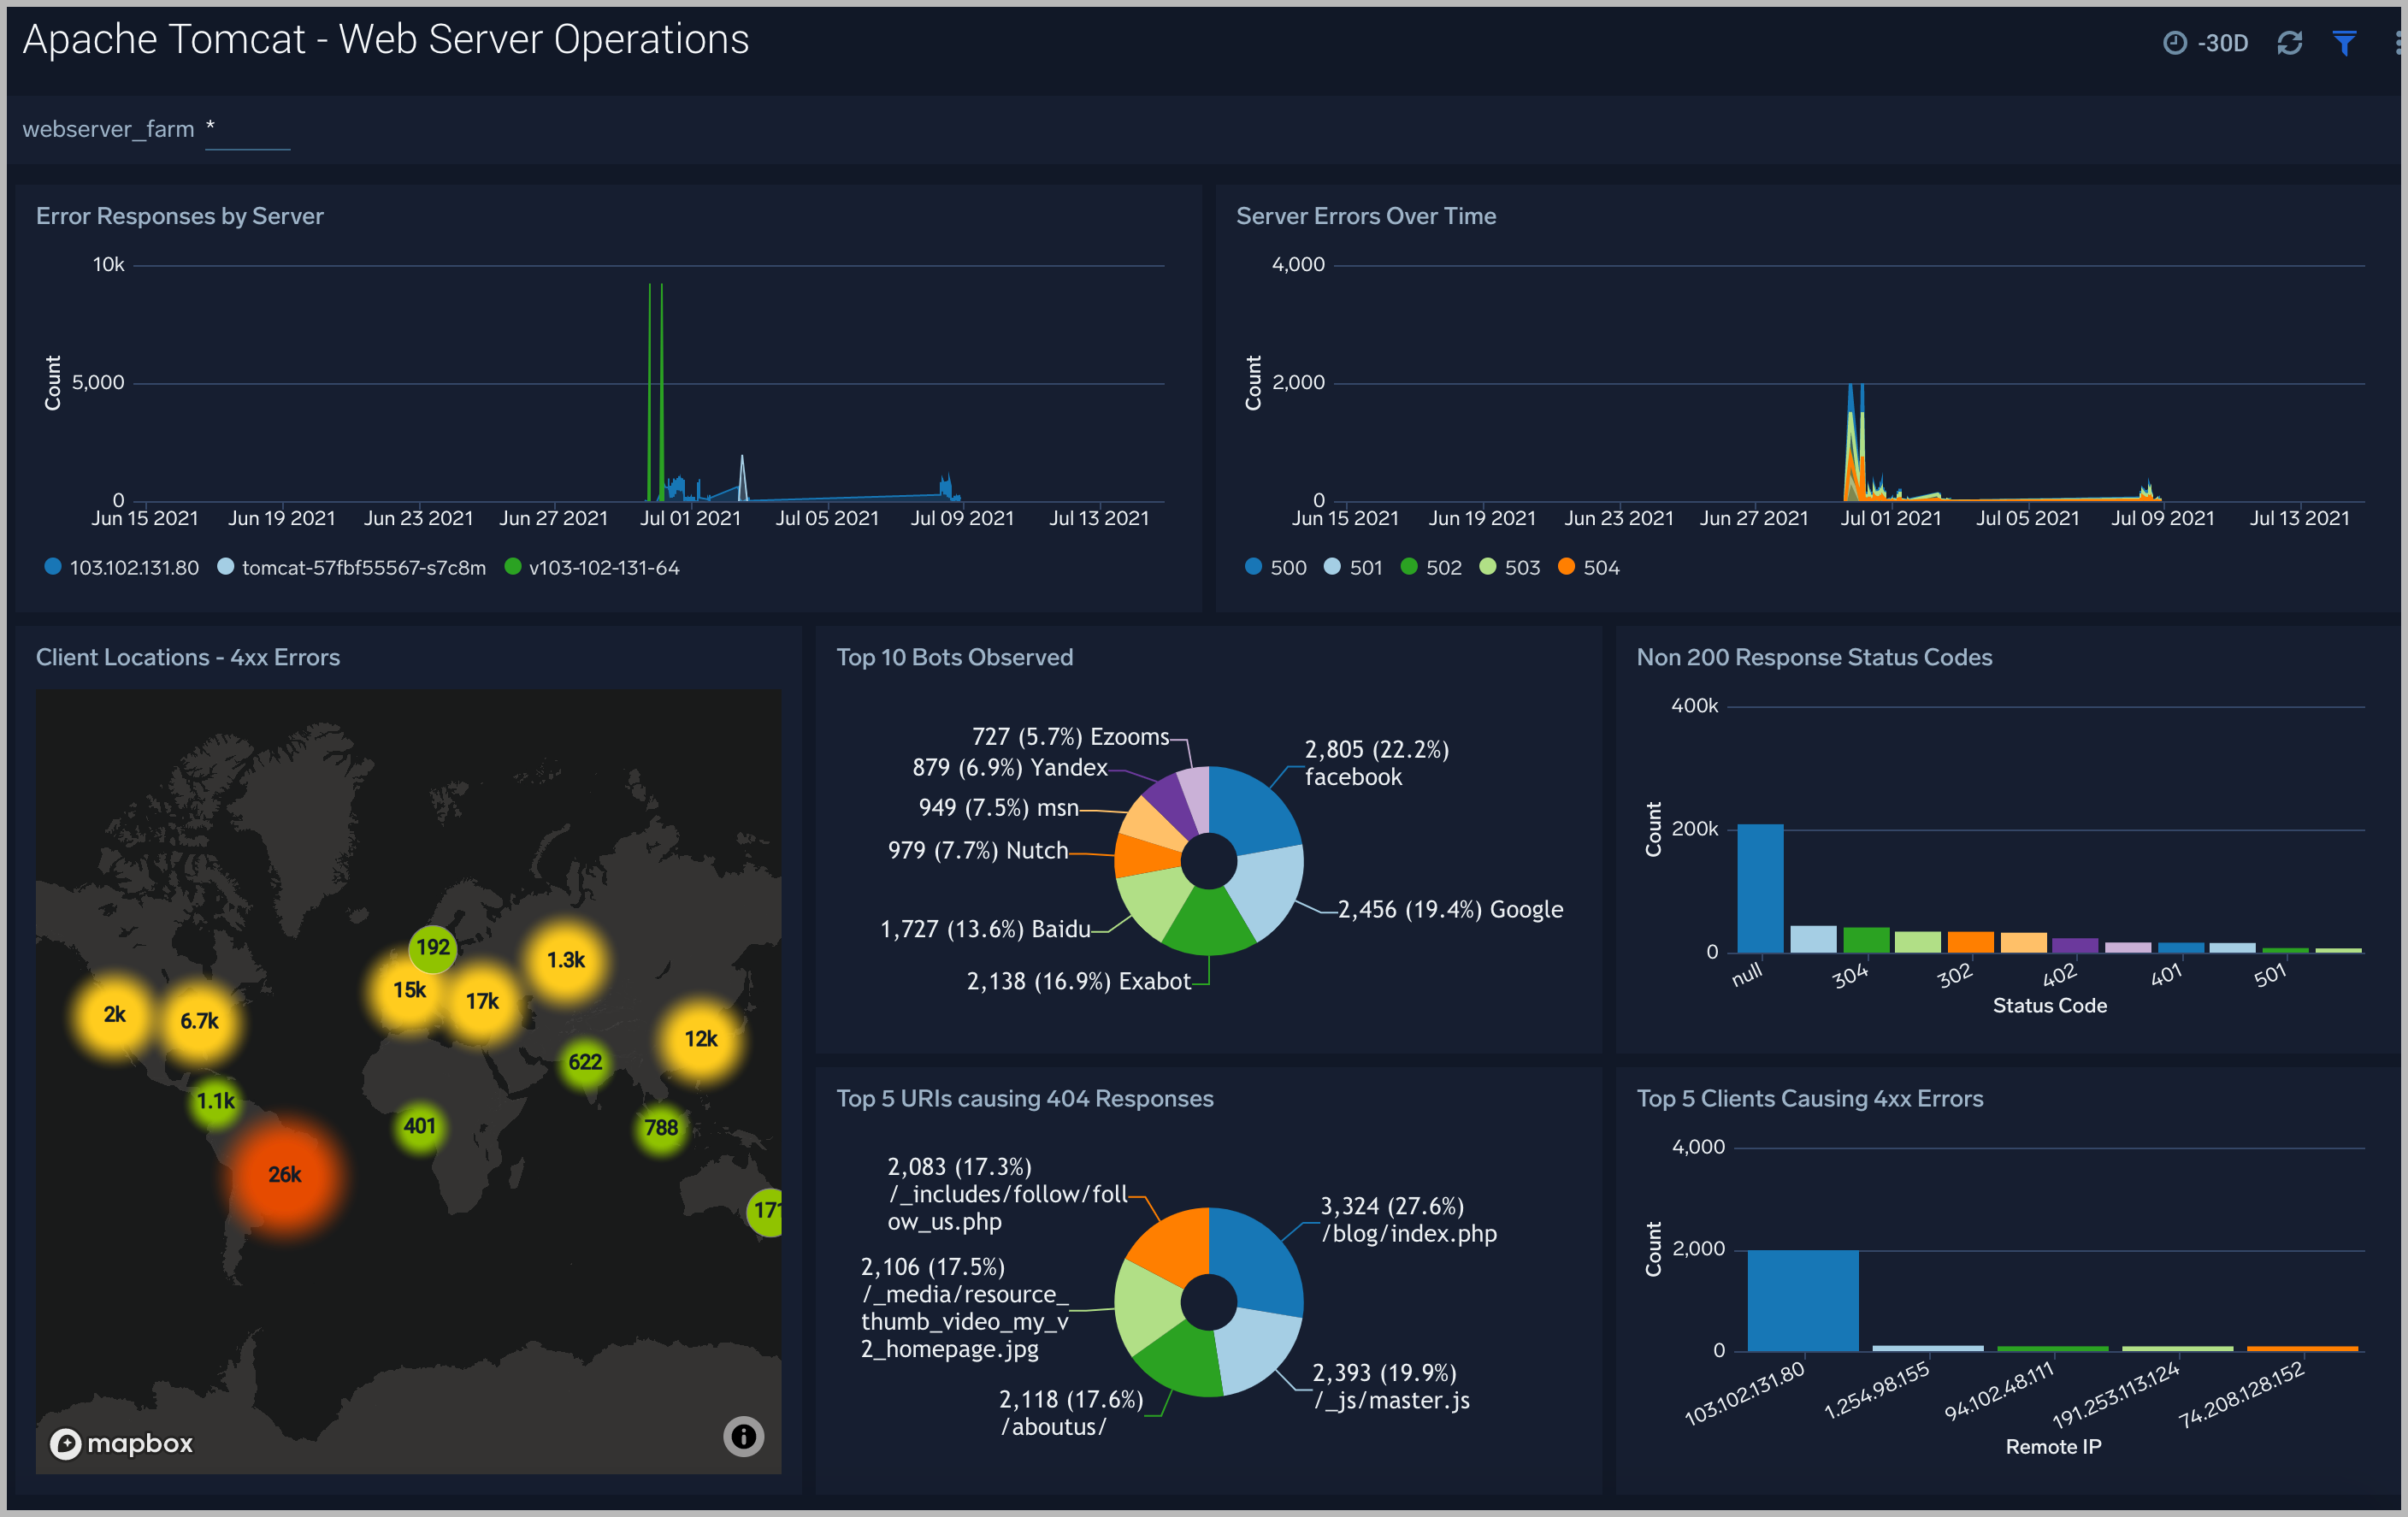
Web Server Operations
The Apache Tomcat - Web Server Operations Dashboard provides a high-level view combined with detailed information on the top ten bots, geographic locations, and data for clients with high error rates, server errors over time, and non 200 response code status codes. Dashboard panels also show information on server error logs, error log levels, error responses by the server, and the top URIs responsible for 404 responses.
- Non 200 Response Status Codes. Displays the number of non-200 response status codes in a bar chart for the past hour.
- Client Locations - 4xx Errors. Uses a geo lookup operation to display the location of clients with 4xx errors by IP address on a map of the world, which allows you to see a count of hits per location for the last hour.
- Server Errors Over Time. Provides information on the type and number of server errors in a column chart on a line chart for the past hour.
- Error Responses by Server. Shows error responses and their distribution by the server in a line chart for the past hour.
- Top 5 Clients Cause 4xx Errors. Displays a list of the top 5 clients that have 4xx errors in a bar chart for the past hour.
- Top 5 URIs Causing 404 Responses. Provides a list of the top 5 URIs with 404 response types in a pie chart for the past hour.
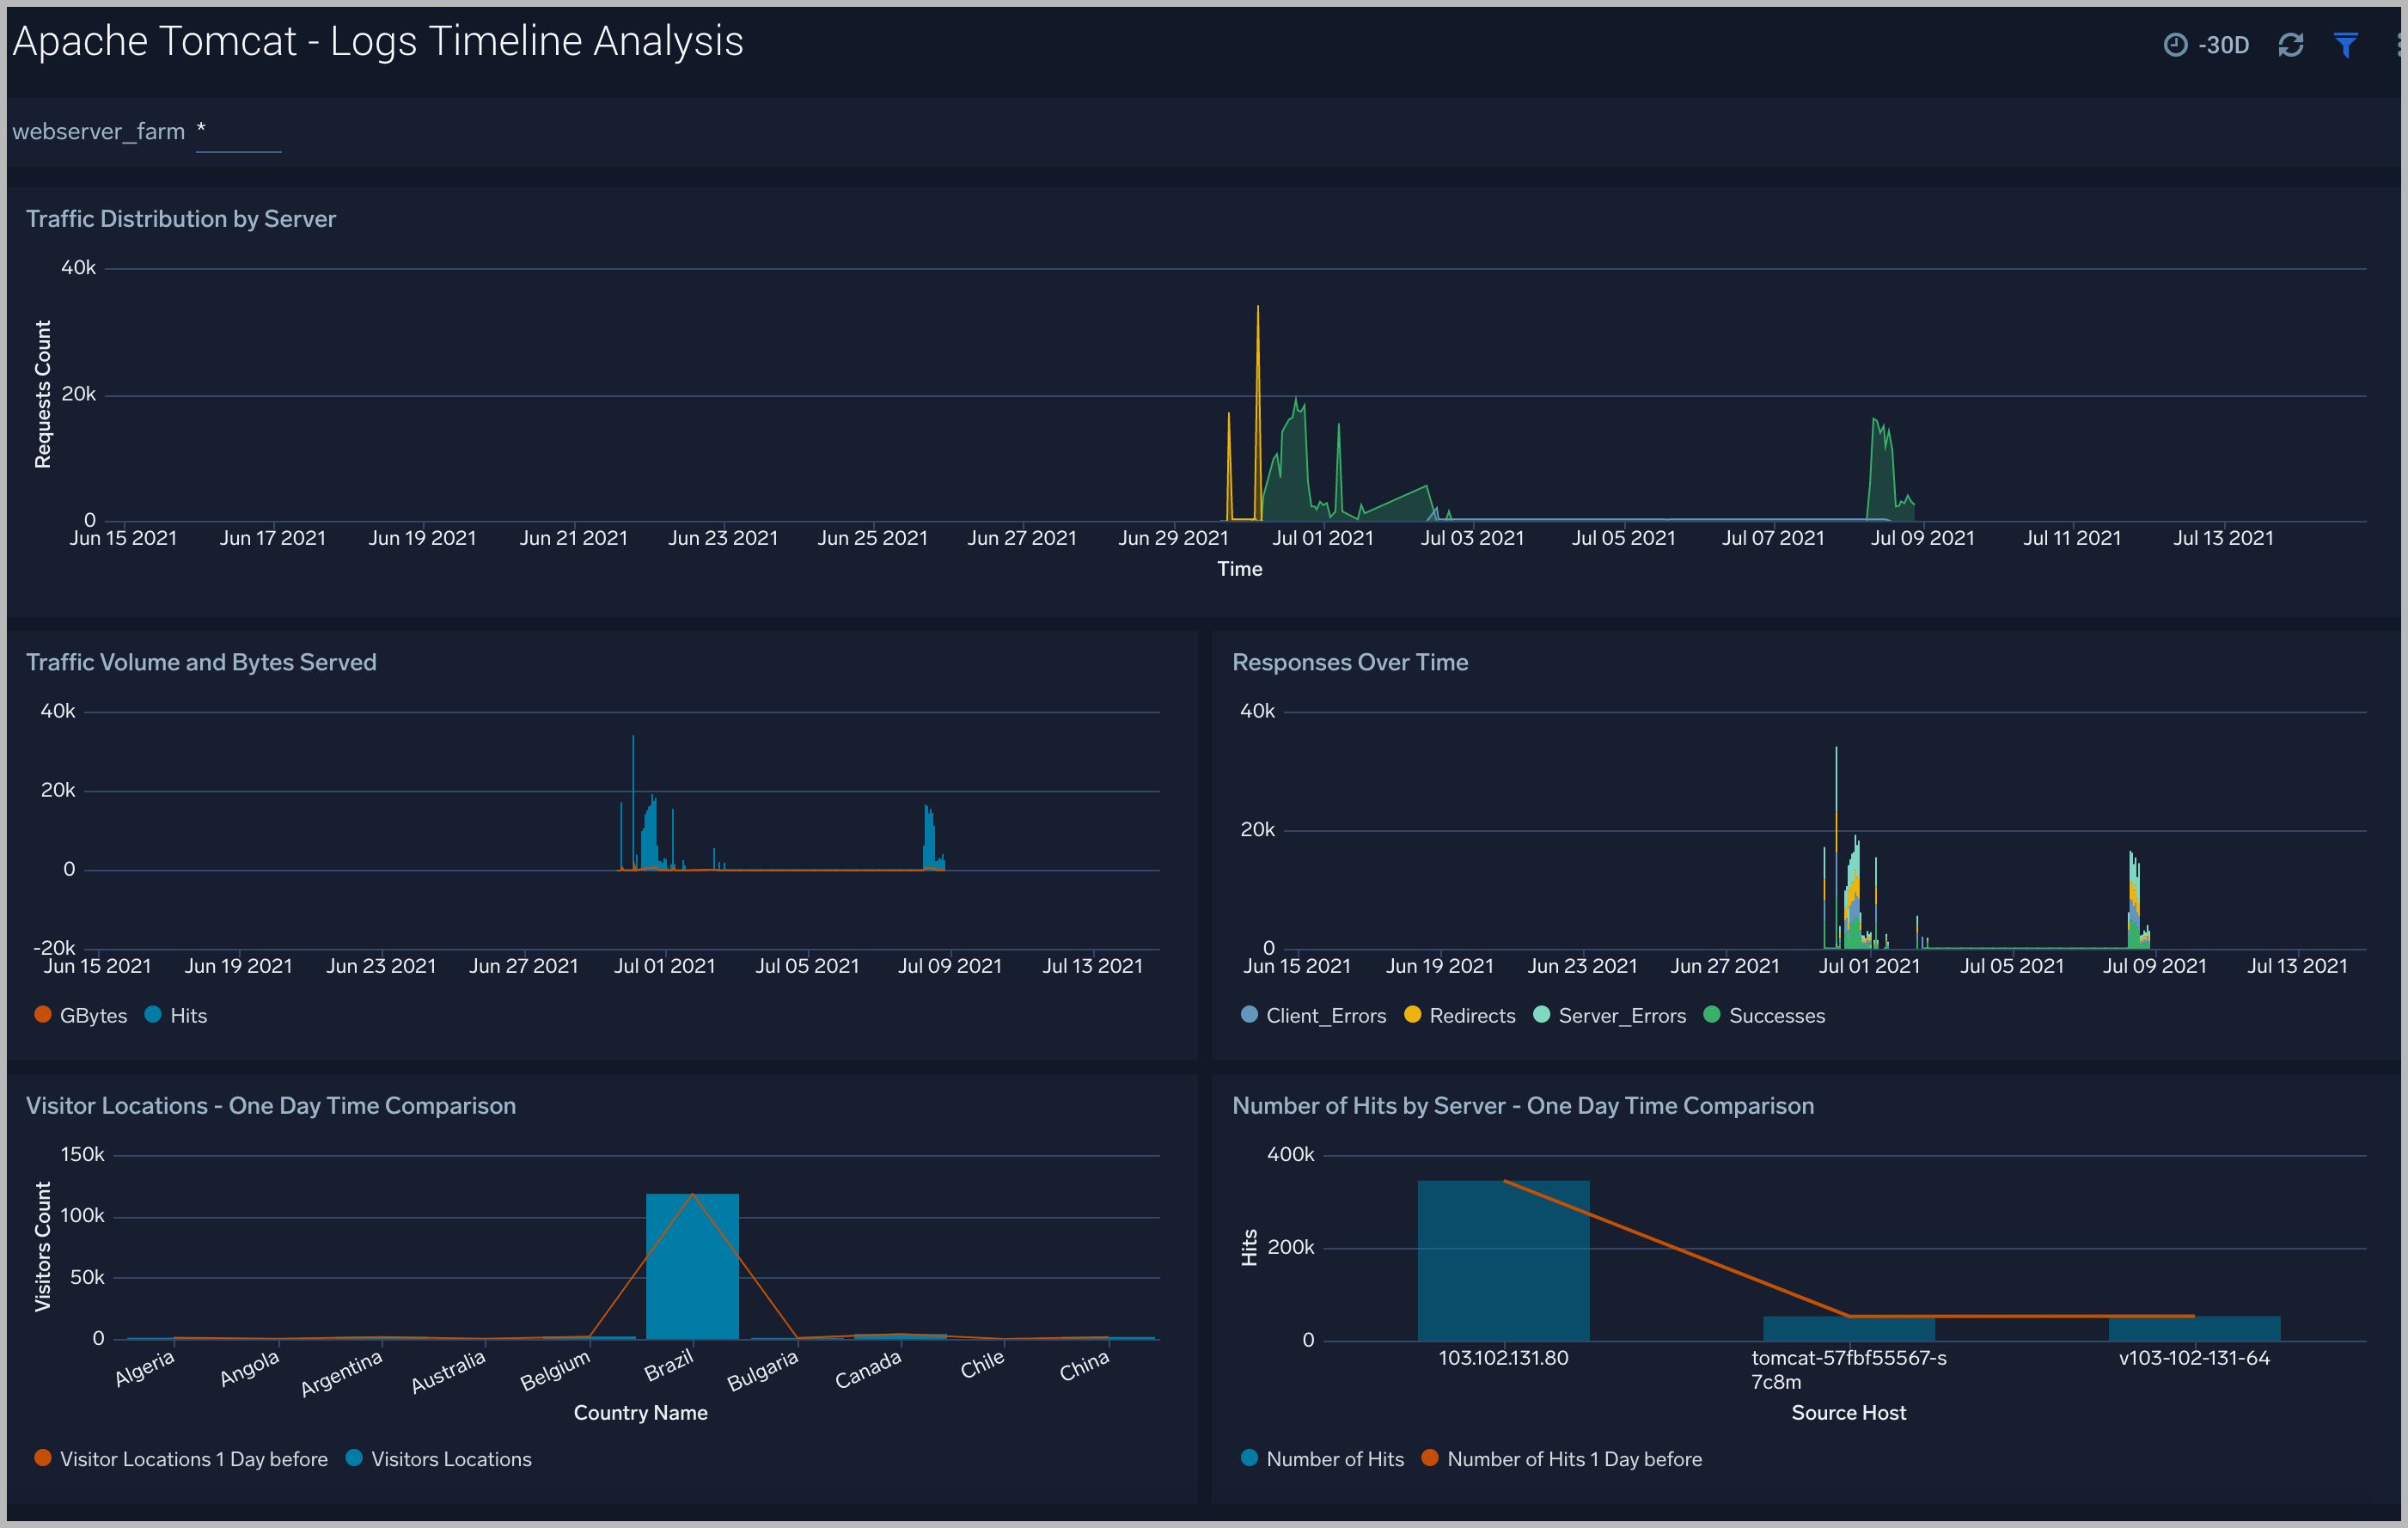
Logs Timeline Analysis
The Apache Tomcat - Logs Timeline Analysis dashboard provides a high-level view of the activity and health of Apache Tomcat servers on your network. Dashboard panels display visual graphs and detailed information on traffic volume and distribution, responses over time, as well as time comparisons for visitor locations and server hits.
Use this dashboard to:
- To understand the traffic distribution across servers, provide insights for resource planning by analyzing data volume and bytes served.
- Gain insights into originated traffic location by region. This can help you allocate compute resources to different regions according to their needs.
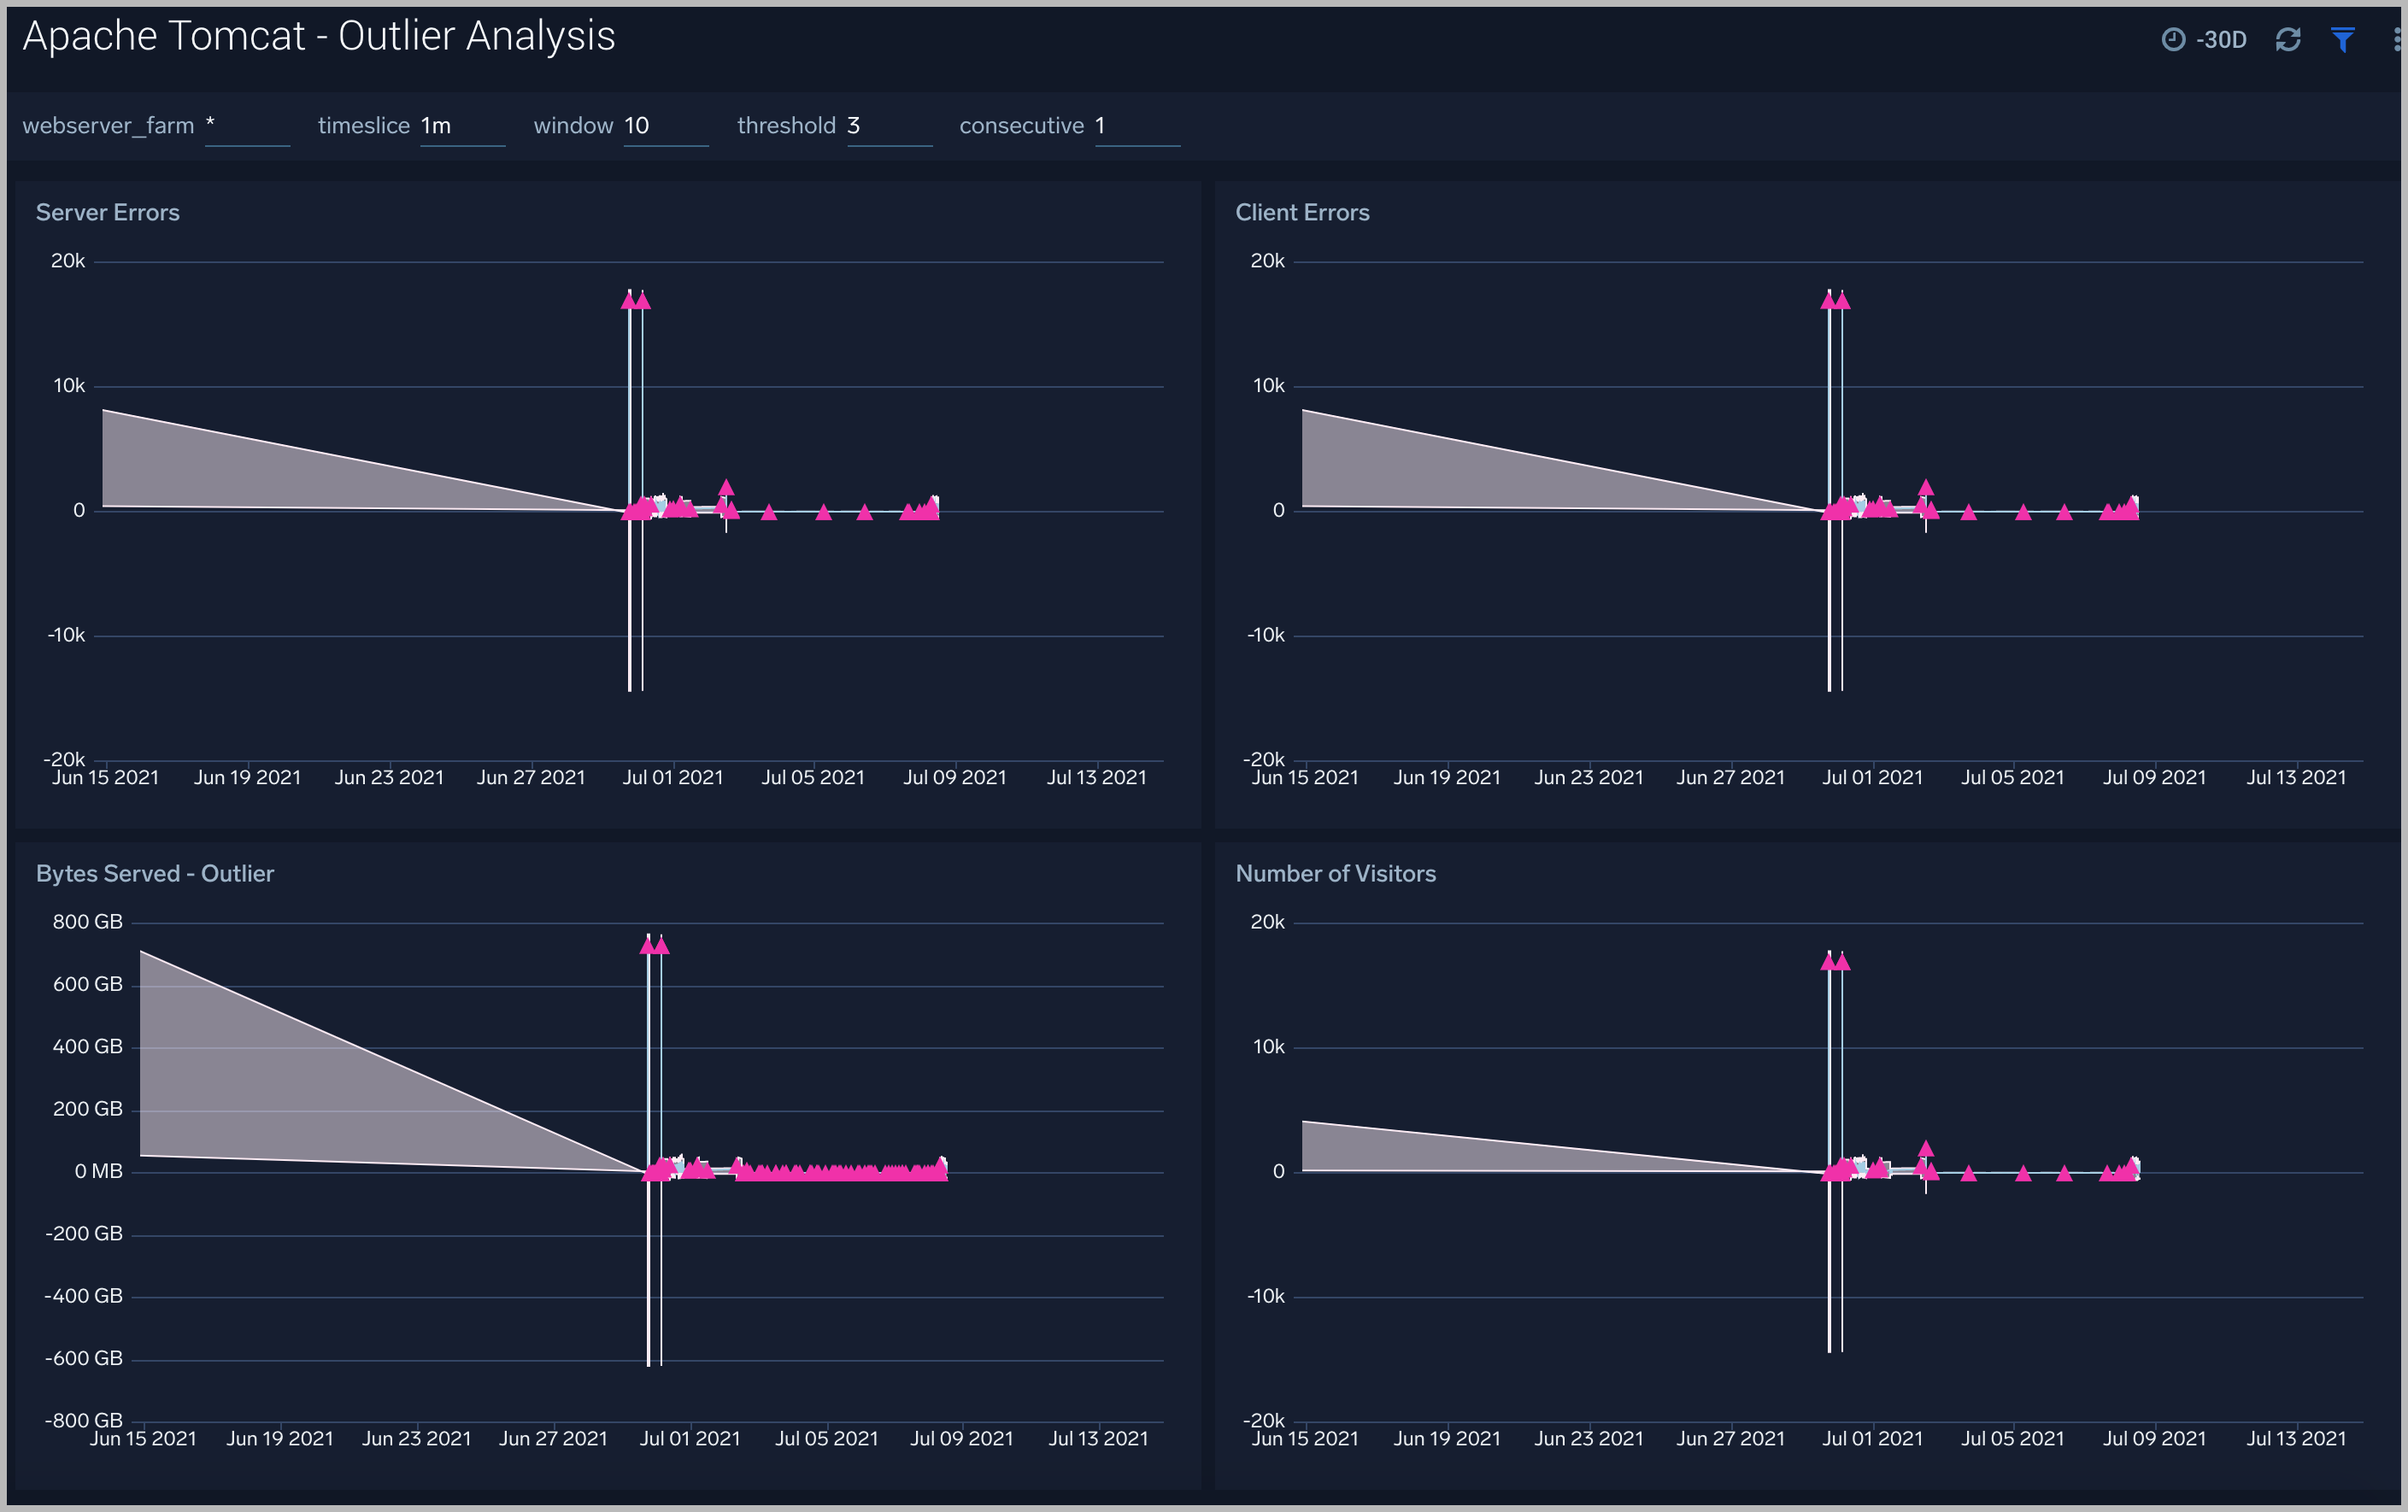
Outlier Analysis
The Apache Tomcat - Outlier Analysis dashboard provides a high-level view of Apache Tomcat server outlier metrics for bytes served, number of visitors, and server errors. You can select the time interval over which outliers are aggregated, then hover the cursor over the graph to display detailed information for that point in time.
Use this dashboard to:
- Detect outliers in your infrastructure with Sumo Logic’s machine-learning algorithm.
- To identify outliers in incoming traffic and the number of errors encountered by your servers.
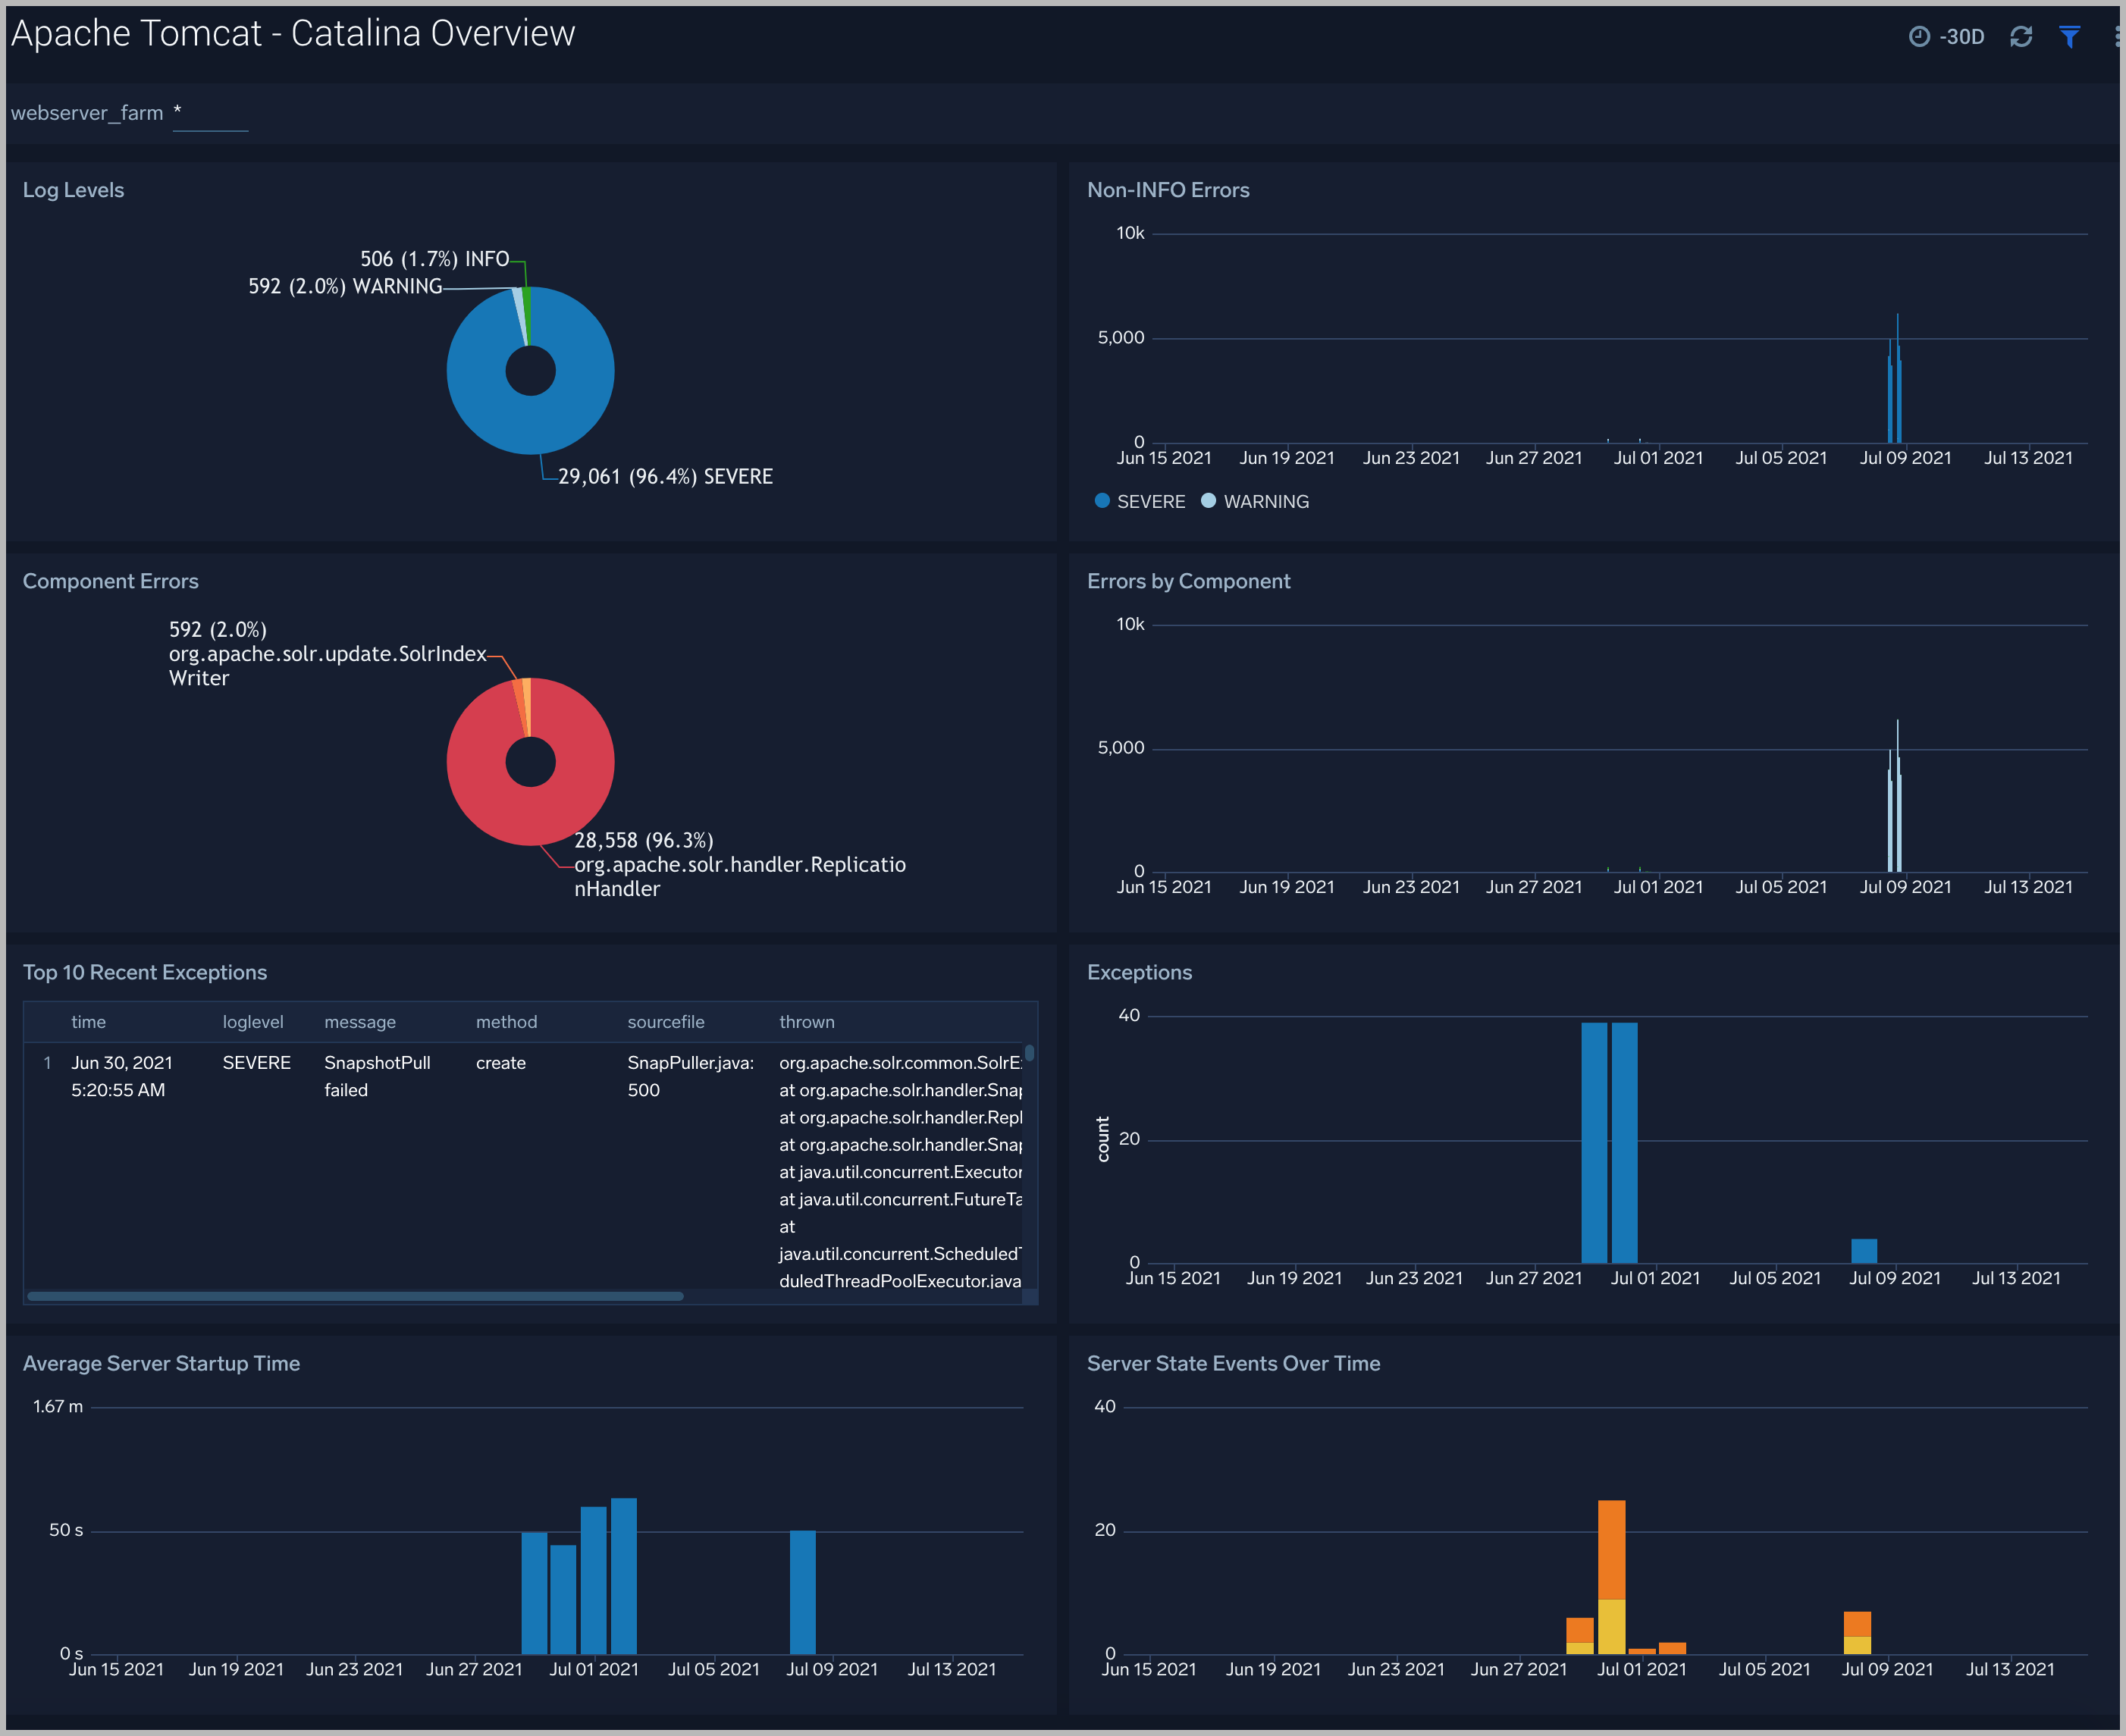
Catalina Overview
The Apache Tomcat - Catalina dashboard provides information about events such as the startup and shutdown of the Apache Tomcat application server, the deployment of new applications, or the failure of one or more subsystems.
- Log Levels. Displays log level types (Info, Severe, and Warning) in a pie chart for the last 24 hours.
- Non-INFO Errors. Shows the number and type of errors (Severe or Warning) in a stacked column chart on a timeline for the last 24 hours.
- Component Errors. Provides information on errors by component in a pie chart for the last 24 hours.
- Errors by Component. Displays Info level errors by component in a stacked column chart on a timeline for the last 24 hours.
- Top 10 Recent Exceptions. Shows the top 10 most recent exceptions in an aggregation table with columns for time, log level, message, method, source file, and thrown for the last 24 hours.
- Exceptions. Provides the number of exceptions in a column chart on a timeline for the last seven days.
- Average Server Startup Time. Displays the average server startup time per second by day as a column chart on a timeline for the last seven days.
- Server State Events Over Time. Shows server state events (shutdown or startup) in a stacked column chart on a timeline for the last seven days.
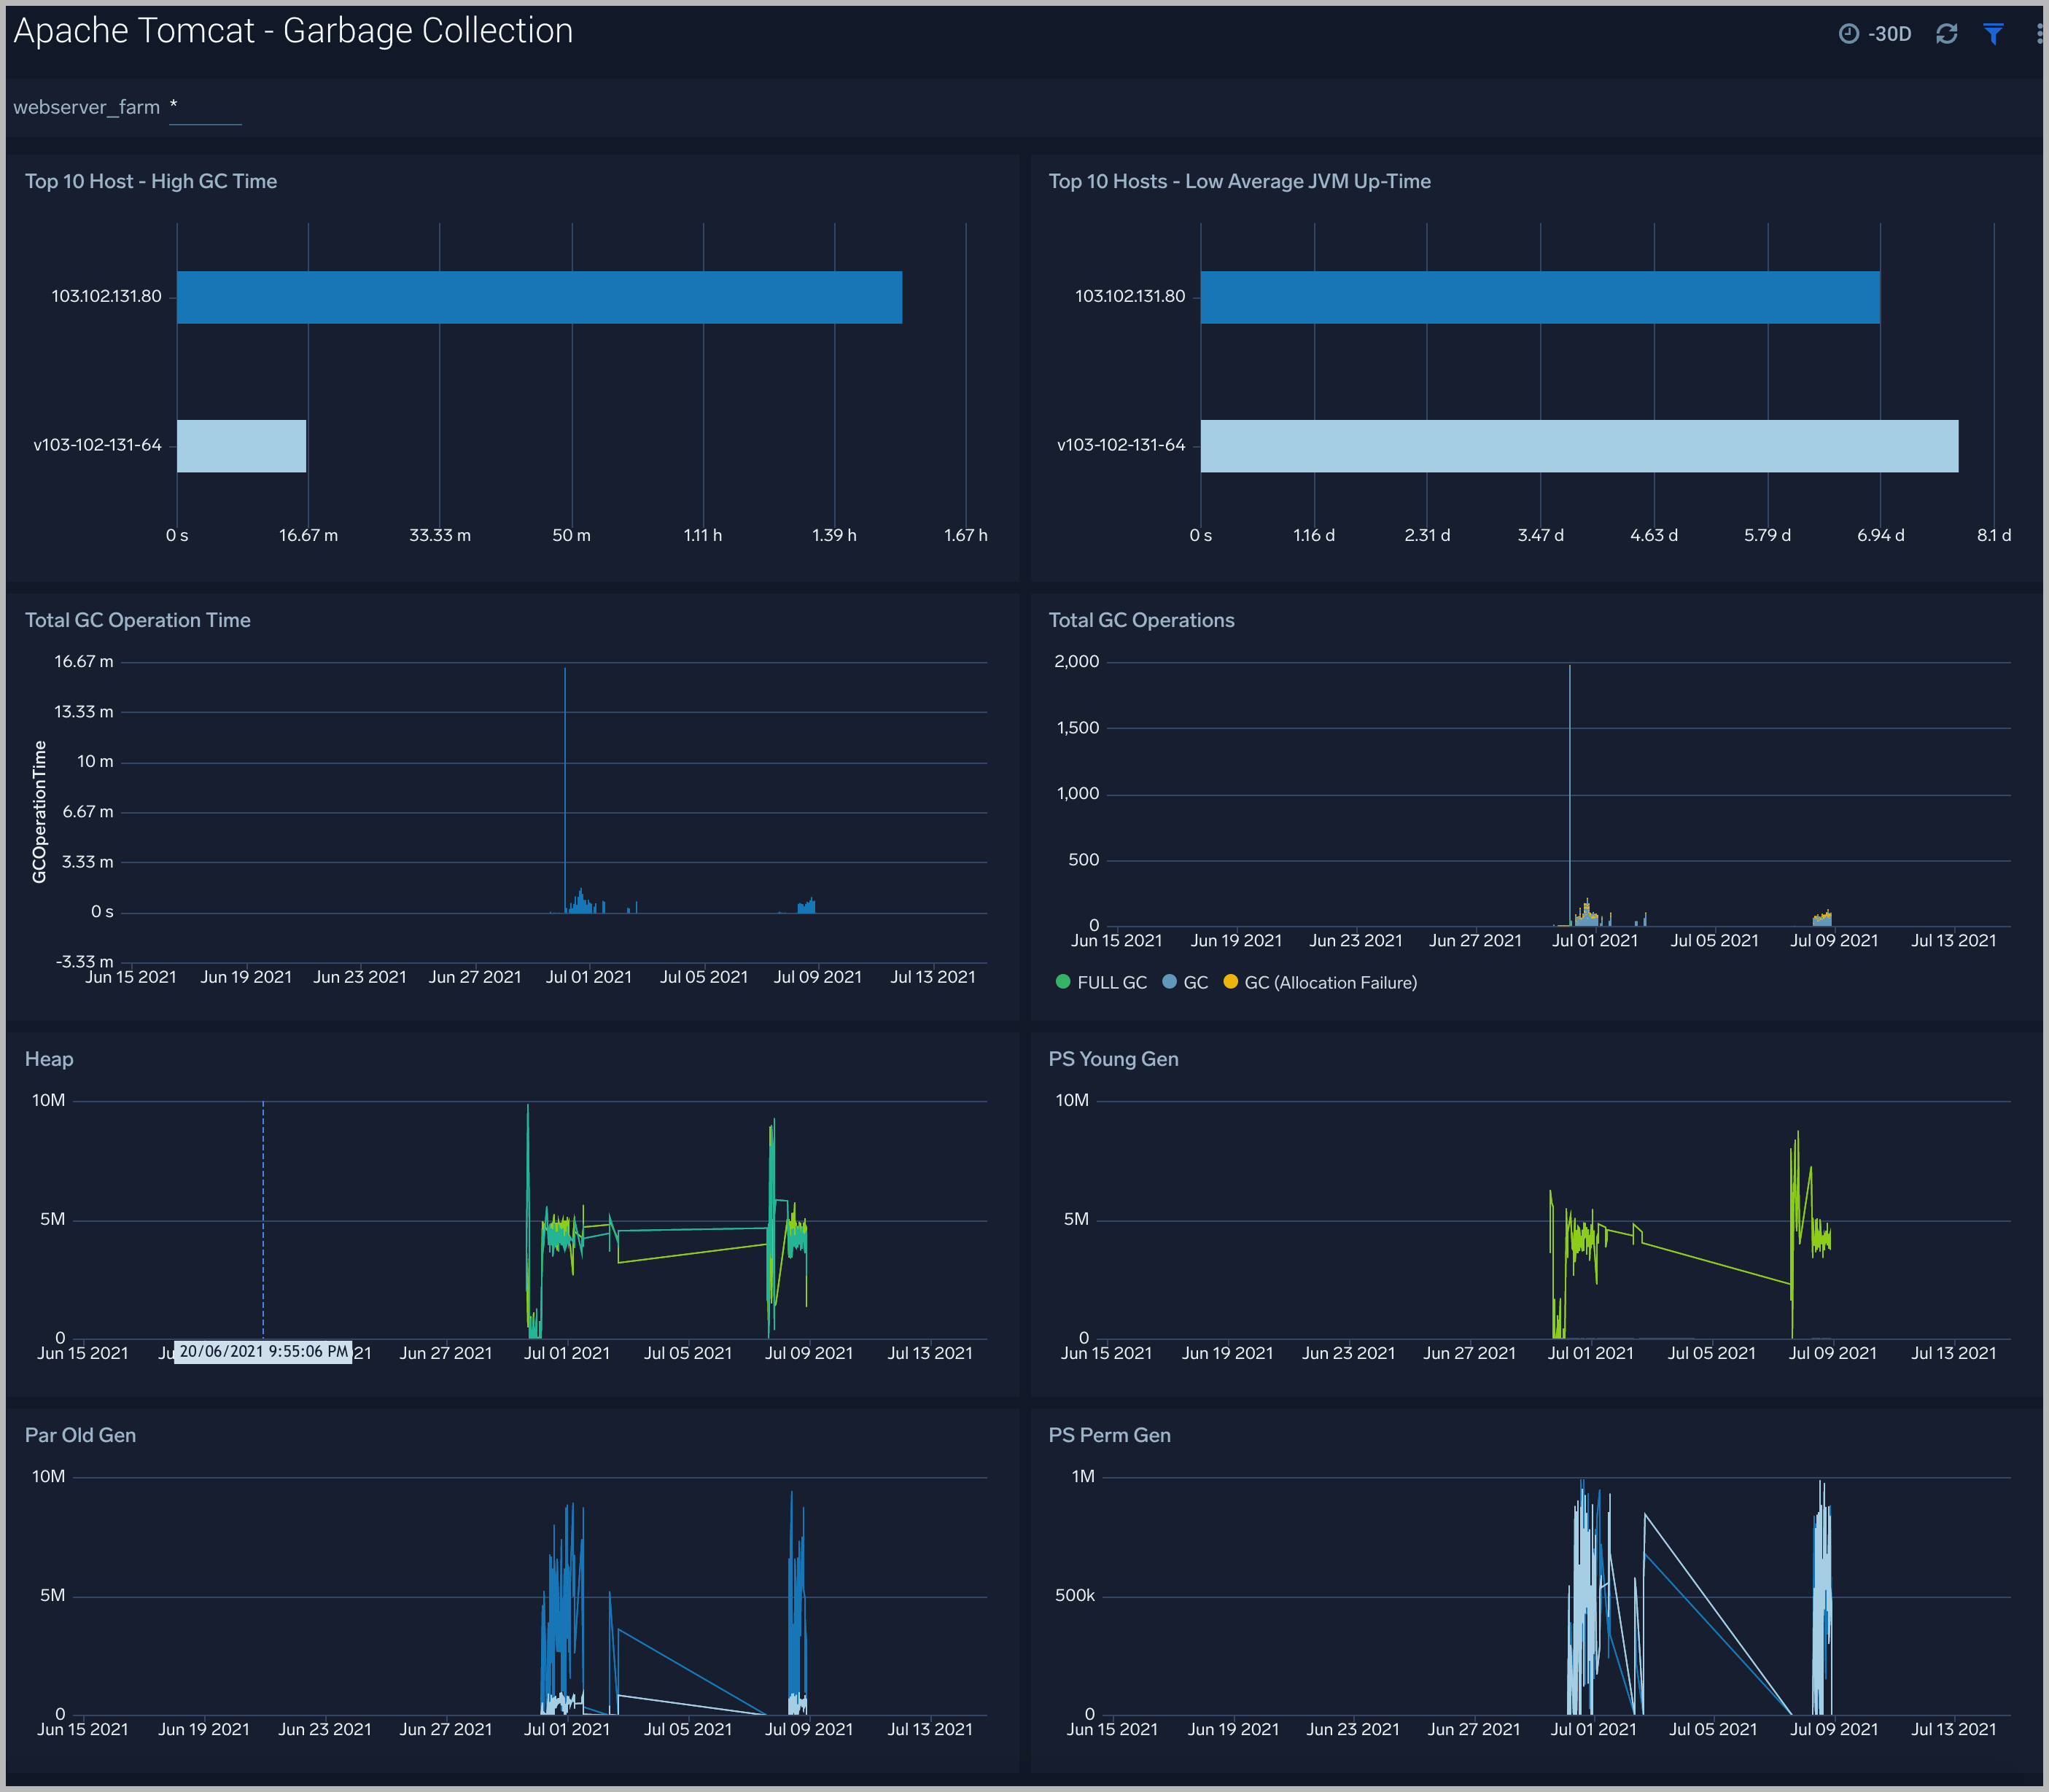
Garbage Collection
The Apache Tomcat - Garbage Collector dashboard provides information on the garbage collection of the Java Virtual Machine.
- Top 10 Host - High GC Time. Displays the top 10 hosts with high garbage collection operation time as a bar chart for the last 12 hours.
- Top 10 Hosts - Low Average JVM Up-Time. Shows the top 10 hosts by low average JVM up-time as a bar chart for the last 12 hours.
- Total GC Operation Time. Provides the total garbage collection operation time by timeslices of 15 minutes in a column chart on a timeline for the last 12 hours.
- Total GC Operations. Displays the total number of times Full-GC and Minor-GC collection processes are executed in timeslices of 15 minutes on a stacked column chart on a timeline for the past 12 hours.
- Heap. Shows the total heap memory utilization just before garbage collection was executed vs. total heap memory utilization after garbage collection was executed, in a line chart on a timeline for the last 12 hours.
- PS Young Gen. PS Young Gen also refers to “New Space,” which is comprised of Eden-Space and two Survivor-Spaces of identical size, usually called From and To. This panel shows Young Gen memory utilization just before garbage collection was executed vs. Young Gen memory utilization after garbage collection was executed. This part of the heap always gets garbage collected.
- Par Old Gen. Par Old Gen is also referred to as “Tenured Space”. This panel shows Old Gen memory utilization just before garbage collection was executed vs. Old Gen memory utilization after garbage collection was executed.
- PS Perm Gen. PS Perm Gen is also referred to as “Permanent Space”. This panel shows Perm Gen memory utilization just before garbage collection was executed vs. Perm Gen memory utilization after garbage collection was executed.
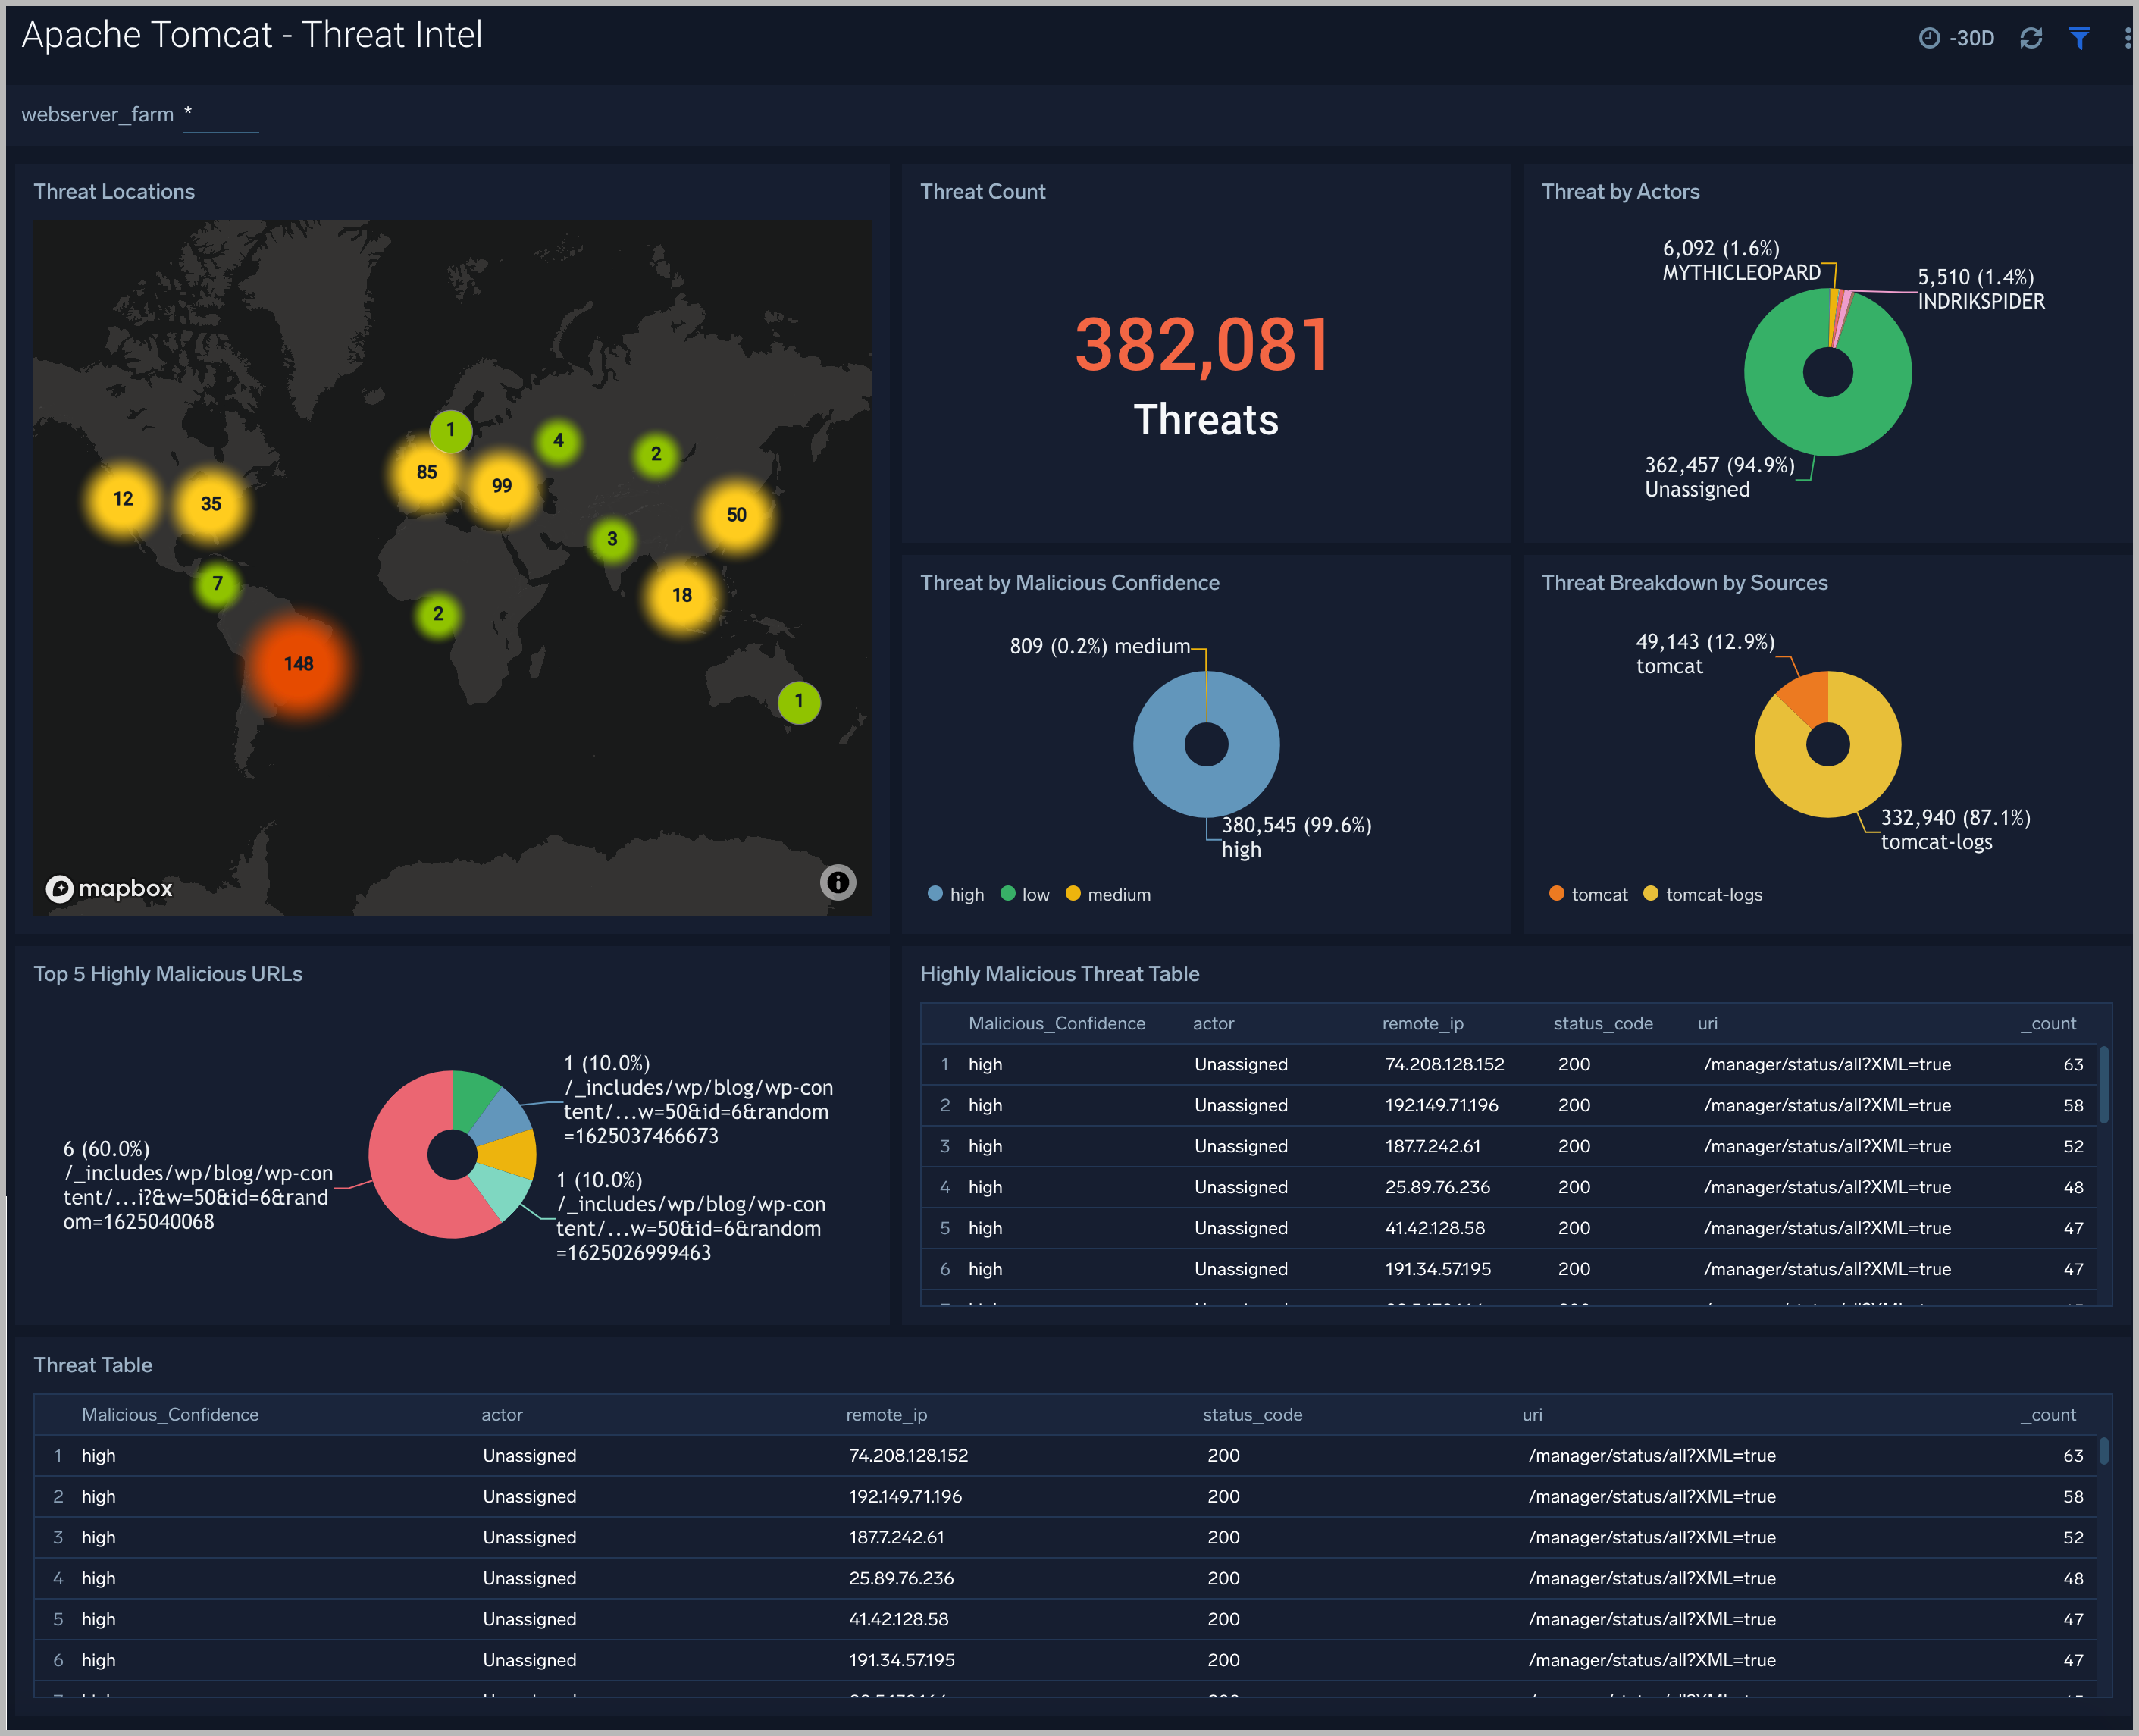
Threat intel
The Apache Tomcat - Threat Intel dashboard provides an at-a-glance view of threats to Apache Tomcat servers on your network. Dashboard panels display the threat count over a selected time period, geographic locations where threats occurred, source breakdown, actors responsible for threats, severity, and a correlation of IP addresses, method, and status code of threats.
Use this dashboard to:
- To gain insights and understand threats in incoming traffic and discover potential IOCs. Incoming traffic requests are analyzed using Sumo Logic threat intelligence.
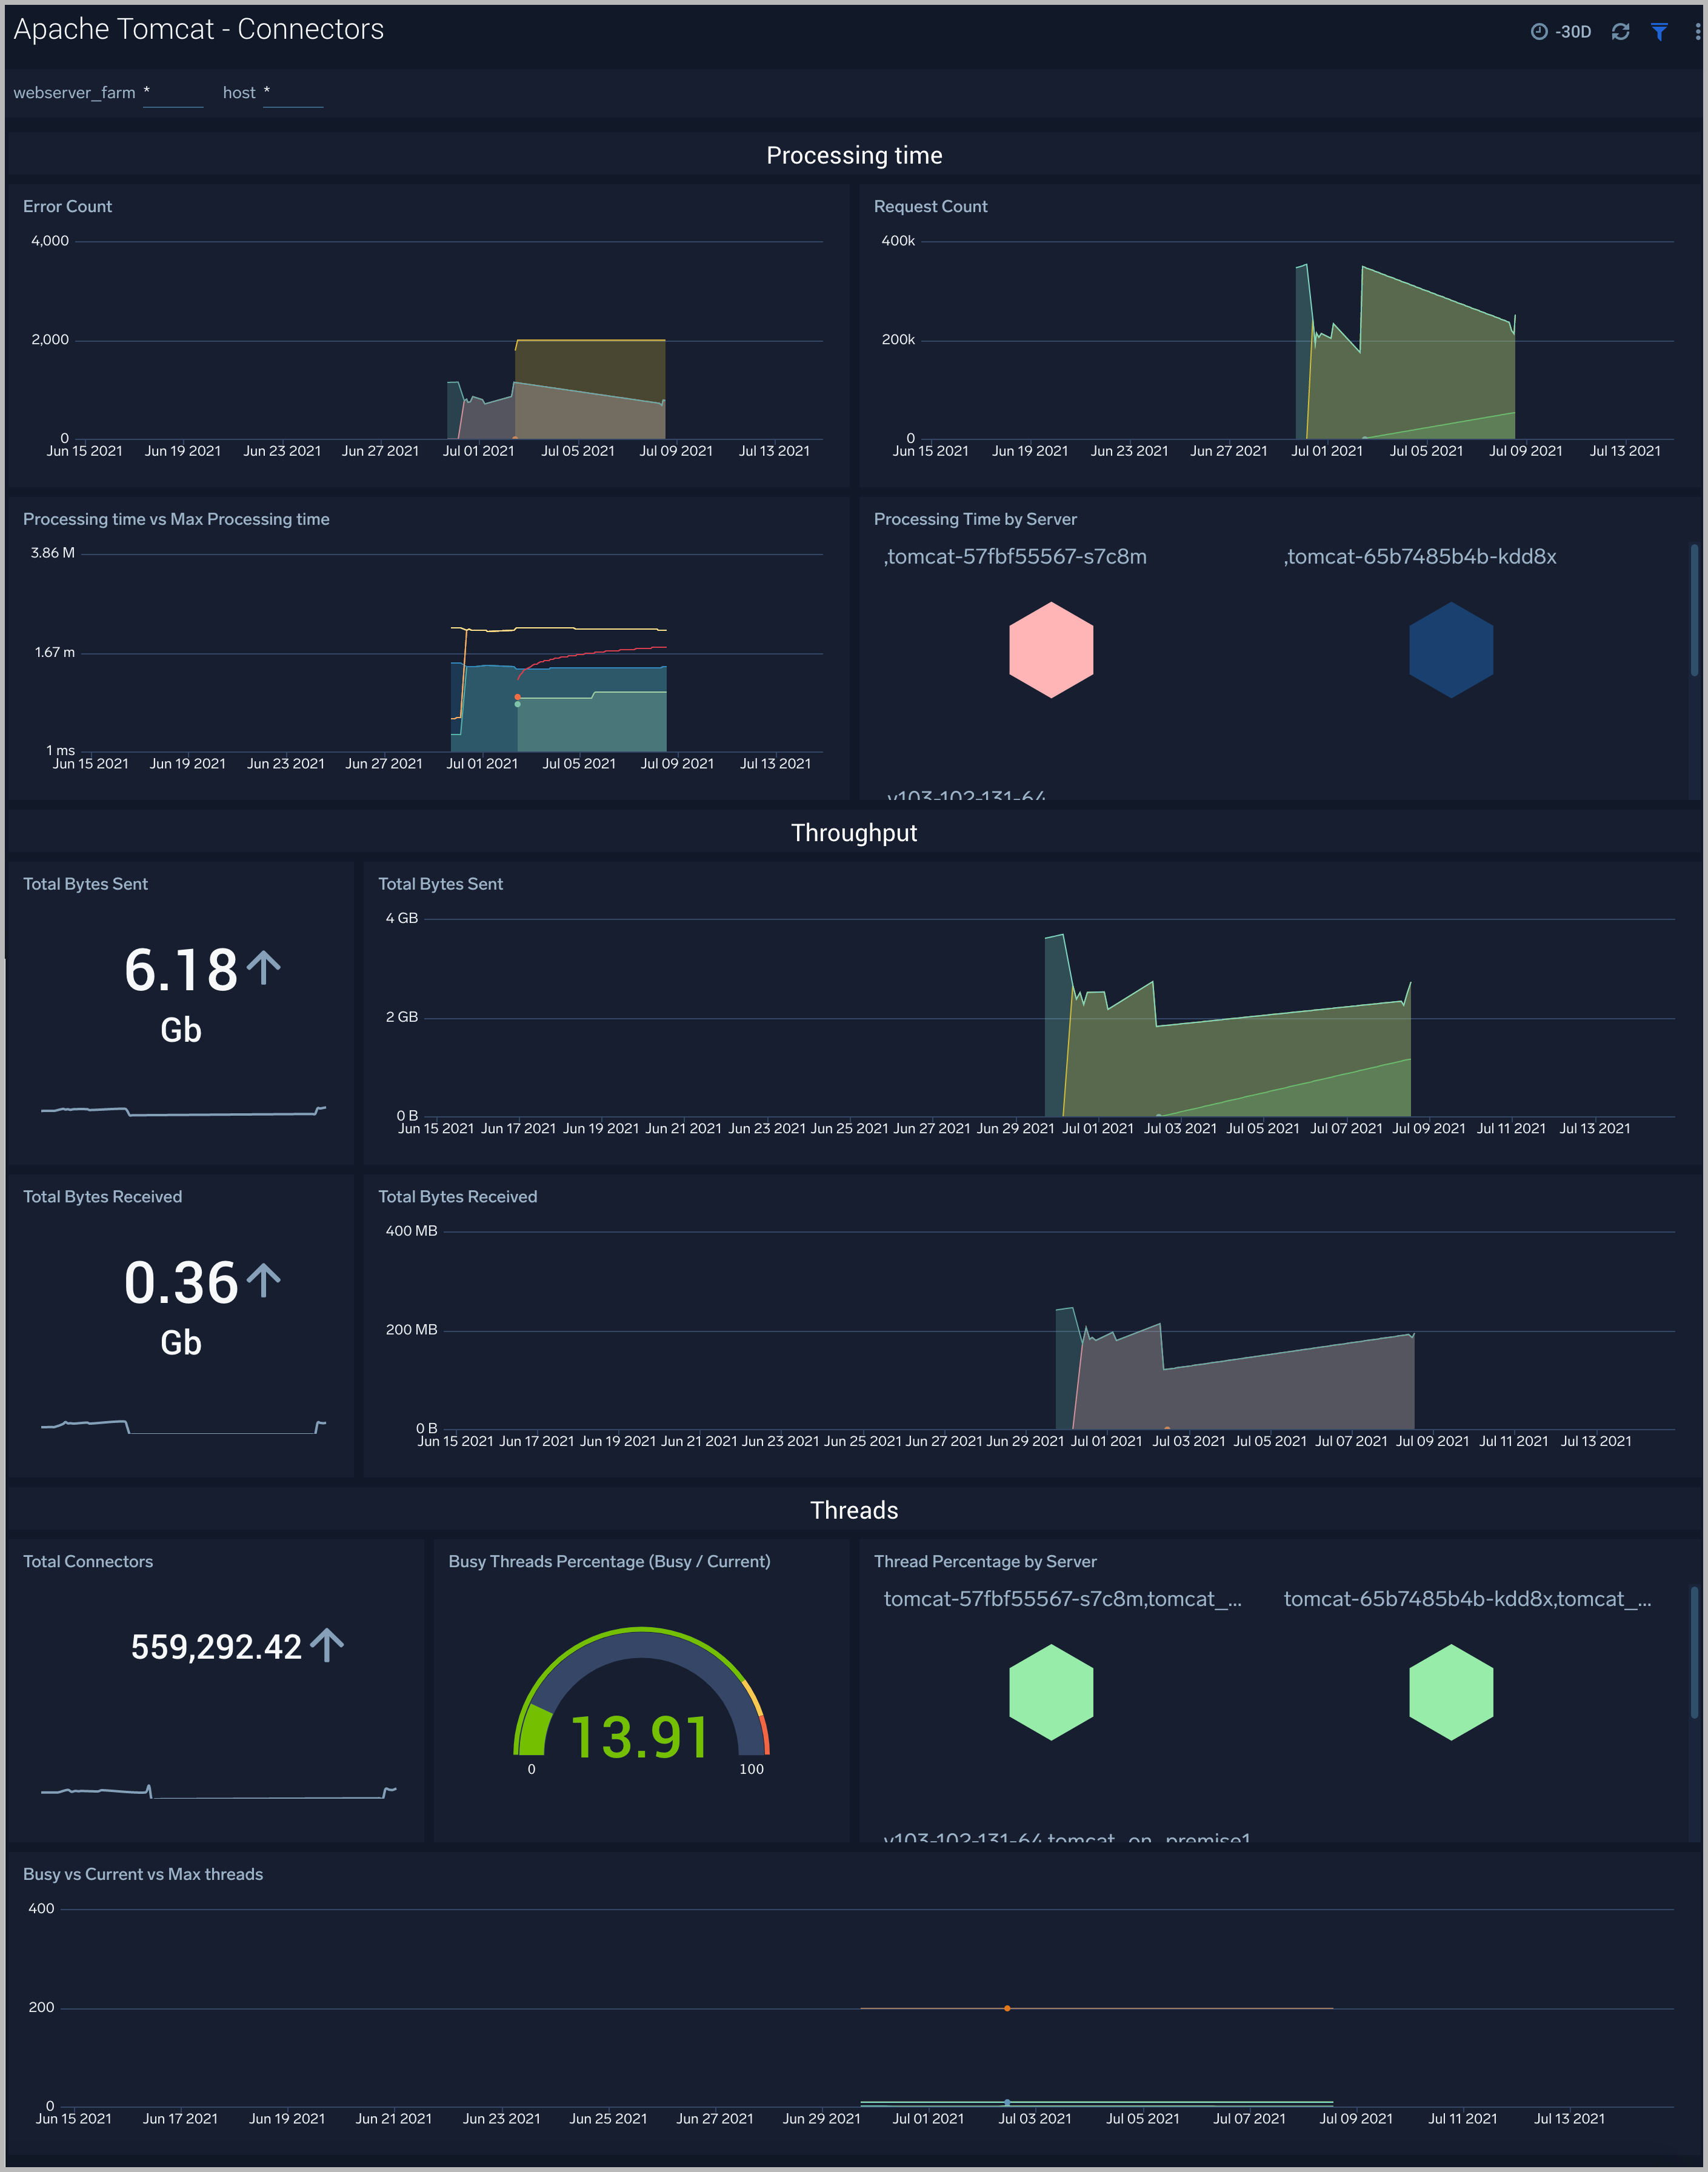
Connectors
The Apache Tomcat - Connector dashboard analyzes received requests, passes them to the correct web application, and sends back the results through the Connector as dynamically generated content.
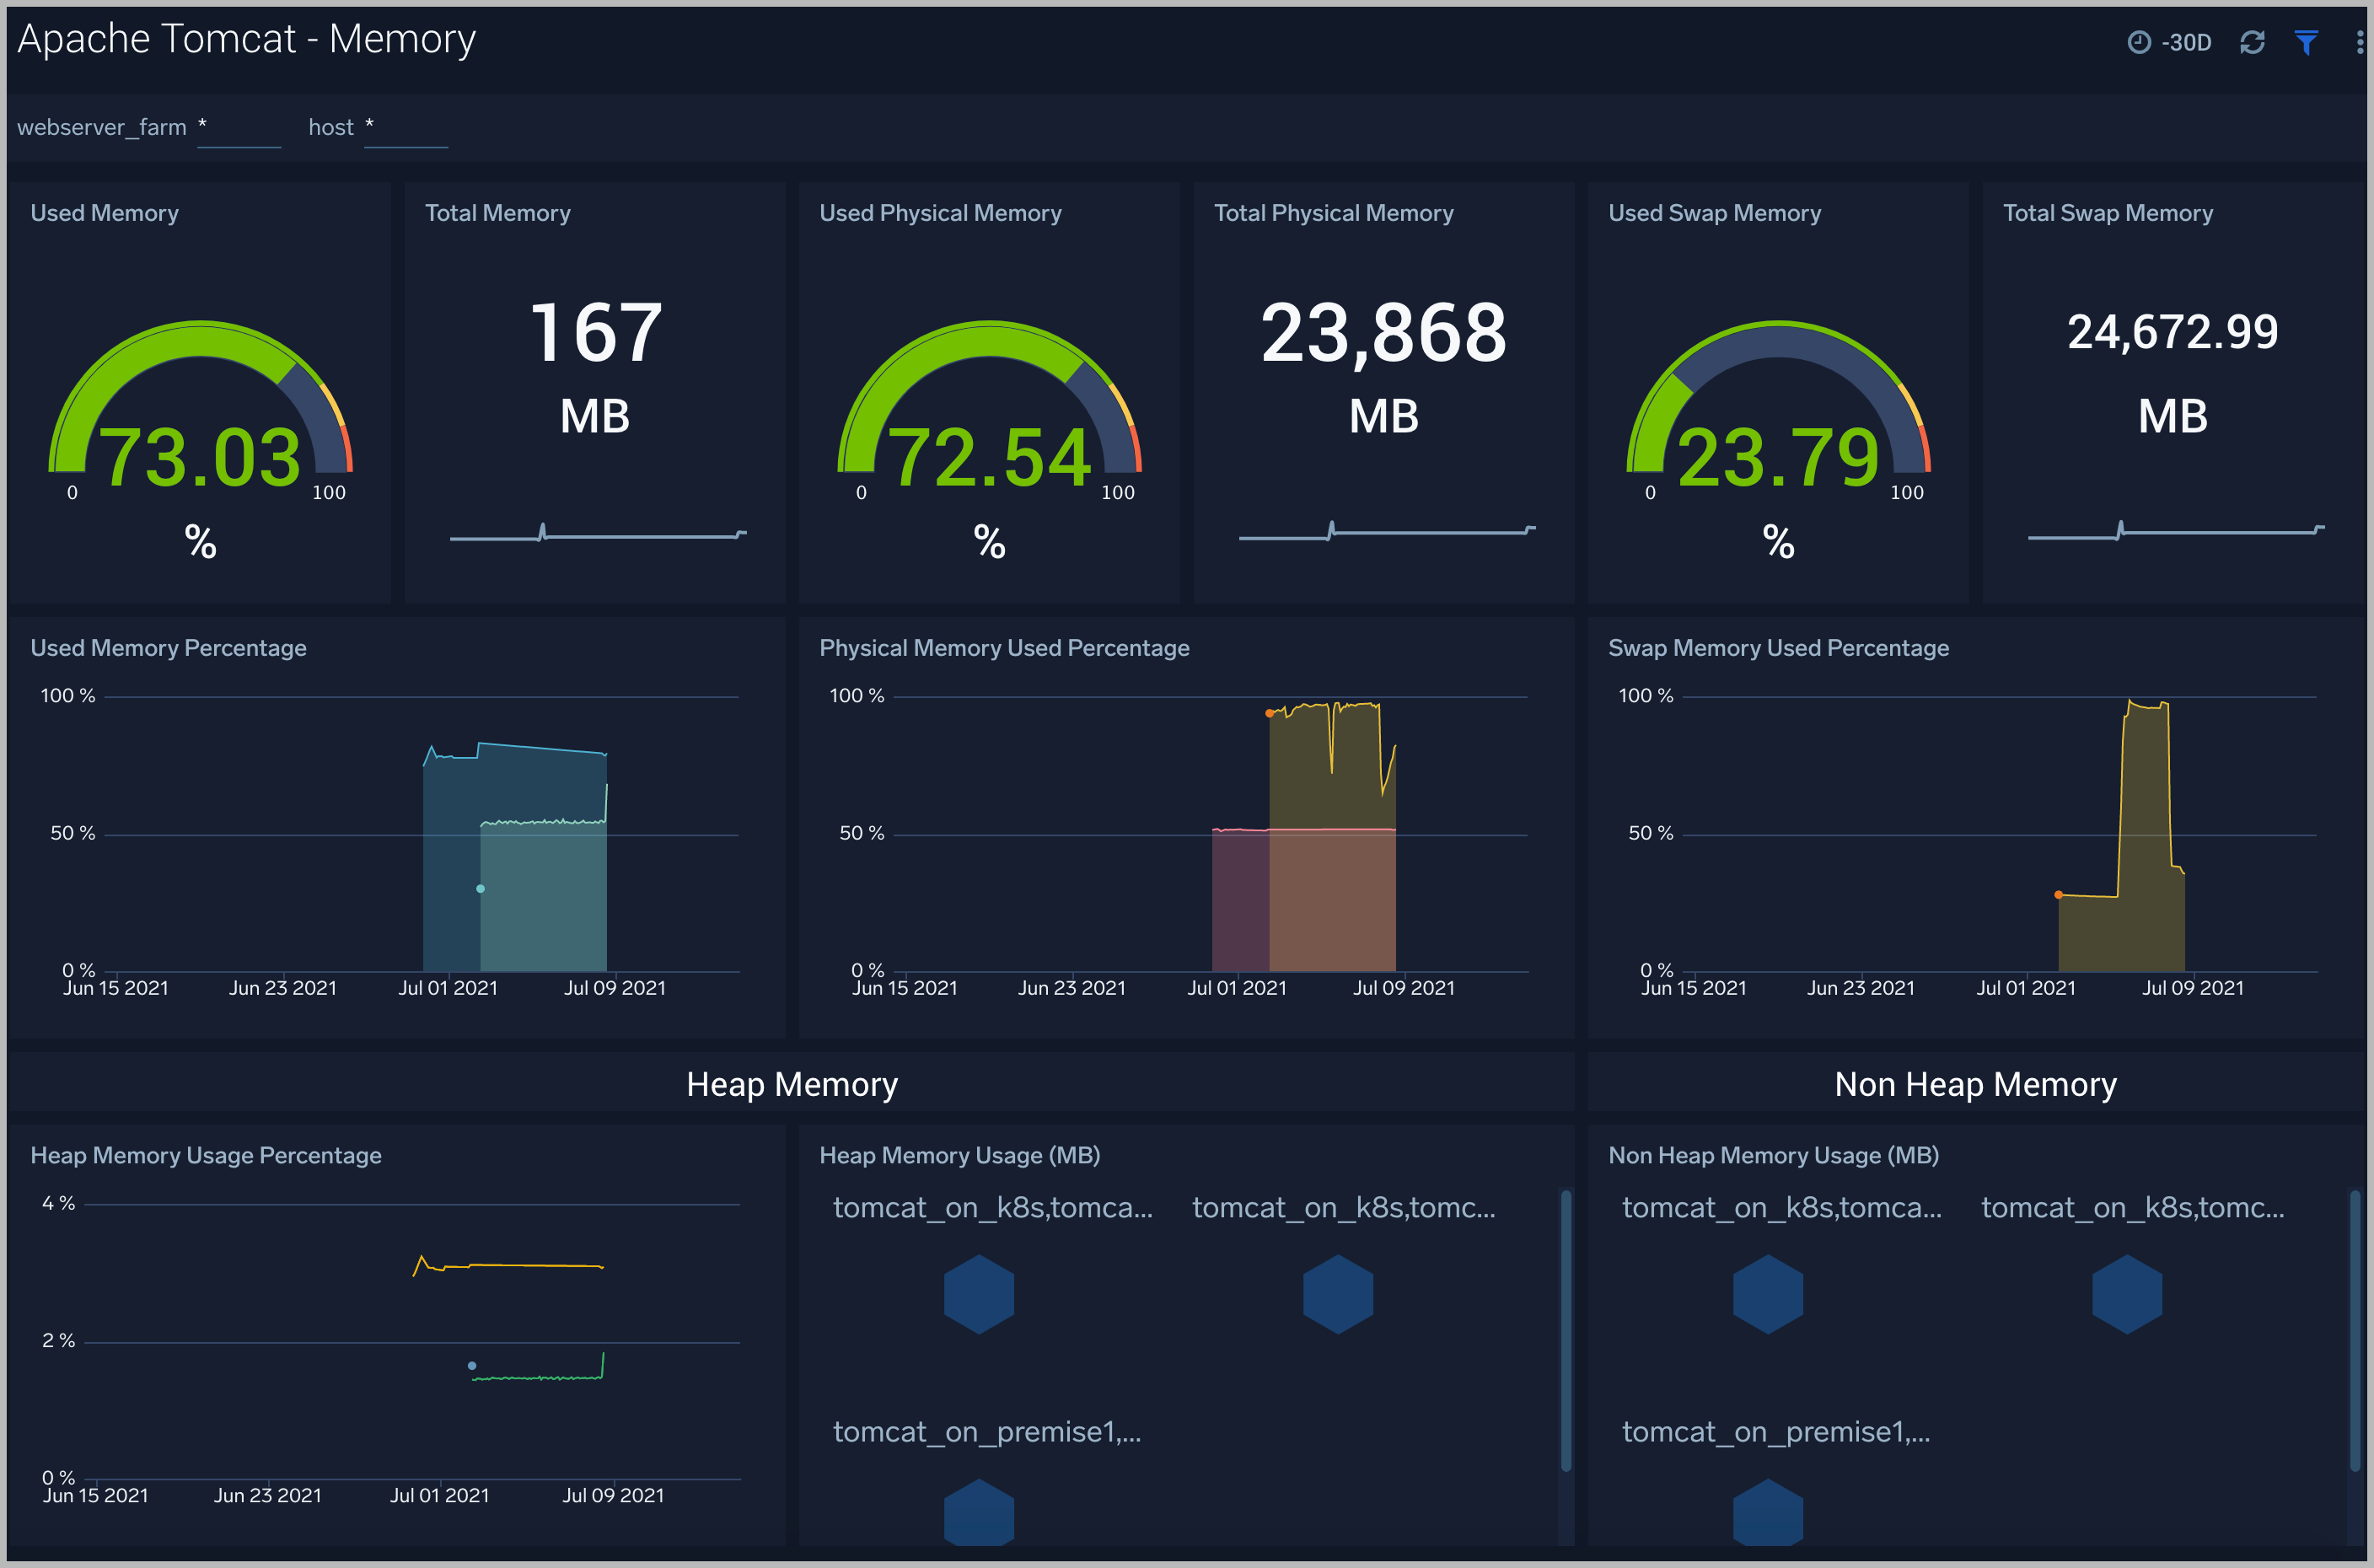
Memory
The Apache Tomcat - Memory dashboard provides a memory of your Apache Tomcat instance. Use this dashboard to understand the detailed Memory of your Apache Tomcat (s) deployed on your farm. This dashboard also provides login activities
Use this dashboard to:
- Analyze Heap memory.
- Analyze the percent memory used.
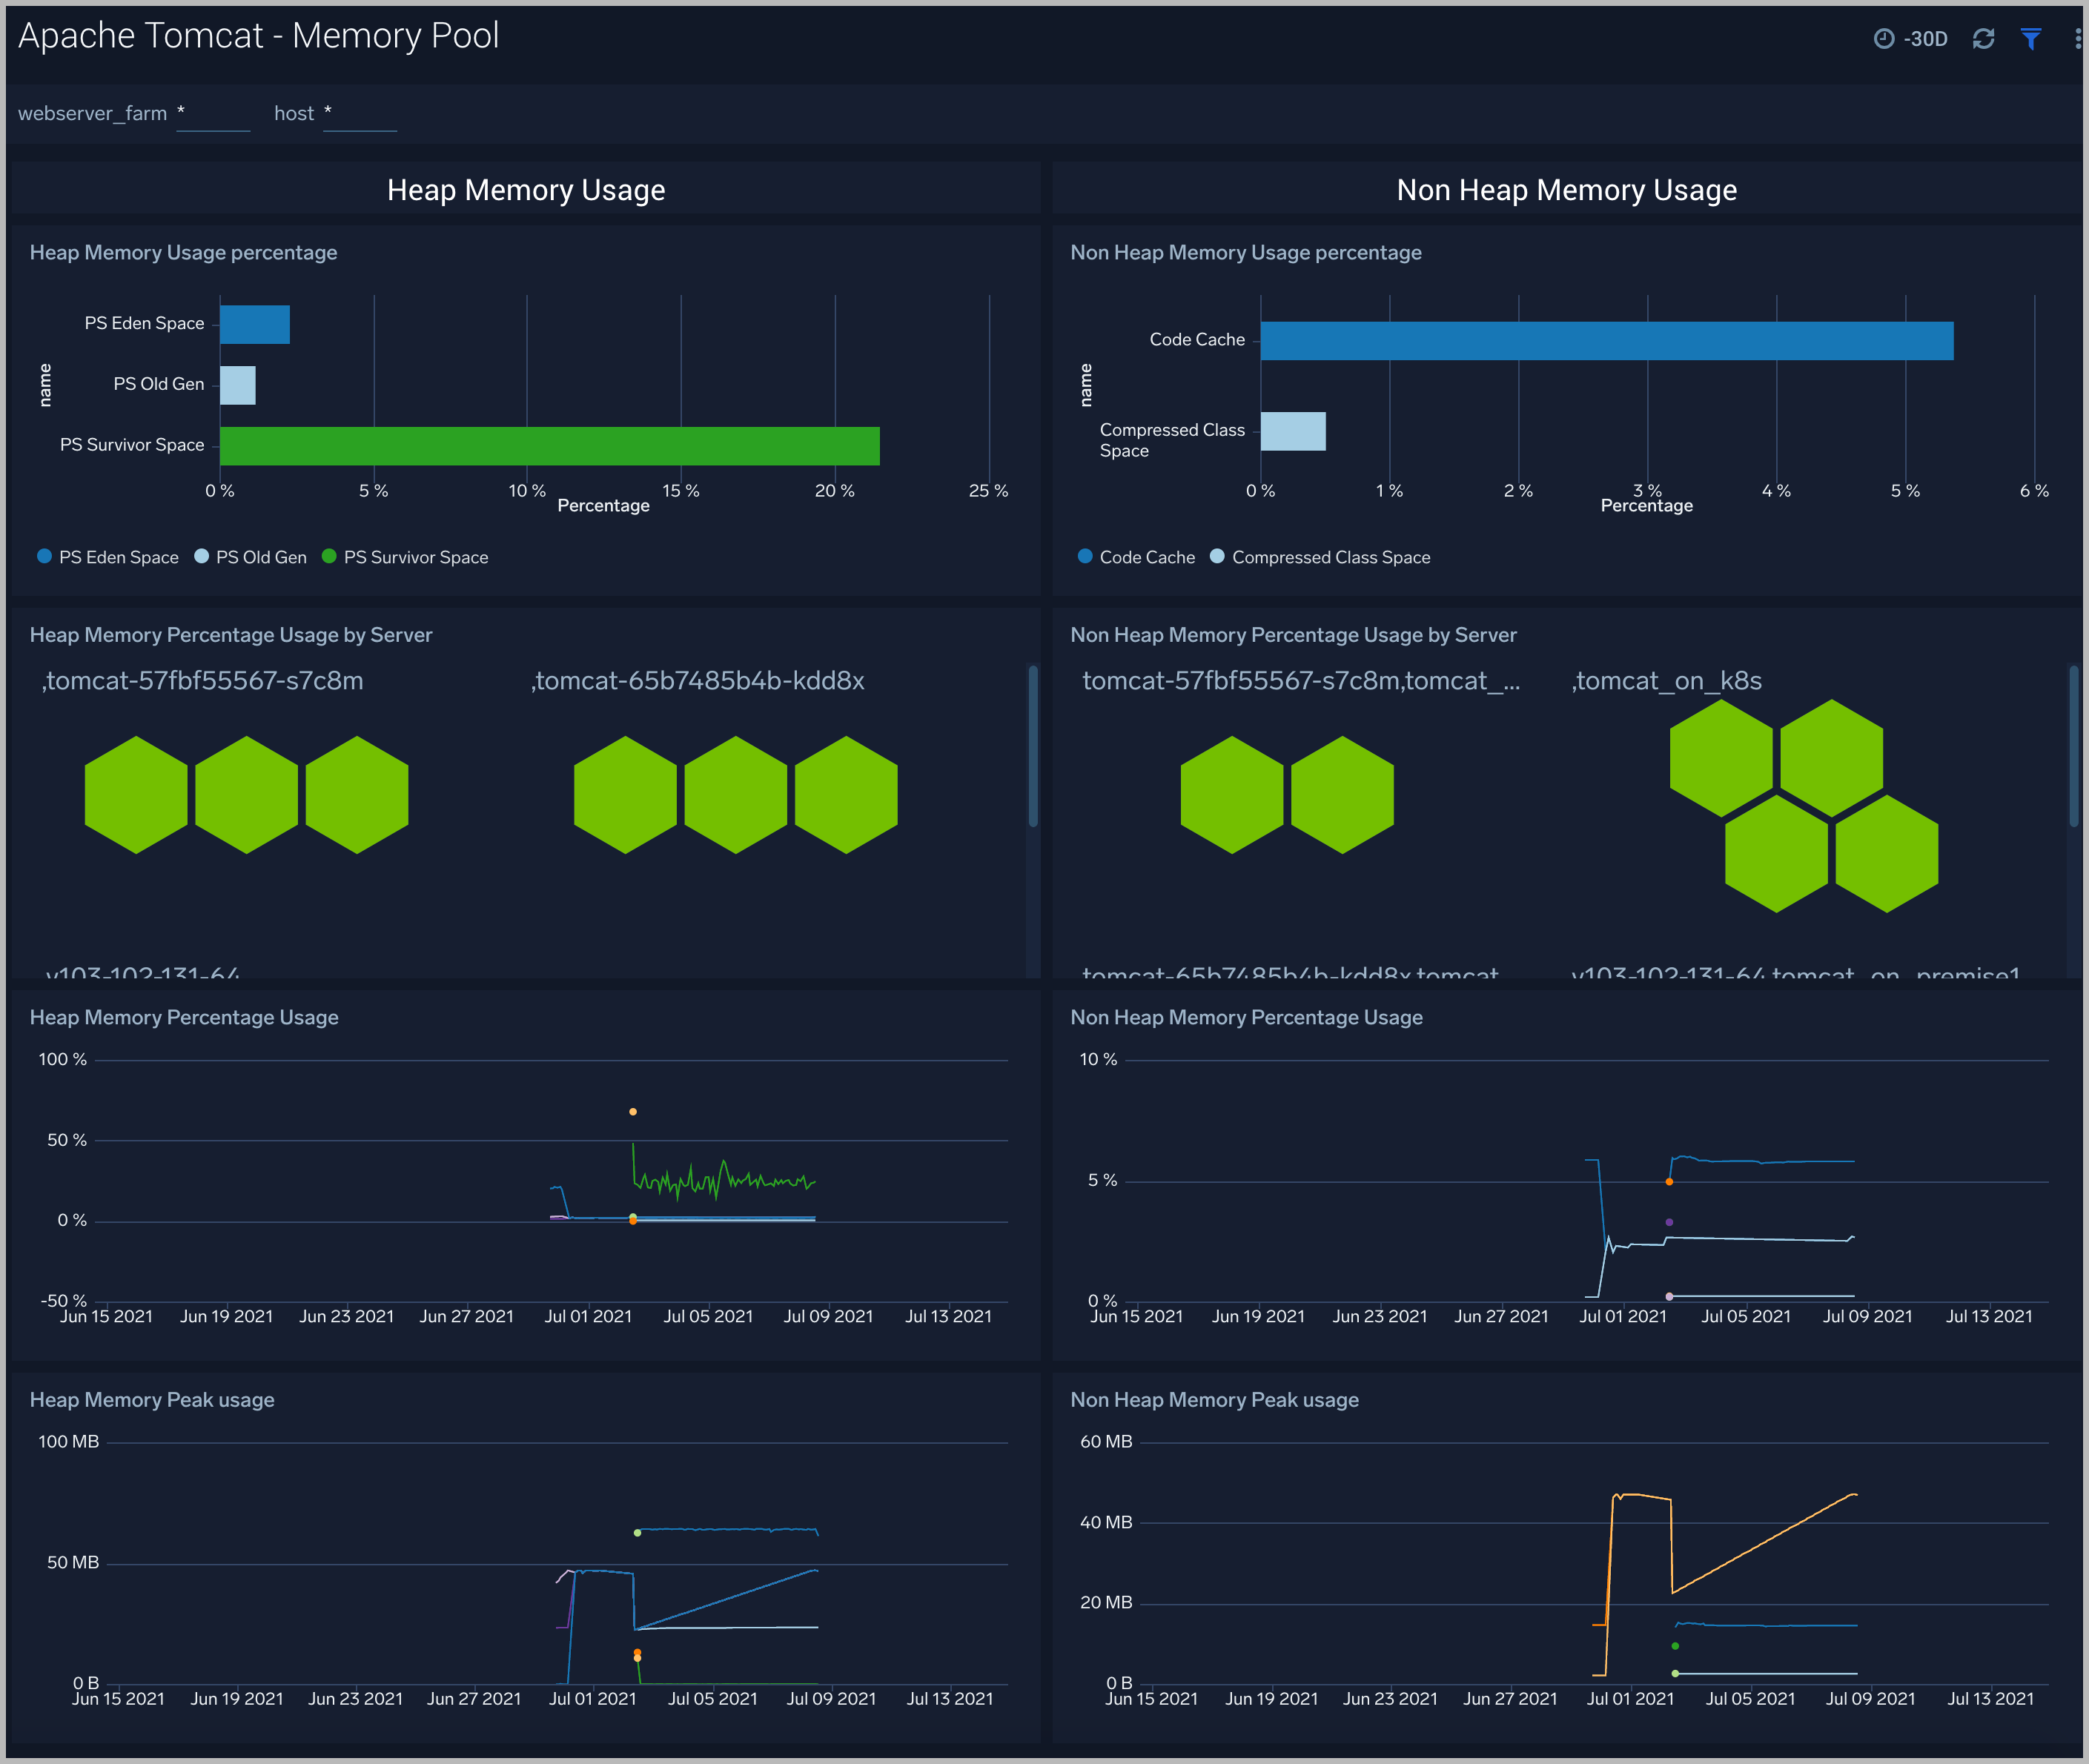
MemoryPool
The Apache Tomcat - MemoryPool dashboard provides a memory of your JMX Apache Tomcat instance. Use this dashboard to understand the detailed Heap Memory of your JMX Apache Tomcat (s) deployed in your farm.
To help determine if the Apache Tomcat server is available and performing well, the Sumo Logic monitors are provided with out-of-box alerts.
Create monitors for Apache Tomcat
From your App Catalog:
- From the Sumo Logic navigation, select App Catalog.
- In the Search Apps field, search for and then select your app.
- Make sure the app is installed.
- Navigate to What's Included tab and scroll down to the Monitors section.
- Click Create next to the pre-configured monitors. In the create monitors window, adjust the trigger conditions and notifications settings based on your requirements.
- Scroll down to Monitor Details.
- Under Location click on New Folder.
note
By default, monitor will be saved in the root folder. So to make the maintenance easier, create a new folder in the location of your choice.
- Enter Folder Name. Folder Description is optional.
tip
Using app version in the folder name will be helpful to determine the versioning for future updates.
- Click Create. Once the folder is created, click on Save.
Apache Tomcat Alerts
Here are the alerts available for Apache Tomcat (click to expand).
| Alert Name | Alert Description | Alert Condition | Recover Condition |
| Apache Tomcat - Access from Highly Malicious Sources | This alert fires when a Tomcat is accessed from highly malicious IP addresses. | > 0 | < = 0 |
| Apache Tomcat - High Client (HTTP 4xx) Error Rate | This alert fires when there are too many HTTP requests (>5%) with a response status of 4xx. | > 0 | 0 |
| Apache Tomcat - High Server (HTTP 5xx) Error Rate | This alert fires when there are too many HTTP requests (>5%) with a response status of 5xx. | > 0 | 0 |
| Apache Tomcat - High Memory Usage | This alert fires when the memory usage is more than 80 %. | > 80 % | < =80% |
| Apache Tomcat - Error | This alert fires when the error count is greater than 0. | > 0 | 0 |