IIS 10 - Classic Collector

The Internet Information Services (IIS) 10 app is a unified logs and metrics app that helps you monitor your IIS web servers' availability, performance, health, and resource utilization. Preconfigured dashboards and searches provide insight into application pools, ASP.NET applications, requests, latency, visitor locations, visitor access types, traffic patterns, errors, web server operations, and access from known malicious sources.
This app is tested with the following IIS versions:
- Internet Information Services (Version 10.0.17763.1)
- Internet Information Services (Version 8.5.9600.16384)
IIS app and integration are supported only on Windows.
Collecting logs and metrics for the IIS app
This section provides instructions for configuring log and metric collection for the Sumo Logic app for IIS.
Sumo Logic supports the collection of logs and metrics data from the IIS server in standalone environments. The process to set up collection is done through the following steps:
- Configure Log Collection
- Enable Logging on the IIS Server Side
- Log Types
- Set up Collector and Sources on the Sumo Logic side
- Set up local file source for IIS Access Logs
- Set up local file source for IIS Error Logs
- Set up Source for IIS Performance (Perfmon) Logs
- Configure Metrics Collection
- Configure HTTP Logs and Metrics Source
- Configure a Hosted Collector
- Install Telegraf
- Configure Telegraf (telegraf.conf), and start it
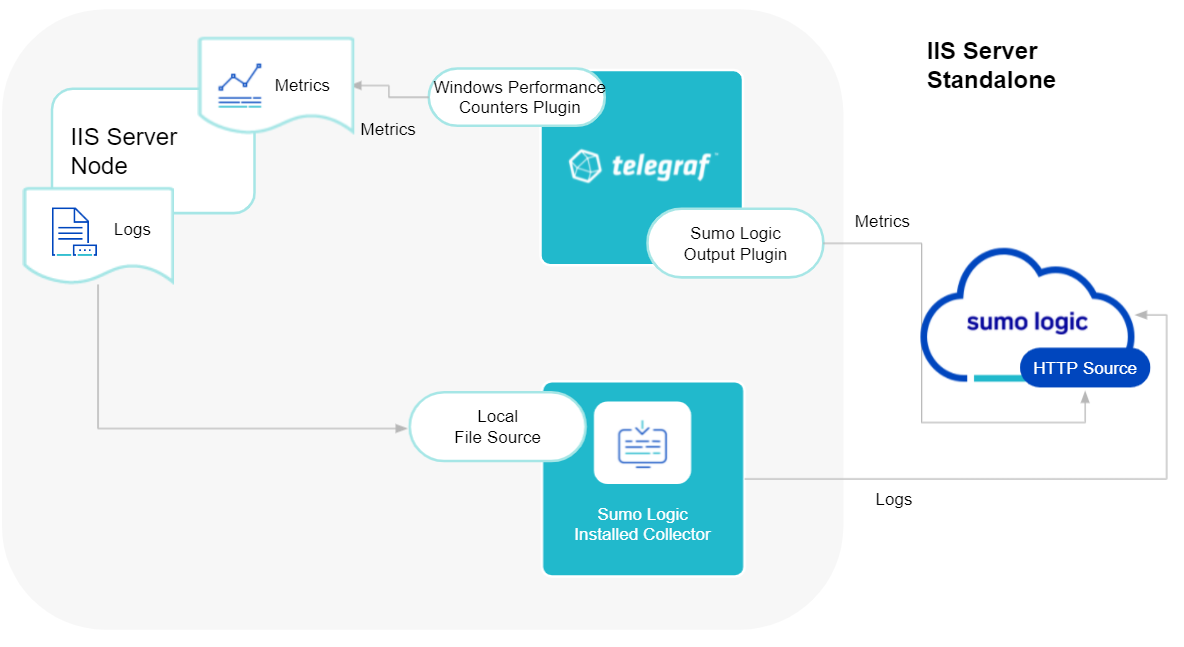
Sumo Logic uses the Telegraf operator for IIS metric collection and the Installed Collector for collecting IIS logs. The diagram below illustrates the components of the IIS collection in a standalone environment. Telegraf uses the Windows Performance Counters Input Plugin to obtain IIS metrics and the Sumo Logic output plugin to send the metrics to Sumo Logic. Logs from the IIS Server are collected by a Local File Source.
Configure log collection
This section provides instructions for configuring log collection for IIS running on a standalone environment for the Sumo Logic app for IIS.
-
Log Types. This section covers the following default log formats for IIS 10 and IIS 8.5:
- IIS Access Logs (W3C format)
- HTTP Error Logs
- Performance Logs
Default log formats are used by IIS app. IIS allows you to choose which fields to log in IIS access logs. To understand the various fields and their significance, see Microsoft | W3C Logging.
IIS Log files are generated as local files. For a standard Windows Server, the default log location is as follows:
%SystemDrive%\inetpub\logs\LogFiles
#Example c:\inetpub\logs\LogFiles\
Within the folder, you will find subfolders for each site configured with IIS. The logs are stored in folders that follow a naming pattern like W3SVC1, W3SVC2, W3SVC3, etc. The number at the end of the folder name corresponds to your site ID. For example, W3SVC2 is for site ID 2.
- IIS Access Logs (W3C default format). Sumo Logic expects logs in W3C format with the following fields. IIS allows you to choose fields to log in to IIS access logs. To learn more about the various fields and their significance, see Microsoft | W3C Logging.
#Fields: date time s-ip cs-method cs-uri-stem cs-uri-query s-port cs-username c-ip cs(User-Agent) cs(Referer) sc-status sc-substatus sc-win32-status time-taken - HTTP Error Logs. Sumo Logic expects Error logs in the following format. For information on how to configure HTTP Error Logs, and for explanations on the various HTTP Error Log fields and their significance, see Microsoft | Error logging in HTTP APIs.
#Fields: date time c-ip c-port s-ip s-port protocol_version verb cookedurl_query protocol_status siteId Reason_Phrase Queue_Name - Performance Logs. These logs are the output of Perfmon queries which will be configured at Installed Collector, "Windows Performance" Source.
Enable logging on your IIS server
If logging is not already enabled on your IIS Server, perform the following steps to enable it:
- Open IIS Manager.
- Select the site or server in the Connections pane, then double-click Logging. Enhanced logging is only available for site-level logging. If you select the server in the Connections pane, then the Custom Fields section of the W3C Logging Fields dialog is disabled.
- In the Format field under Log File, select W3C and then click Select Fields. IIS app works on default fields selection.
- Select the following fields, if not already selected. Sumo Logic expects these fields in IIS logs for the IIS app to work by default:
date time s-ip cs-method cs-uri-stem cs-uri-query s-port cs-username c-ip cs(User-Agent) cs(Referer) sc-status sc-substatus sc-win32-status time-taken
For more information about IIS log format and log configuration, see Microsoft | Enhanced Logging for IIS 8.5.
Verify that log files are created
Perform the following tasks to ensure that log files are being created:
- Open a command-line window and change directories to
C:\inetpub\Logs\LogFiles. This is the same path you will enter when you configure the Source to collect these files. - Under the \W3SVC1 directory, you should see one or more files with a .log extension. If the file is present, you can collect it.
Enable HTTP error logs on your Windows server
Perform the following task to enable HTTP Error Logs on your Windows Server that is hosting the IIS Server:
- Configure HTTP Error Logging by following the Microsoft | Configuring HTTP Server API Error Logging documentation.
- Format your HTTP Error Logs by following the Microsoft | Format of the HTTP Server API Error Logs documentation. HTTP Error Log files are generated as local files. The default HTTP Error log file location is:
C:\Windows\System32\LogFiles\HTTPERR
Configure an installed collector
If you have not already done so, install and configure an installed collector for Windows by following the Install a Collector on Windows documentation.
Configure source for IIS Access logs
This section demonstrates how to configure a Local File Source for IIS Access Logs, for use with an Installed Collector. You may configure a Remote File Source, but the configuration is more complex. Sumo Logic recommends using a Local File Source whenever possible. To configure a local file source for IIS Access Logs, do the following:
- Configure a Local File Source.
- Specify the Local File Source Fields as follows:
- Name. Required (for example, "IIS Access Logs")
- Description. (Optional)
- File Path (Required).
C:\inetpub\Logs\LogFiles\W3SVC*\*.log - Collection start time. Choose how far back you would like to begin collecting historical logs. For example, choose 7 days ago to begin collecting logs with the last modified date within the last seven days.
- Source Host. Sumo Logic uses the hostname assigned by the operating system by default, but you can enter a different hostname.
- Source Category (Required). For example, Webserver/IIS/Access.
- Fields. Set the following fields:
component = webserverwebserver_system = iiswebserver_farm = <Your_IISserver_farm_Name>. (Enter Default if you do not have one.)environment = <Your_Environment_Name>(For example, Dev, QA, or Prod.)
- Configure the Advanced section:
- Timestamp Parsing Settings. Make sure the setting matches the timezone on the log files.
- Enable Timestamp Parsing. Select Extract timestamp information from log file entries.
- Time Zone. Select the option to Use time zone from the log file. If none is present use: and set the timezone to UTC.
- Timestamp Format. Select the option to Automatically detect the format.
- Encoding. UTF-8 is the default, but you can choose another encoding format from the menu if your IIS logs are encoded differently.
- Enable Multiline Processing. Uncheck the box to Detect messages spanning multiple lines. Since IIS Access logs are single-line log files, disabling this option will ensure that your messages are collected correctly.
- Click Save.
After a few minutes, your new Source should be propagated down to the Collector and will begin submitting your IIS Access log files to the Sumo Logic service.
Configure source for HTTP error logs
This section demonstrates how to configure a Local File Source for HTTP Error Logs, for use with an Installed Collector. To configure a local file source for HTTP Error Logs, do the following:
- Configure a Local File Source.
- Specify the Local File Source Fields as follows:
- Name. Required (for example, "HTTP Error Logs")
- Description. (Optional)
- File Path (Required).
C:\Windows\System32\LogFiles\HTTPERR\*.* - Collection start time. Choose how far back you would like to begin collecting historical logs. For example, choose 7 days ago to begin collecting logs with the last modified date within the last seven days.
- Source Host. Sumo Logic uses the hostname assigned by the operating system by default, but you can enter a different hostname.
- Source Category (Required). For example, Webserver/IIS/Error.
- Fields. Set the following fields:
component = webserverwebserver_system = iiswebserver_farm = <Your_IISserver_farm_Name>. (Enter Default if you do not have one.)environment = <Your_Environment_Name>(For example, Dev, QA, or Prod)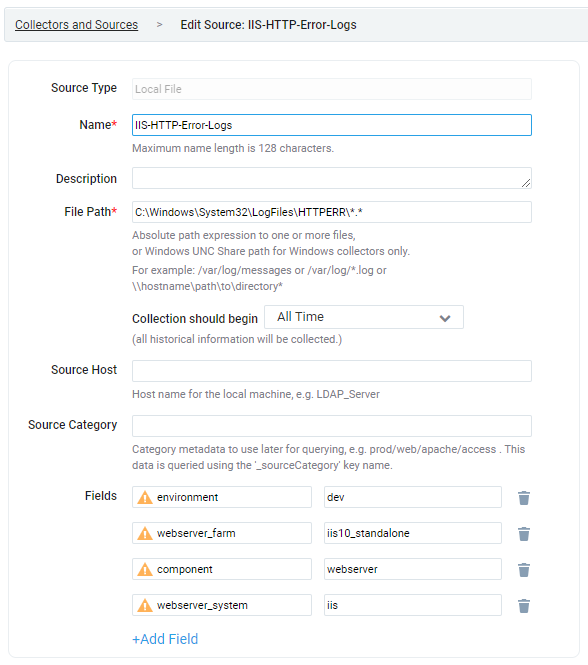
- Configure the Advanced section settings:
- Timestamp Parsing Settings. Make sure the setting matches the timezone on the log files.
- Enable Timestamp Parsing. Select Extract timestamp information from log file entries.
- Time Zone. Select the option to Use time zone from the log file. If none is present use: and set the timezone to UTC.
- Timestamp Format. Select the option to Automatically detect the format.
- Encoding. UTF-8 is the default, but you can choose another encoding format from the menu if your IIS logs are encoded differently.
- Enable Multiline Processing. Uncheck the box to Detect messages spanning multiple lines. Since IIS Error logs are single-line log files, disabling this option will ensure that your messages are collected correctly.
- Click Save.
After a few minutes, your new Source should be propagated down to the Collector and will begin submitting your IIS HTTP Error log files to the Sumo Logic service.
Configure source for IIS Performance (Perfmon) logs
This section demonstrates how to configure a Windows Performance Source, for use with an Installed Collector. Use the appropriate source for your environment:
- Local Windows Performance Monitor Log Source (recommended)
- Remote Windows Performance Monitor Log Source
To configure a Source for IIS Performance Logs, do the following:
- Configure a Local Windows Performance Monitor Log Source.
- Configure the Local Windows Performance Source Fields as follows:
- Name. Required (for example, "IIS Performance")
- Source Category (Required). For example, Webserver/IIS/PerfCounter.
- Frequency. Every Minute (you may custom choose the frequency)
- Description. (Optional)
- Fields. Set the following fields:
component = webserverwebserver_system = iiswebserver_farm = <Your_IISserver_farm_Name>. (Enter Default if you do not have one.)environment = <Your_Environment_Name>(for example, Dev, QA, or Prod)
- Under Perfmon Queries, click Add Query.
- Add the following two queries:
- Query 1:
- For Name, enter WebServices.
- For Query, enter Select TotalMethodRequestsPerSec, GetRequestsPerSec, PostRequestsPerSec, CurrentConnections, CurrentAnonymousUsers, CurrentNonAnonymousUsers, CGIRequestsPerSec, ISAPIExtensionRequestsPerSec, BytesReceivedPerSec, BytesSentPerSec, FilesReceivedPerSec, FilesSentPerSec, ServiceUptime, BytesTotalPerSec from Win32_PerfFormattedData_W3SVC_WebService.
- Query 2:
- For Name, enter HTTPServiceRequestQueues.
- For Query, enter Select ArrivalRate, CurrentQueueSize, CacheHitRate, RejectionRate, MaxQueueItemAge from Win32_PerfFormattedData_Counters_HTTPServiceRequestQueues.
- Query 1:
- Click Save.
Configure metrics collection
Set up a Sumo Logic HTTP source
- Configure a Hosted Collector for Metrics. To create a new Sumo Logic hosted collector, perform the steps in the Create a Hosted Collector documentation.
- Configure an HTTP Logs & Metrics source:
- On the created Hosted Collector on the Collection Management screen, select Add Source.
- Select HTTP Logs & Metrics.
- Name. (Required). Enter a name for the source.
- Description. (Optional).
- Source Category (Required). For example,
Prod/Webserver/IIS/Metrics.
- Select Save.
- Take note of the URL provided once you click Save. You can retrieve it again by selecting the Show URL next to the source on the Collection Management screen.
Set up Telegraf
- Install Telegraf if you haven’t already. Use the following steps to install Telegraf.
- Configure and start Telegraf. As part of collecting metrics data from Telegraf, we will use the Windows Performance Counters Input Plugin to get data from Telegraf and the Sumo Logic output plugin to send data to Sumo Logic.
Copy and paste this telegraf.conf file and modify it for your environment (click to expand).
[[inputs.win_perf_counters]]
  [[inputs.win_perf_counters.object]]
    # HTTP Service request queues in the Kernel before being handed over to User Mode.
    ObjectName = "HTTP Service Request Queues"
    Instances = ["*"]
    Counters = [
      "CurrentQueueSize",
      "RejectedRequests"
    ]
    Measurement = "win_http_queues"
  [[inputs.win_perf_counters.object]]
    # IIS, ASP.NET Applications
    ObjectName = "ASP.NET Applications"
    Counters = [
      "Cache Total Entries",
      "Cache Total Hit Ratio",
      "Cache Total Turnover Rate",
      "Output Cache Entries",
      "Output Cache Hits",
      "Output Cache Hit Ratio",
      "Output Cache Turnover Rate",
      "Compilations Total",
      "Errors Total/Sec",
      "Pipeline Instance Count",
      "Requests Executing",
      "Requests in Application Queue",
      "Requests/Sec"
    ]
    Instances = ["*"]
    Measurement = "win_aspnet_app"
  [[inputs.win_perf_counters.object]]
    # IIS, ASP.NET
    ObjectName = "ASP.NET"
    Counters = [
      "Application Restarts",
      "Applications Running",
      "Request Execution Time",
      "Request Wait Time",
      "Requests Current",
      "Requests Queued",
      "Requests Rejected",
      "State Server Sessions Abandoned",
      "State Server Sessions Active",
      "State Server Sessions Timed Out",
      "State Server Sessions Total",
      "Worker Process Restarts",
      "Worker Processes Running"
    ]
    Instances = ["*"]
    Measurement = "win_aspnet"
  [[inputs.win_perf_counters.object]]
    # IIS, Web Service
    ObjectName = "Web Service"
    Counters = [
      "Service Uptime",
      "Current Connections",
      "Bytes Sent/sec",
      "Total Bytes Sent",
      "Bytes Received/sec",
      "Total Bytes Received",
      "Bytes Total/sec",
      "Total Bytes Transferred",
      "Get Requests/sec",
      "Total Get Requests",
      "Post Requests/sec",
      "Total Post Requests",
      "Put Requests/sec",
      "Total Put Requests",
      "Delete Requests/sec",
      "Total Delete Requests",
      "Head Requests/sec",
      "Options Requests/sec",
      "Total Head Requests",
      "Total Method Requests",
      "Total Options Requests",
      "Anonymous Users/sec",
      "NonAnonymous Users/sec",
      "Files Sent/sec",
      "Total Files Sent",
      "Files Received/sec",
      "Total Files Received",
      "Files/sec",
      "Total Files Transferred",
      "Not Found Errors/sec",
      "Locked Errors/sec",
      "Total Method Requests/sec",
      "Total Allowed Async I/O Requests",
      "Total Blocked Async I/O Requests",
      "Current Blocked Async I/O Requests",
      "Current CGI Requests",
      "Current ISAPI Extension Requests",
      "Current NonAnonymous Users",
      "Total CGI Requests",
      "Total Connection Attempts (all instances)",
      "Total ISAPI Extension Requests",
      "Total Locked Errors",
      "Total Logon Attempts",
      "Total NonAnonymous Users",
      "Total Not Found Errors",
      "Total Rejected Async I/O Requests",
      "Total count of failed CAL requests for authenticated users",
      "Total count of failed CAL requests for SSL connections"
    ]
    Instances = ["*"]
    Measurement = "win_websvc"
  [[inputs.win_perf_counters.object]]
    # Web Service Cache / IIS
    ObjectName = "Web Service Cache"
    Counters = [
      "Current Files Cached",
      "Active Flushed Entries",
      "Total Files Cached",
      "Total Flushed Files",
      "File Cache Hits",
      "File Cache Misses",
      "File Cache Hits %",
      "File Cache Flushes",
      "Current File Cache Memory Usage",
      "Maximum File Cache Memory Usage",
      "Current URIs Cached",
      "Total URIs Cached",
      "Total Flushed URIs",
      "URI Cache Hits",
      "URI Cache Misses",
      "URI Cache Hits %",
      "URI Cache Flushes",
      "Current Metadata Cached",
      "Total Metadata Cached",
      "Total Flushed Metadata",
      "Metadata Cache Hits",
      "Metadata Cache Misses",
      "Metadata Cache Hits %",
      "Metadata Cache Flushes",
      "Output Cache Current Flushed Items",
      "Output Cache Current Hits %",
      "Output Cache Current Items",
      "Output Cache Current Memory Usage",
      "Output Cache Total Flushed Items"
    ]
    Instances = ["*"]
    Measurement = "win_websvc_cache"
  [[inputs.win_perf_counters.object]]
    # APP POOL WAS
    ObjectName = "APP_POOL_WAS"
    Counters = [
      "Current Application Pool State",
      "Current Application Pool Uptime",
      "Current Worker Processes",
      "Maximum Worker Processes",
      "Recent Worker Process Failures",
      "Time Since Last Worker Process Failure",
      "Total Application Pool Recycles",
      "Total Application Pool Uptime",
      "Total Worker Process Failures",
      "Total Worker Process Ping Failures",
      "Total Worker Process Shutdown Failures",
      "Total Worker Process Startup Failures",
      "Total Worker Processes Created"
    ]
    Instances = ["*"]
    Measurement = "win_app_pool_was"
  [inputs.win_perf_counters.tags]
    environment="env_TO_BE_CHANGED"
    component="webserver"
    webserver_system="iis"
    webserver_farm="iisserver_TO_BE_CHANGED"

[[outputs.sumologic]]
  url = "<URL_from_HTTP_Logs_and_Metrics_Source>"
  data_format = "prometheus"
- Enter values for fields annotated with
<VALUE_TO_BE_CHANGED>to the appropriate values. Do not include the brackets (< >) in your final configuration. - If you haven’t defined a farm in IIS Server, enter ‘default’ for
webserver_farm. - In the Input plugins section, which is
[[inputs.win_perf_counters]]: Configure the Windows Performance Counters Input Plugin for Telegraf see this doc. - In the tags section, which is
[inputs.win_perf_counters.tags]:environment. This is the deployment environment where the IIS Server farm identified by the value of servers resides. For example; dev or QA. While this value is optional we highly recommend setting it.webserver_farm. Enter a name to identify this IIS Server farm This farm name will be shown in our dashboards. Use “default” if none is present.
- In the output plugins section, which is
[[outputs.sumologic]]:URL. This is the HTTP source URL created previously. See this doc for more information on additional parameters for configuring the Sumo Logic Telegraf output plugin.
- If you haven’t defined a farm in the IIS Server, enter ‘default’ for
webserver_farm. - There are additional values set by the Telegraf configuration. We strongly advise against changing these values as it might cause the Sumo Logic app to not function correctly.
data_format: “prometheus”. In the output[[outputs.sumologic]]plugins section. Metrics are sent in the Prometheus format to Sumo Logic.component - “webserver”. In the input[[inputs.win_perf_counters]]plugins section. This value is used by Sumo Logic apps to identify application components.webserver_system - “iis”. In the input plugins sections. This value identifies the webserver system.
- See this doc for all other parameters that you can configure in the Telegraf agent globally.
- After you have finalized your
telegraf.conffile, you can start or reload the telegraf service using instructions from this doc.
At this point, Telegraf should start collecting the IIS Server metrics and forward them to the Sumo Logic HTTP Source.
Installing the IIS app
To install the app, do the following:
Next-Gen App: To install or update the app, you must be an account administrator or a user with Manage Apps, Manage Monitors, Manage Fields, Manage Metric Rules, and Manage Collectors capabilities depending upon the different content types part of the app.
- Select App Catalog.
- In the 🔎 Search Apps field, run a search for your desired app, then select it.
- Click Install App.
note
Sometimes this button says Add Integration.
- Click Next in the Setup Data section.
- In the Configure section of your respective app, complete the following fields.
- Field Name. If you already have collectors and sources set up, select the configured metadata field name (eg _sourcecategory) or specify other custom metadata (eg: _collector) along with its metadata Field Value.
- Is K8S deployment involved. Specify if resources being monitored are partially or fully deployed on Kubernetes (K8s)
- Click Next. You will be redirected to the Preview & Done section.
Post-installation
Once your app is installed, it will appear in your Installed Apps folder, and dashboard panels will start to fill automatically.
Each panel slowly fills with data matching the time range query received since the panel was created. Results will not immediately be available but will be updated with full graphs and charts over time.
The following fields will be created automatically as a part of the app installation process:
componentenvironmentwebserver_systemwebserver_farmpod
Viewing IIS dashboards
All dashboards have a set of filters that you can apply to the entire dashboard. Use these filters to drill down and examine the data to a granular level.
- You can change the time range for a dashboard or panel by selecting a predefined interval from a drop-down list, choosing a recently used time range, or specifying custom dates and times. Learn more.
- You can use template variables to drill down and examine the data on a granular level. For more information, see Filtering Dashboards with Template Variables.
- Most Next-Gen apps allow you to provide the scope at the installation time and are comprised of a key (
_sourceCategoryby default) and a default value for this key. Based on your input, the app dashboards will be parameterized with a dashboard variable, allowing you to change the dataset queried by all panels. This eliminates the need to create multiple copies of the same dashboard with different queries.
Overview
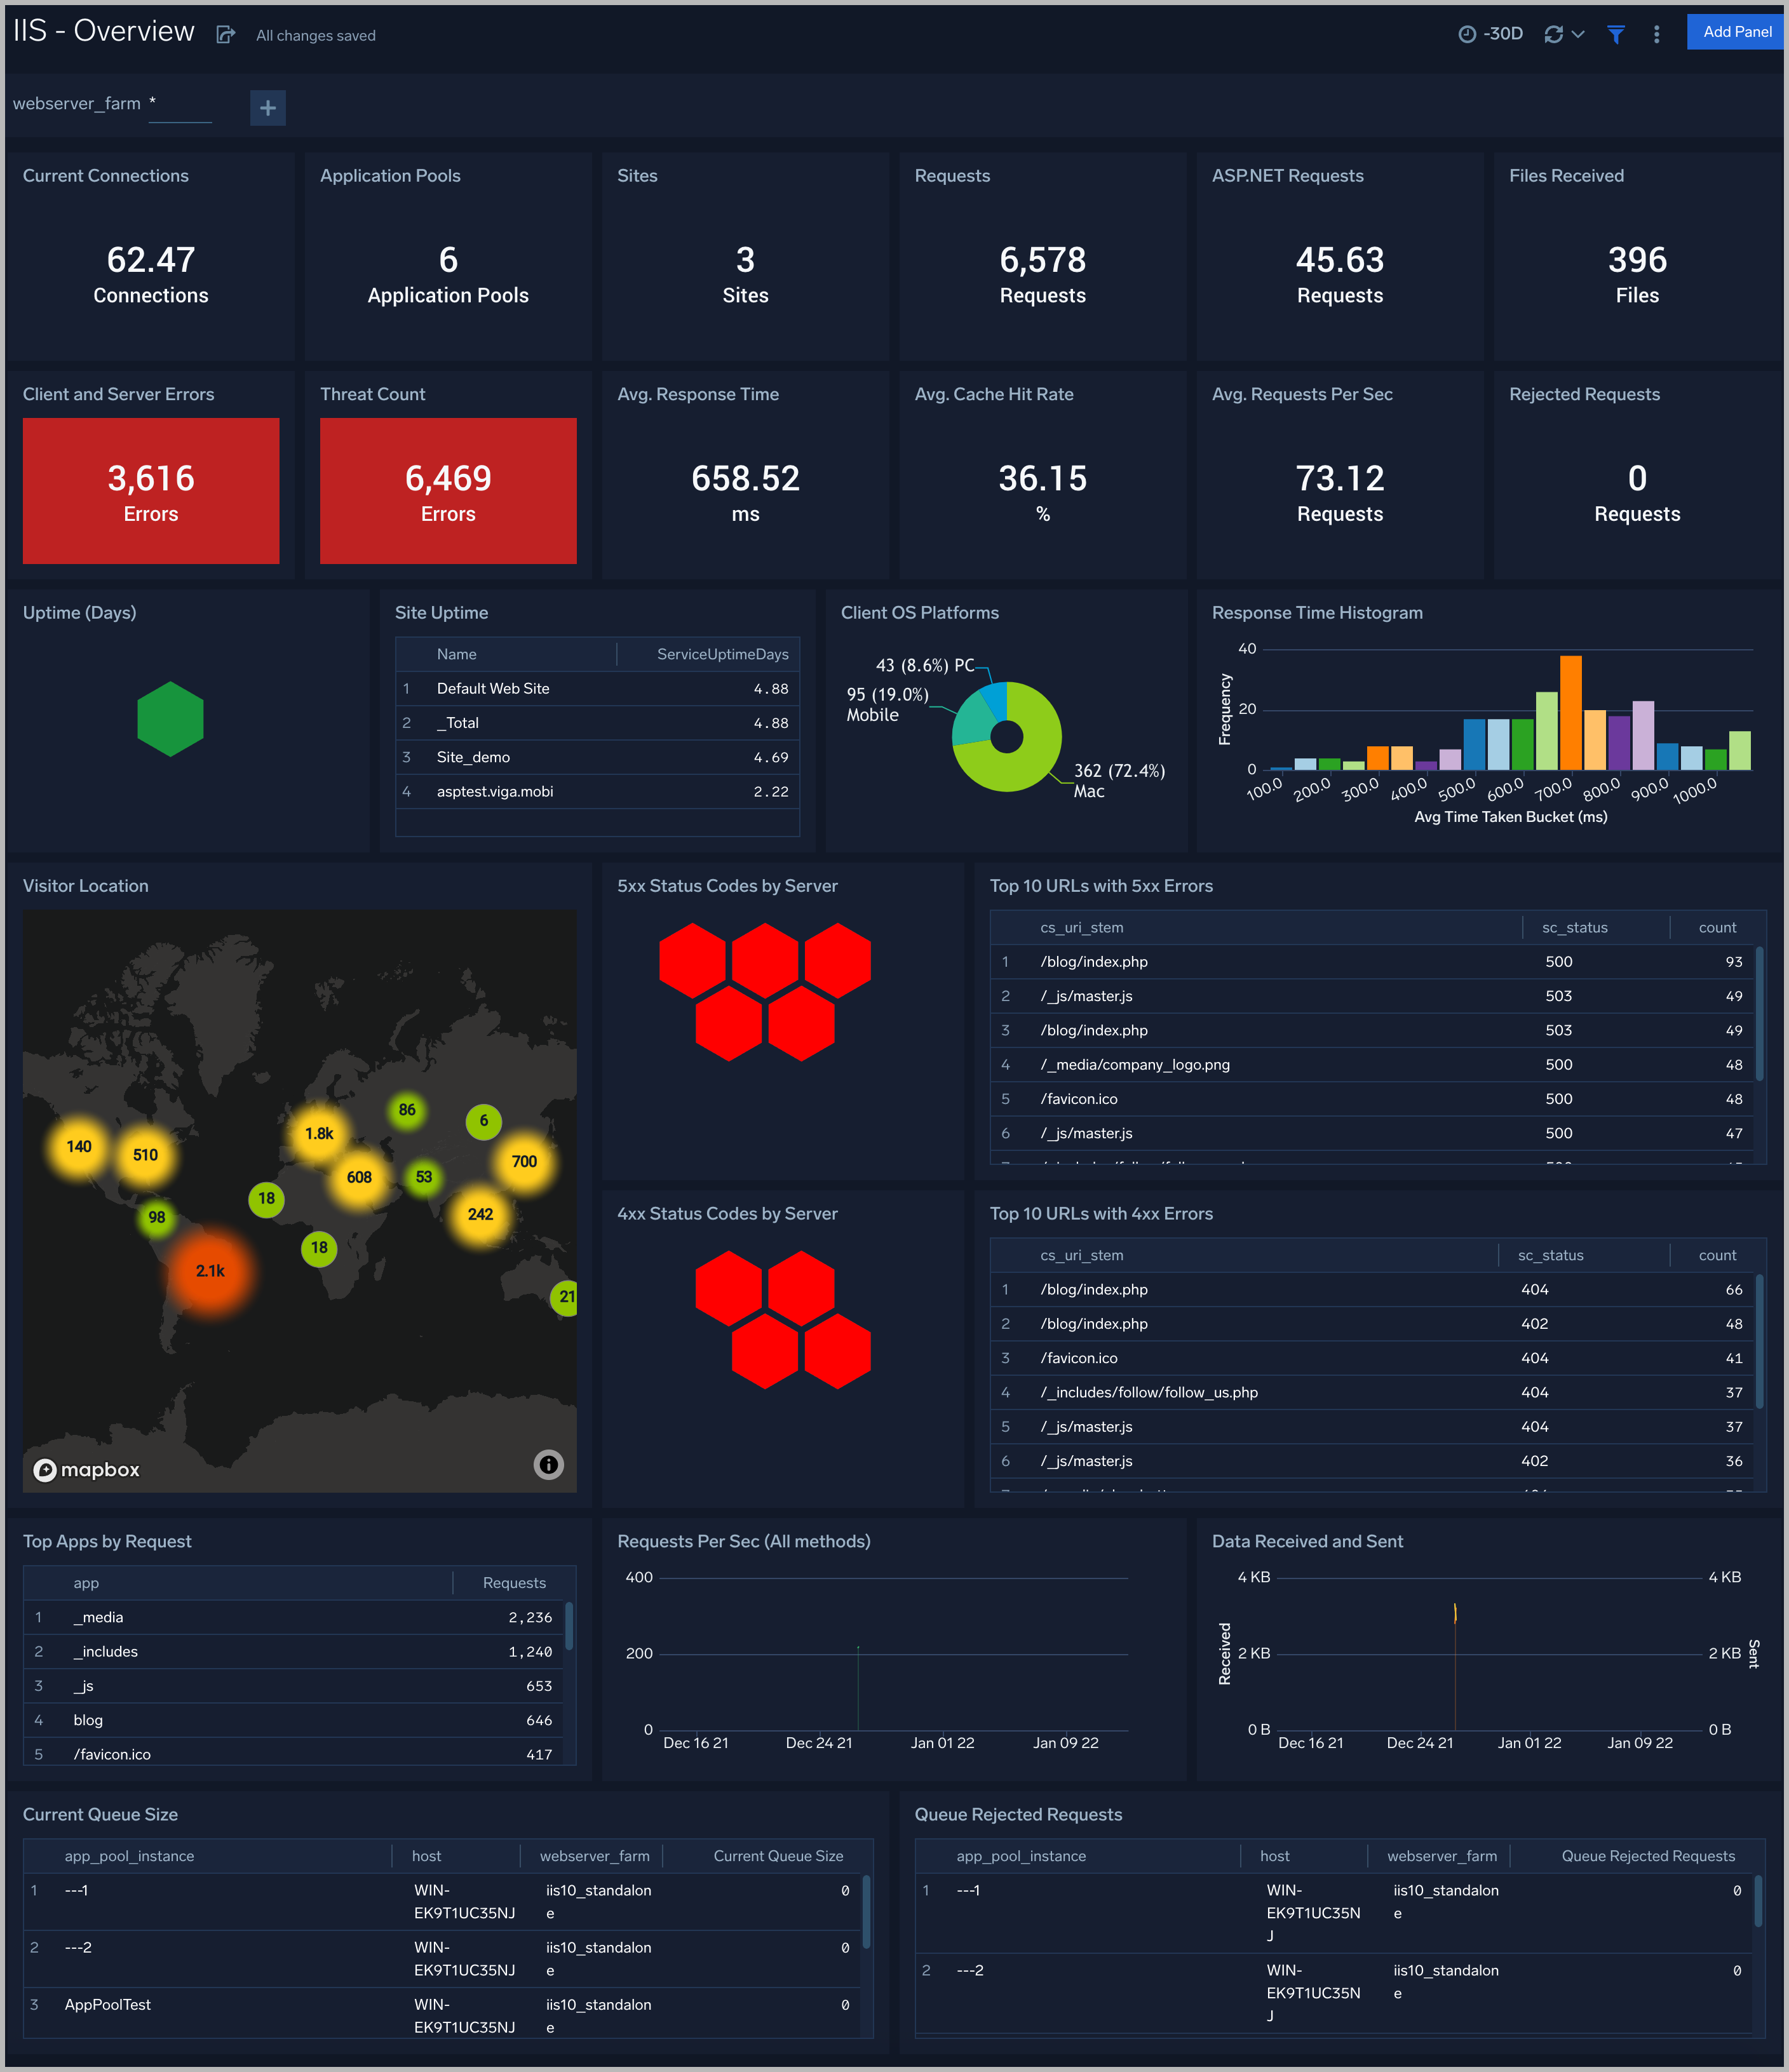
The IIS - Overview dashboard provides a high-level view of the performance and integrity of your Microsoft Internet Information Services (IIS) infrastructure. Dashboard panels display visual graphs and detailed information on IIS versions, platforms, and log formats. Panels also show visitor geographic locations and top app requests. OS platforms, response status, response times, and client and server errors.
Use this dashboard to:
- Get a high-level overview of sites, requests, connect, cache, data received and sent, queue, application pool, client location, client platforms, errors, and threats identified.
- Drill Down to specific use cases by clicking on specific panels of interest.
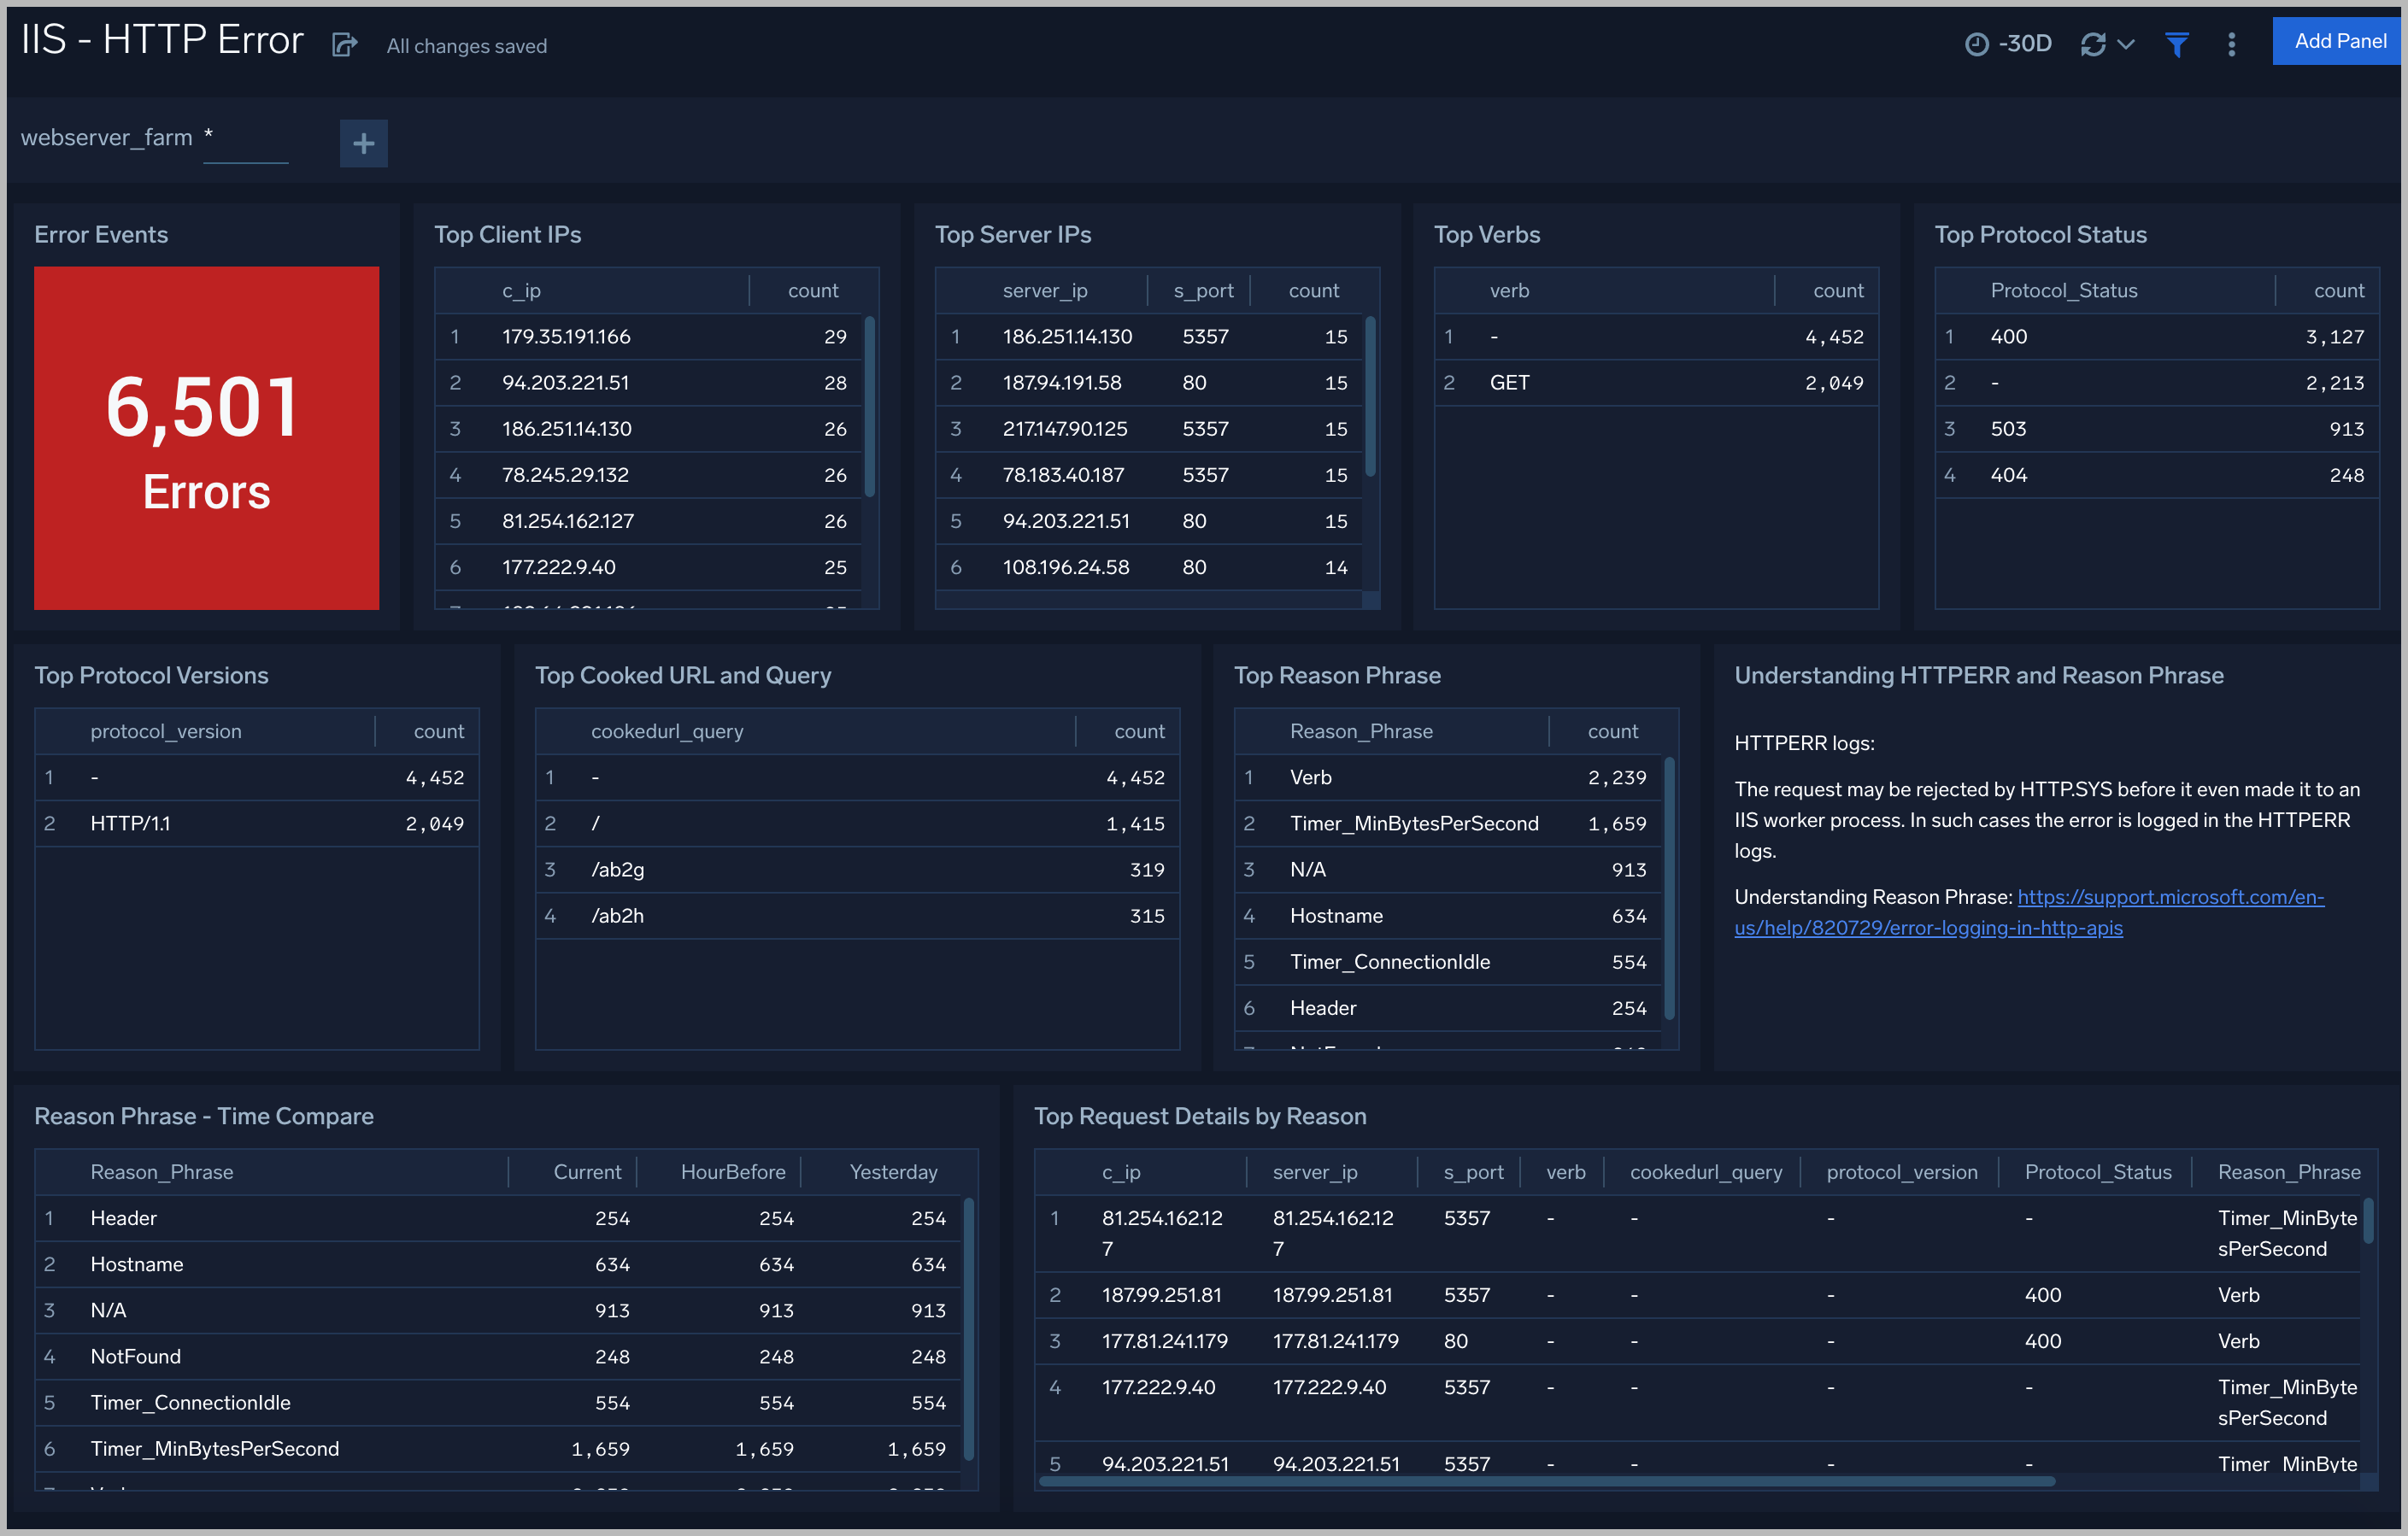
HTTP Error
The IIS - HTTP Error dashboard provides detailed information on IIS error logging in HTTP. Dashboard panels show details on error events, top client and server IP addresses, top protocol versions, and protocol status. Panels also show information on top reason phrases and verbs associated with HTTP errors, as well as top request details by reason.
Use this dashboard to:
- Monitor errors logged by HTTP.SYS. The client request may be rejected by HTTP.SYS before it made it to an IIS worker process. In such cases, the error is logged in the HTTPERR logs.
- Identify the reason for failure. Check if the request violated the HTTP protocol, or if there was a WAS/the application pool failure.
- Correct the error identified to ensure a consistent and satisfactory user experience.
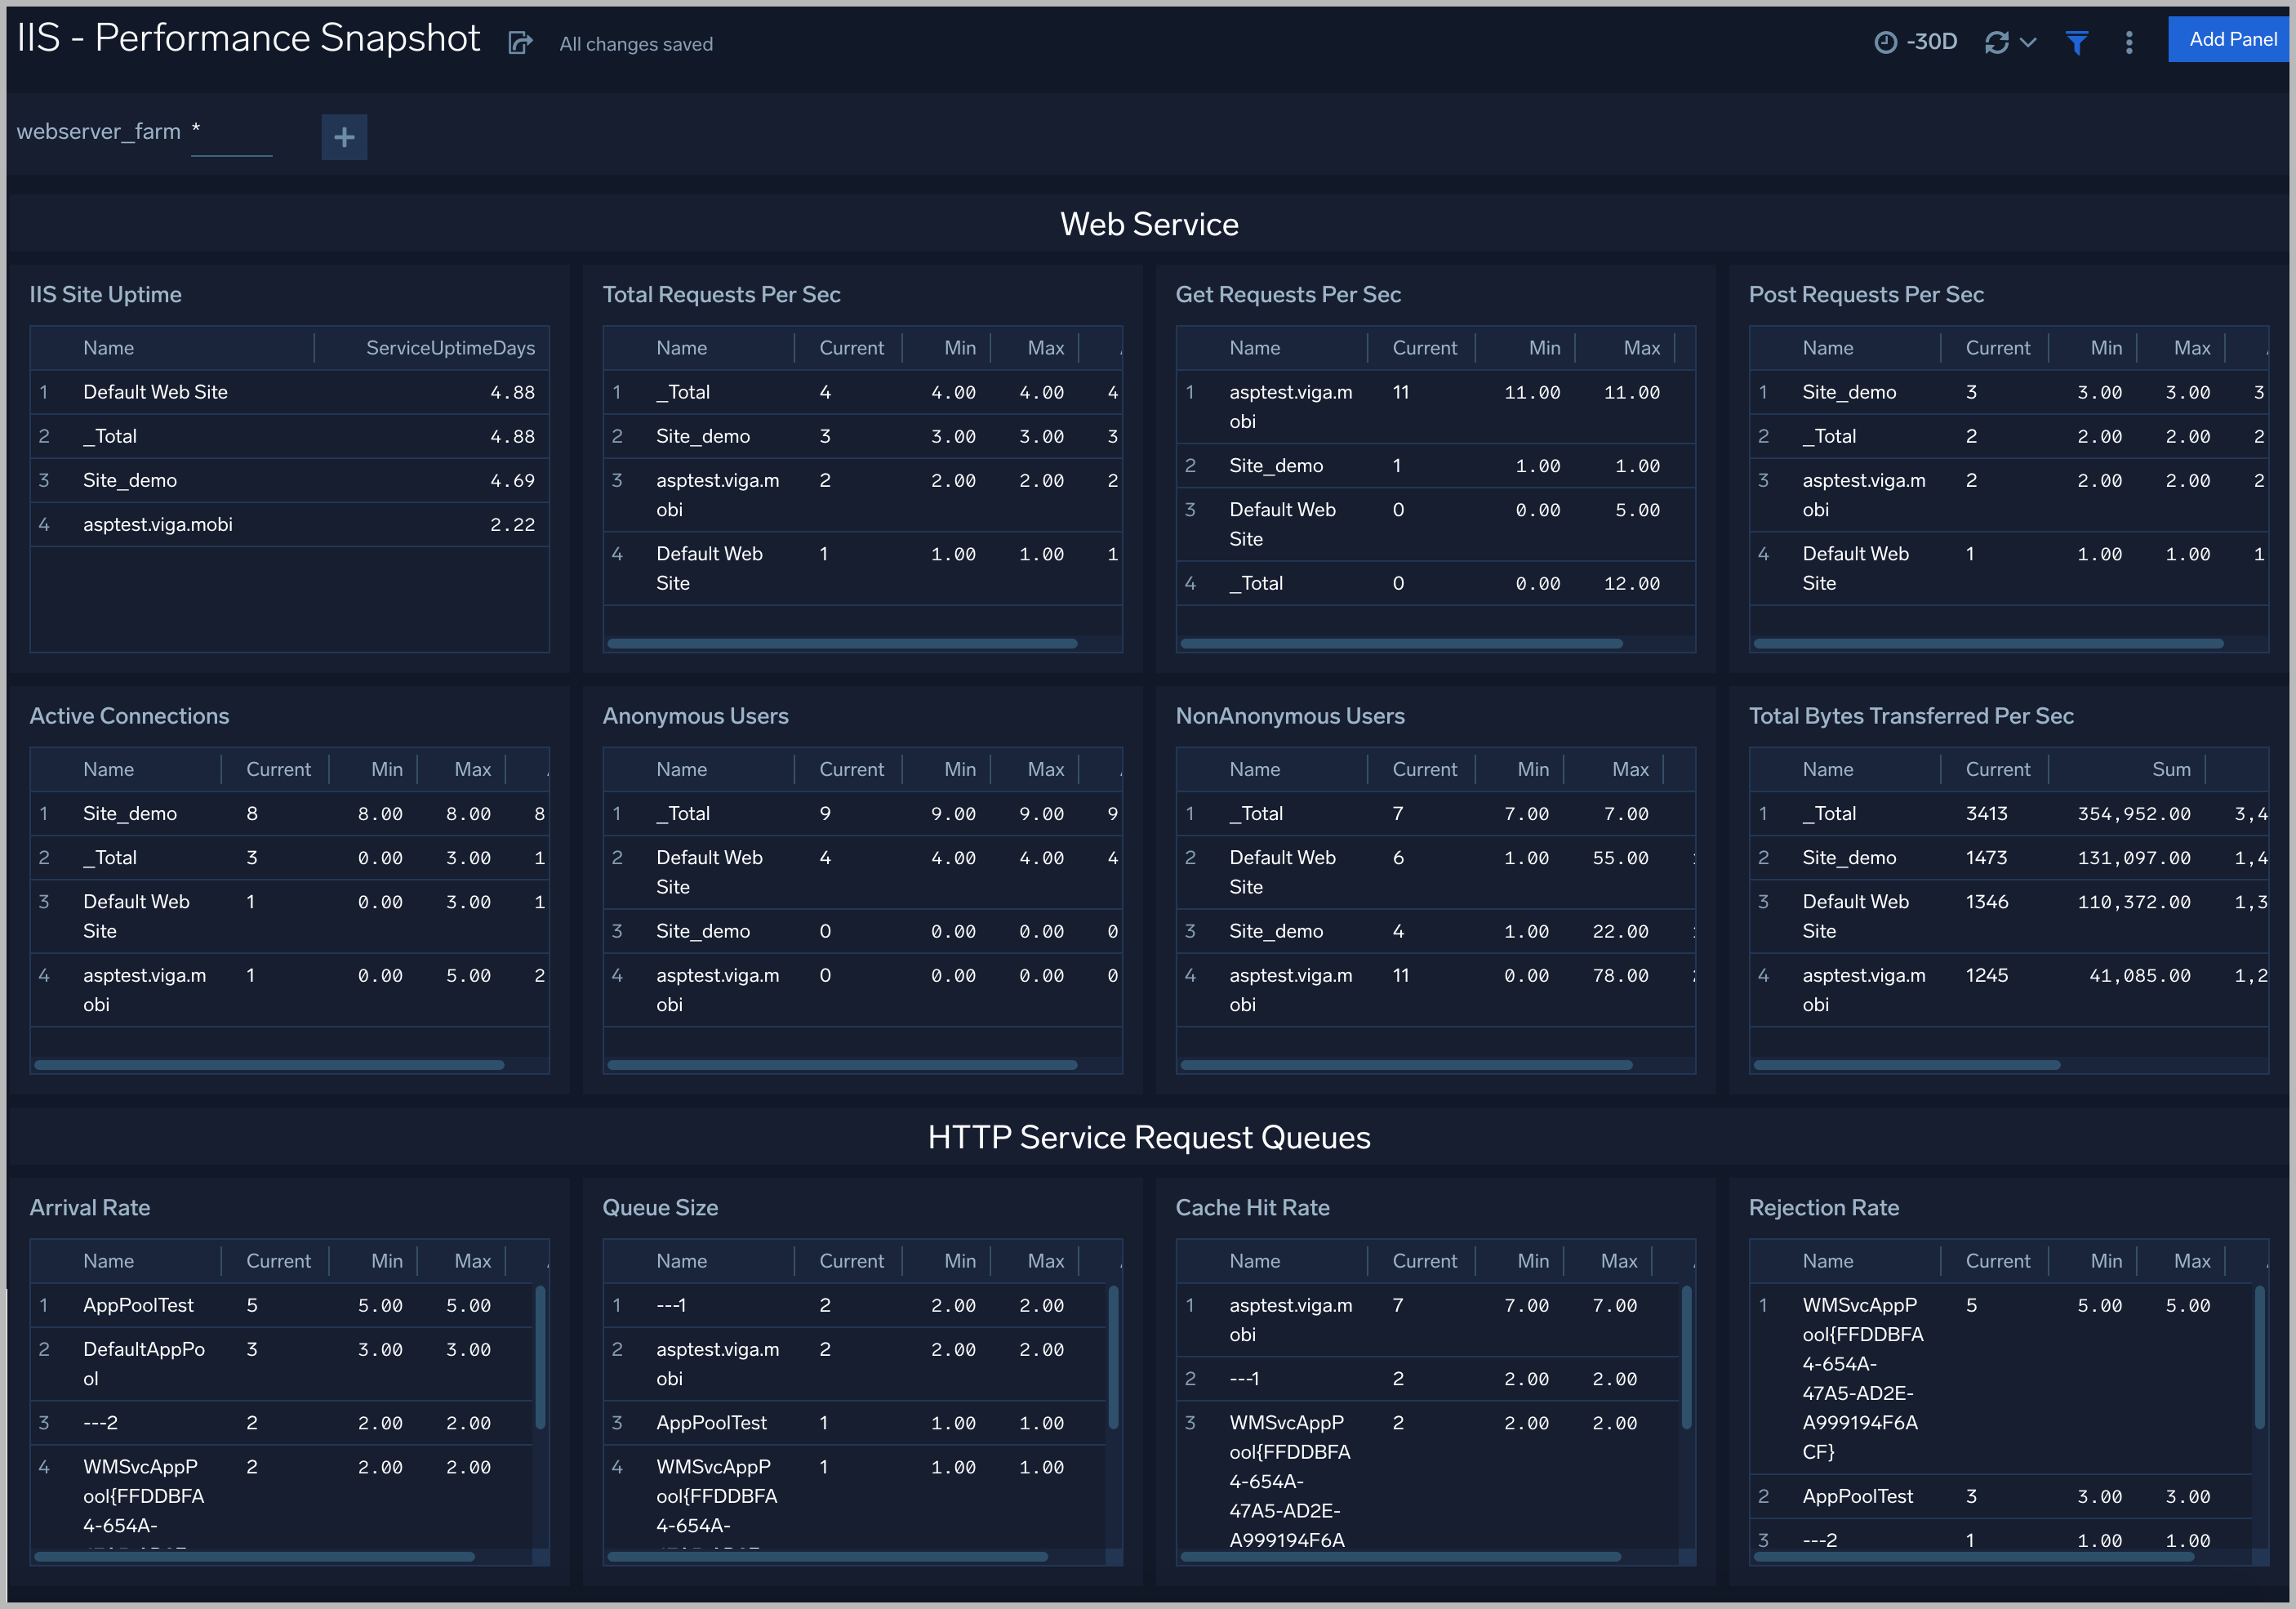
Performance Snapshot
The IIS - Performance Snapshot dashboard provides detailed information on your IIS infrastructure integrity and performance. Dashboard panels show details on Web Service uptime, active connections, requests, user activity, and total bytes transferred. Panels also provide HTTP Service Request Queues details, such as arrivals, queue size, cache hit rate, and rejection rate.
Use this dashboard to:
- Monitor incoming request traffic, along with queue size and rejection rate to identify any bottlenecks.
- Monitor cache hit rates to check how requests are being served. Typically static content has high cache hit rates.
- Monitor current active connections to track sudden rises in connections. A sudden rise results in increased resource requirements. A sudden rise may also indicate a security attack.
- Monitor the load on your site by looking into the rate of all the requests and rates based on specific types of HTTP methods, to anticipate resource needs and allocate them accordingly.
- Monitor Bytes/Files transferred, to check if there is a need to make page content more lightweight, or track the most typically transferred high data content. This can also be an indicator of a potential spike in traffic.
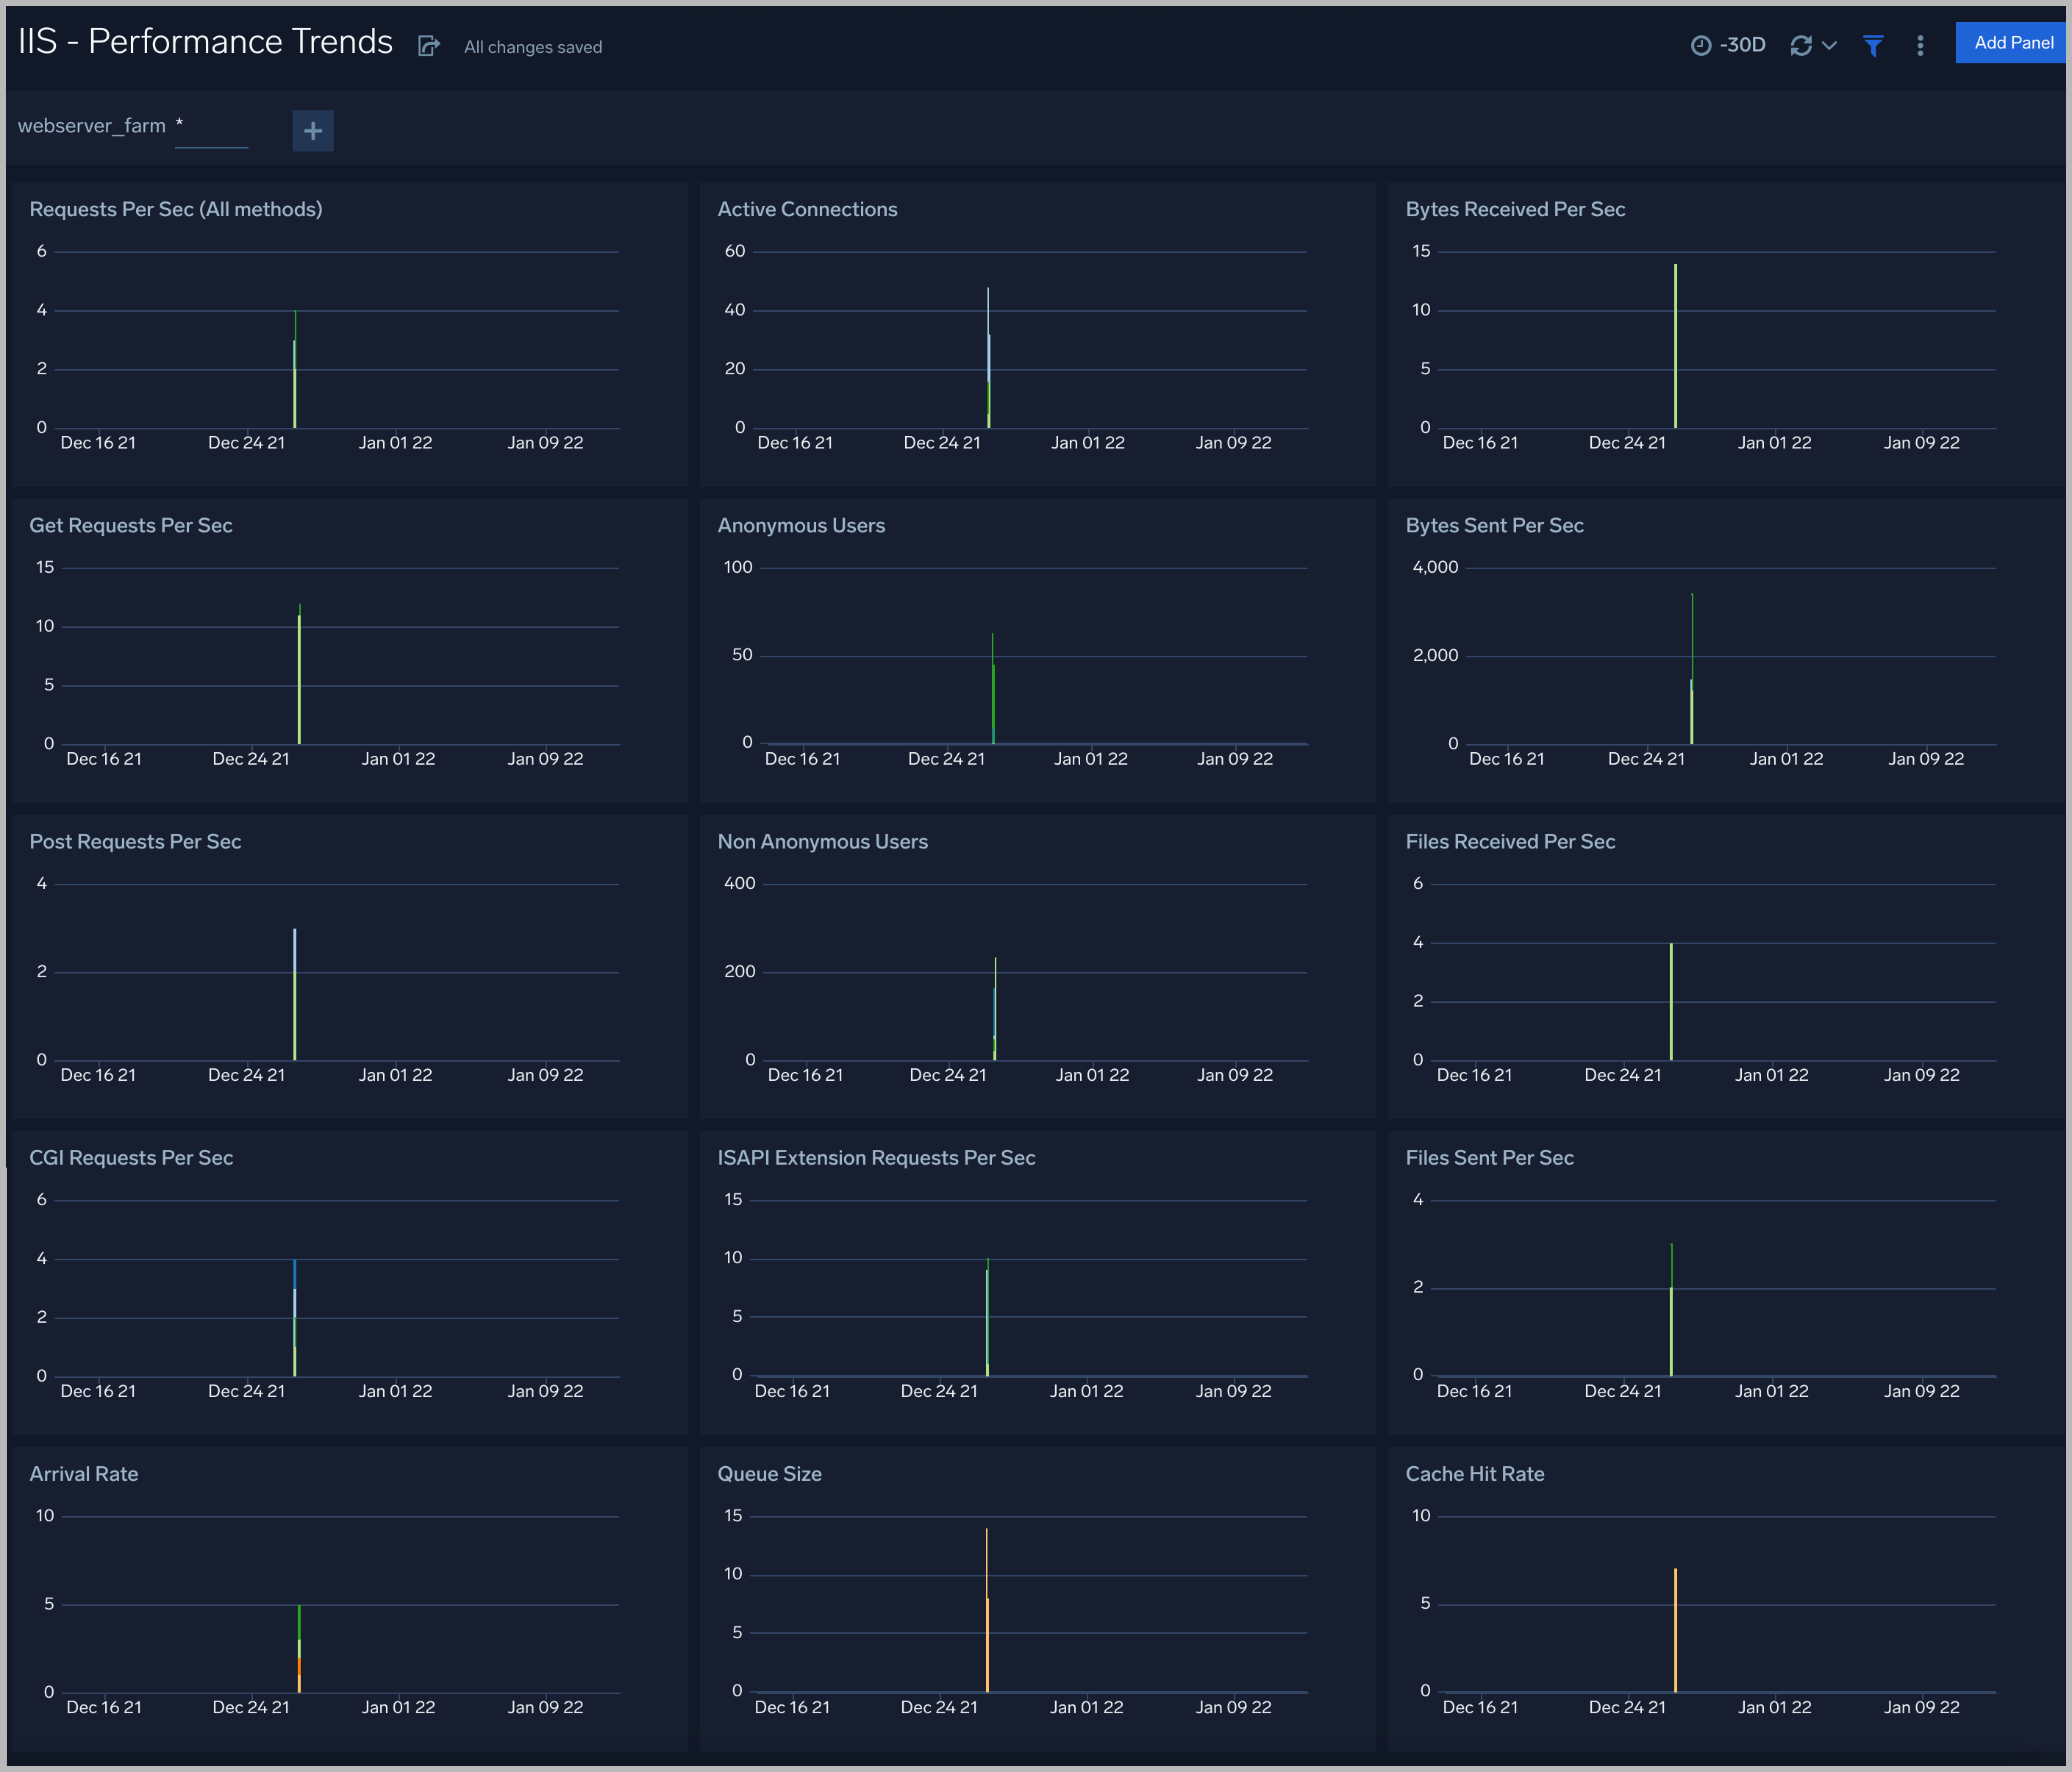
Performance Trends
The IIS - Performance Trends dashboard provides details on ISS infrastructure trends for requests, active connections, bytes received and sent, files received and sent, queue size, arrival rate, and cache hit rate.
Use this dashboard to:
- Monitor trends of various metrics to keep track of how requests are served over time and anticipate potential performance bottlenecks.
- Acquire current performance snapshots of IIS servers. You can drill down to the Performance Snapshot by clicking the Requests Per Sec (All methods) panel.
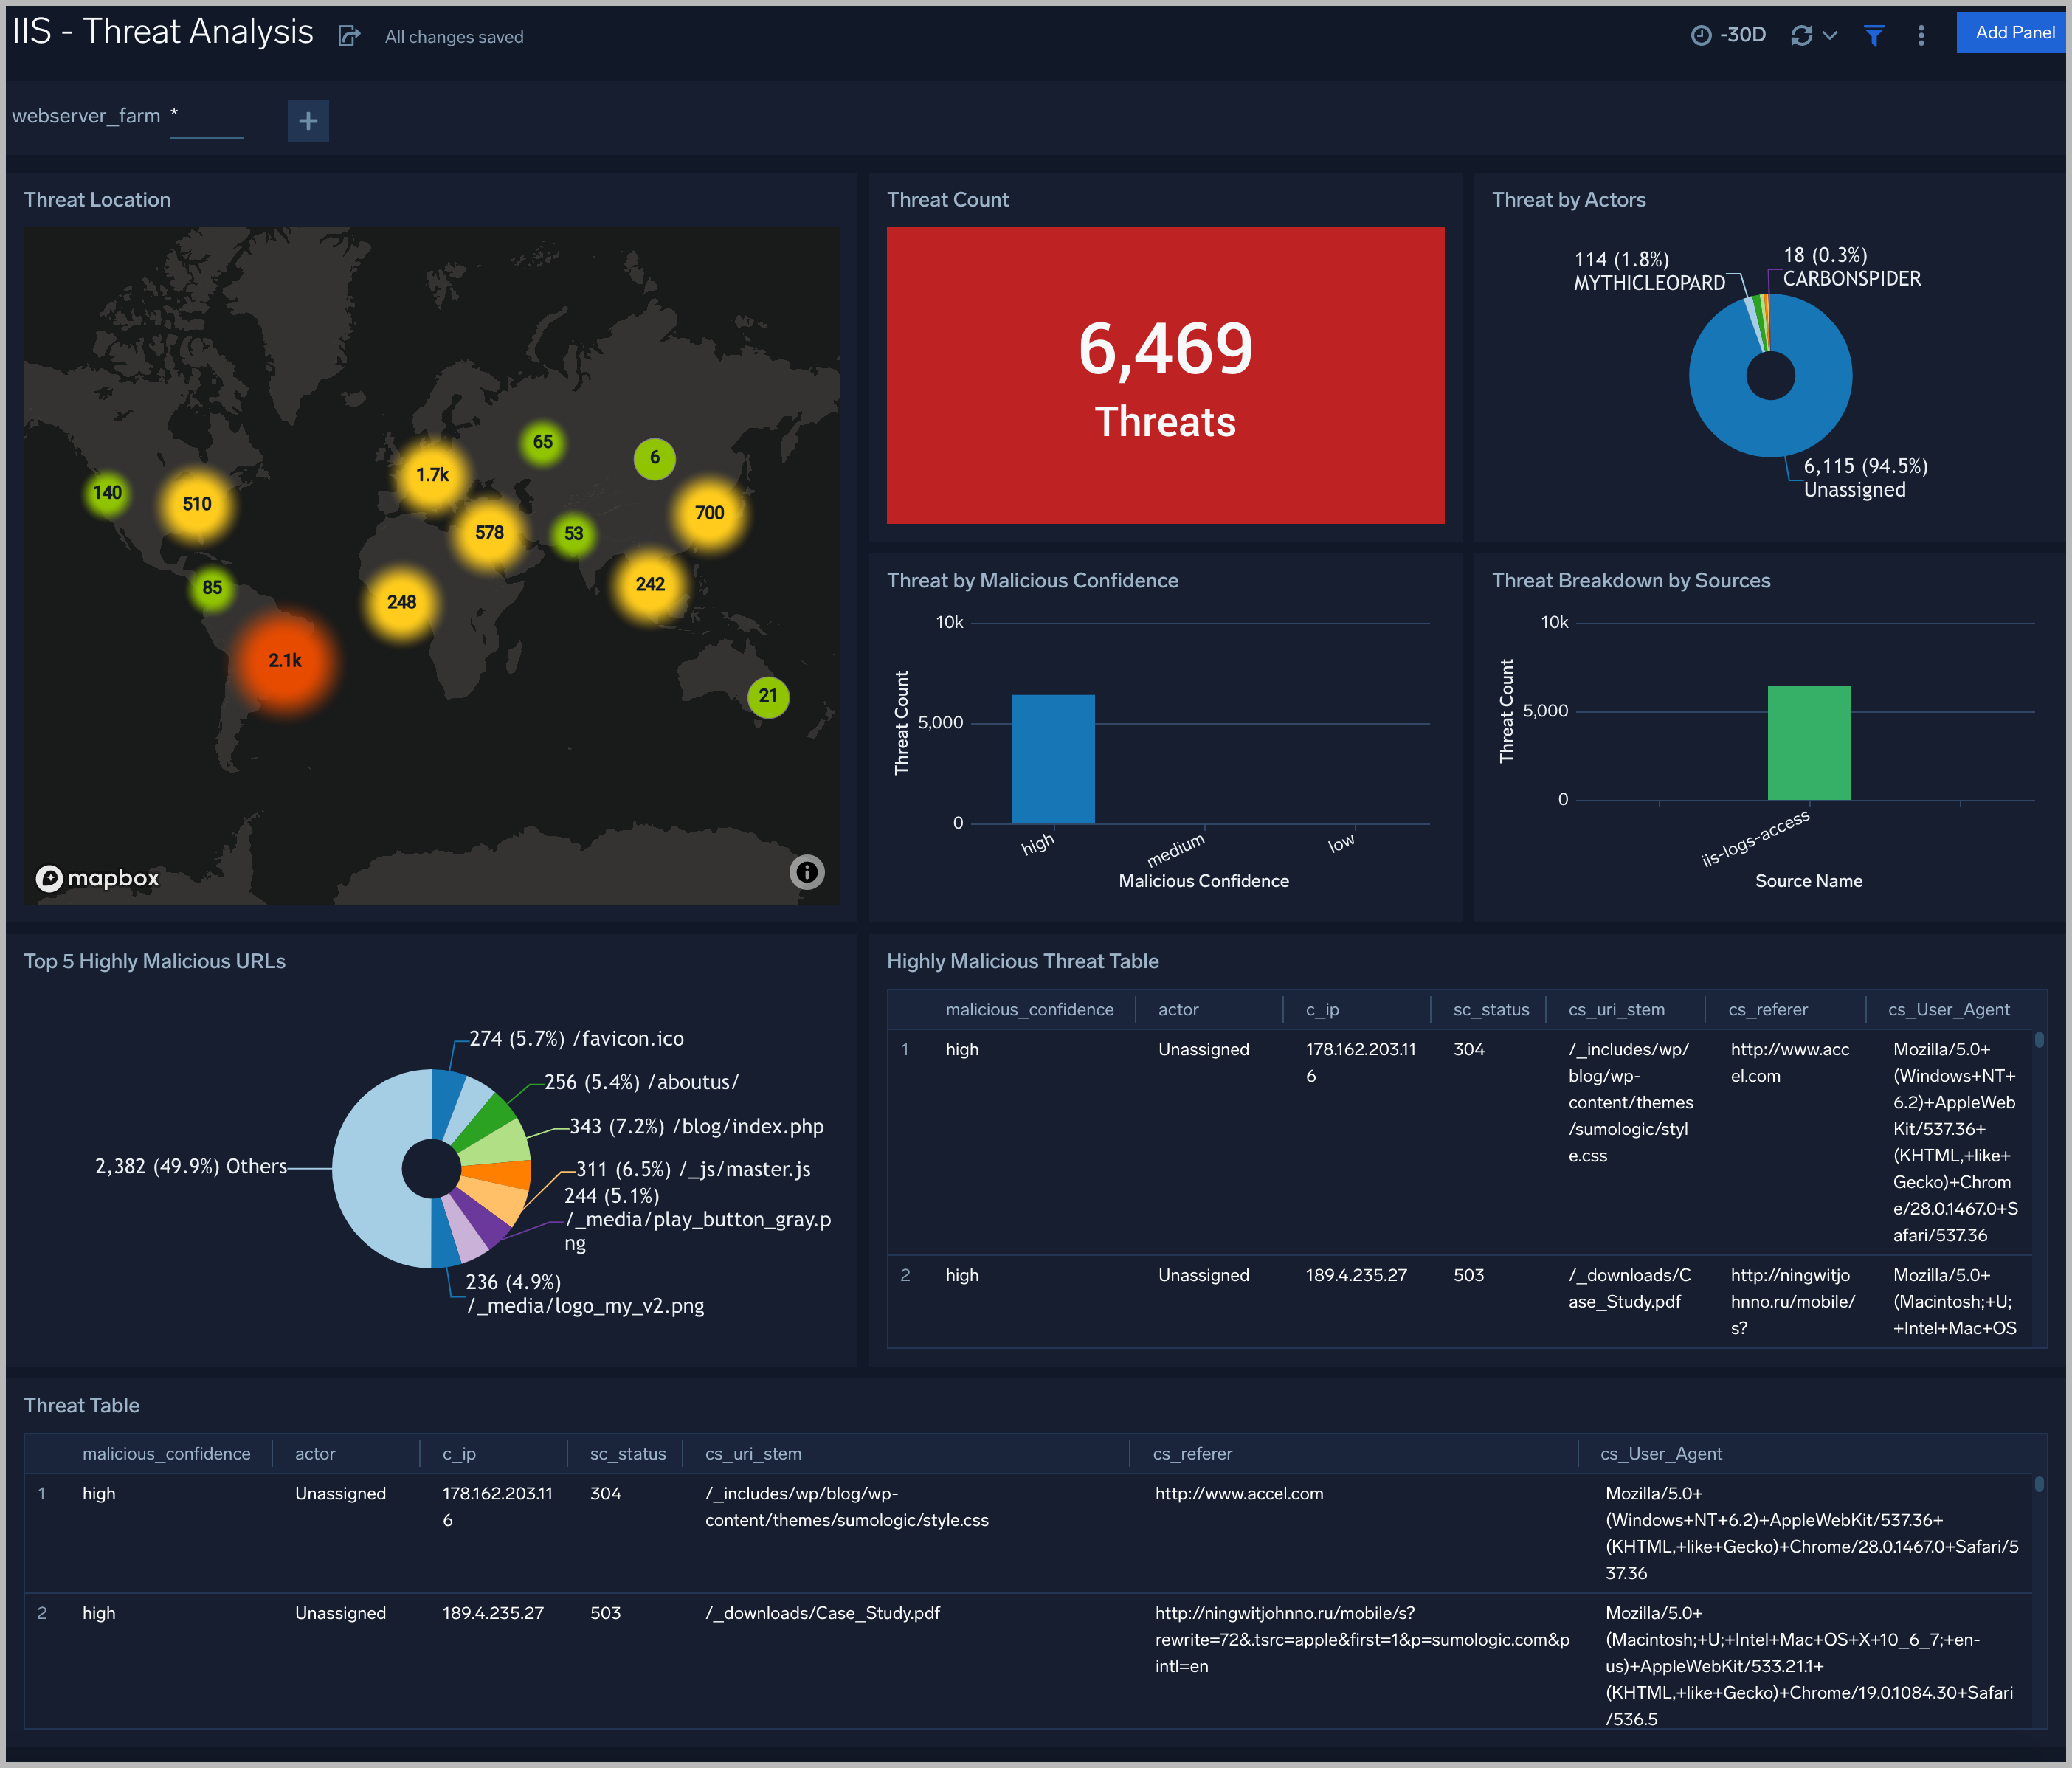
Threat Analysis
The IIS - Threat Analysis dashboard provides high-level views of threats throughout your IIS network. Dashboard panels display visual graphs and detailed information on Threats by Client IP, Threats by Actors, and Threats by Malicious Confidence.
Use this dashboard to:
- Identify potential threats and indicators of compromise.
- Monitor if your site is accessed.
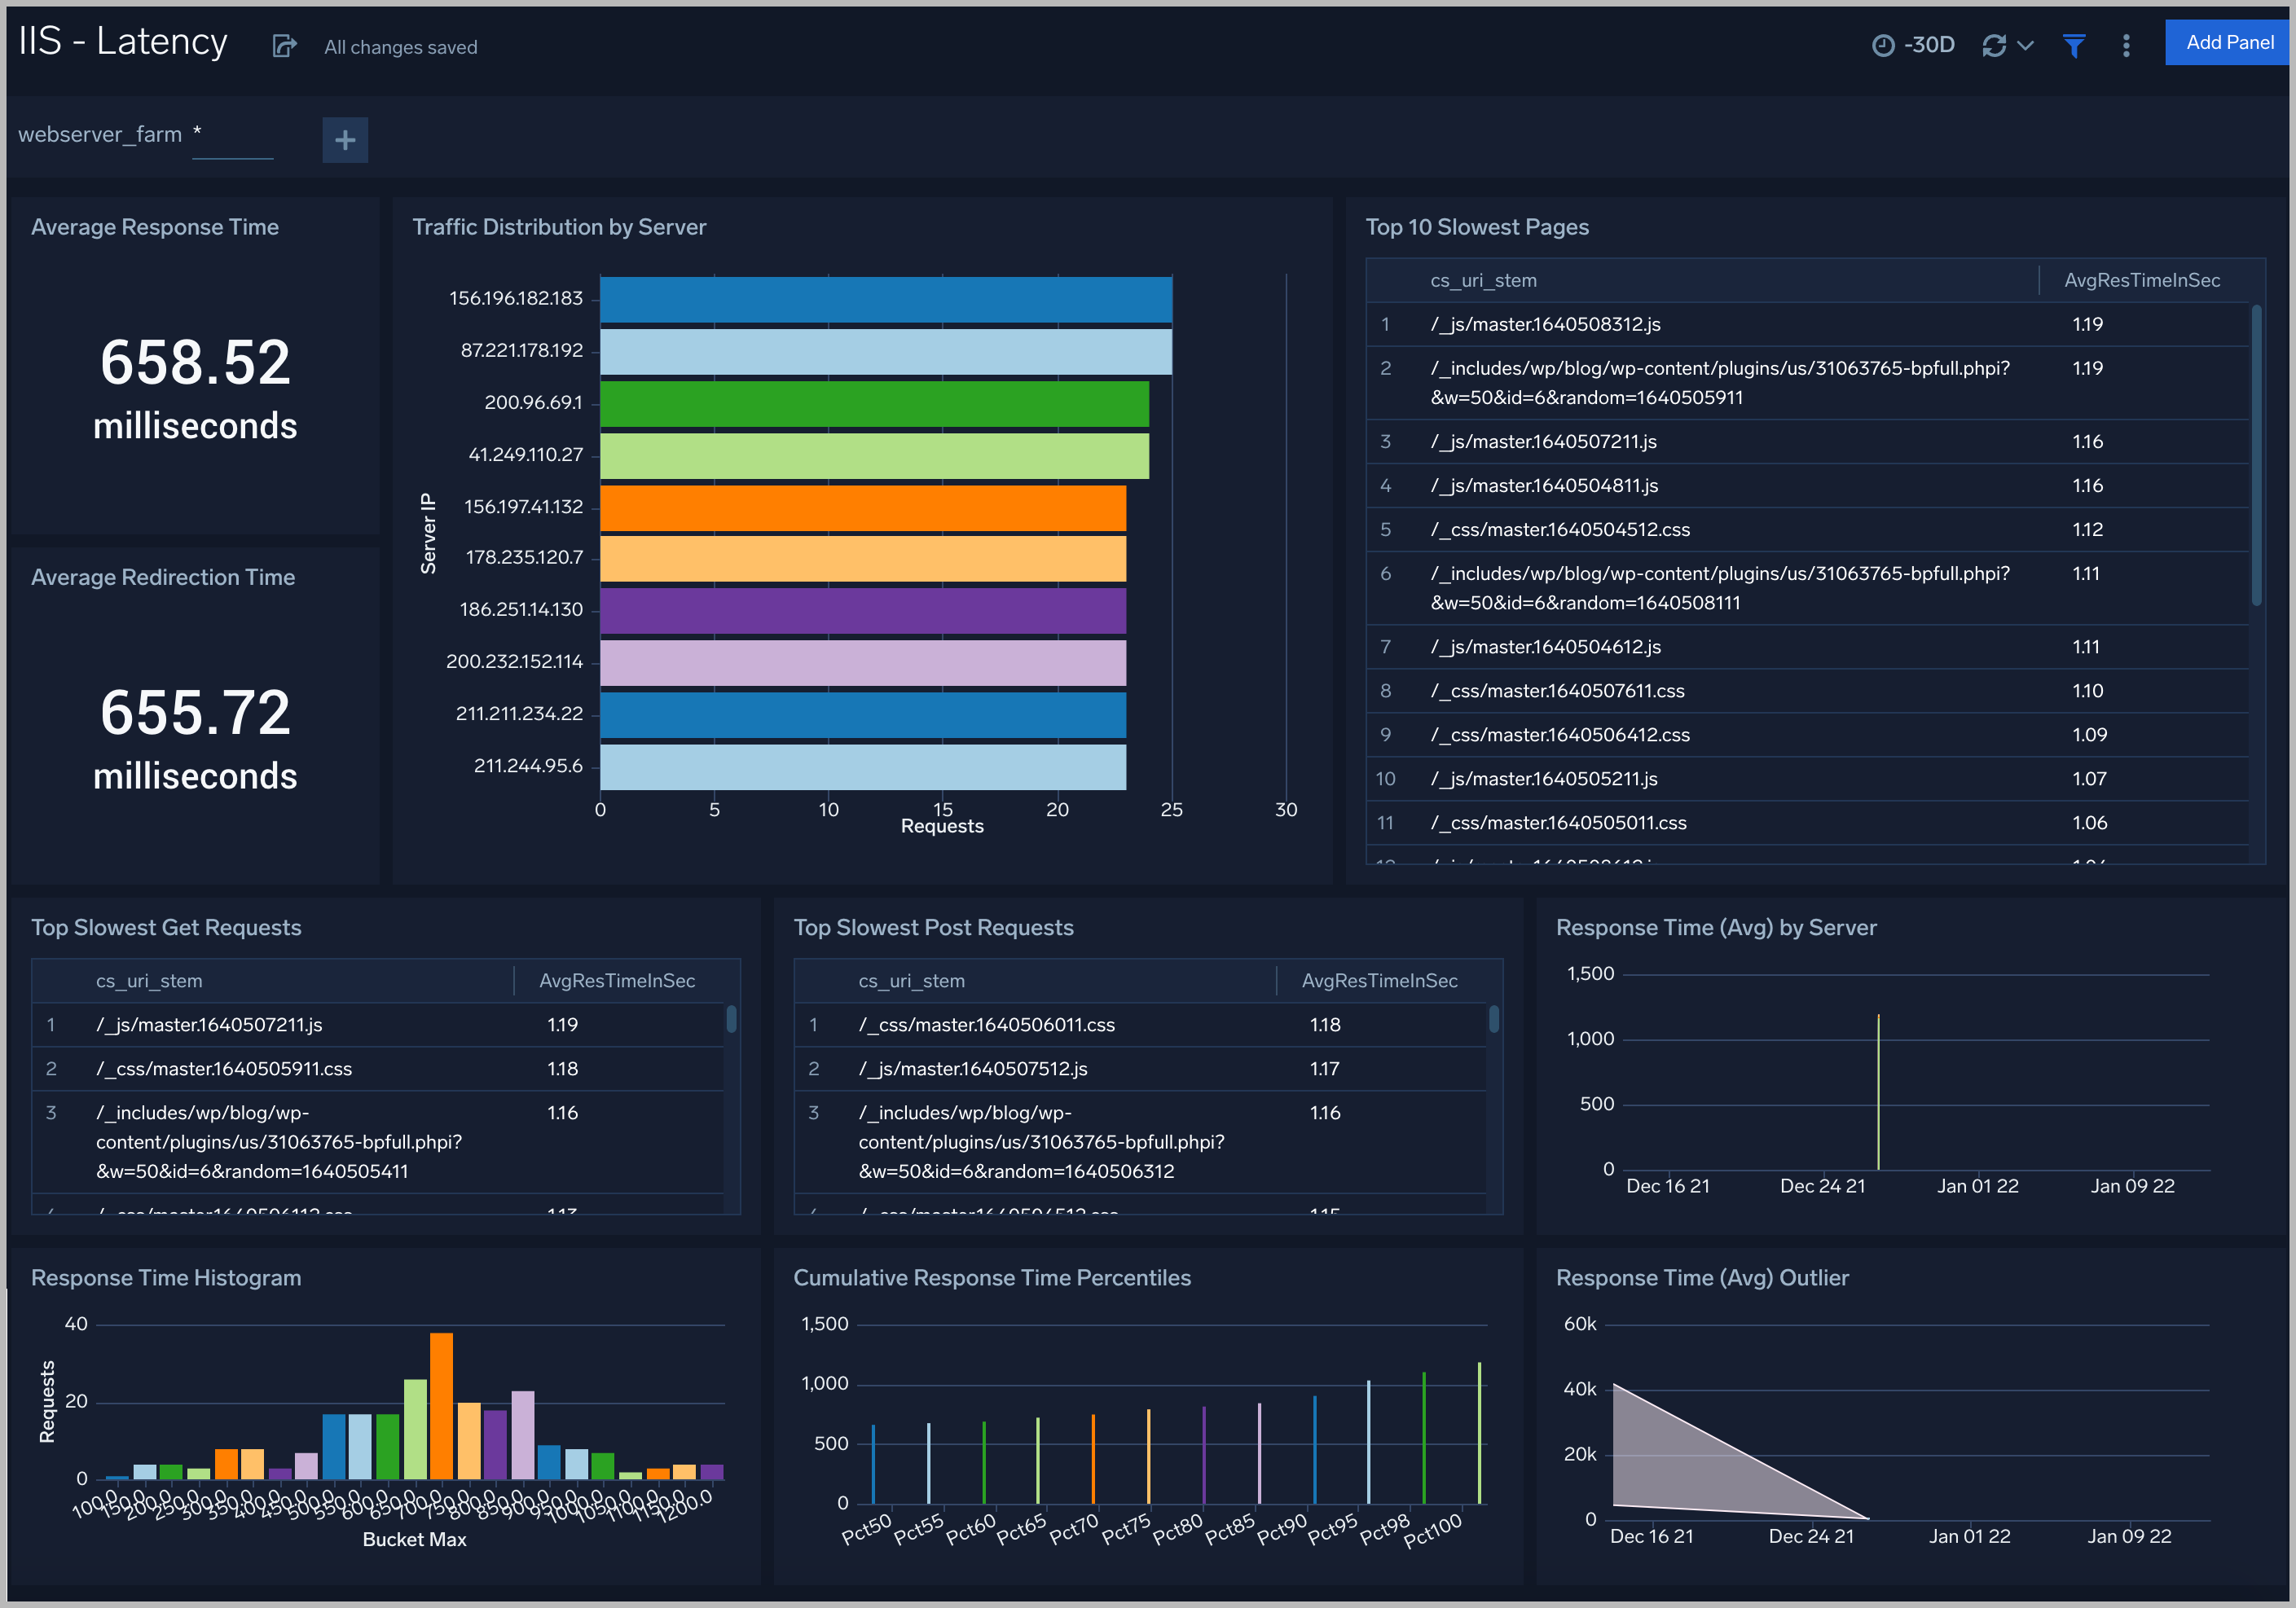
Latency
The IIS - Latency dashboard provides visual graphs and detailed information for the integrity of performance throughout your IIS infrastructure. Dashboard panels show response time averages, cumulative percentiles, histograms, and outliers. Panels also show details for traffic distribution, slowest pages, slowest GET and POST requests, and average redirection time.
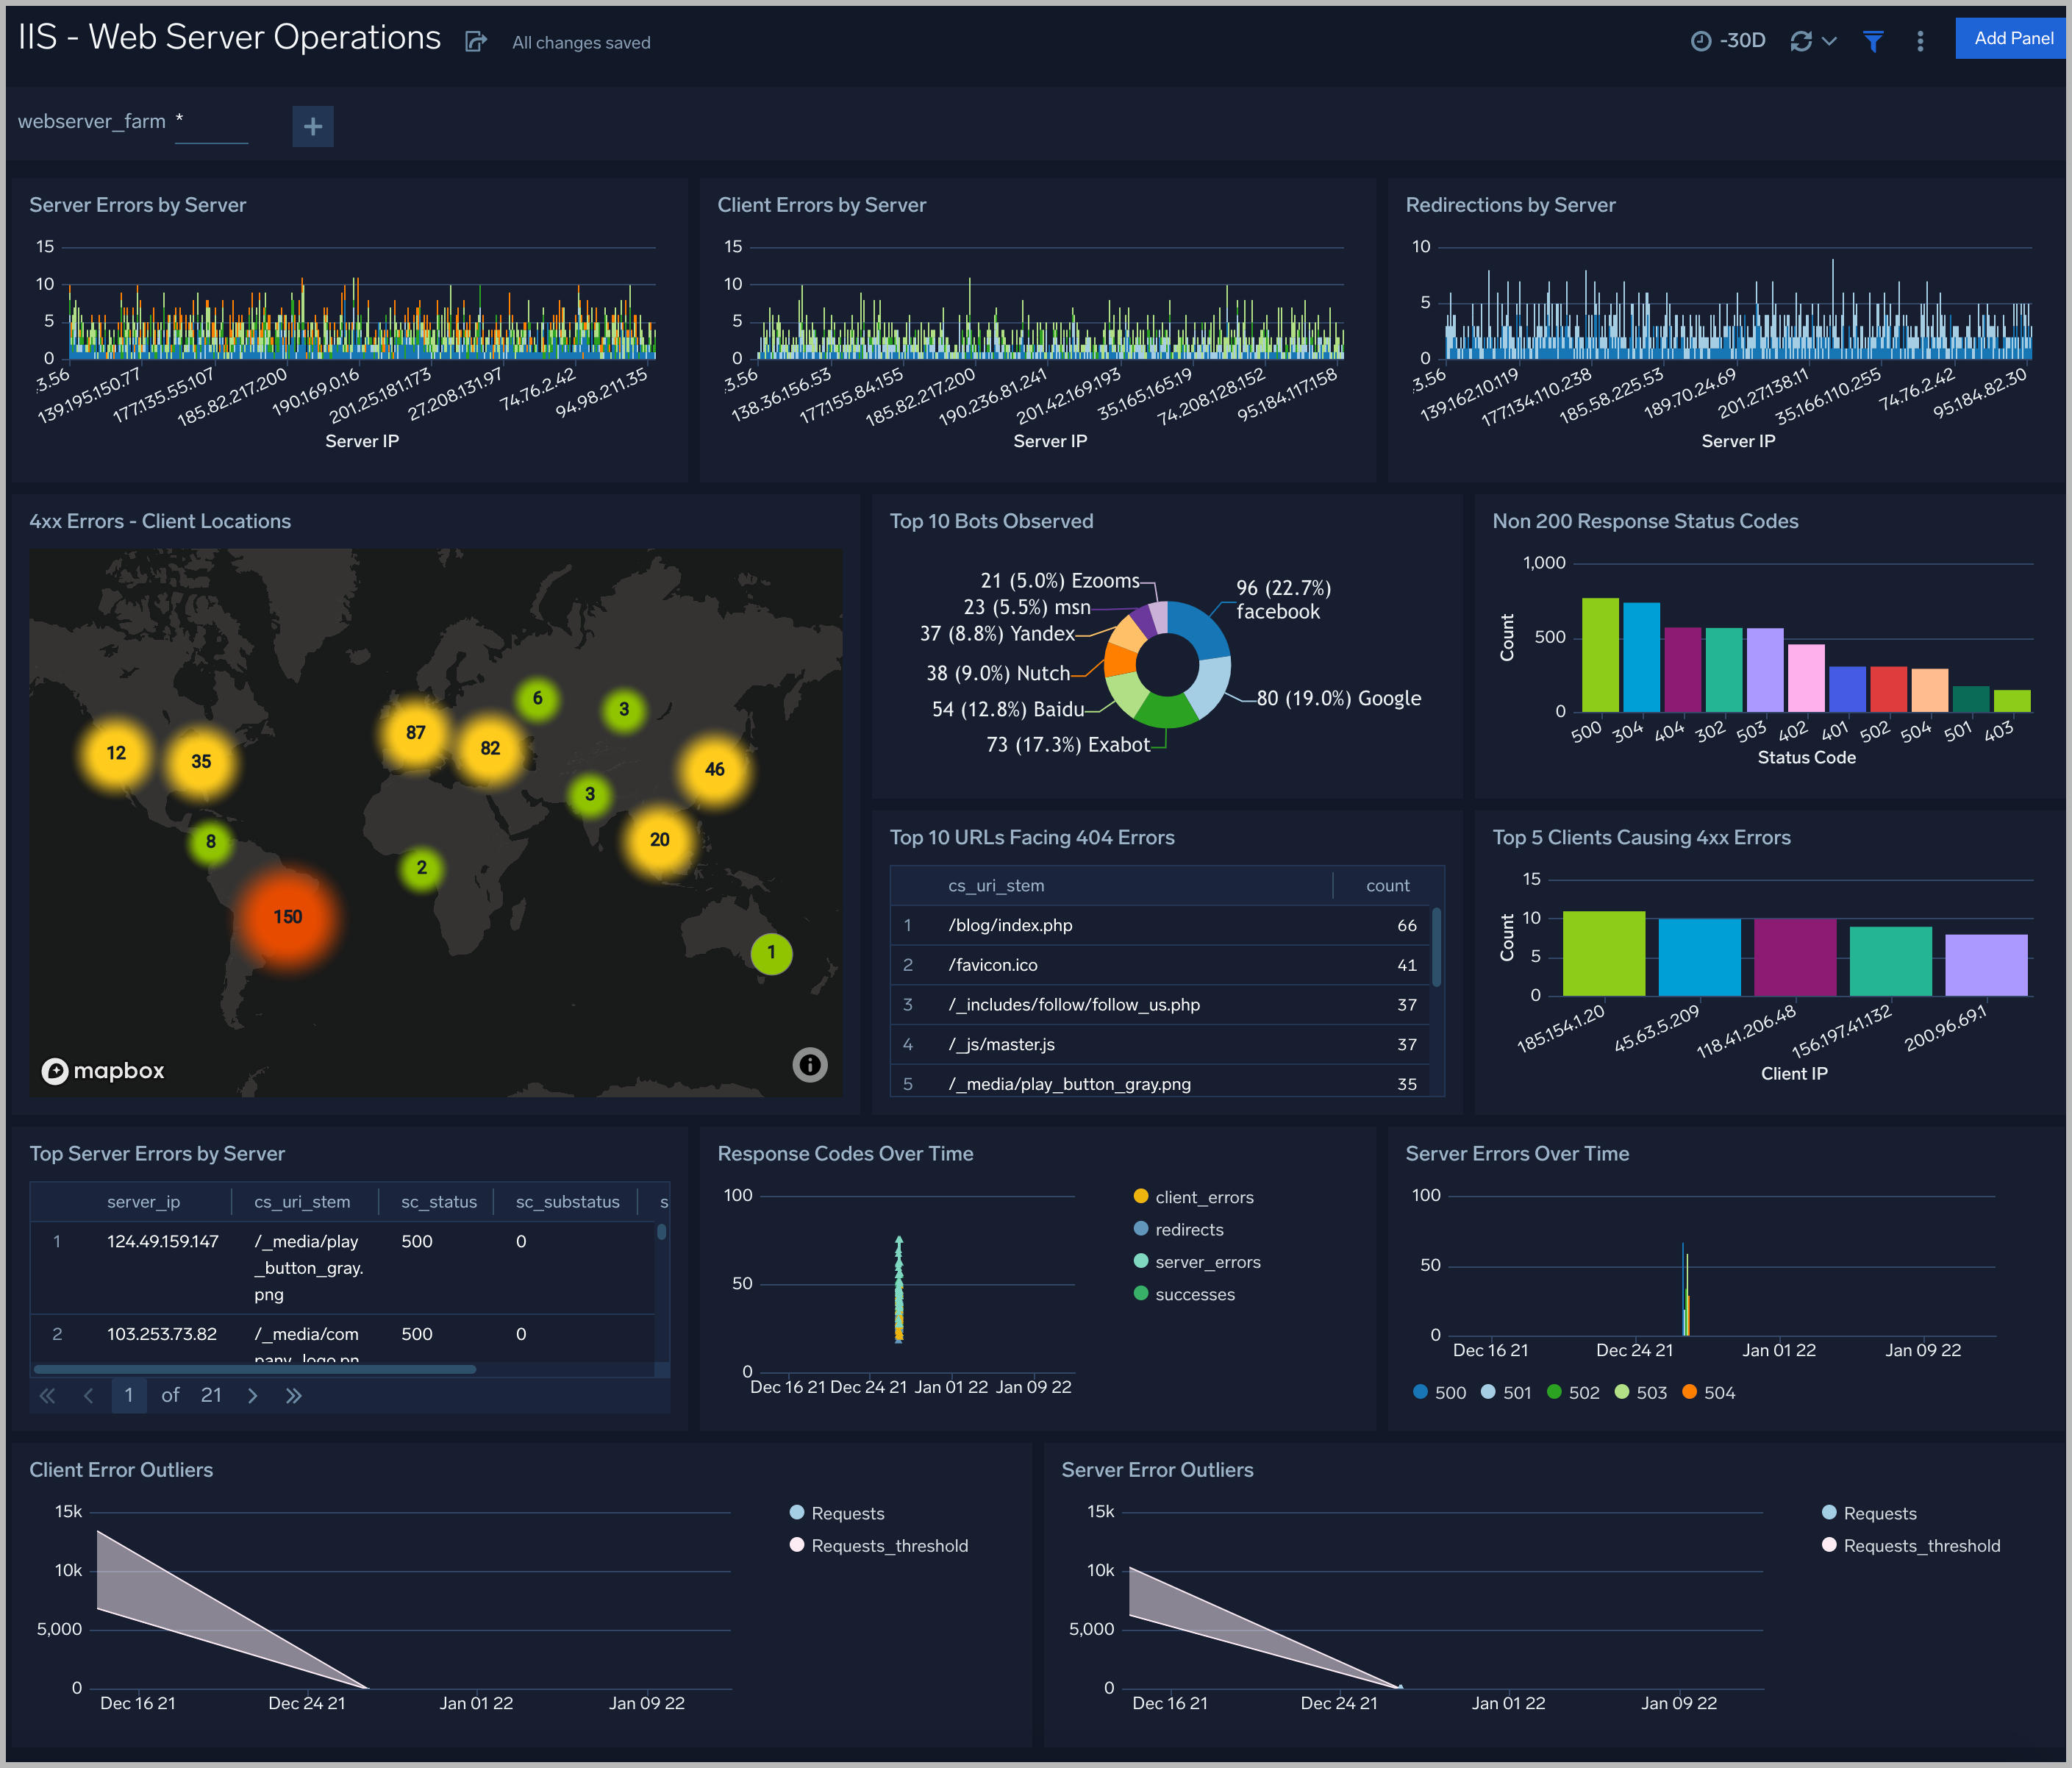
Web Server Operations
The IIS - Web Server Operations dashboard provides visual graphs and detailed information on server operation errors in your IIS infrastructure. Dashboard panels show server errors by the server, server errors over time, server error outliers, and redirections by the server. Panels also show client errors by the server, client error outliers, top URLs with 404 errors, and response codes over time.
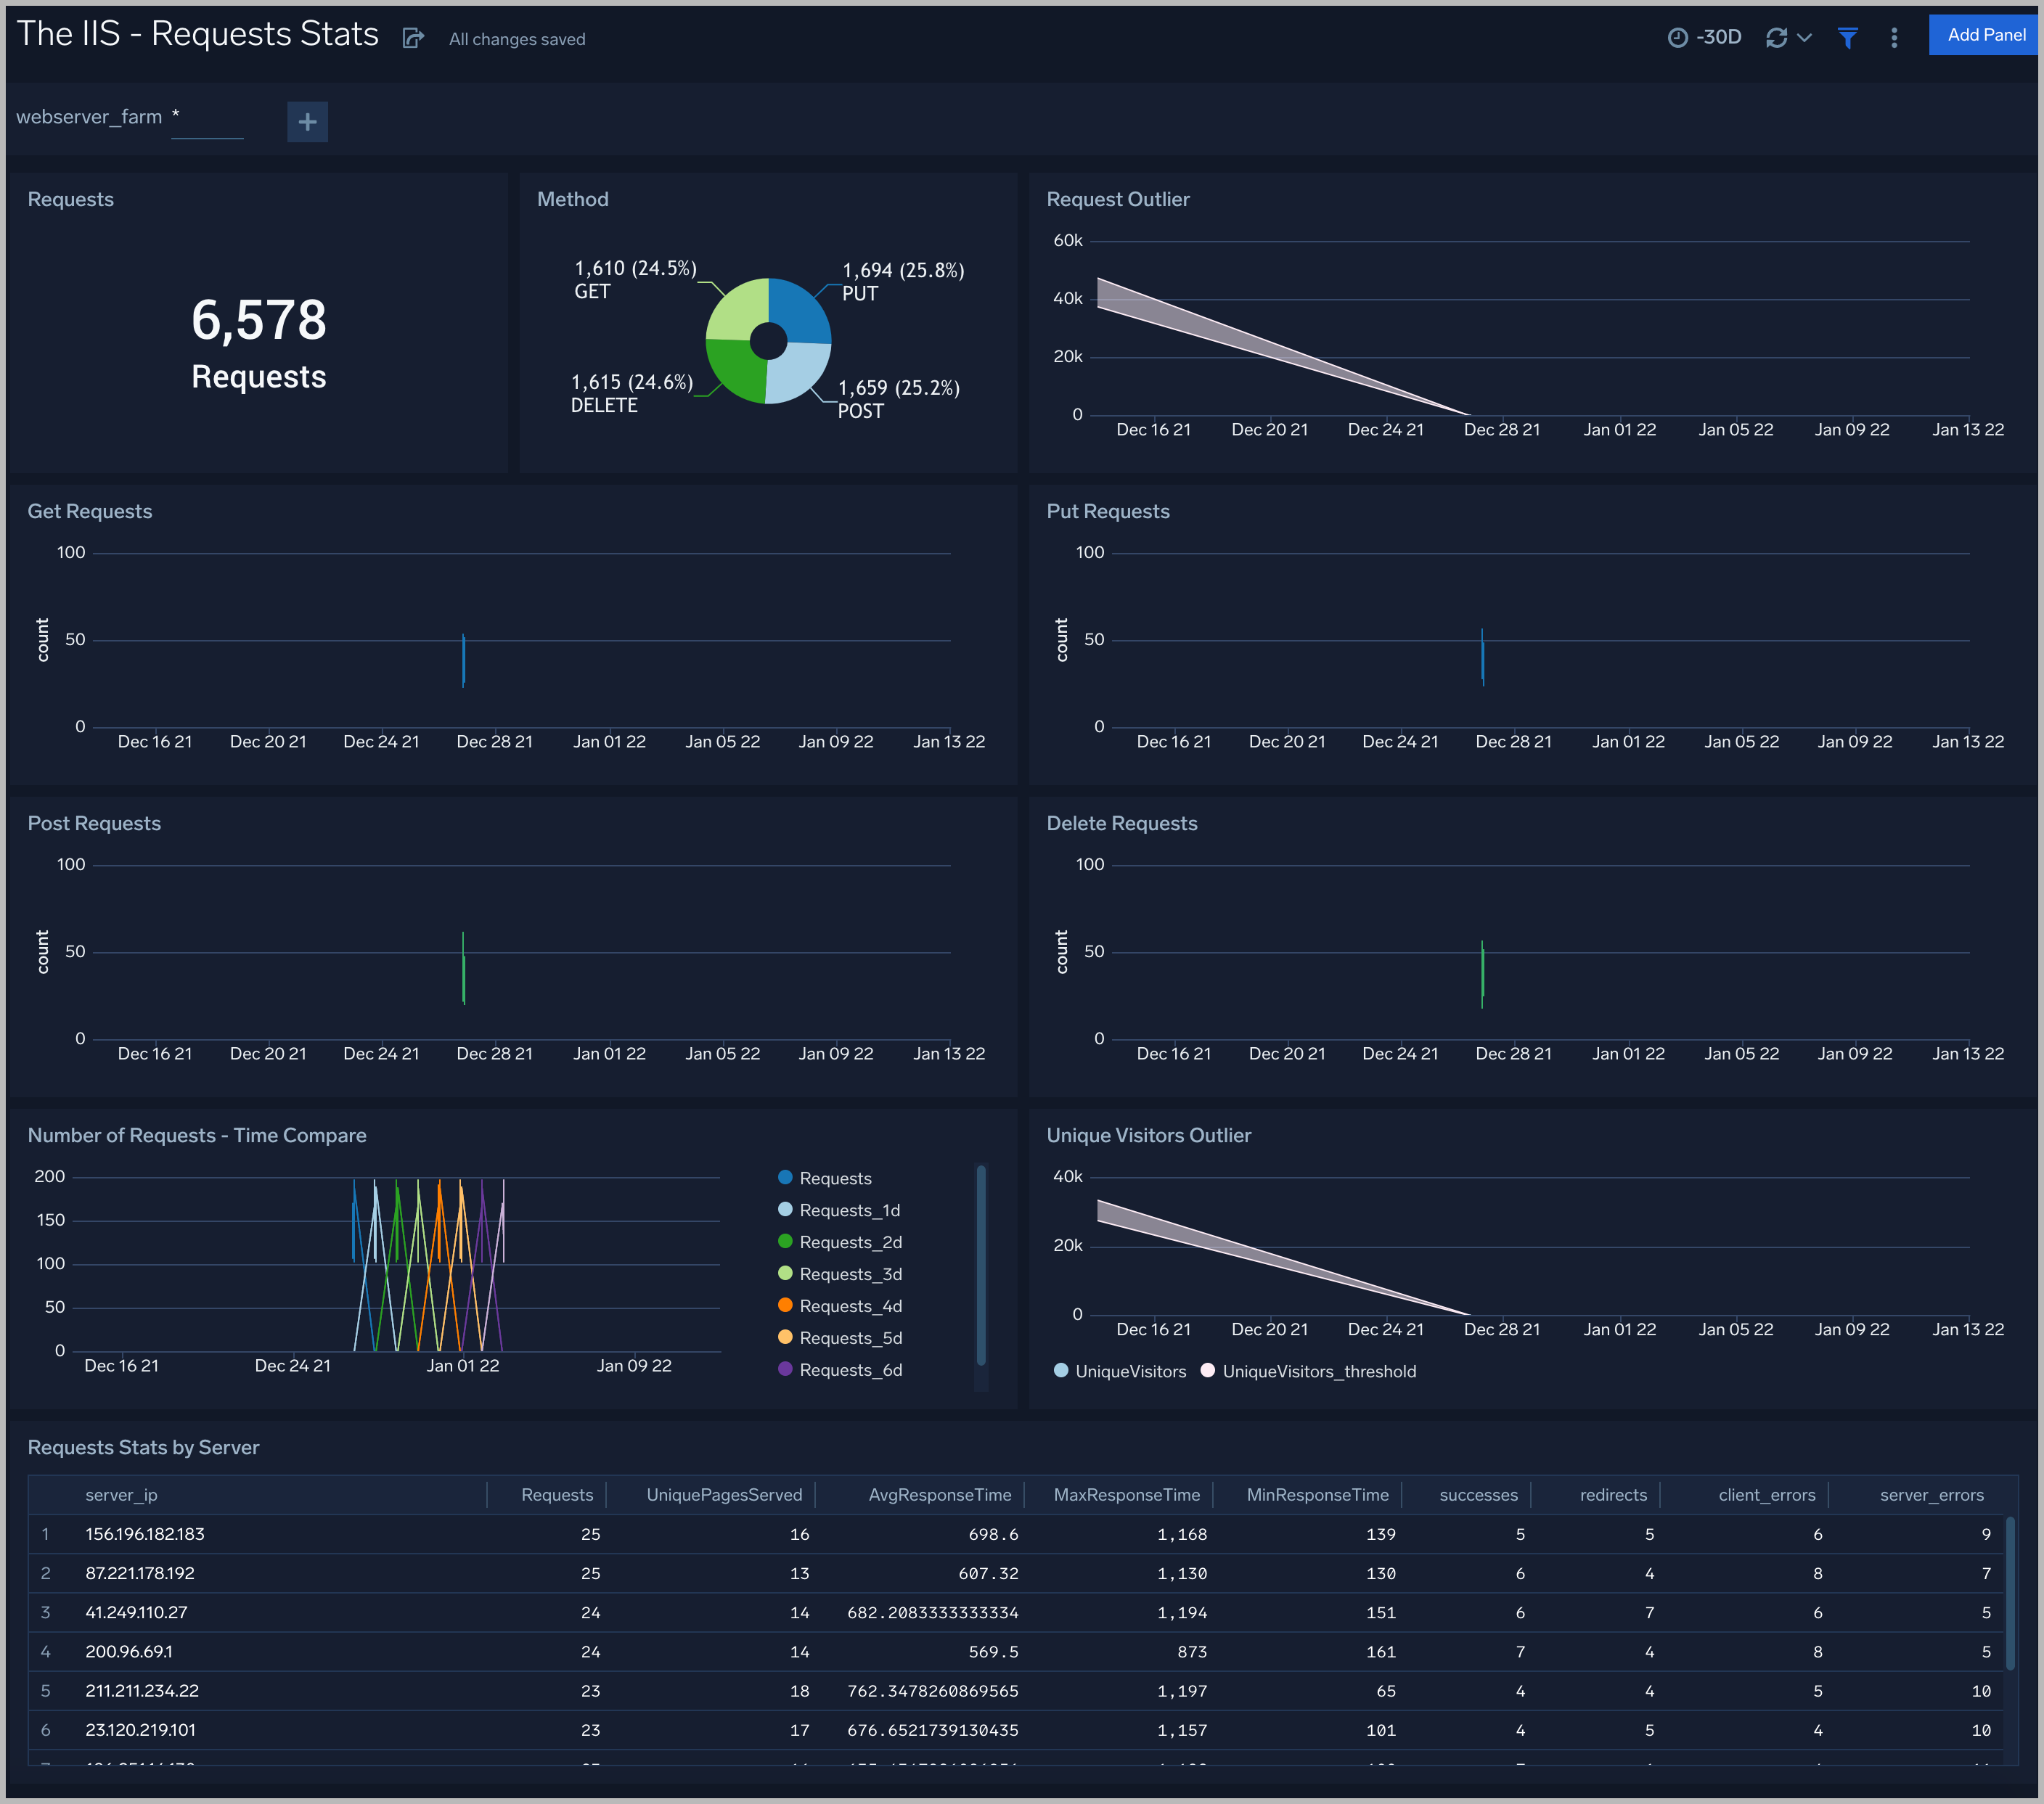
Requests Stats
The IIS - Requests Stats dashboard provides visual graphs and statistics for requests made throughout your IIS infrastructure. Dashboard panels show the number of requests, request methods, request outliers, and requests by server. Panels also show details on GET, PUT, POST, and DELETE requests, as well as requests time compare and unique visitors outlier.
Use this dashboard to:
- Monitor the load on your site for all requests, based on the specific type of HTTP request and by server. This information allows you to efficiently allocate resources.
- Identify outliers in requests.
- Analyze request volume trends against the last 7 days to understand business fluctuations.
- Identify how you are acquiring unique users with unique client outliers, and compare with positive and negative outliers.
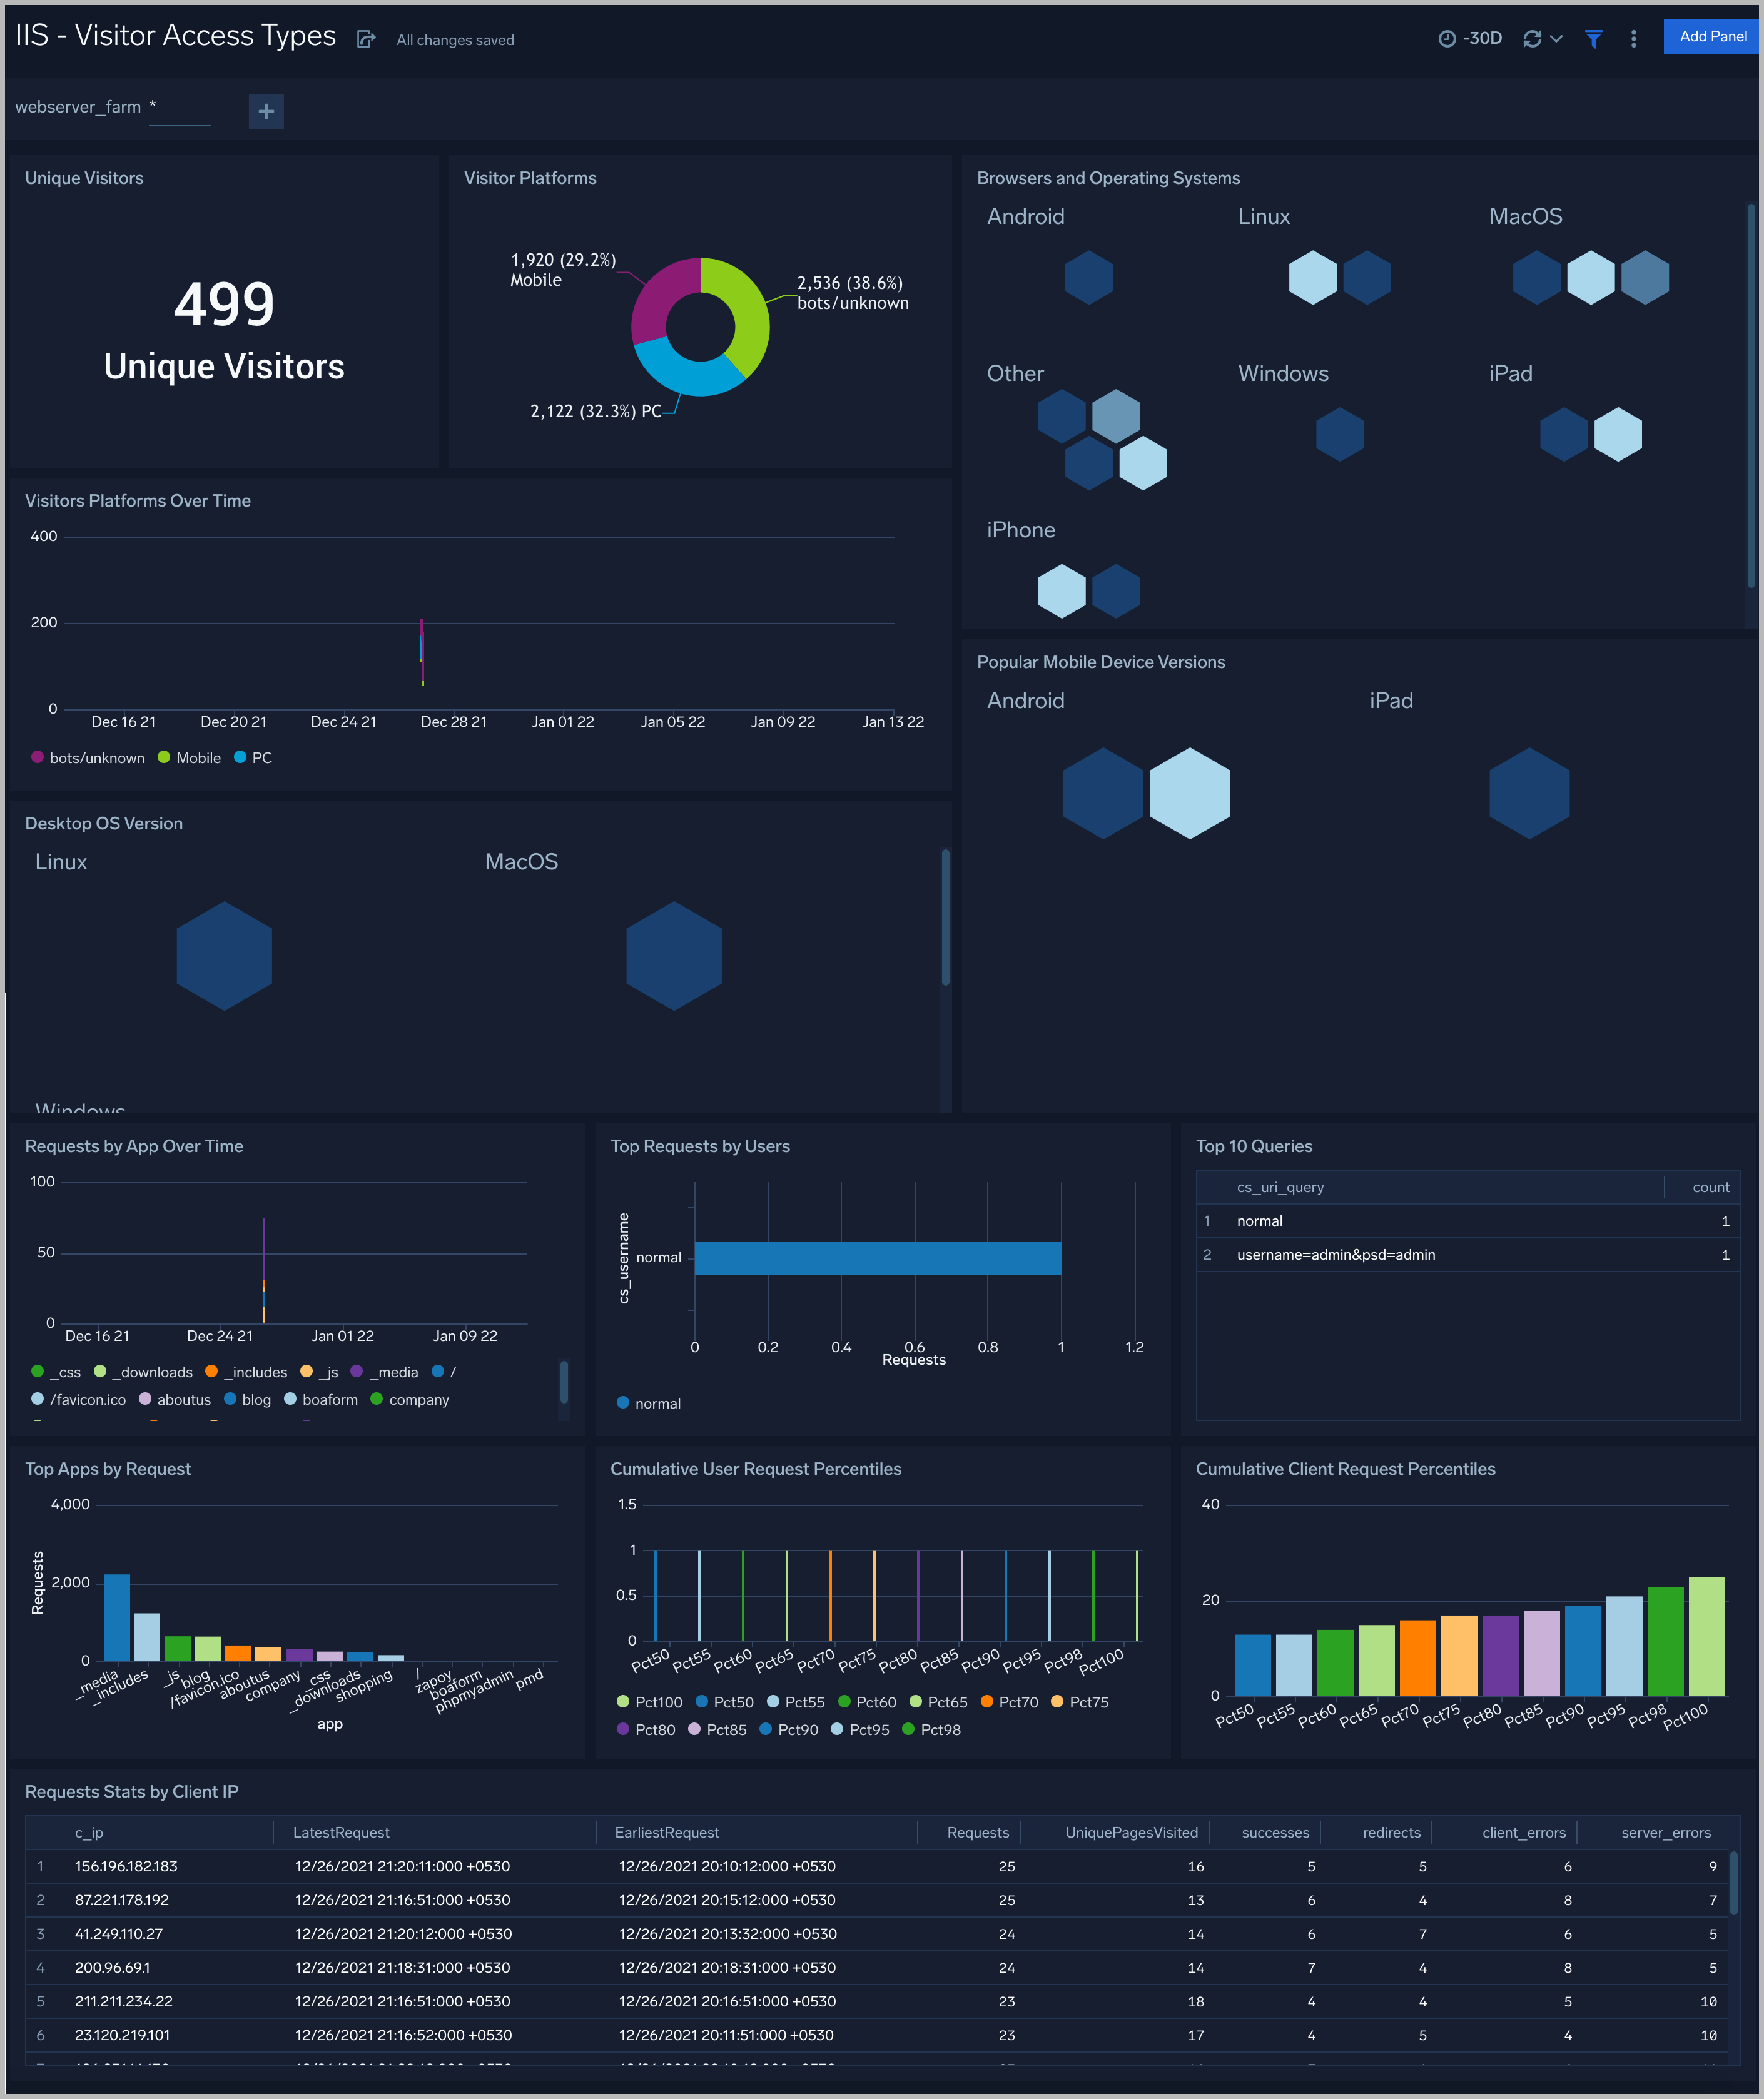
Visitor Access Types
The IIS - Visitor Access Types Dashboard provides insights into visitor platform types, browsers, and operating systems, as well as the most popular mobile devices, PC and Mac versions used.
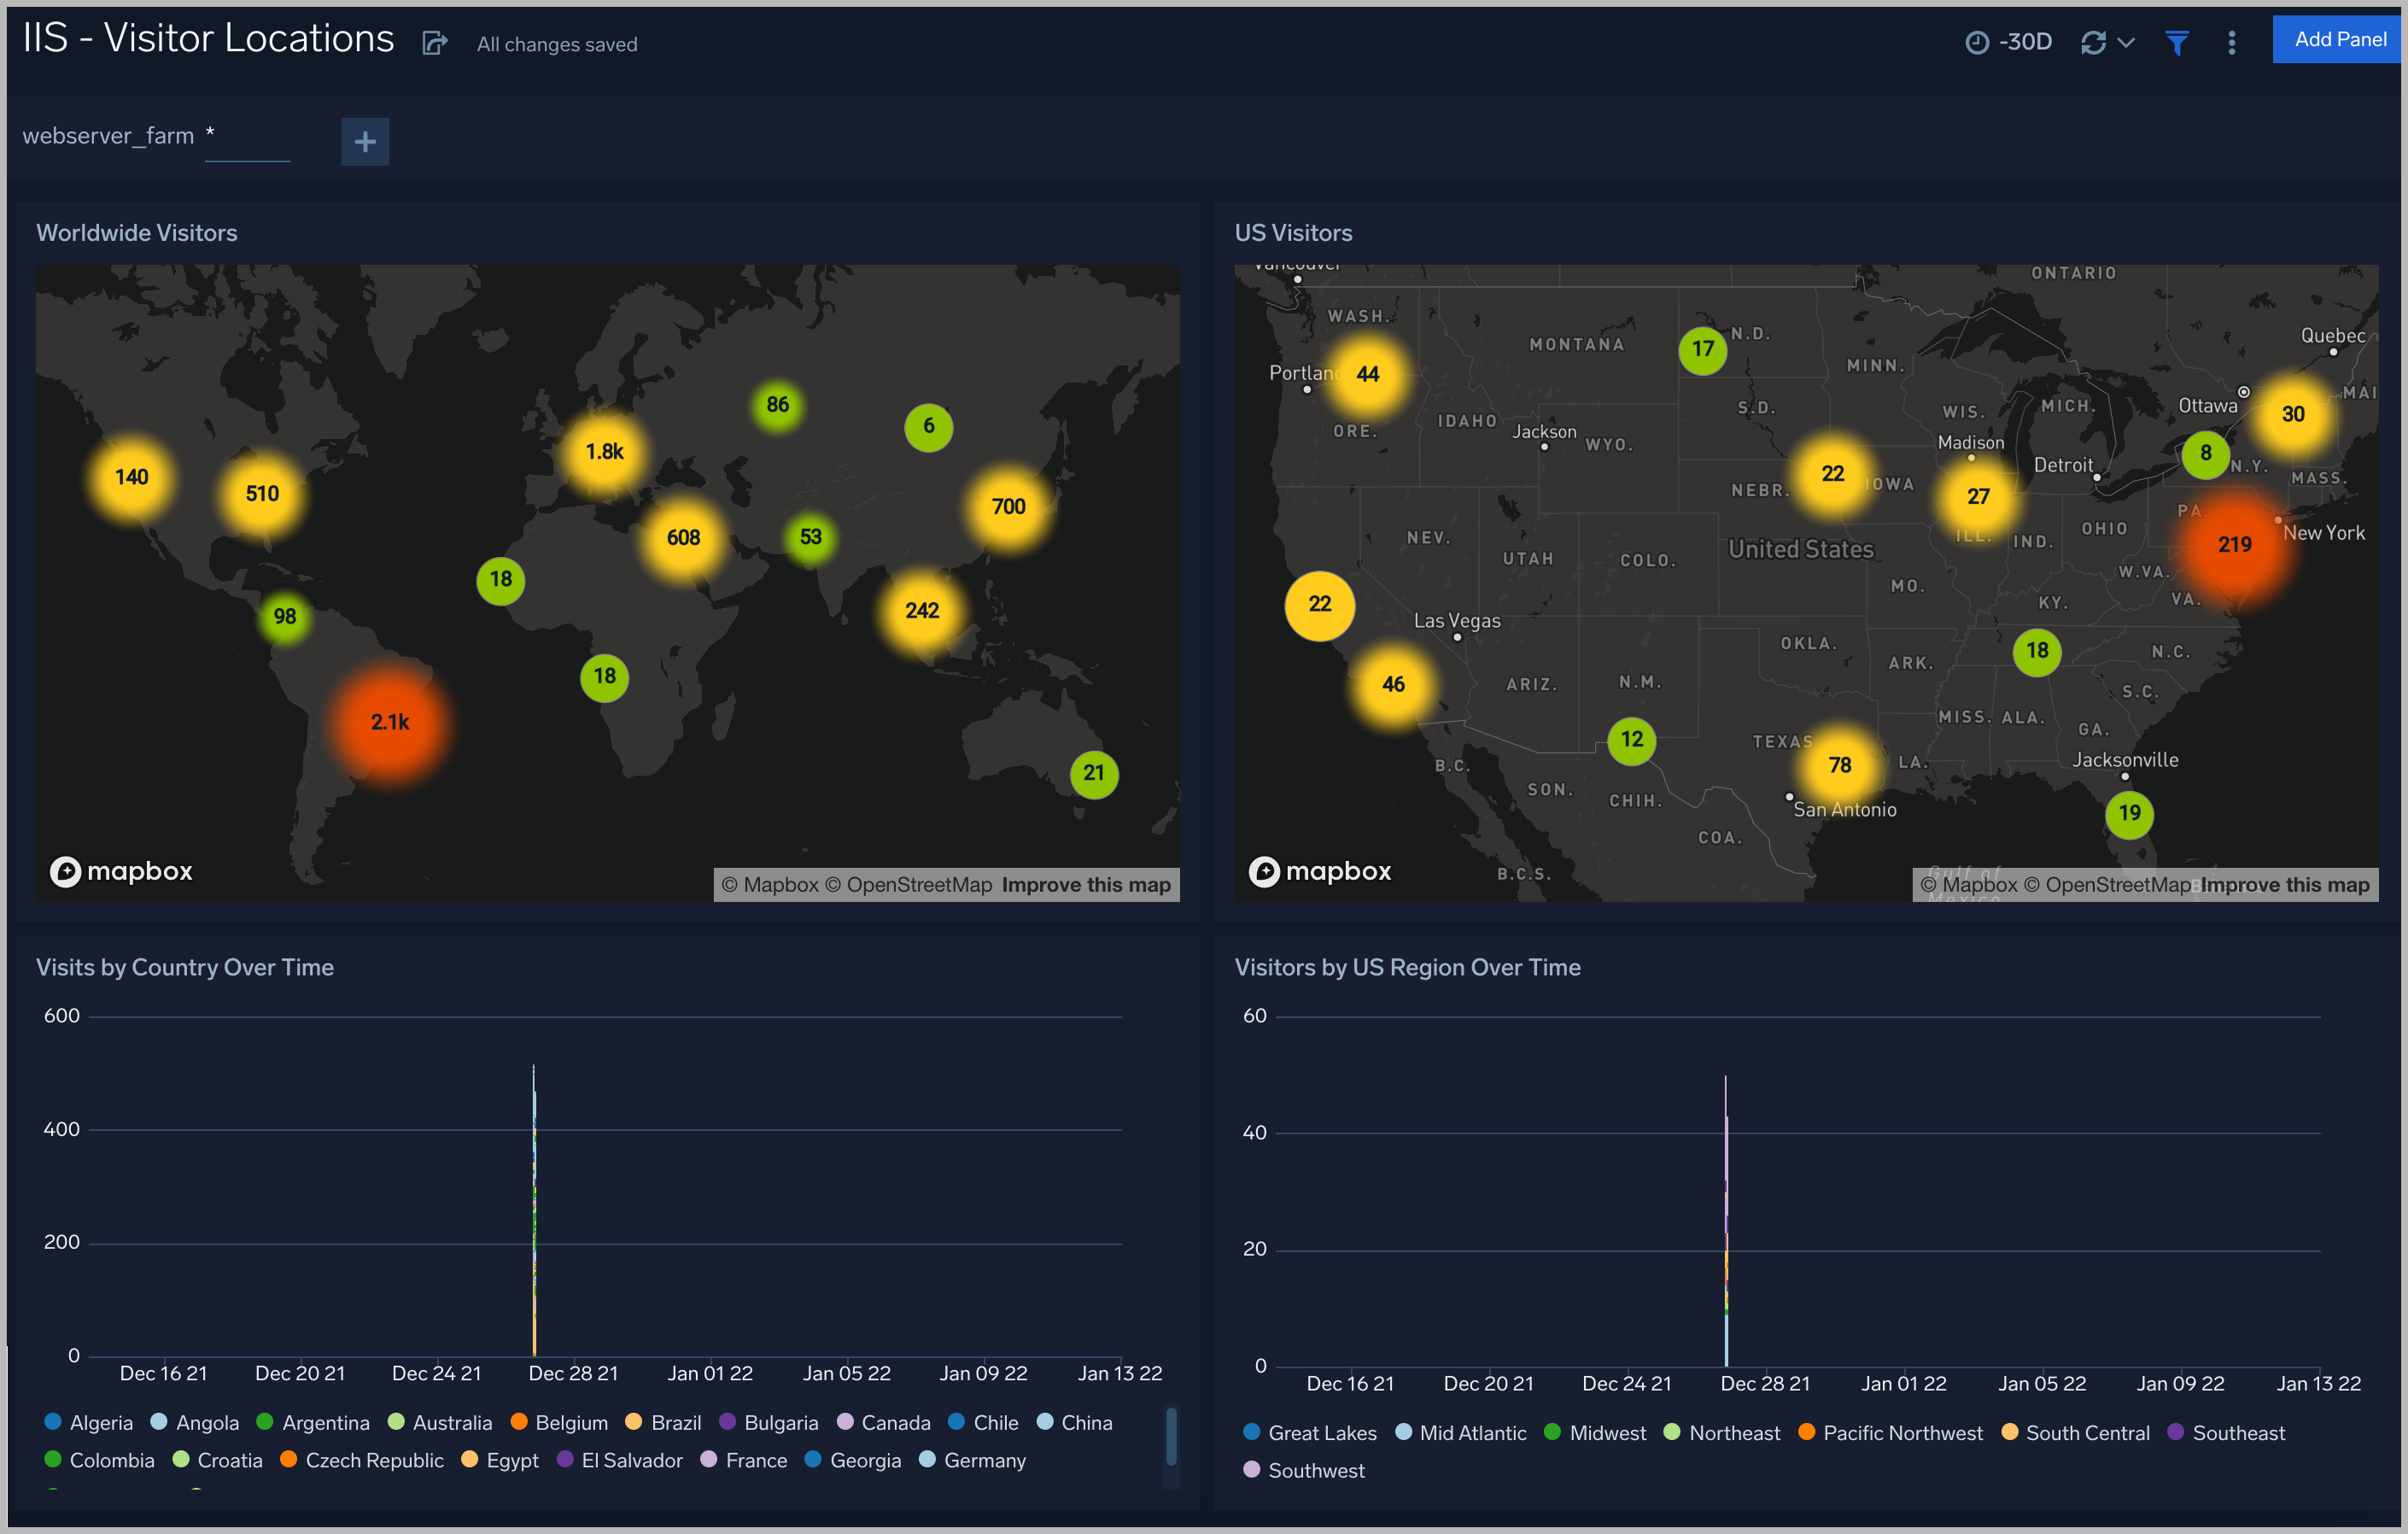
Visitor Locations
The IIS - Visitor Locations Dashboard provides a high-level view of Nginx visitor geographic locations both worldwide and in the United States. Dashboard panels also show graphic trends for visits by country over time and visits by US region over time.
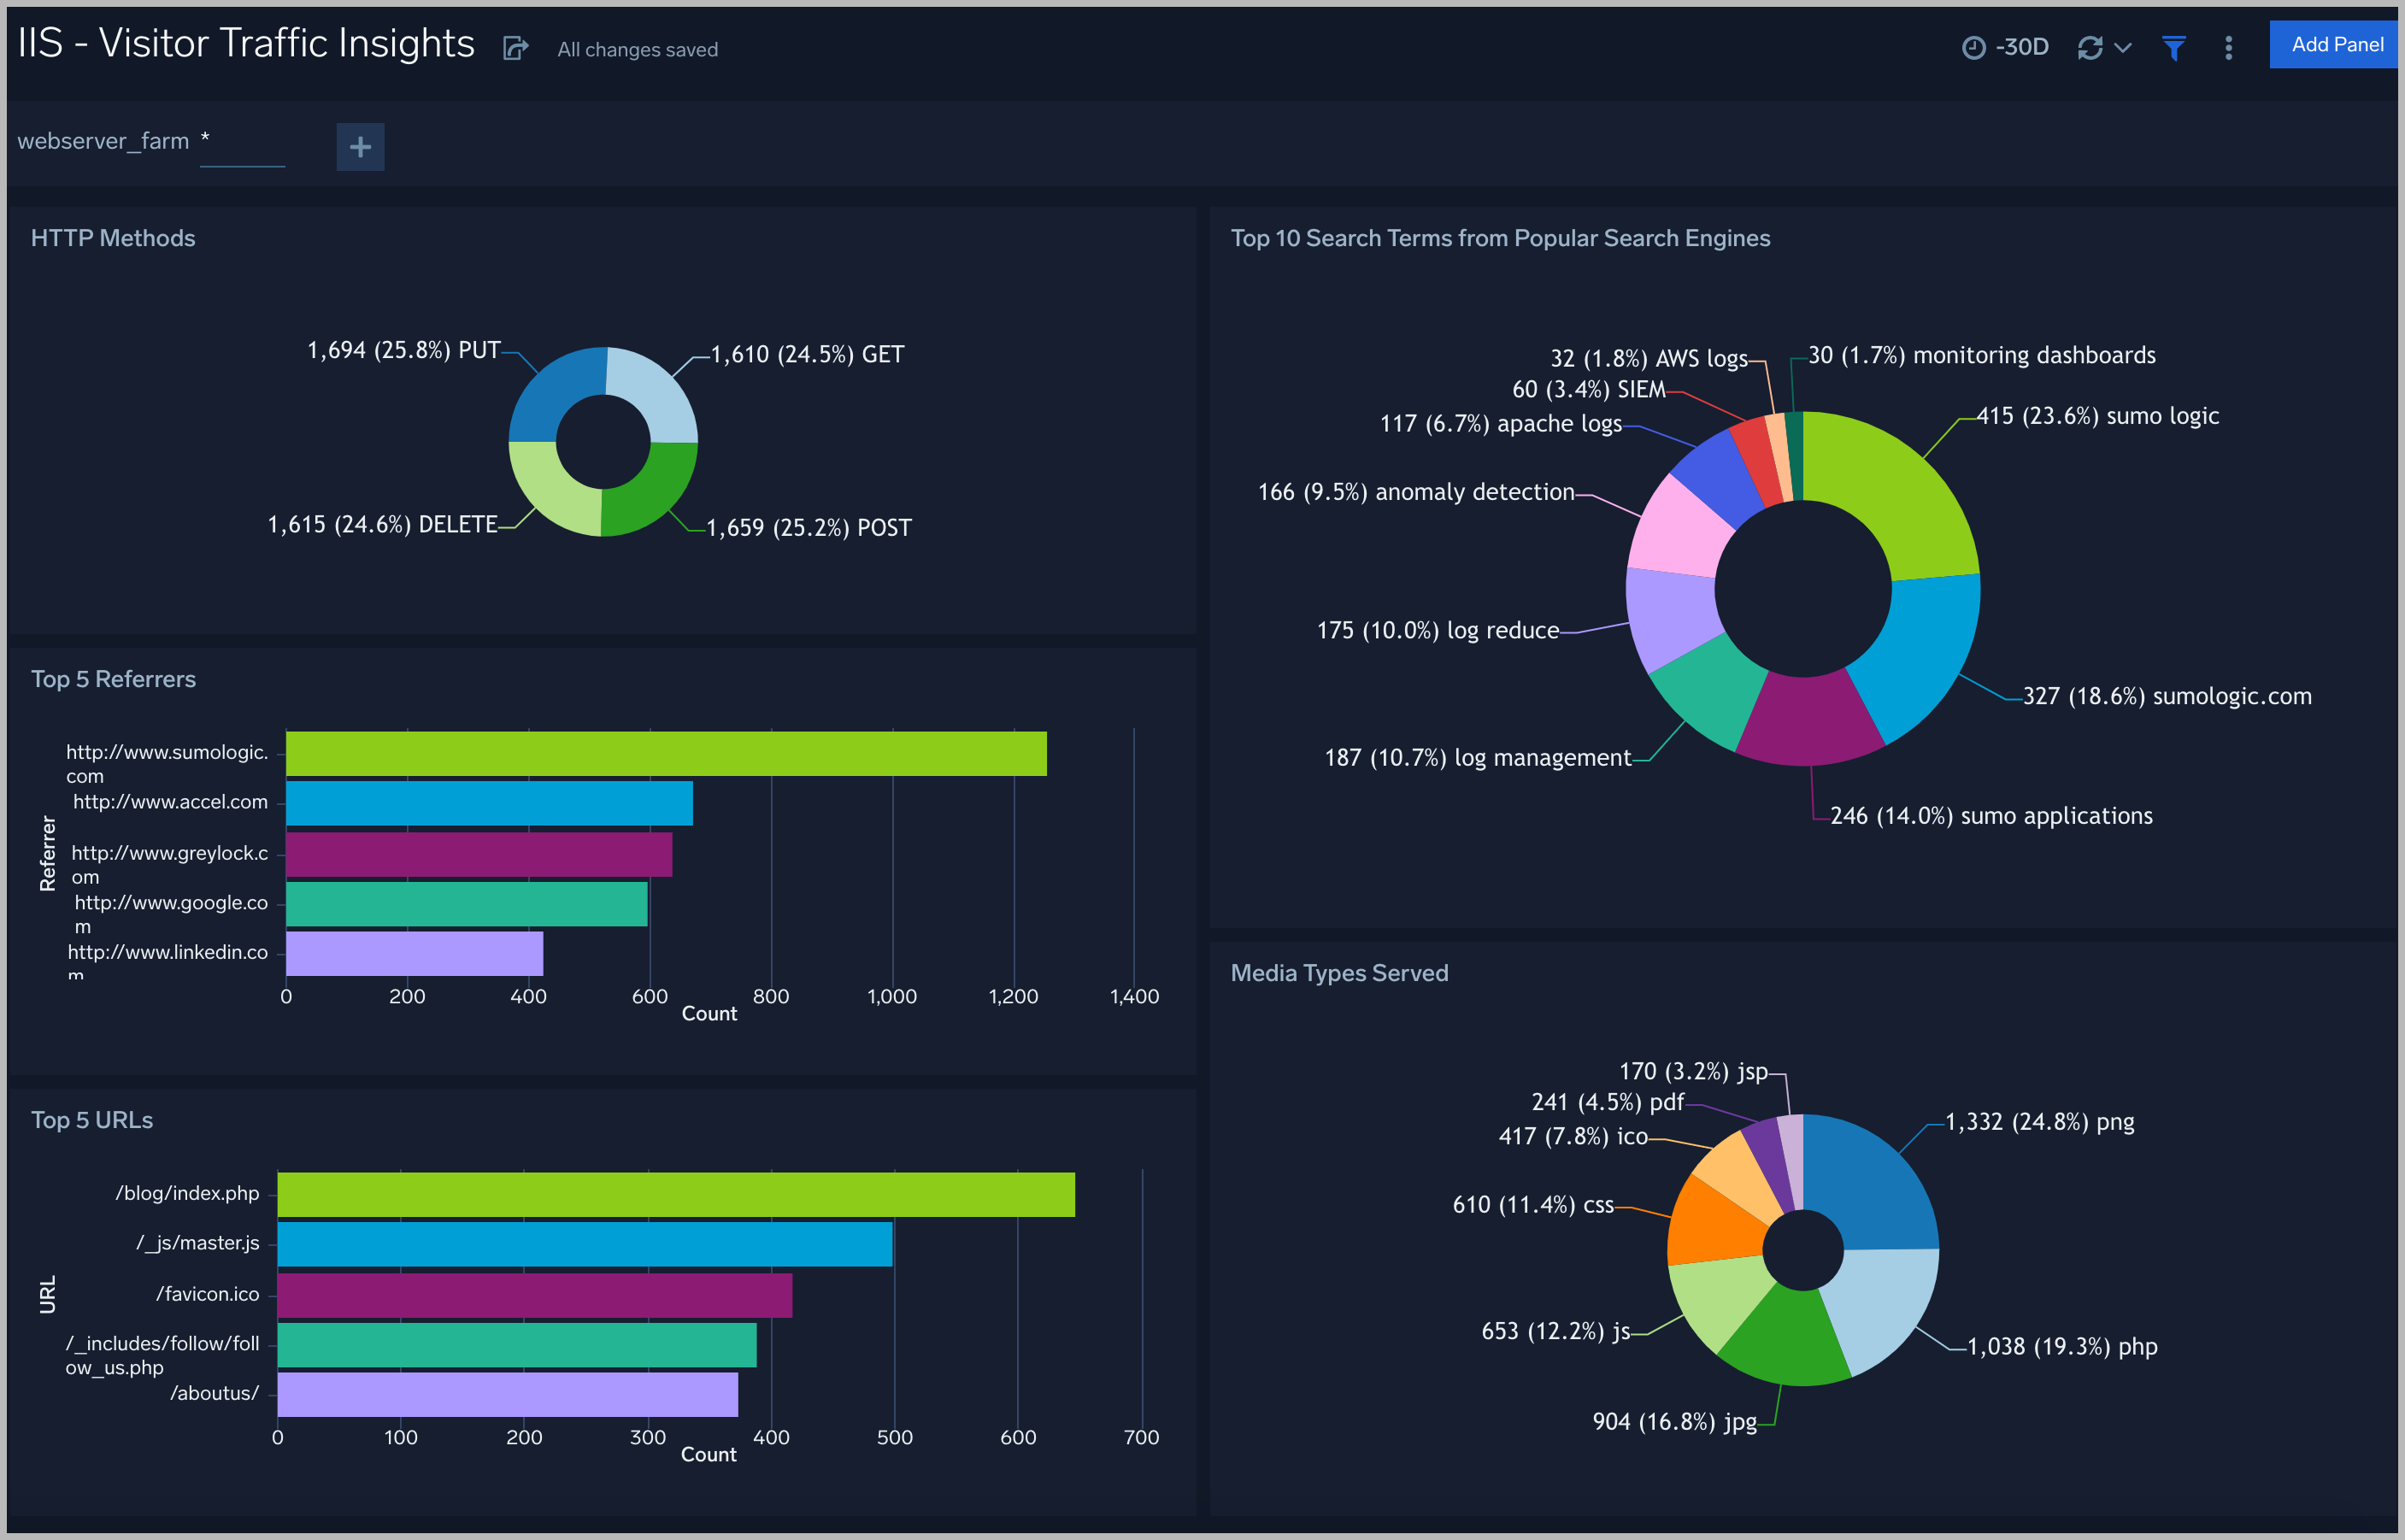
Visitor Traffic Insights
The IIS - Visitor Traffic Insights Dashboard provides detailed information on the top documents accessed, top referrers, top search terms from popular search engines, and the media types served.
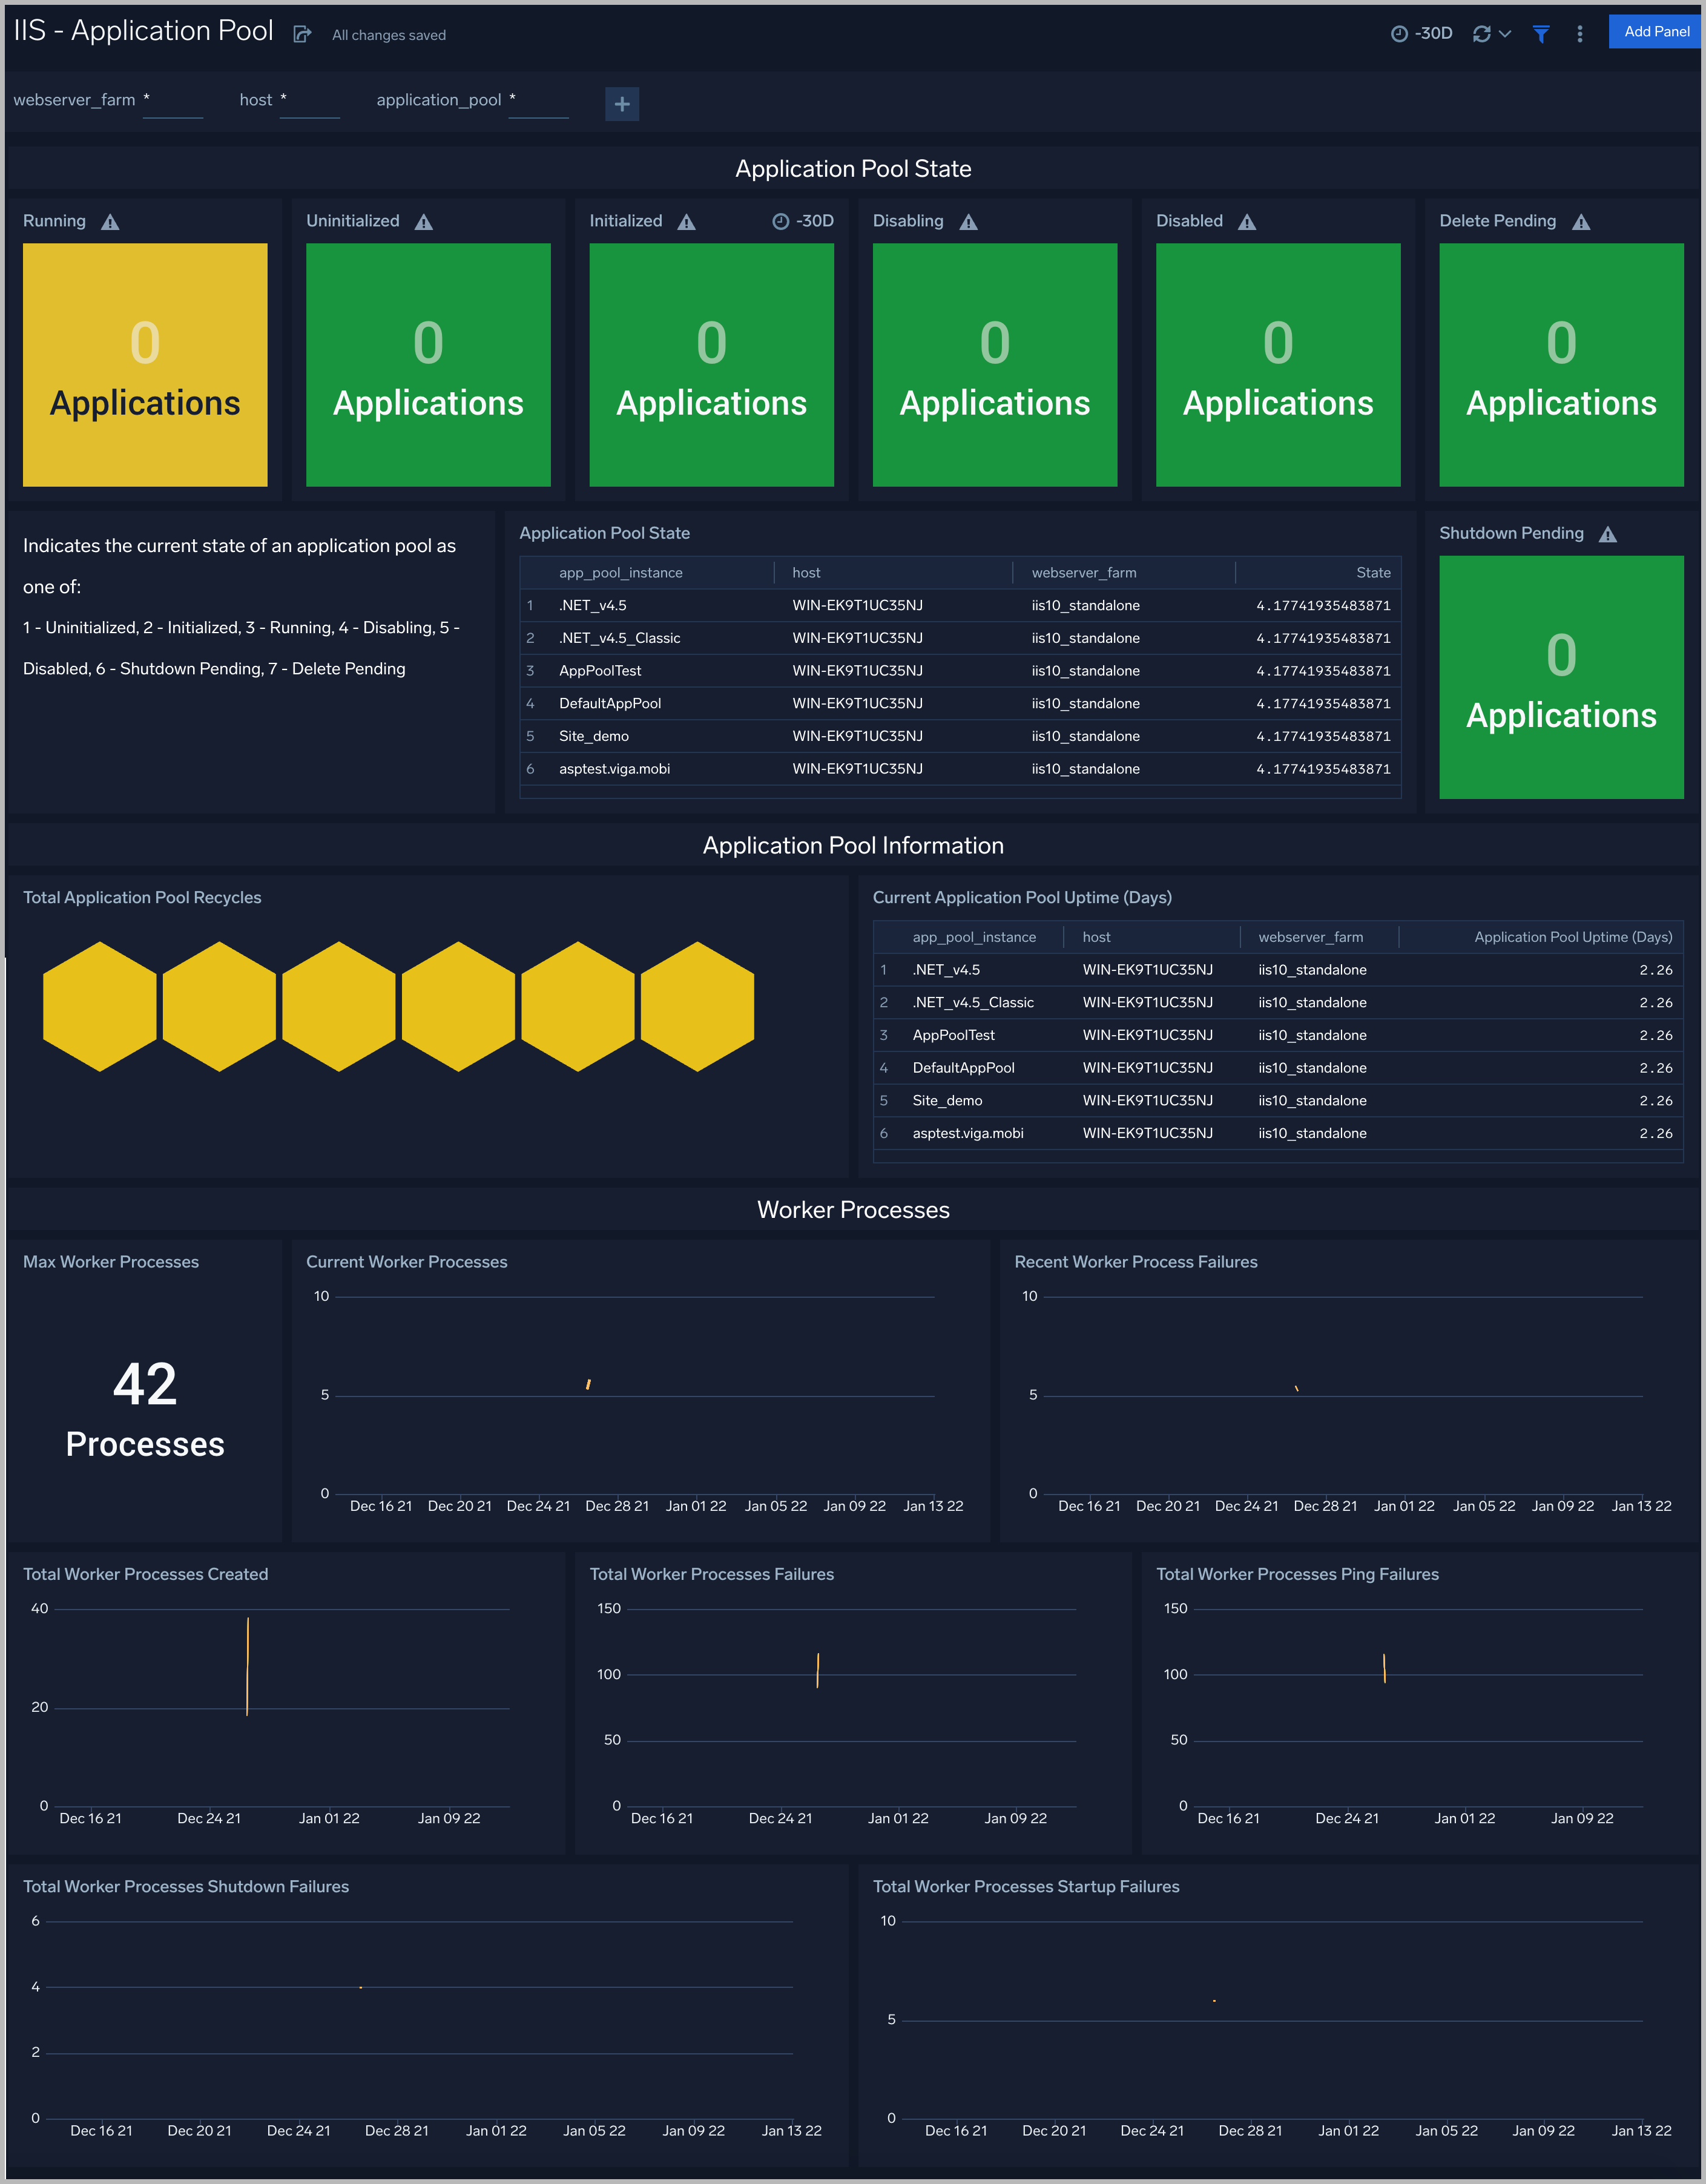
Application Pool
The IIS - Application Pool dashboard provides a high-level view of the Application Pool State, Information, and Worker Process Metrics.
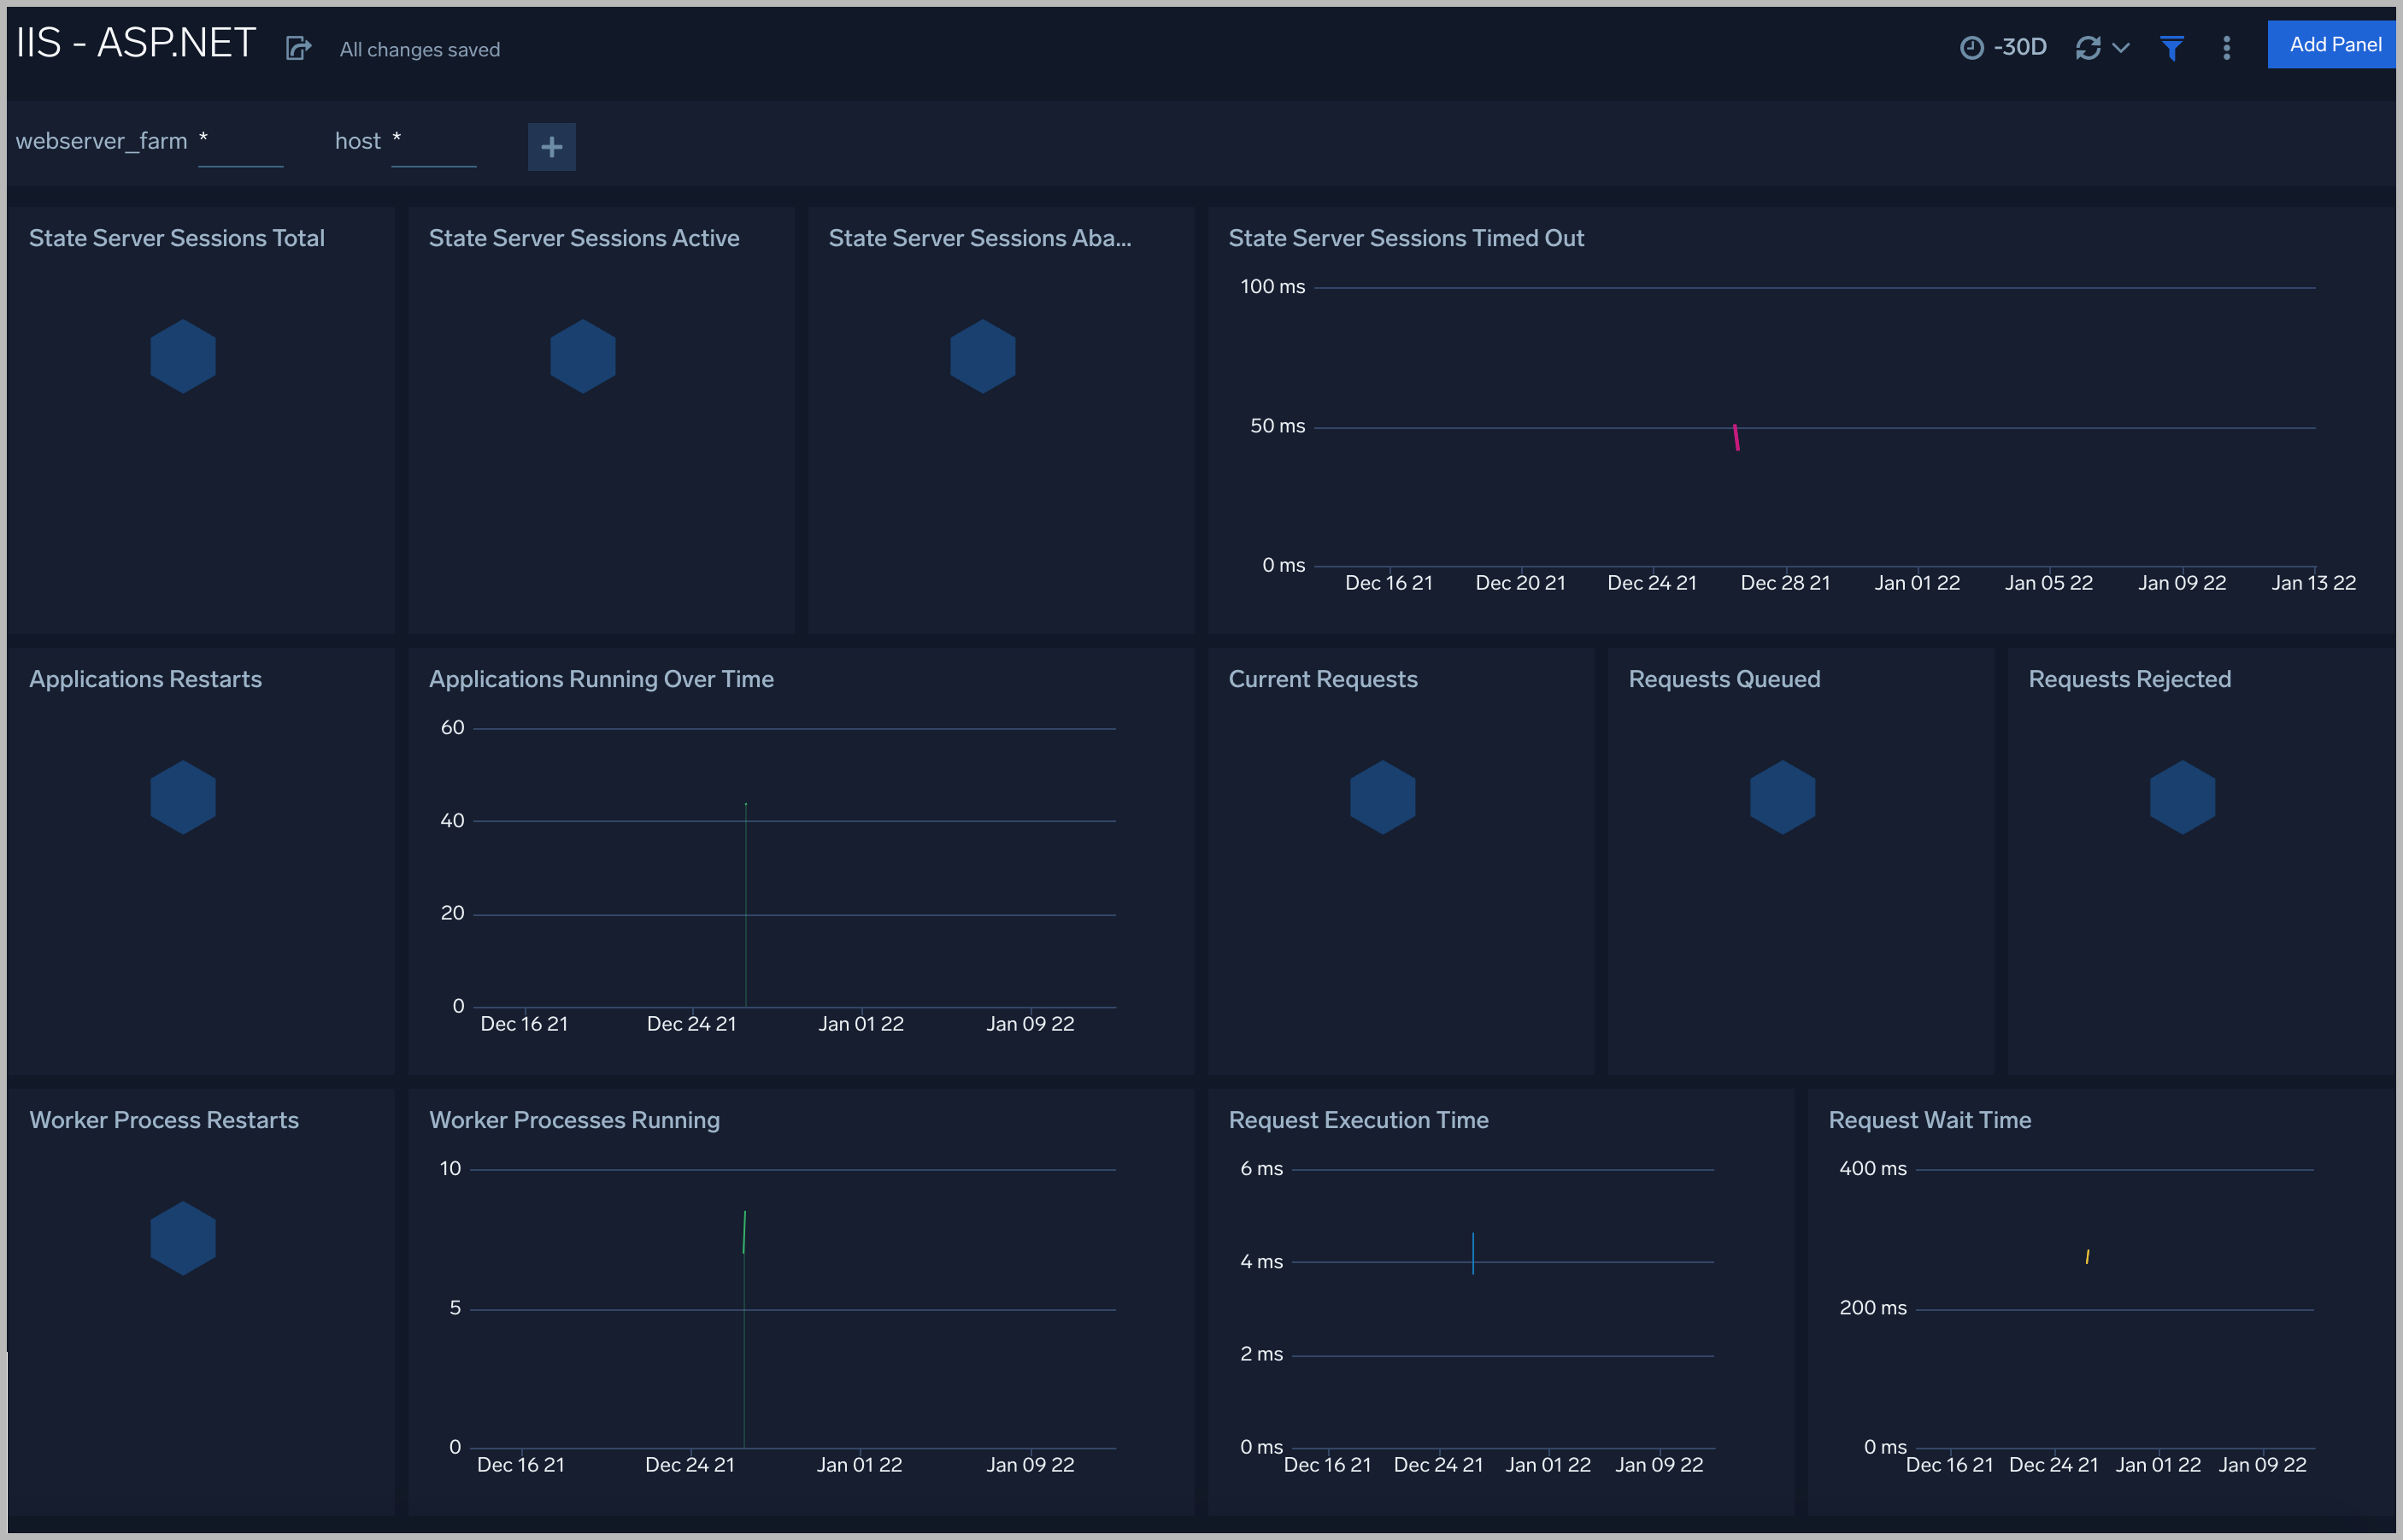
ASP.NET
The IIS - ASP.NET dashboard provides a high-level view of the ASP.NET global performance counters.
Use this dashboard to:
- Analyze State Server Sessions.
- Monitor the Application Information.
- Understand Request execution and wait time.
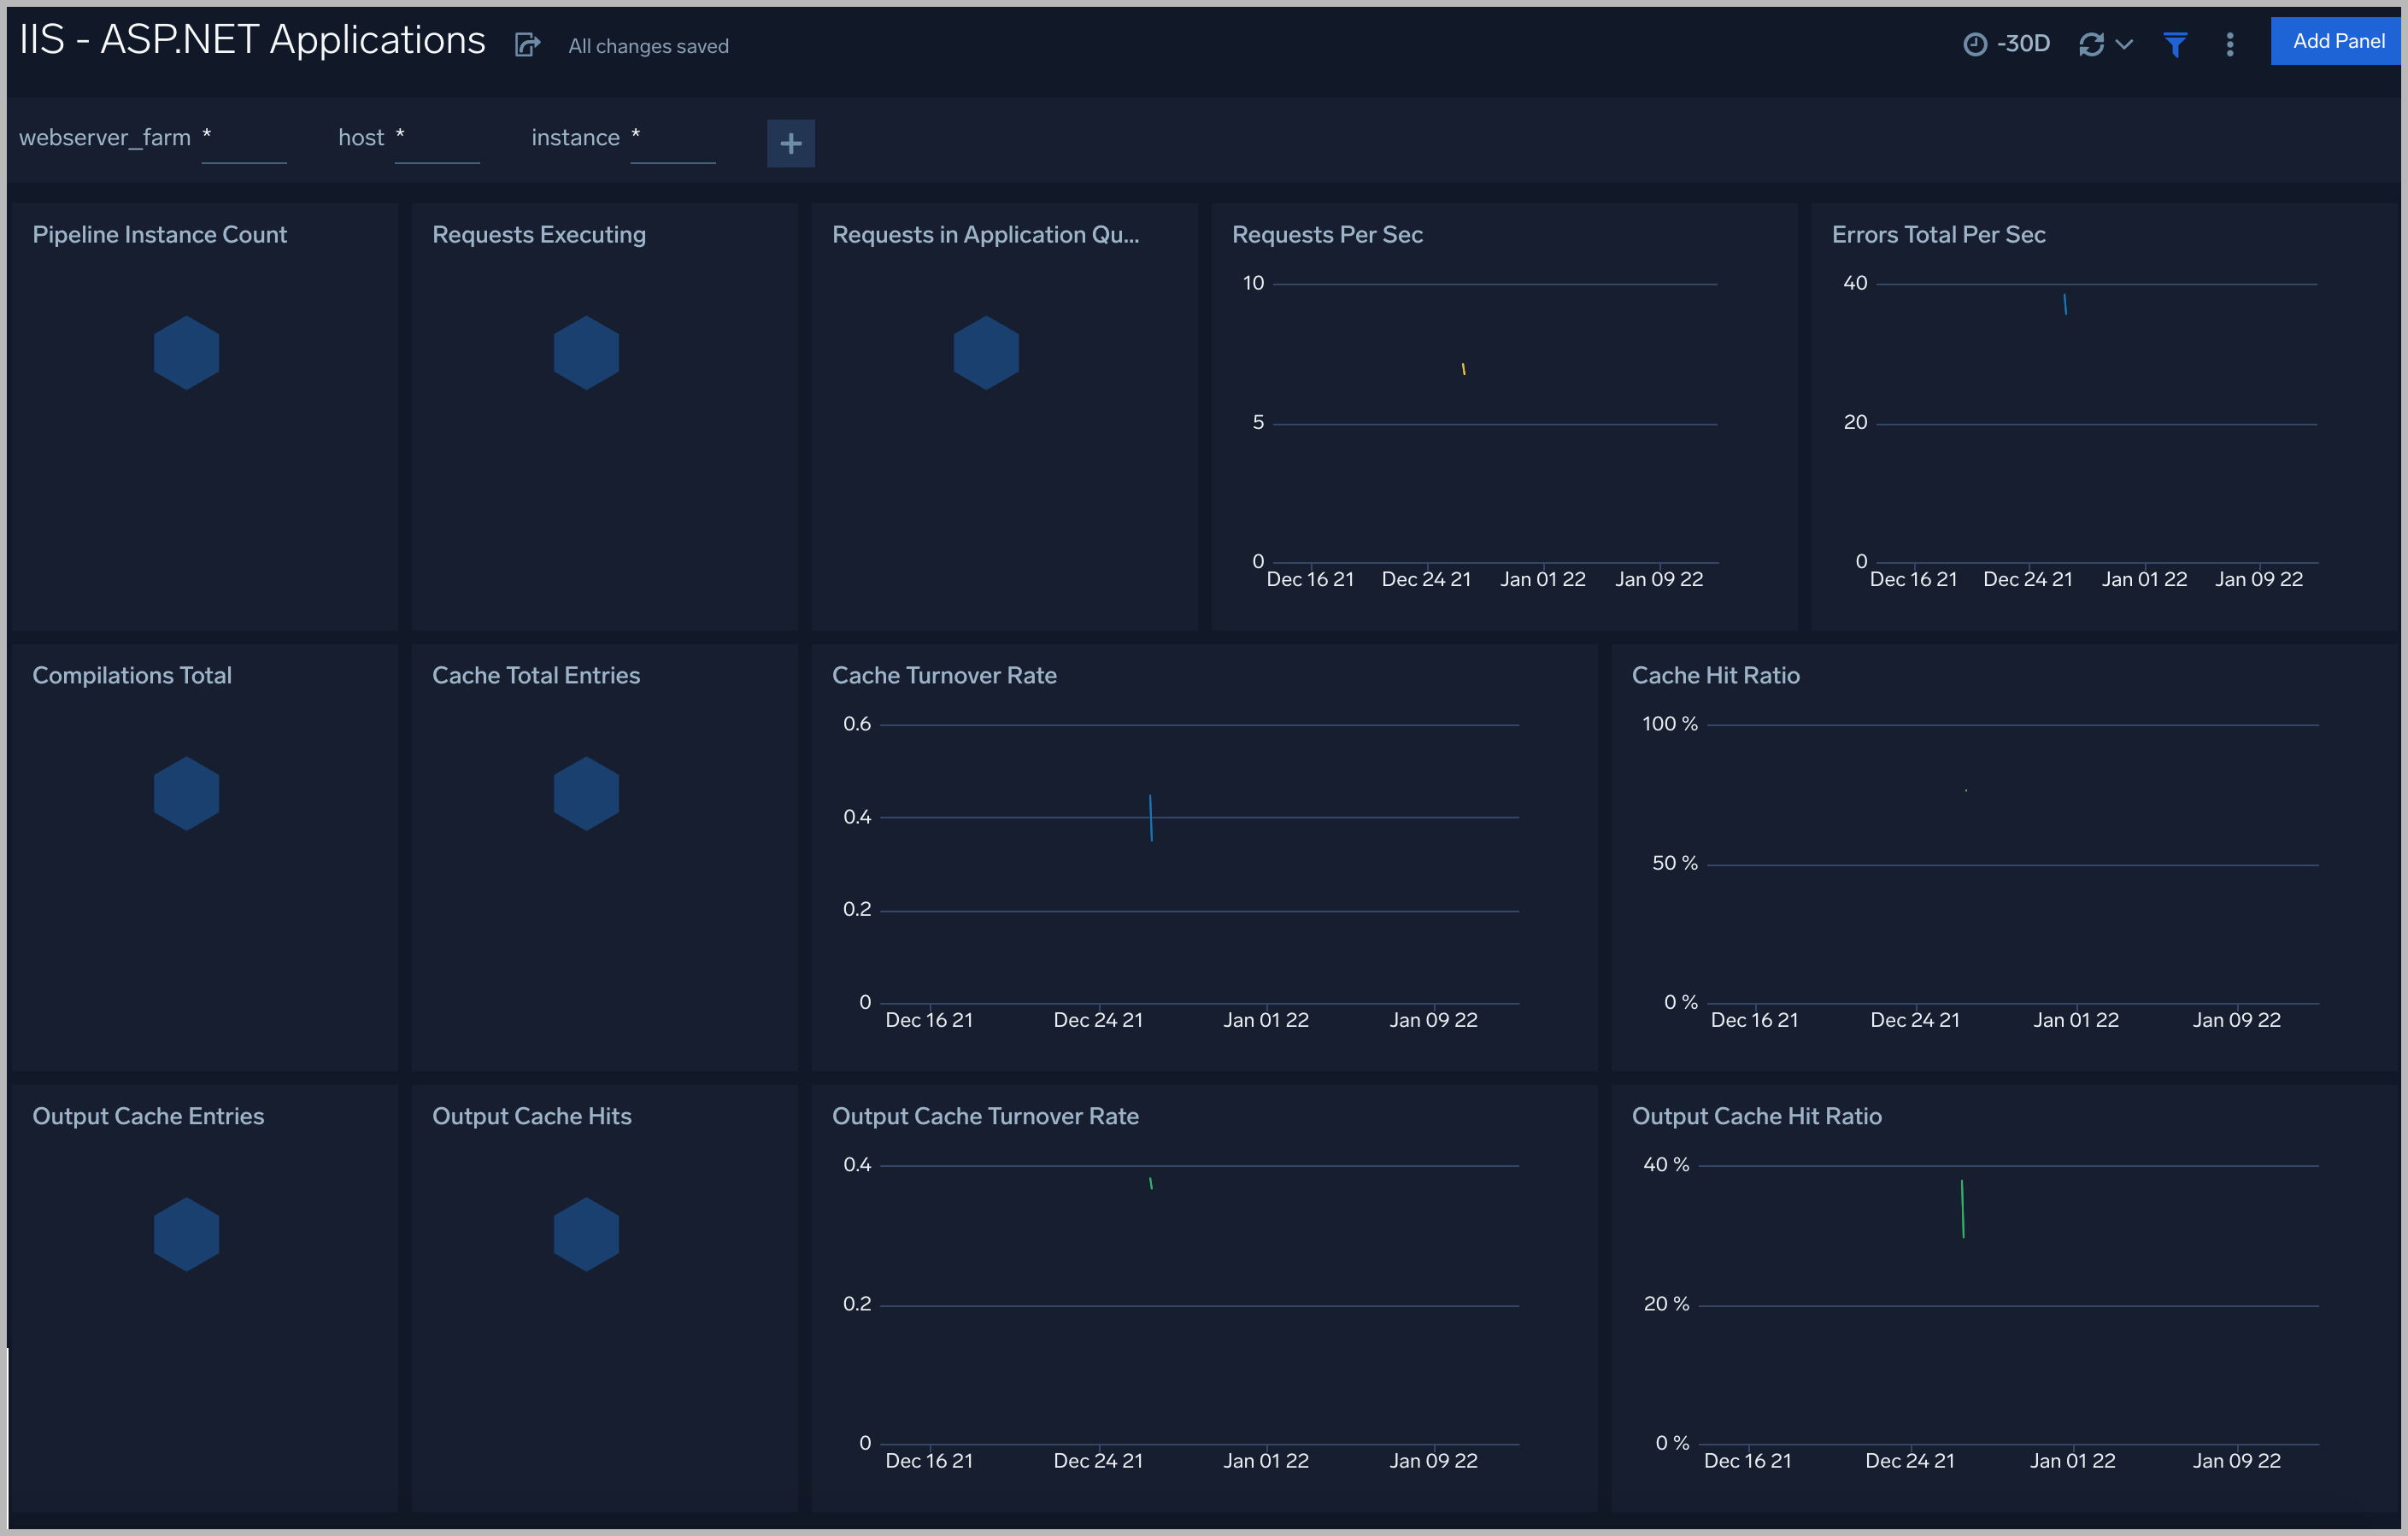
ASP.NET Applications
The IIS - ASP.NET Applications dashboard provides a high-level view of the ASP.NET application performance counters.
Use this dashboard to monitor the following key metrics:
- Compilations
- Errors
- Cache
- Requests Executing
- Requests in the Application Queue
- Pipeline Instance Count
- Output Cache
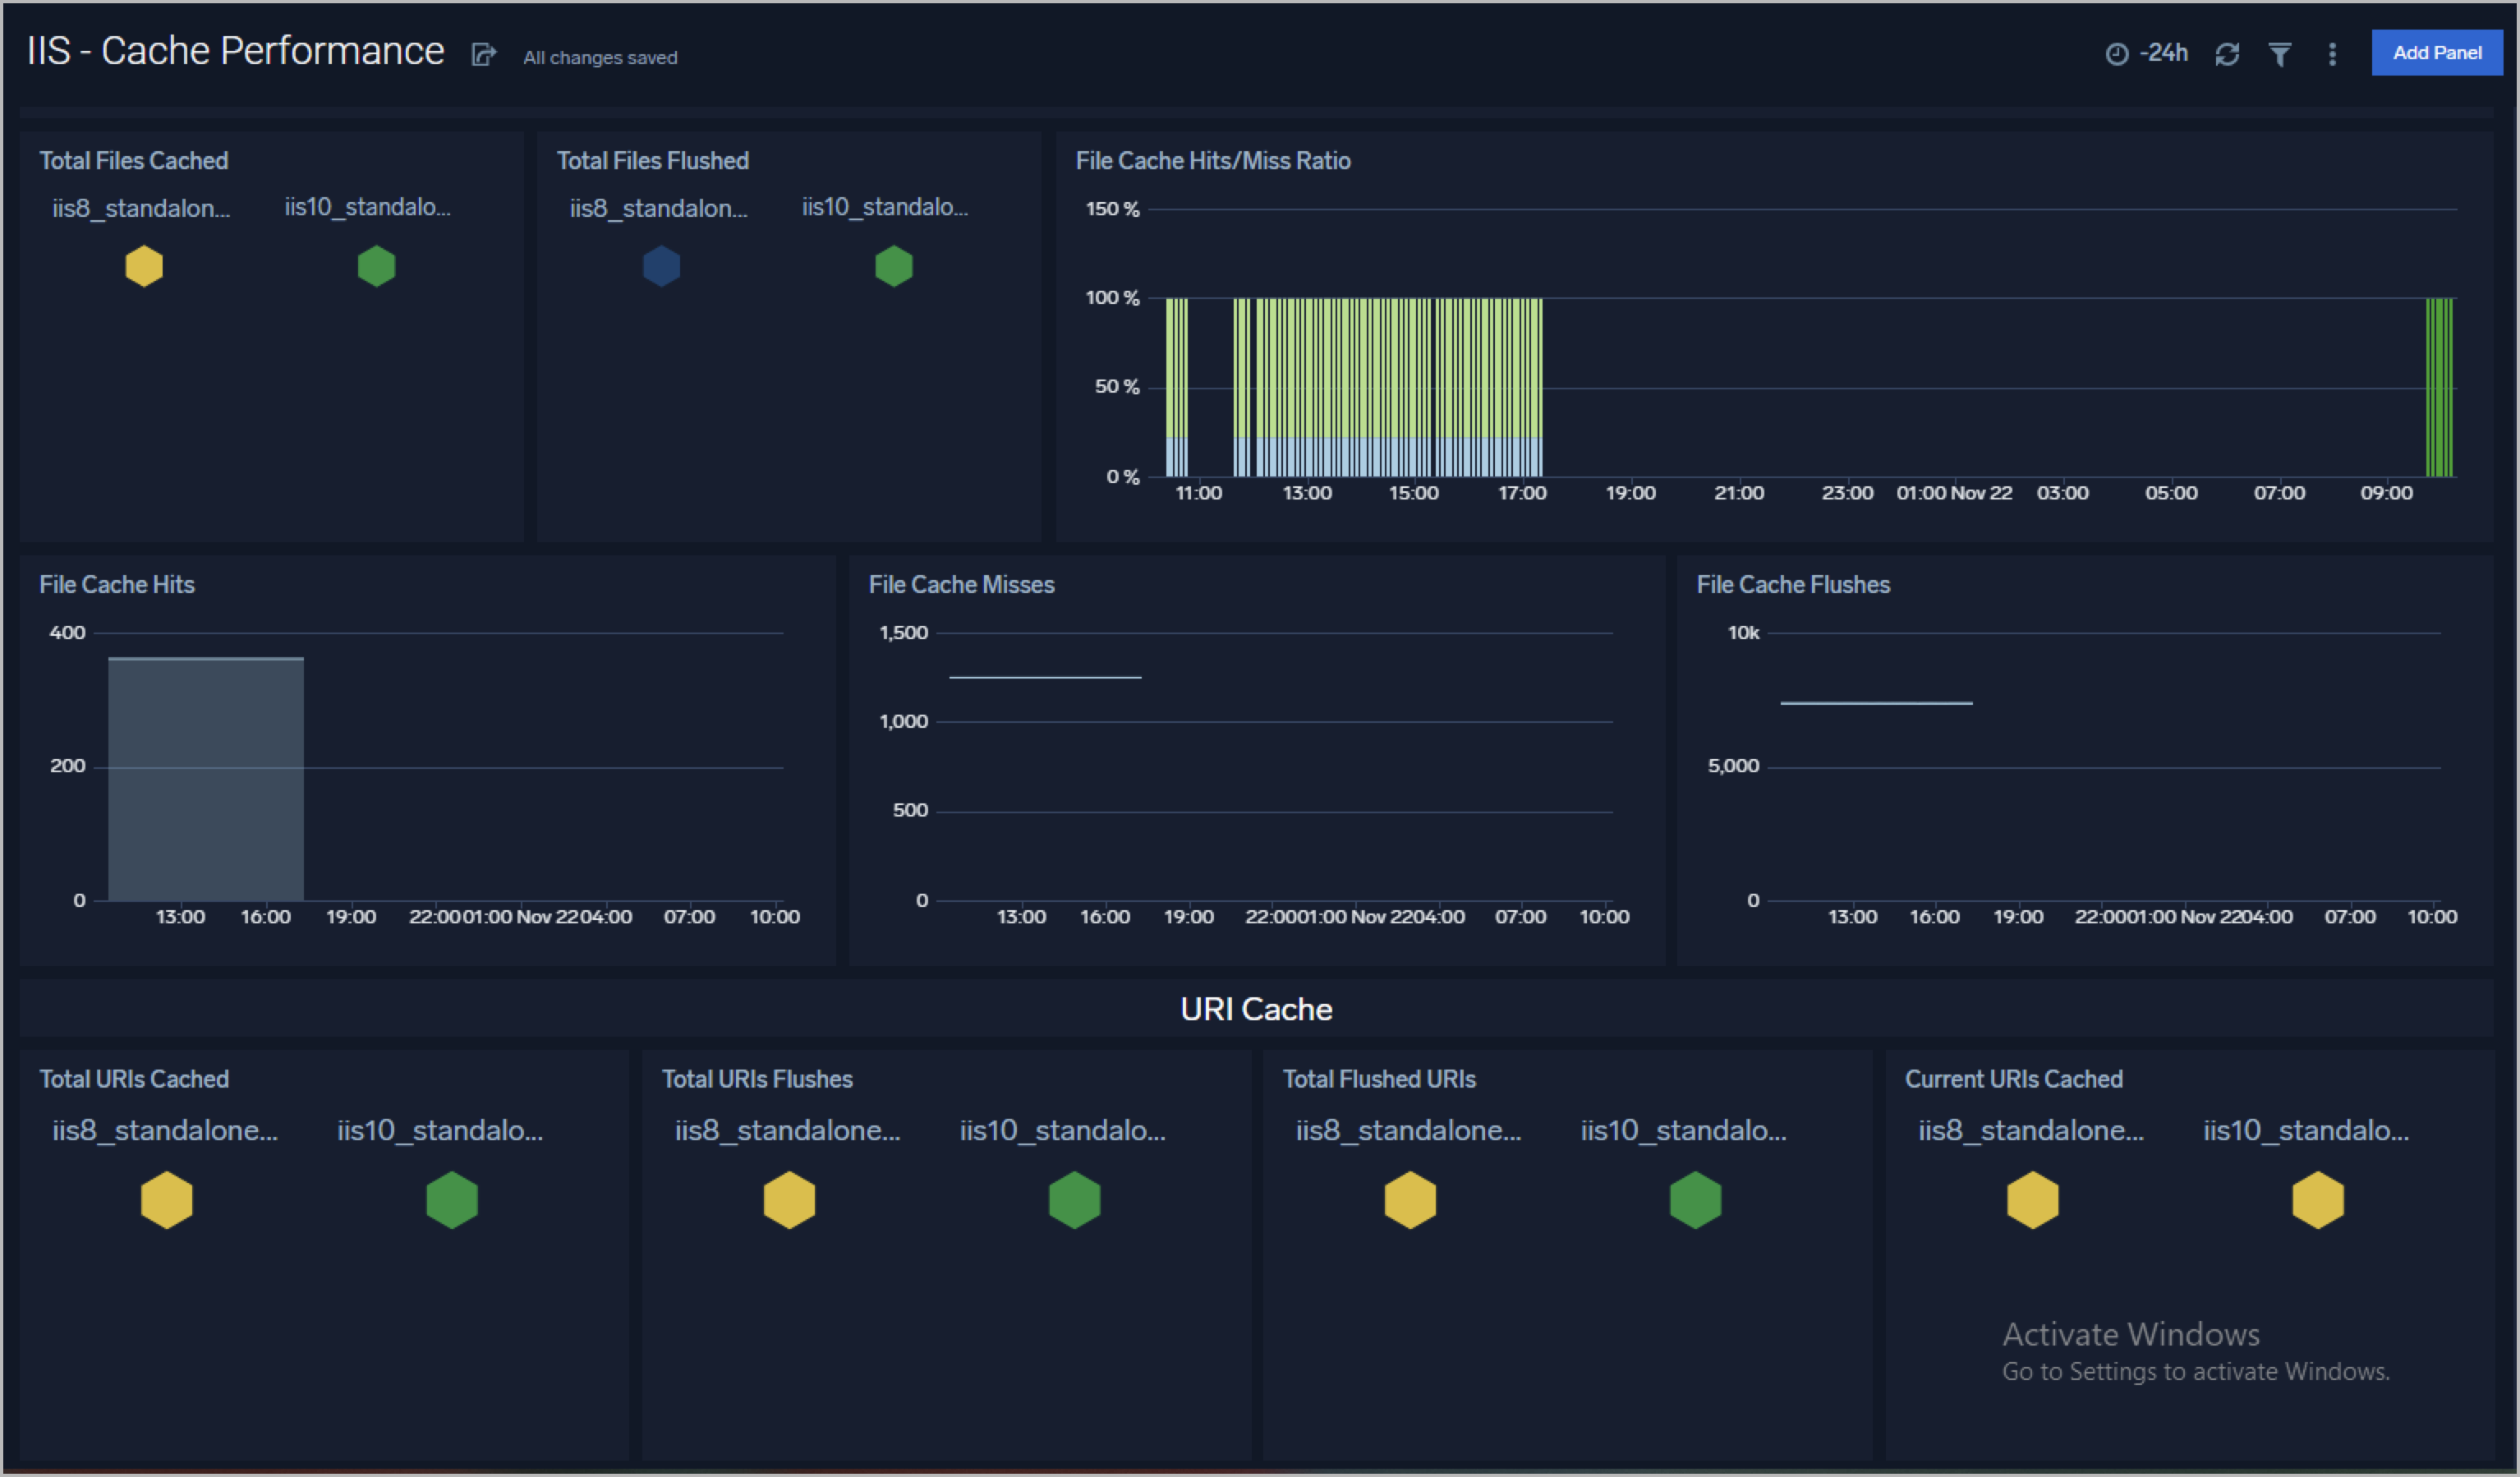
Cache Performance
The IIS - Cache Performance dashboard provides a high-level view of the Web Service Cache Counters object including cache counters specific to the World Wide Web Publishing Service.
Use this dashboard to monitor the following key metrics:
- Output Cache
- Cache Memory
- File Cache
- URI Cache
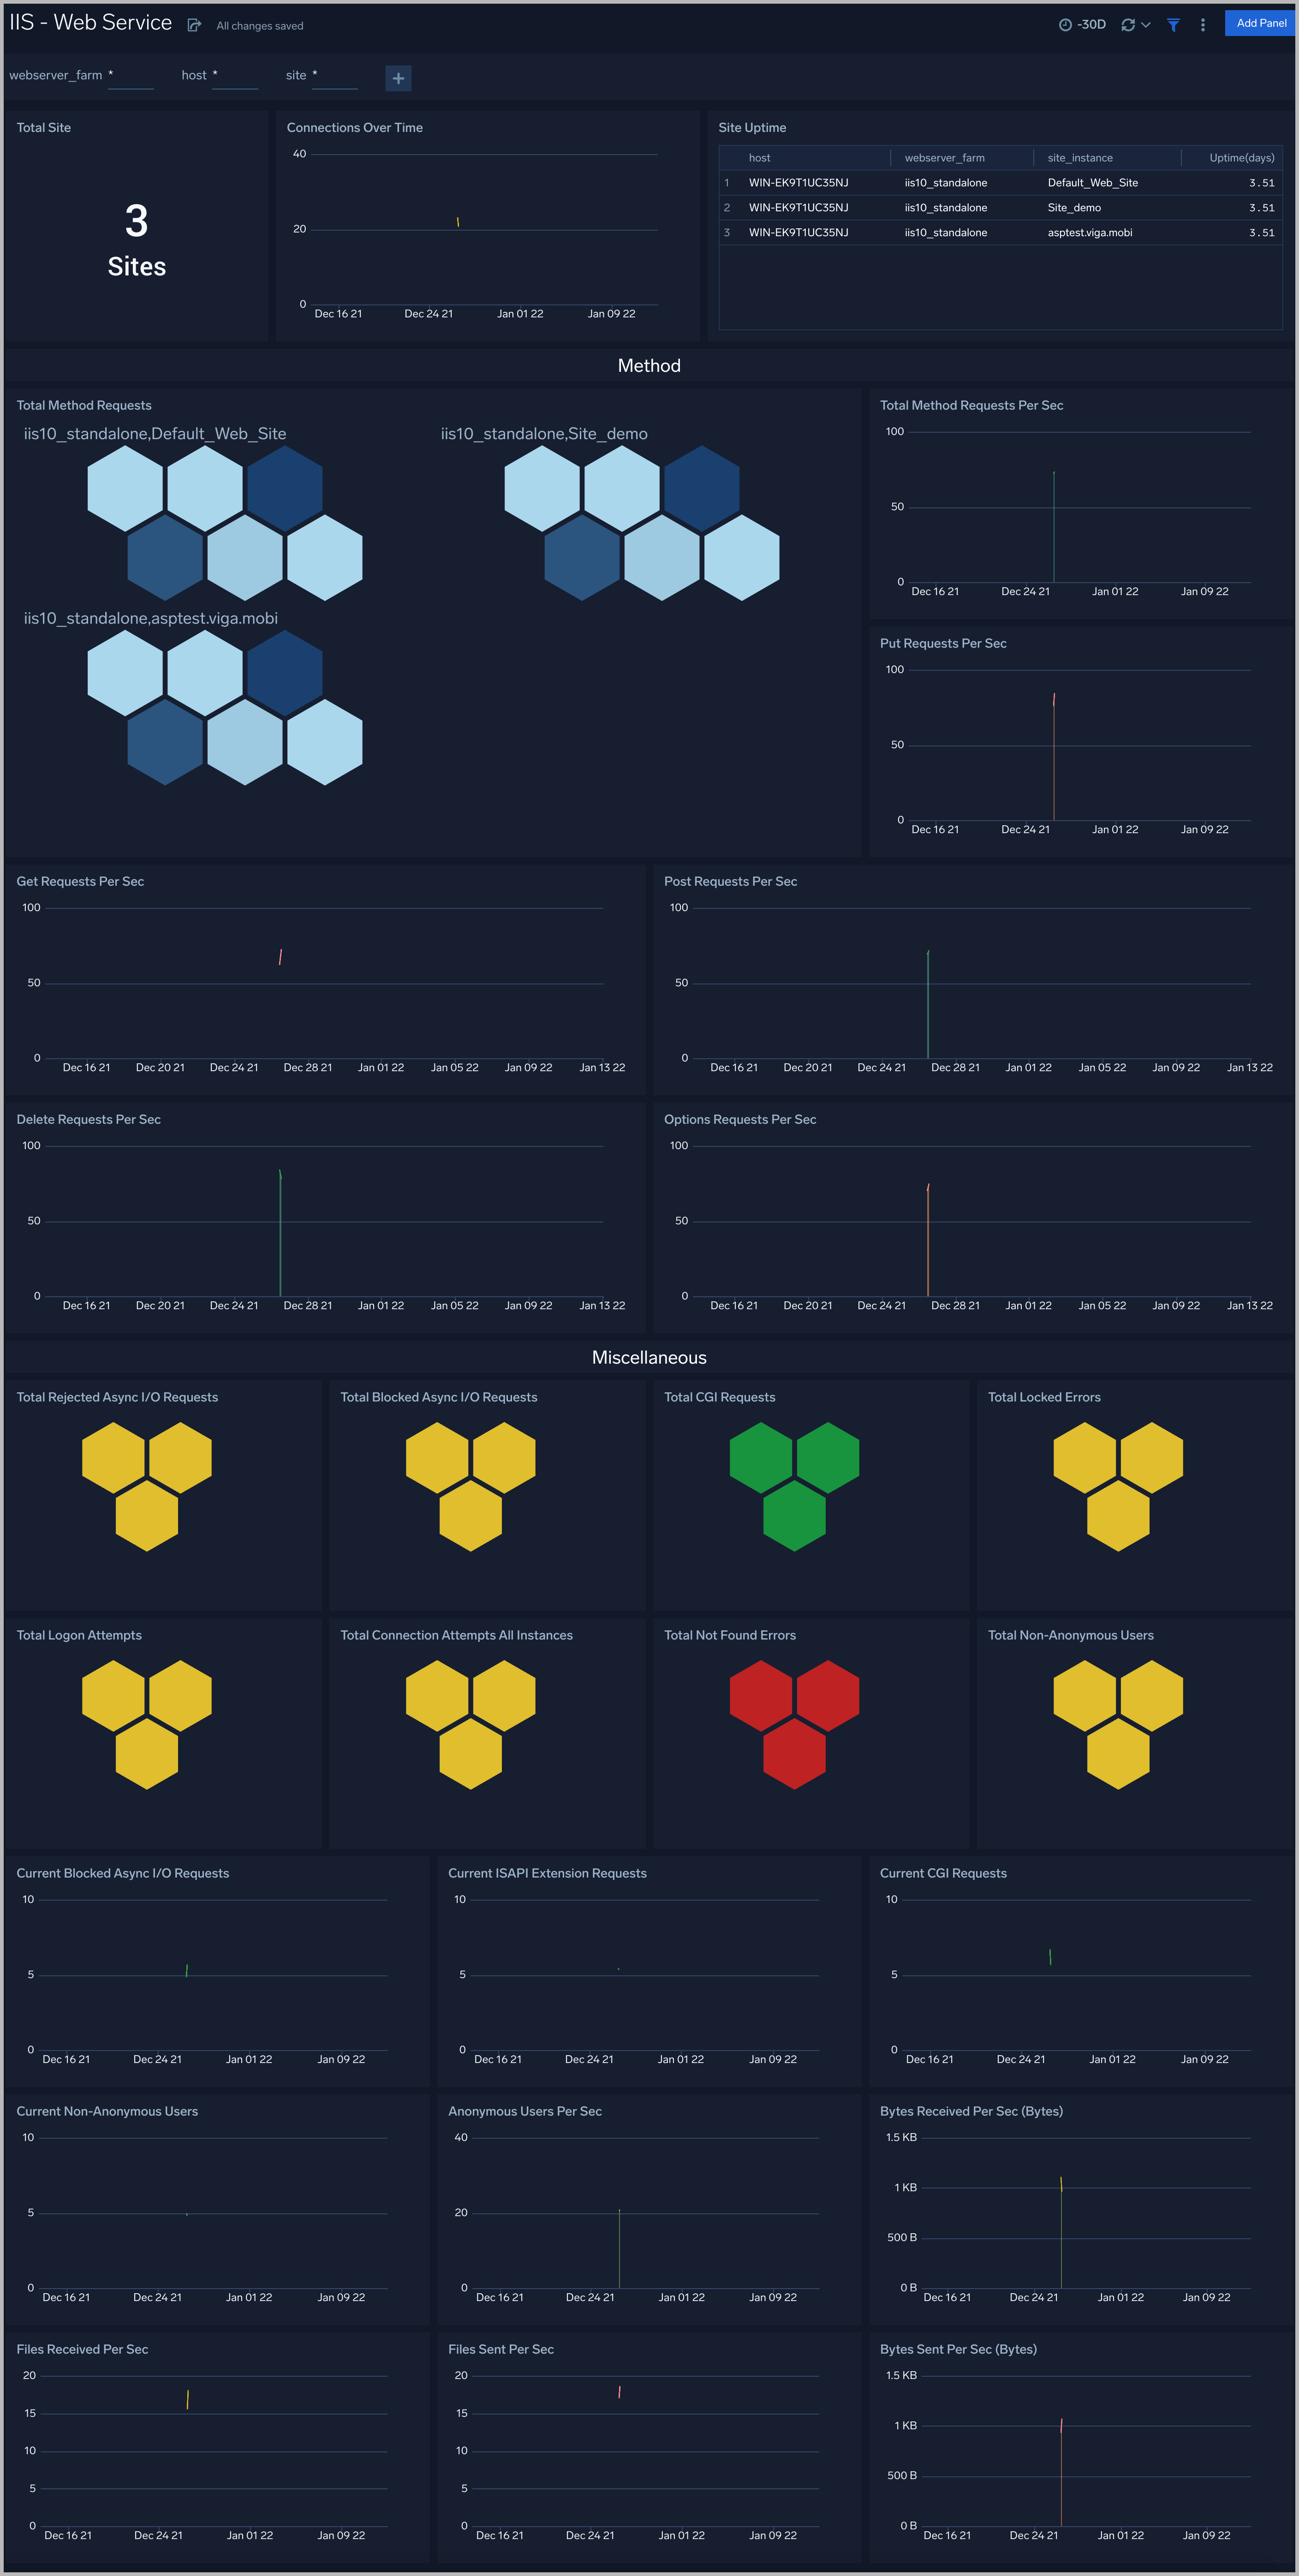
Web Service
The IIS - Web Service dashboard provides a high-level view of the Web Service object including counters specific to the World Wide Web Publishing Service.
Use this dashboard to monitor the following key metrics:
- Total Site
- Connections
- Site Uptime
- Method
- Miscellaneous
Installing IIS monitors
From your App Catalog:
- From the Sumo Logic navigation, select App Catalog.
- In the Search Apps field, search for and then select your app.
- Make sure the app is installed.
- Navigate to What's Included tab and scroll down to the Monitors section.
- Click Create next to the pre-configured monitors. In the create monitors window, adjust the trigger conditions and notifications settings based on your requirements.
- Scroll down to Monitor Details.
- Under Location click on New Folder.
note
By default, monitor will be saved in the root folder. So to make the maintenance easier, create a new folder in the location of your choice.
- Enter Folder Name. Folder Description is optional.
tip
Using app version in the folder name will be helpful to determine the versioning for future updates.
- Click Create. Once the folder is created, click on Save.
Using IIS alerts
Here are the alerts available for IISv10 (click to expand).
| Alert Name | Alert Description | Trigger Type (Critical / Warning) | Alert Condition | Recover Condition |
|---|---|---|---|---|
| IIS - Access from Highly Malicious Sources | This alert fires when an IIS server is accessed from highly malicious IP addresses. | Critical | > 0 | < = 0 |
| IIS - High Client (HTTP 4xx) Error Rate | This alert fires when there are too many HTTP requests (>5%) with a 4xx response code. | Critical | > 0 | 0 |
| IIS - High Server (HTTP 5xx) Error Rate | This alert fires when there are too many HTTP requests (>5%) with a 5xx response code. | Critical | > 0 | 0 |
| IIS - Error Events | This alert fires when an error in the IIS logs is detected. | Critical | > 0 | 0 |
| IIS - Slow Response Time | This alert fires when the response time for a given IIS server is greater than one second. | Warning | > 0 | 0 |
| IIS - ASP.NET Application Errors | This alert fires when we detect an error in the ASP.NET applications running on an IIS server. | Warning | >0 | < = 0 |
| IIS - Blocked Async IO Requests | This alert fires when we detect that there are blocked async I/O requests on an IIS server. | Warning | >0 | < = 0 |