Nginx Plus Ingress Controller for Kubernetes
The Nginx Plus Ingress Controller for Kubernetes provides enterprise‑grade delivery services for Kubernetes applications, with benefits for users of both Nginx Open Source and Nginx Plus.
This app supports Logs for Nginx Plus and Metrics for Nginx Plus Ingress Controller.
The Nginx Plus Ingress app is a unified logs and metrics app that helps you monitor the availability, performance, health, and resource utilization of your Nginx Plus Ingress web servers. Preconfigured dashboards and searches provide insight into server status, location zones, server zones, upstreams, resolvers, visitor locations, visitor access types, traffic patterns, errors, web server operations, and access from known malicious sources.
Log and metrics types
The Sumo Logic app for Nginx Plus Ingress assumes the NCSA extended/combined log file format for Access logs and the default Nginx error log file format for error logs.
All Dashboards (except the Error Logs Analysis dashboard) assume the Access log format. The Error Logs Analysis Dashboard assumes both Access and Error log formats, to correlate information between the two. For more details on Nginx logs, see here.
The Sumo Logic app for Nginx Plus Ingress assumes Prometheus format Metrics for Requests, Connections, and Ingress controller. For more details on Nginx Plus Ingress Metrics, see here
Sample log messages
{
  "timestamp":1621602688004,
  "log":"146.158.30.43 - - [21/May/2021:13:11:25 +0000] \"GET /nxp/demo-index.html HTTP/1.1\" 200 5099 \"https://example.com/\" \"Mozilla/5.0 (Windows NT 10.0; Win64; x64) AppleWebKit/537.36 (KHTML, like Gecko) Chrome/90.0.4430.212 Safari/537.36\" \"-\"",
  "stream":"stdout",
  "time":"2021-05-21T13:11:25.355302489Z"
}
{
  "timestamp":1619792989032,
  "log":"2021/04/29 13:26:05 [error] 190#190: *8248713 open() \"/usr/share/nginx/html/favicon.ico\" failed (2: No such file or directory), client: 10.244.0.132, server: , request: \"GET /favicon.ico HTTP/1.1\", host: \"example.com\", referrer: \"https://example.com/dashboard.html\"",
  "stream":"stderr",
  "time":"2021-04-29T13:26:05.074748065Z"
}
Sample queries
This sample query is from the Visitor Locations panel of the Nginx Plus Ingress - Overview dashboard.
Cluster={{Cluster}} Namespace={{Namespace}} Deployment={{Deployment}} Pod={{Pod}} _sourceCategory = *ingress*
| json auto maxdepth 1 nodrop
| if (isEmpty(log), _raw, log) as nginx_log_message
| parse regex field=nginx_log_message "(?<Client_Ip>\d{1,3}\.\d{1,3}\.\d{1,3}\.\d{1,3})"
| parse regex field=nginx_log_message "(?<Method>[A-Z]+)\s(?<URL>\S+)\sHTTP/[\d\.]+\"\s(?<Status_Code>\d+)\s(?<Size>[\d-]+)\s\"(?<Referrer>.*?)\"\s\"(?<User_Agent>.+?)\".*"
| where _sourceHost matches "{{Server}}" and Client_Ip matches "{{Client_Ip}}" and Method matches "{{Method}}" and URL matches "{{URL}}" and Status_Code matches "{{Status_Code}}"
| count by Client_Ip
| lookup latitude, longitude, country_code, country_name, region, city, postal_code from geo://location on ip = Client_Ip
| count by latitude, longitude, country_code, country_name, region, city, postal_code
| sort _count
Collecting logs and metrics for Nginx Plus Ingress
This section provides instructions for configuring log and metric collection for the Sumo Logic app for Nginx Plus Ingress. This includes the following tasks:
In the Kubernetes environment, we use our Sumo Logic Kubernetes collection. You can learn more about this here.
- Enable Logging in Nginx Plus Ingress: Logging is enabled by default to standard output “stdout” and standard error “stderr”. If you need additional logging, all nginx logs must be redirected to stdout and stderr.
- Enable Metrics in Nginx Plus Ingress: Before you configure Sumo Logic to ingest metrics, you must enable the Prometheus metrics in the Nginx Ingress controller and annotate the Nginx pods, so Prometheus can find the Nginx metrics.
- For instructions on Nginx, refer to this Nginx documentation
- Deployment of Sumologic Kubernetes Collection: Ensure you have deployed the Sumologic-Kubernetes-Collection, to send the logs and metrics to Sumologic. For more information on deploying Sumologic-Kubernetes-Collection, visit here. Once deployed, logs will automatically be picked up and sent by default. Prometheus will scrape the Nginx pods, based on the annotations set in Step 2, for the metrics. Logs and Metrics will automatically be sent to the respective Sumo Logic Distribution for OpenTelemetry Collector instances, which consistently tag your logs and metrics, then forward them to your Sumo Logic org.
Field Extraction Rules
Field Extraction Rules (FERs) tell Sumo Logic which fields to parse out automatically. For instructions, see Create a Field Extraction Rule.
Nginx assumes the NCSA extended/combined log file format for Access logs and the default Nginx Plus error log file format for error logs.
Both the parse expressions can be used for logs collected from the Nginx Plus Server running on Local or container-based systems.
FER for Access Logs
If you're using the default Nginx Plus Ingress log format use the following Parse Expression:
| json field=_raw "log" as nginx_log_message nodrop
| if (isEmpty(nginx_log_message), _raw, nginx_log_message) as nginx_log_message
| parse regex field=nginx_log_message
"(?<Client_Ip>\d{1,3}\.\d{1,3}\.\d{1,3}\.\d{1,3})"
| parse regex field=nginx_log_message "(?<method>[A-Z]+)\s(?<url>\S+)\sHTTP/[\d\.]+\"\s(?<status_code>\d+)\s(?<size>[\d-]+)\s\"(?<referrer>.*?)\"\s\"(?<user_agent>.+?)\"\s(?<request_length>\S+)\s(?<request_time>\S+)\s\[(?<proxy_upstream_name>[^\]]+)\]\s(?<upstream_addr>\S+)\s(?<upstream_response_length>\S+)\s(?<upstream_response_time>\S+)\s(?<upstream_status>\S+)"
If you aren’t using the default log format, use the below Parse Expression and edit/add fields as needed:
| json field=_raw "log" as nginx_log_message nodrop
| if (isEmpty(nginx_log_message), _raw, nginx_log_message) as nginx_log_message
| parse regex field=nginx_log_message "(?<Client_Ip>\d{1,3}\.\d{1,3}\.\d{1,3}\.\d{1,3})"
| parse regex field=nginx_log_message "(?<Method>[A-Z]+)\s(?<URL>\S+)\sHTTP/[\d\.]+\
"\s(?<Status_Code>\d+)\s(?<Size>[\d-]+)\s\"(?<Referrer>.*?)\"\s\"(?<User_Agent>.+?)\".*"
FER for Error Logs
Use the following Parse Expression:
| json field=_raw "log" as nginx_log_message nodrop
| if (isEmpty(nginx_log_message), _raw, nginx_log_message) as nginx_log_message
| parse regex field=nginx_log_message "\s\[(?<Log_Level>\S+)\]\s\d+#\d+:\s(?:\*\d+\s|)(?<Message>[A-Za-z][^,]+)(?:,|$)"
| parse field=nginx_log_message "client: *, server: *, request: \"* * HTTP/1.1\", host:
\"*\"" as Client_Ip, Server, Method, URL, Host nodrop
Installing the Nginx Plus Ingress app
To install the app, do the following:
Next-Gen App: To install or update the app, you must be an account administrator or a user with Manage Apps, Manage Monitors, Manage Fields, Manage Metric Rules, and Manage Collectors capabilities depending upon the different content types part of the app.
- Select App Catalog.
- In the 🔎 Search Apps field, run a search for your desired app, then select it.
- Click Install App.
note
Sometimes this button says Add Integration.
- Click Next in the Setup Data section.
- In the Configure section of your respective app, complete the following fields.
- Field Name. If you already have collectors and sources set up, select the configured metadata field name (eg _sourcecategory) or specify other custom metadata (eg: _collector) along with its metadata Field Value.
- Is K8S deployment involved. Specify if resources being monitored are partially or fully deployed on Kubernetes (K8s)
- Click Next. You will be redirected to the Preview & Done section.
Post-installation
Once your app is installed, it will appear in your Installed Apps folder, and dashboard panels will start to fill automatically.
Each panel slowly fills with data matching the time range query received since the panel was created. Results will not immediately be available but will be updated with full graphs and charts over time.
Viewing Nginx Plus Ingress Dashboards
All dashboards have a set of filters that you can apply to the entire dashboard. Use these filters to drill down and examine the data to a granular level.
- You can change the time range for a dashboard or panel by selecting a predefined interval from a drop-down list, choosing a recently used time range, or specifying custom dates and times. Learn more.
- You can use template variables to drill down and examine the data on a granular level. For more information, see Filtering Dashboards with Template Variables.
- Most Next-Gen apps allow you to provide the scope at the installation time and are comprised of a key (
_sourceCategoryby default) and a default value for this key. Based on your input, the app dashboards will be parameterized with a dashboard variable, allowing you to change the dataset queried by all panels. This eliminates the need to create multiple copies of the same dashboard with different queries.
Overview
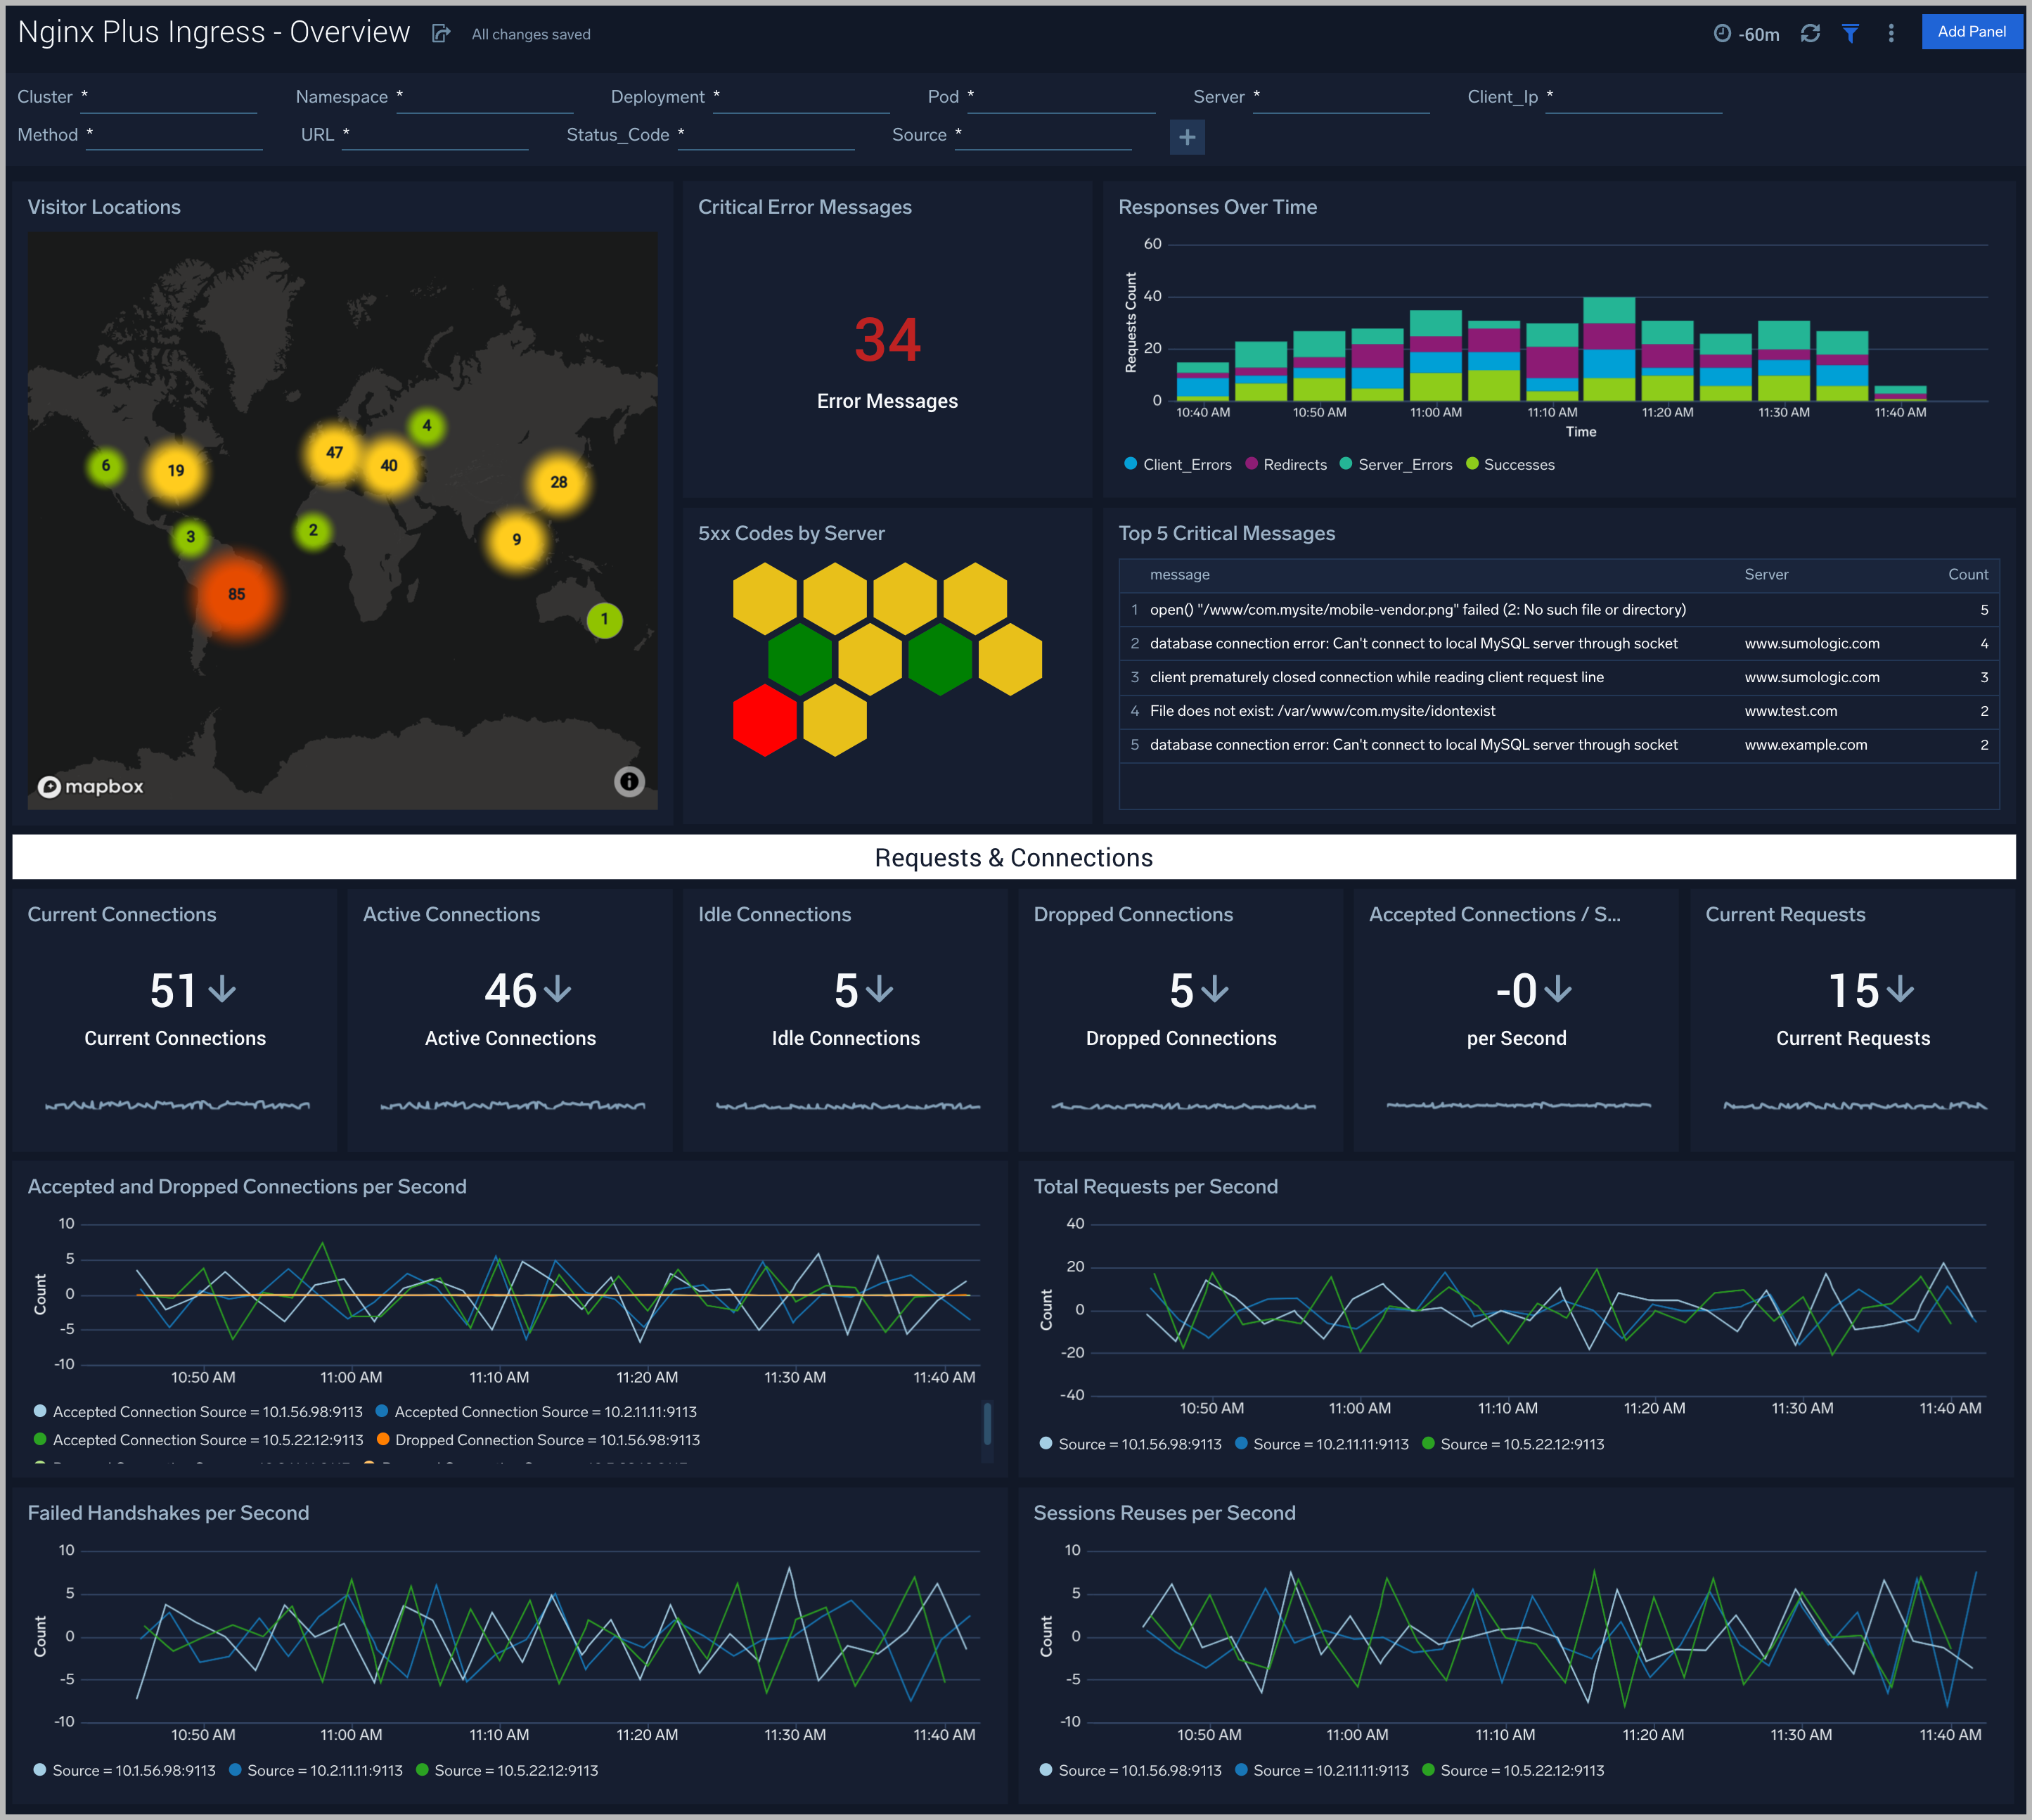
The Nginx Plus Ingress - Overview dashboard provides an at-a-glance view of the Nginx plus server access locations, error logs, and connection metrics.
Use this dashboard to:
- Gain insights into originated traffic location by region. This can help you allocate computer resources to different regions according to their needs.
- Gain insights into your Nginx health using Critical Errors and Status of Nginx Server.
- Get insights into Active and dropped connections.
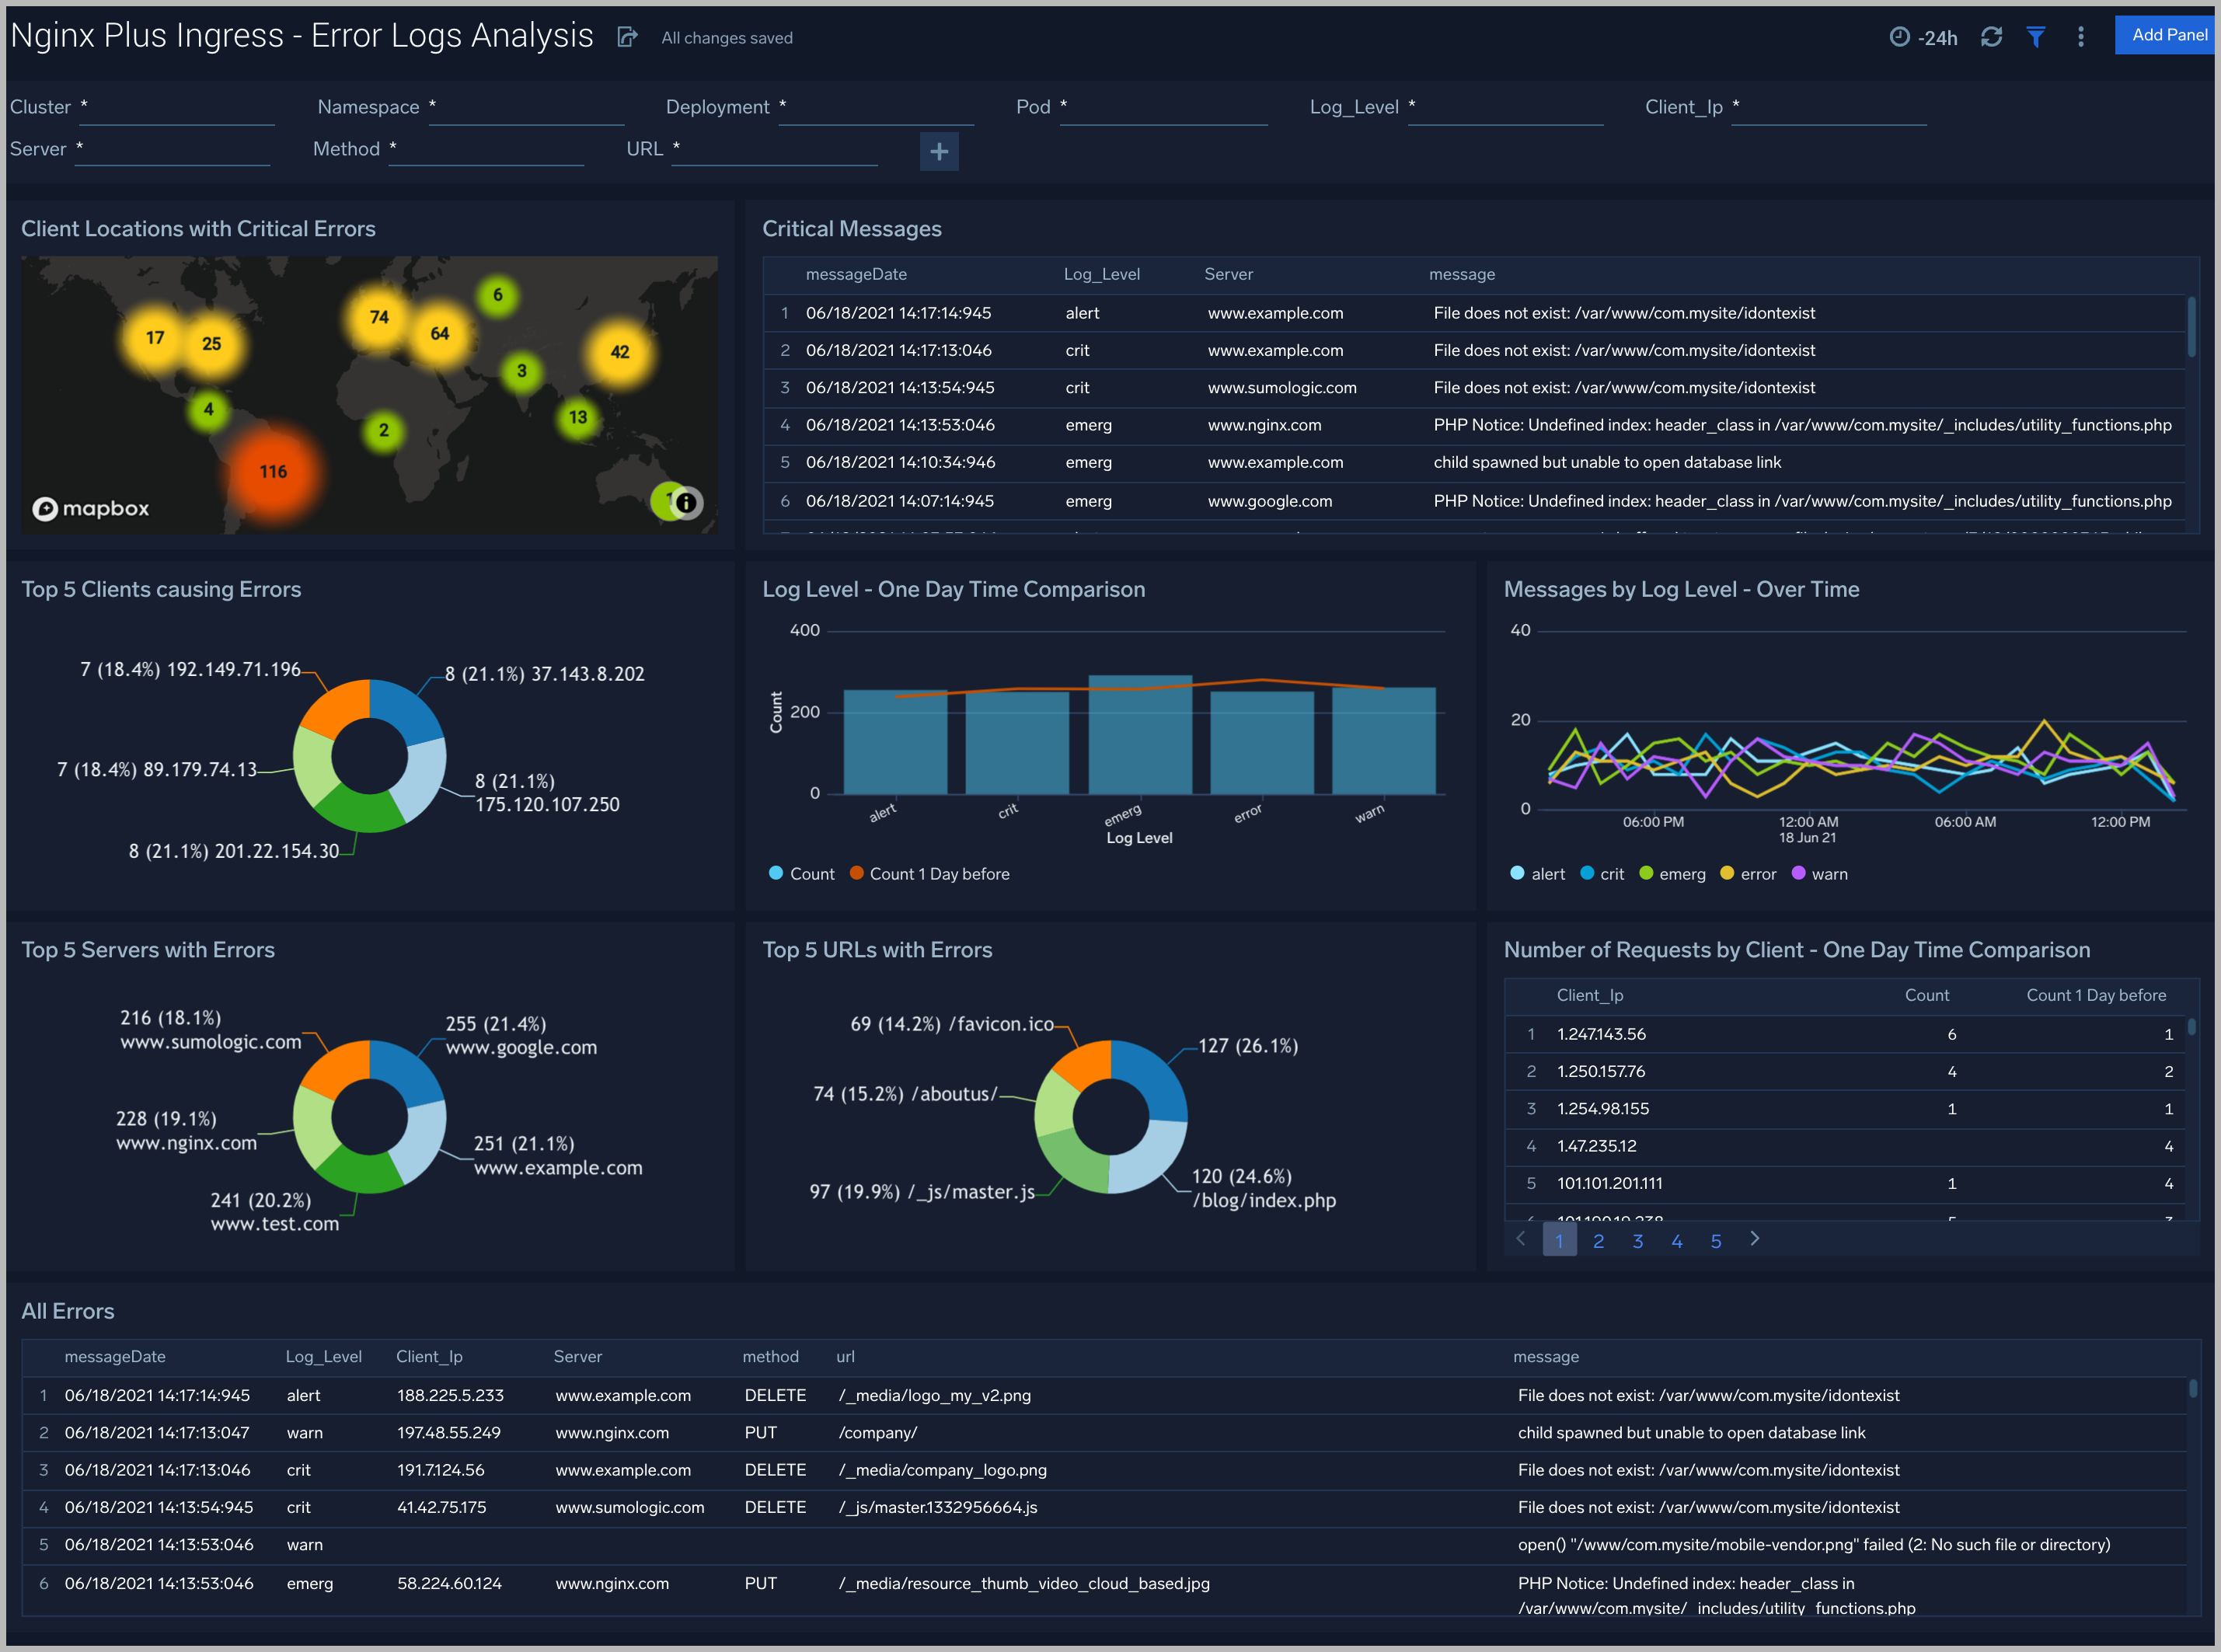
Error Logs Analysis
The Nginx Plus Ingress - Error Logs Analysis dashboard provides a high-level view of log level breakdowns, comparisons, and trends. The panels also show the geographic locations of clients and clients with critical messages, new connections, outliers, client requests, request trends, and request outliers.
Use this dashboard to:
- Track requests from clients. A request is a message asking for a resource, such as a page or an image.
- To track and view client geographic locations generating errors.
- Track critical alerts and emergency error alerts.
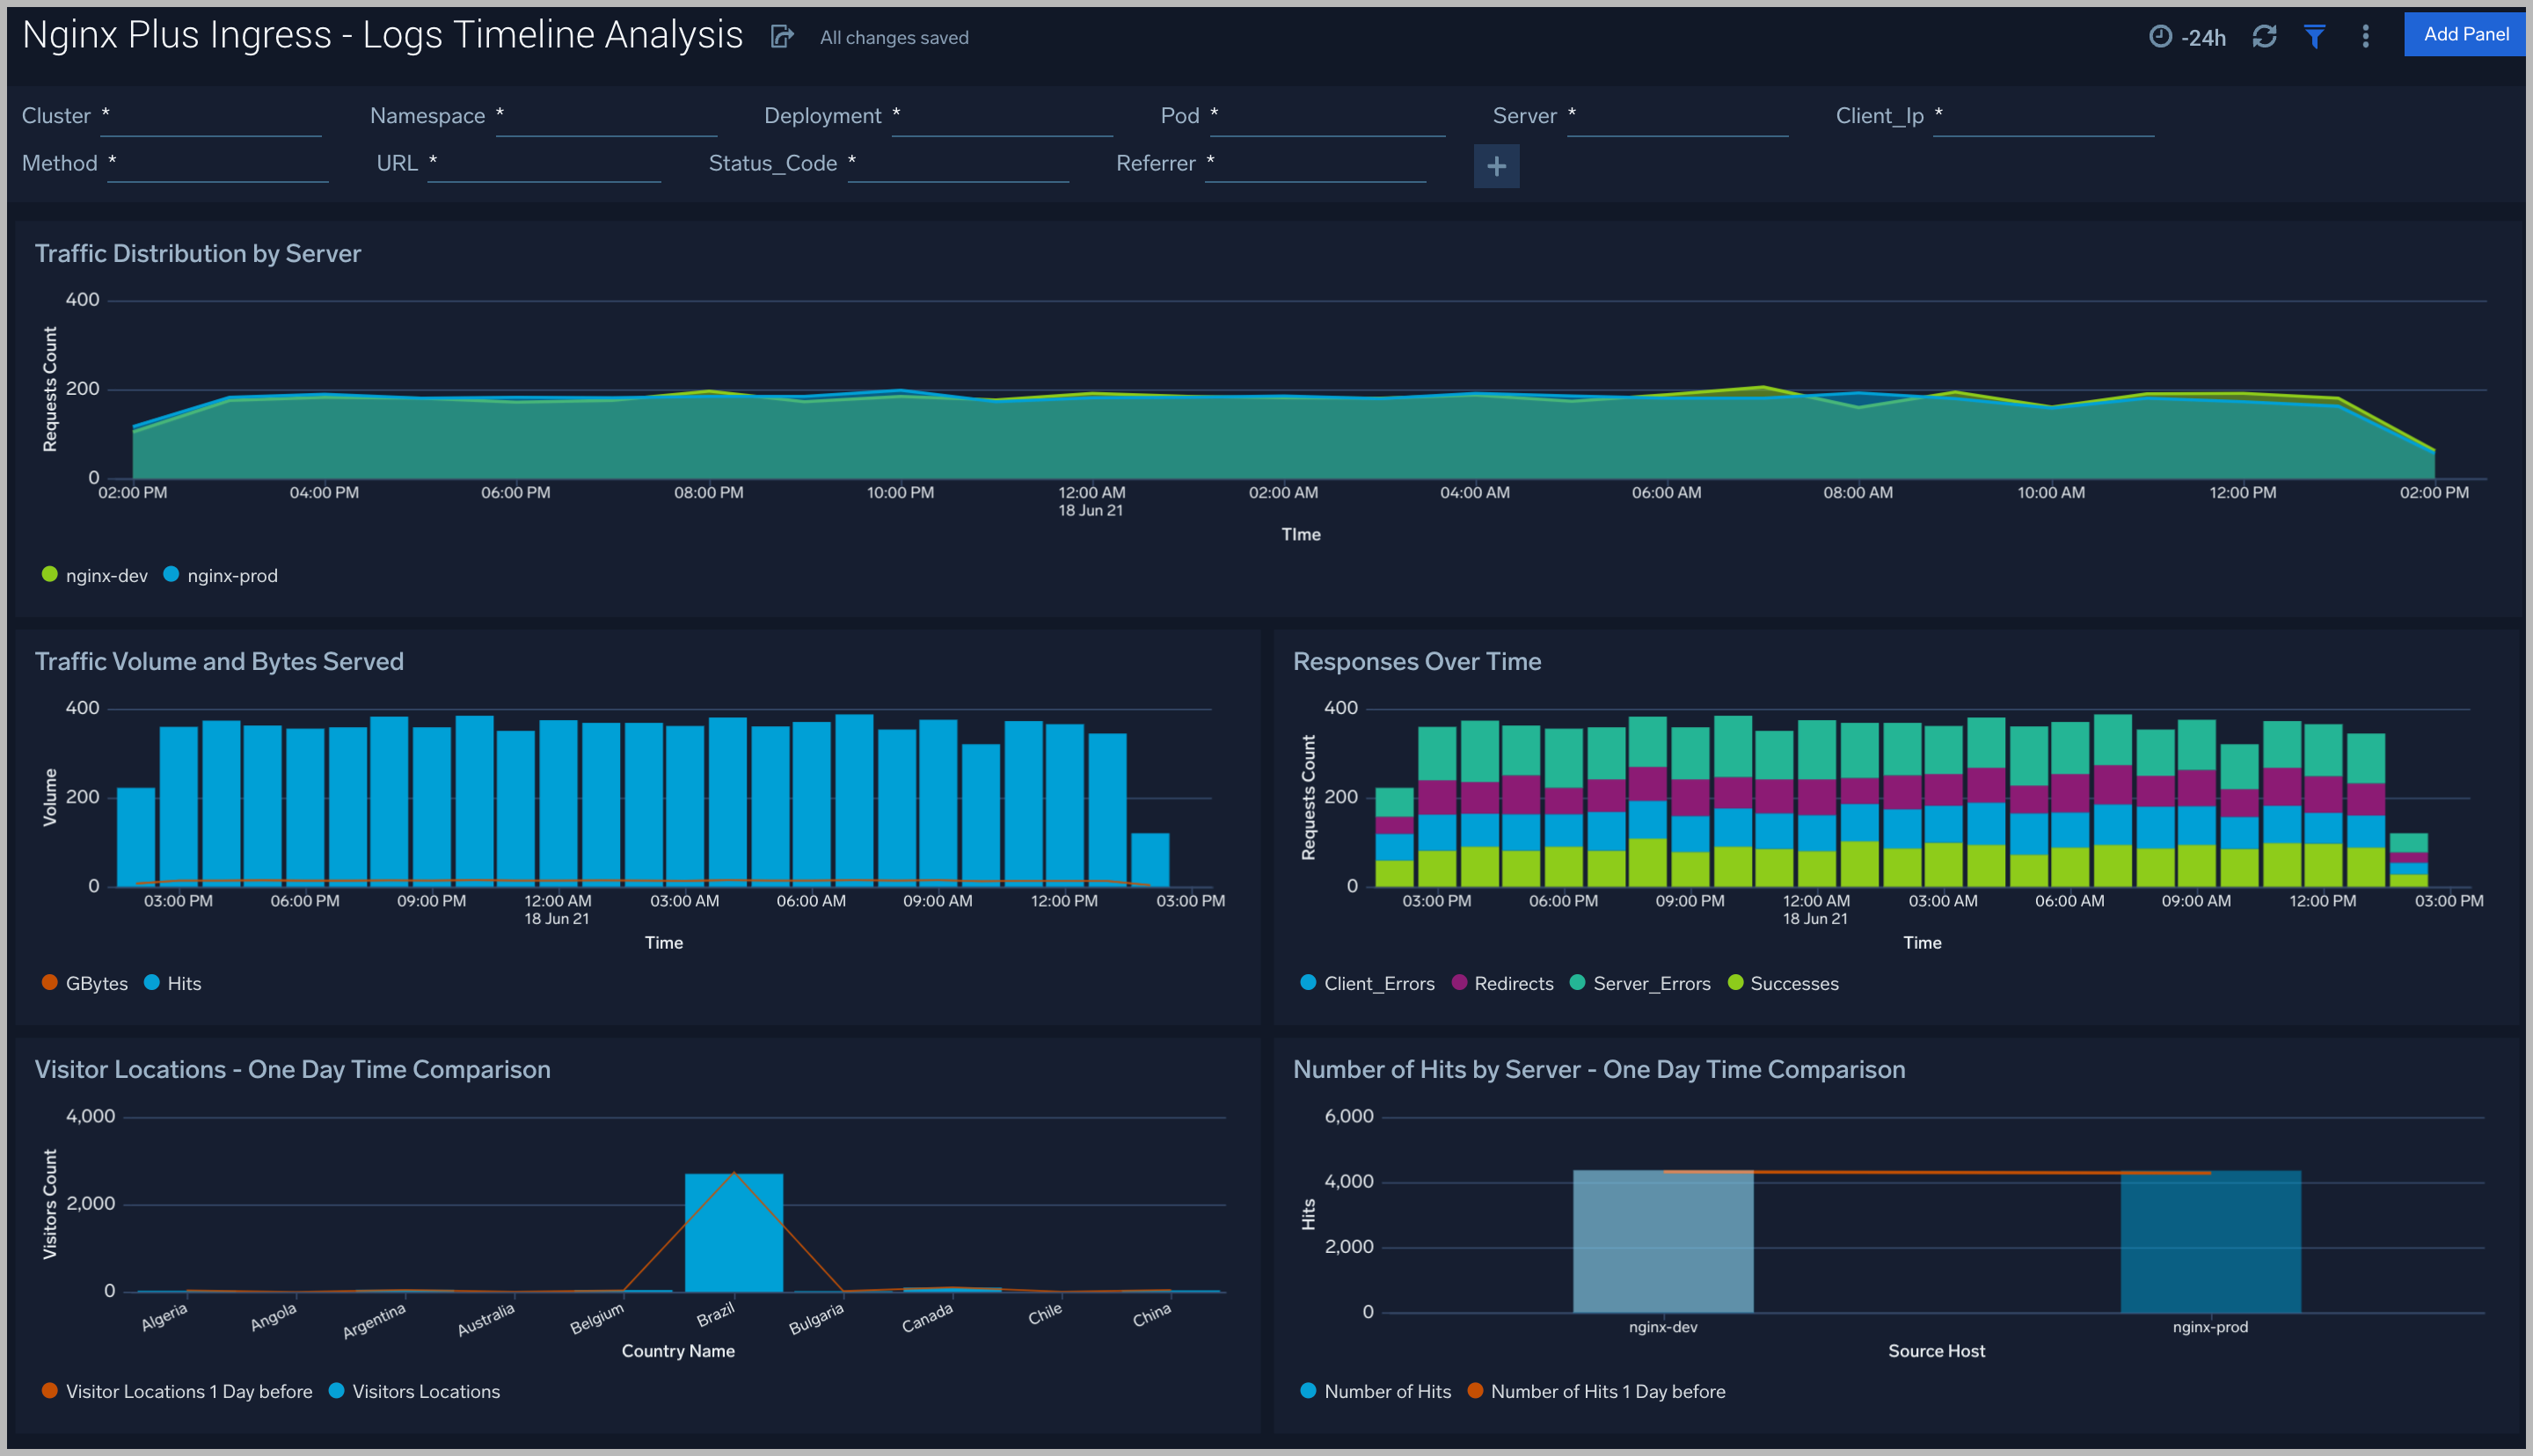
Logs Timeline Analysis
The Nginx Plus Ingress - Logs Timeline Analysis dashboard provides a high-level view of the activity and health of Nginx servers on your network. Dashboard panels display visual graphs and detailed information on traffic volume and distribution, responses over time, as well as time comparisons for visitor locations and server hits.
Use this dashboard to:
- To understand the traffic distribution across servers, provide insights for resource planning by analyzing data volume and bytes served.
- Gain insights into originated traffic location by region. This can help you allocate compute resources to different regions according to their needs.
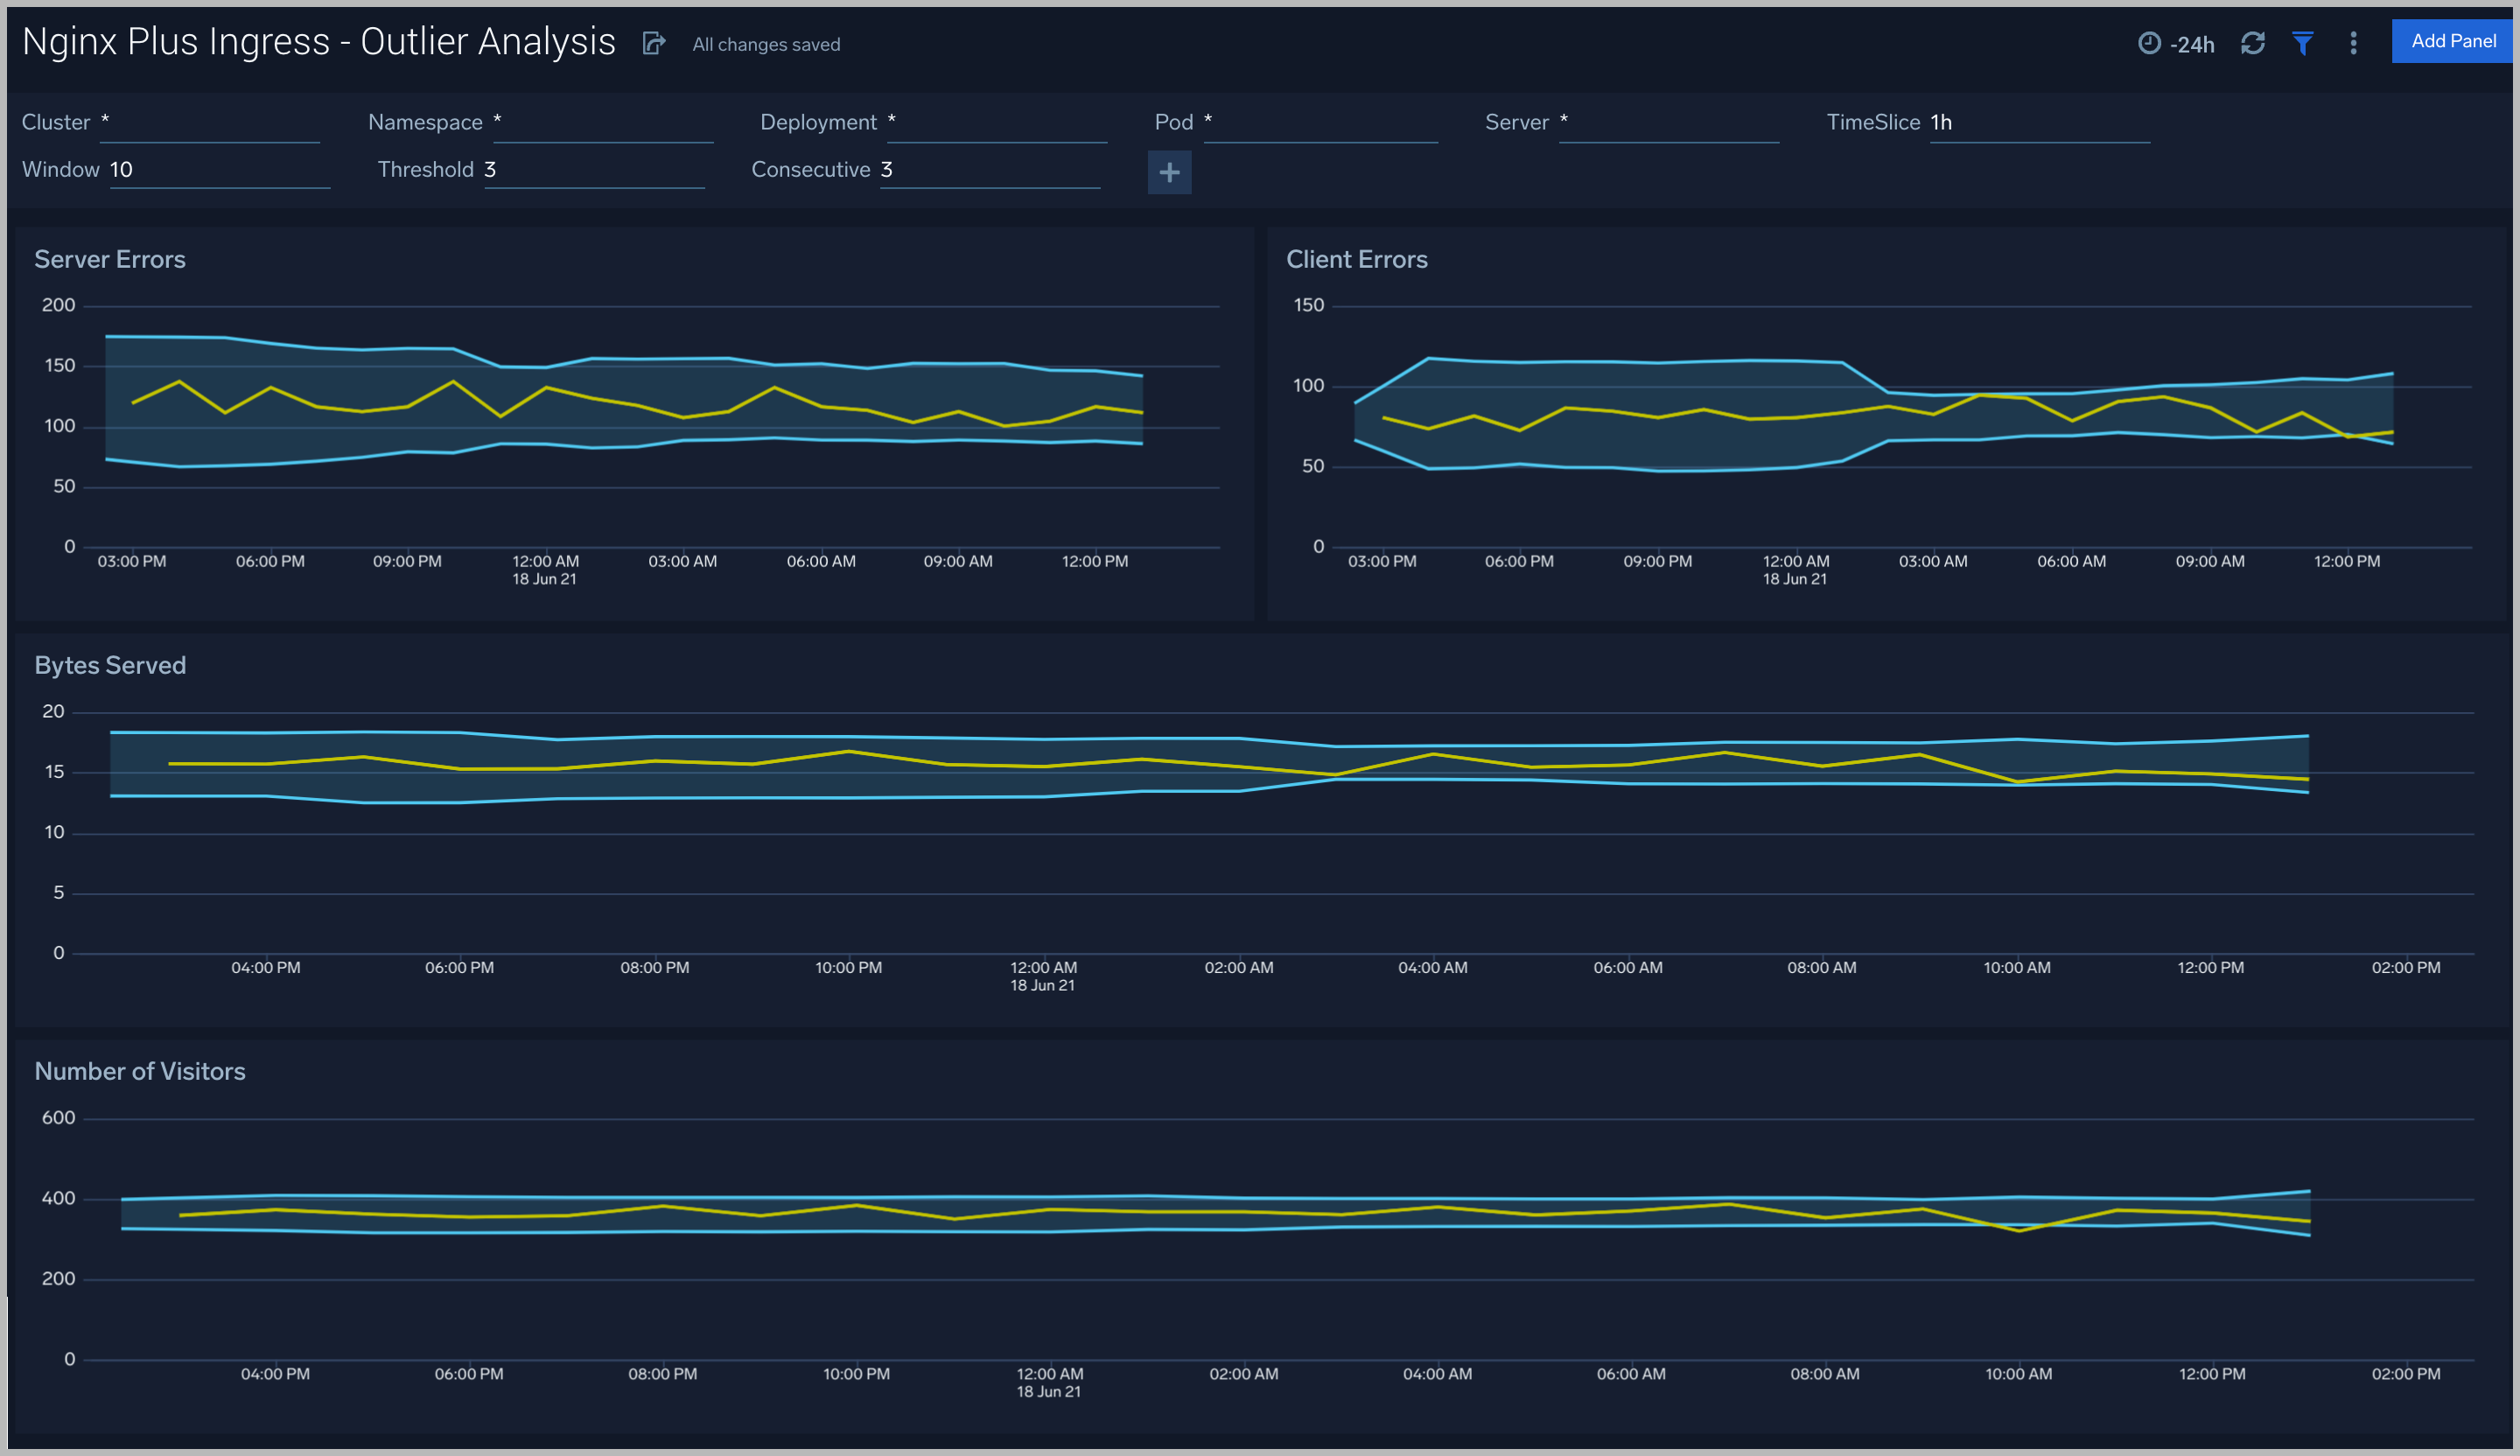
Outlier Analysis
The Nginx Plus Ingress - Outlier Analysis dashboard provides a high-level view of Nginx server outlier metrics for bytes served, number of visitors, and server errors. You can select the time interval over which outliers are aggregated, then hover the cursor over the graph to display detailed information for that point in time.
Use this dashboard to:
- Detect outliers in your infrastructure with Sumo Logic’s machine-learning algorithm.
- To identify outliers in incoming traffic and the number of errors encountered by your servers.
You can use schedule searches to send alerts to yourself whenever there is an outlier detected by Sumo Logic.
Threat Intel
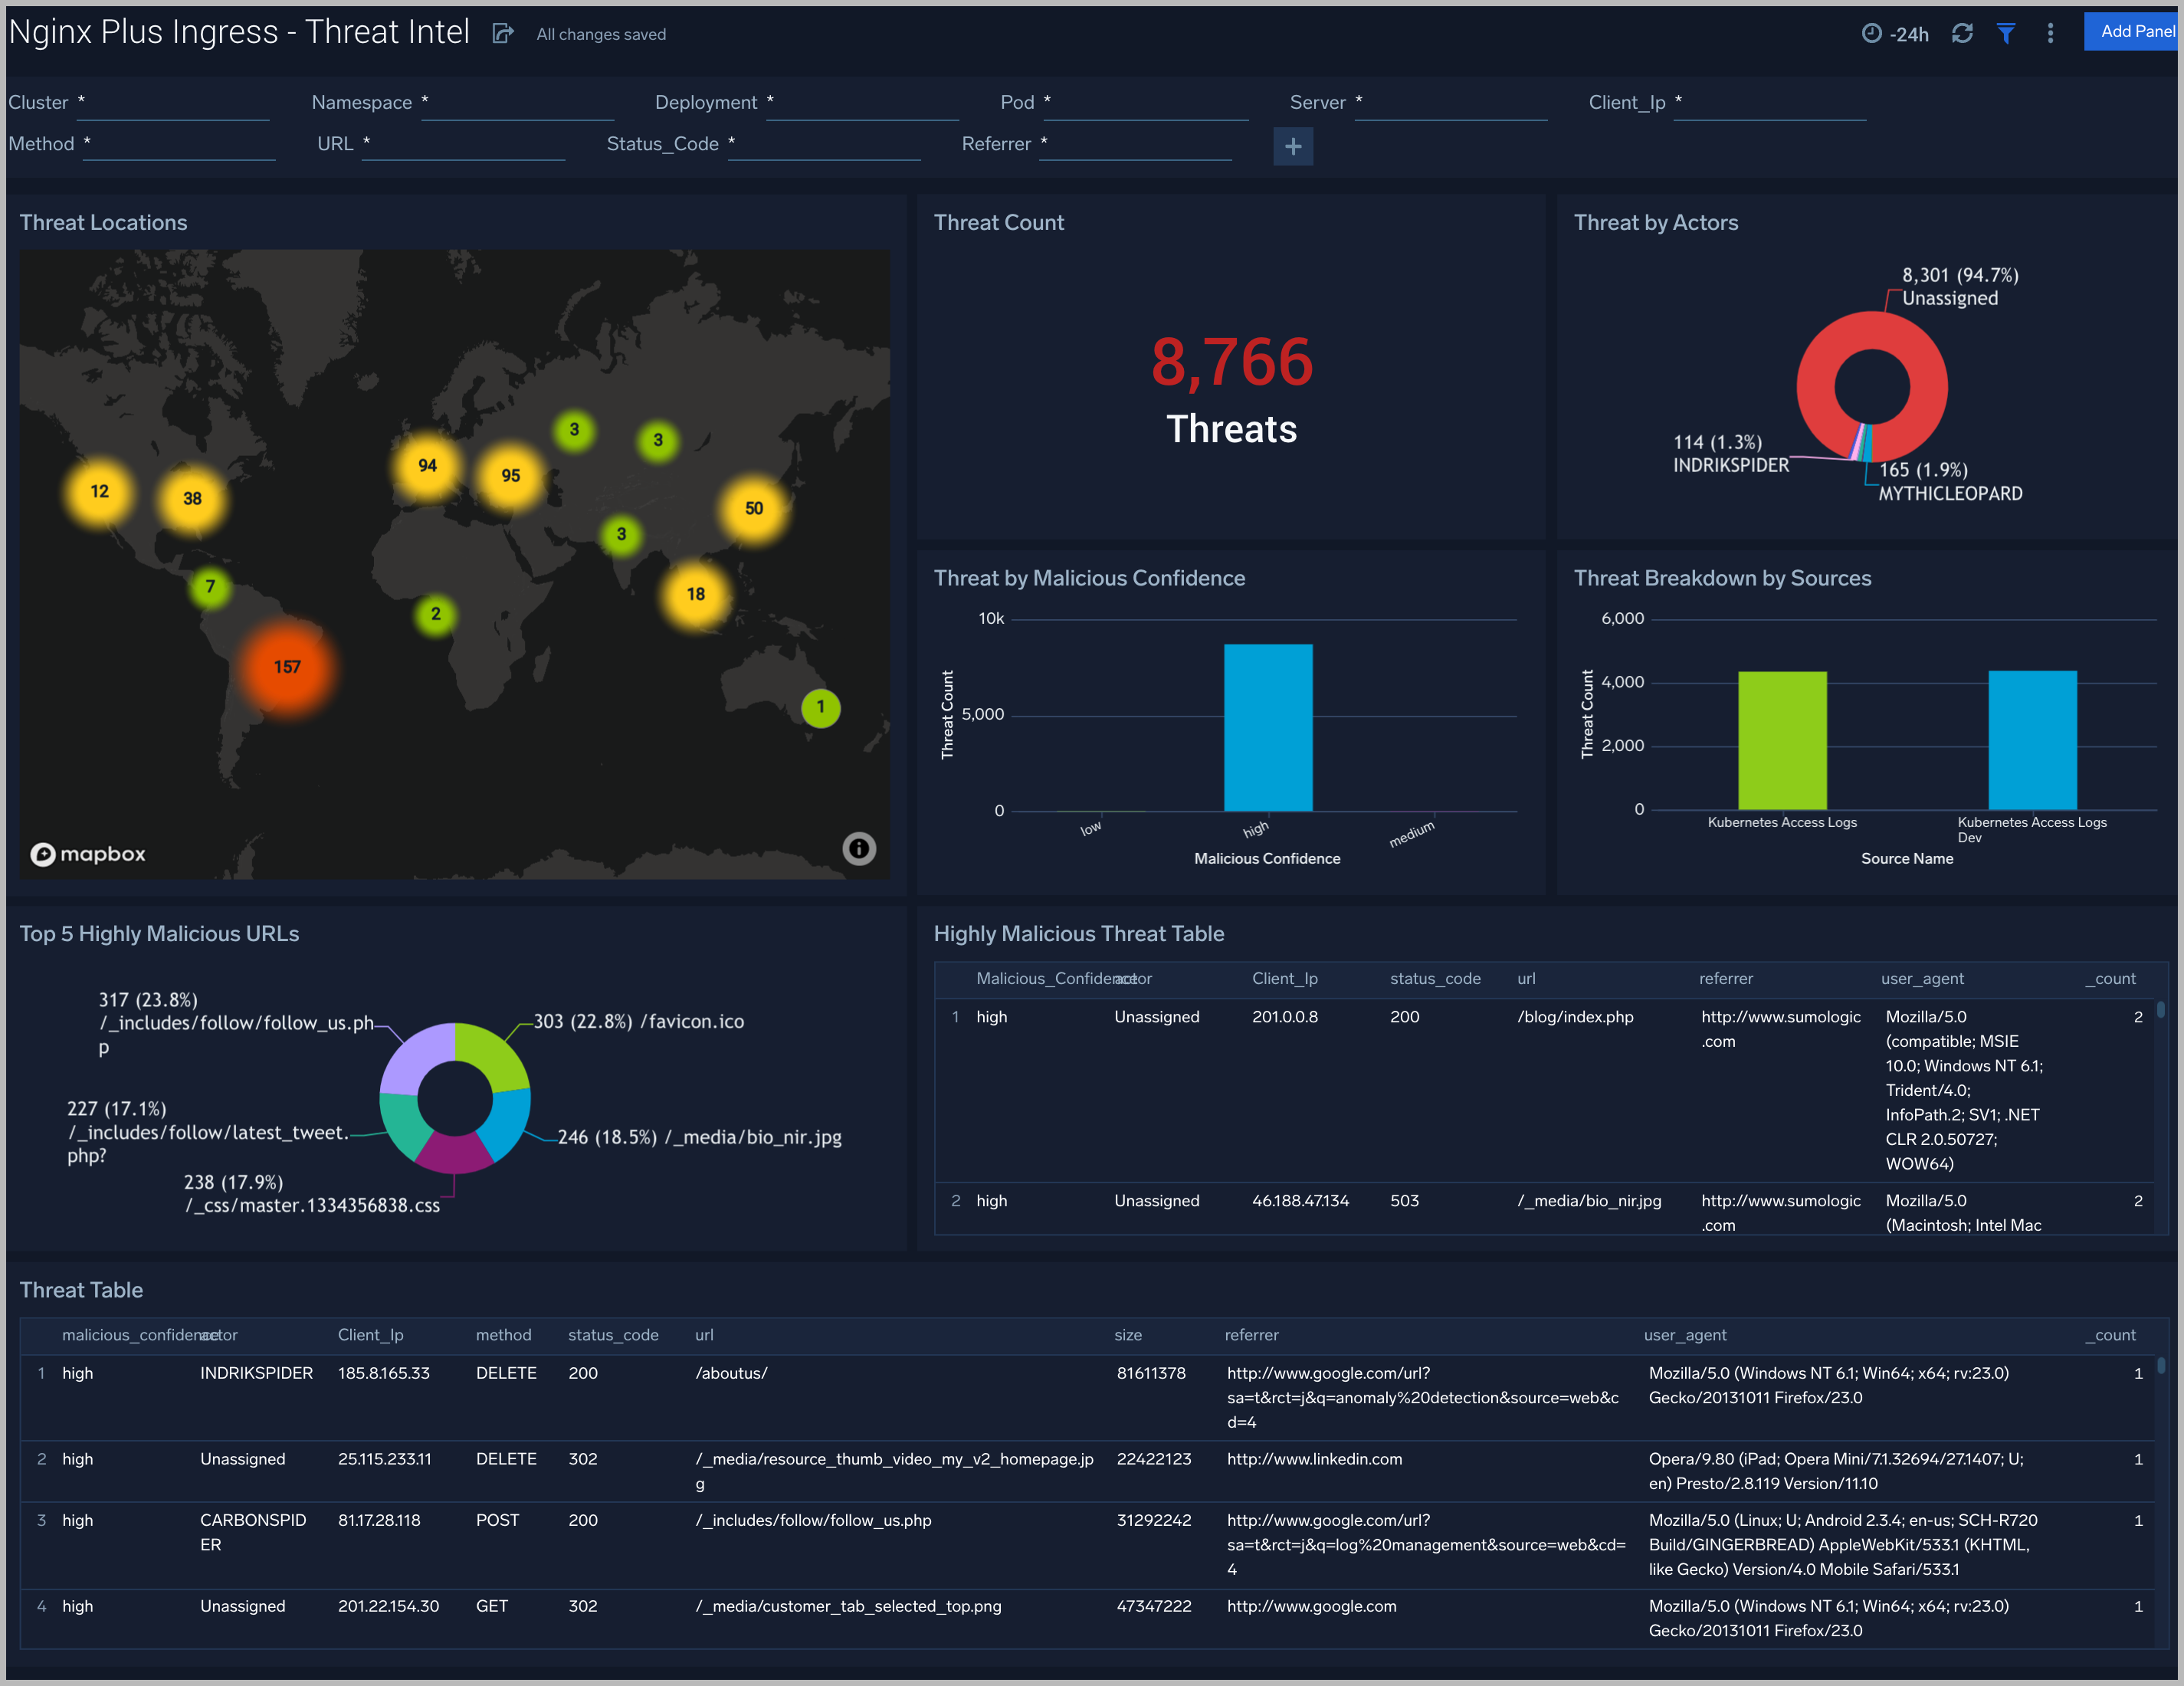
The Nginx Plus Ingress - Threat Intel dashboard provides an at-a-glance view of threats to Nginx servers on your network. Dashboard panels display the threat count over a selected time period, geographic locations where threats occurred, source breakdown, actors responsible for threats, severity, and a correlation of IP addresses, method, and status code of threats.
Use this dashboard to:
- To gain insights and understand threats in incoming traffic and discover potential IOCs. Incoming traffic requests are analyzed using the Sumo Logic threat intelligence.
Web Server Operations
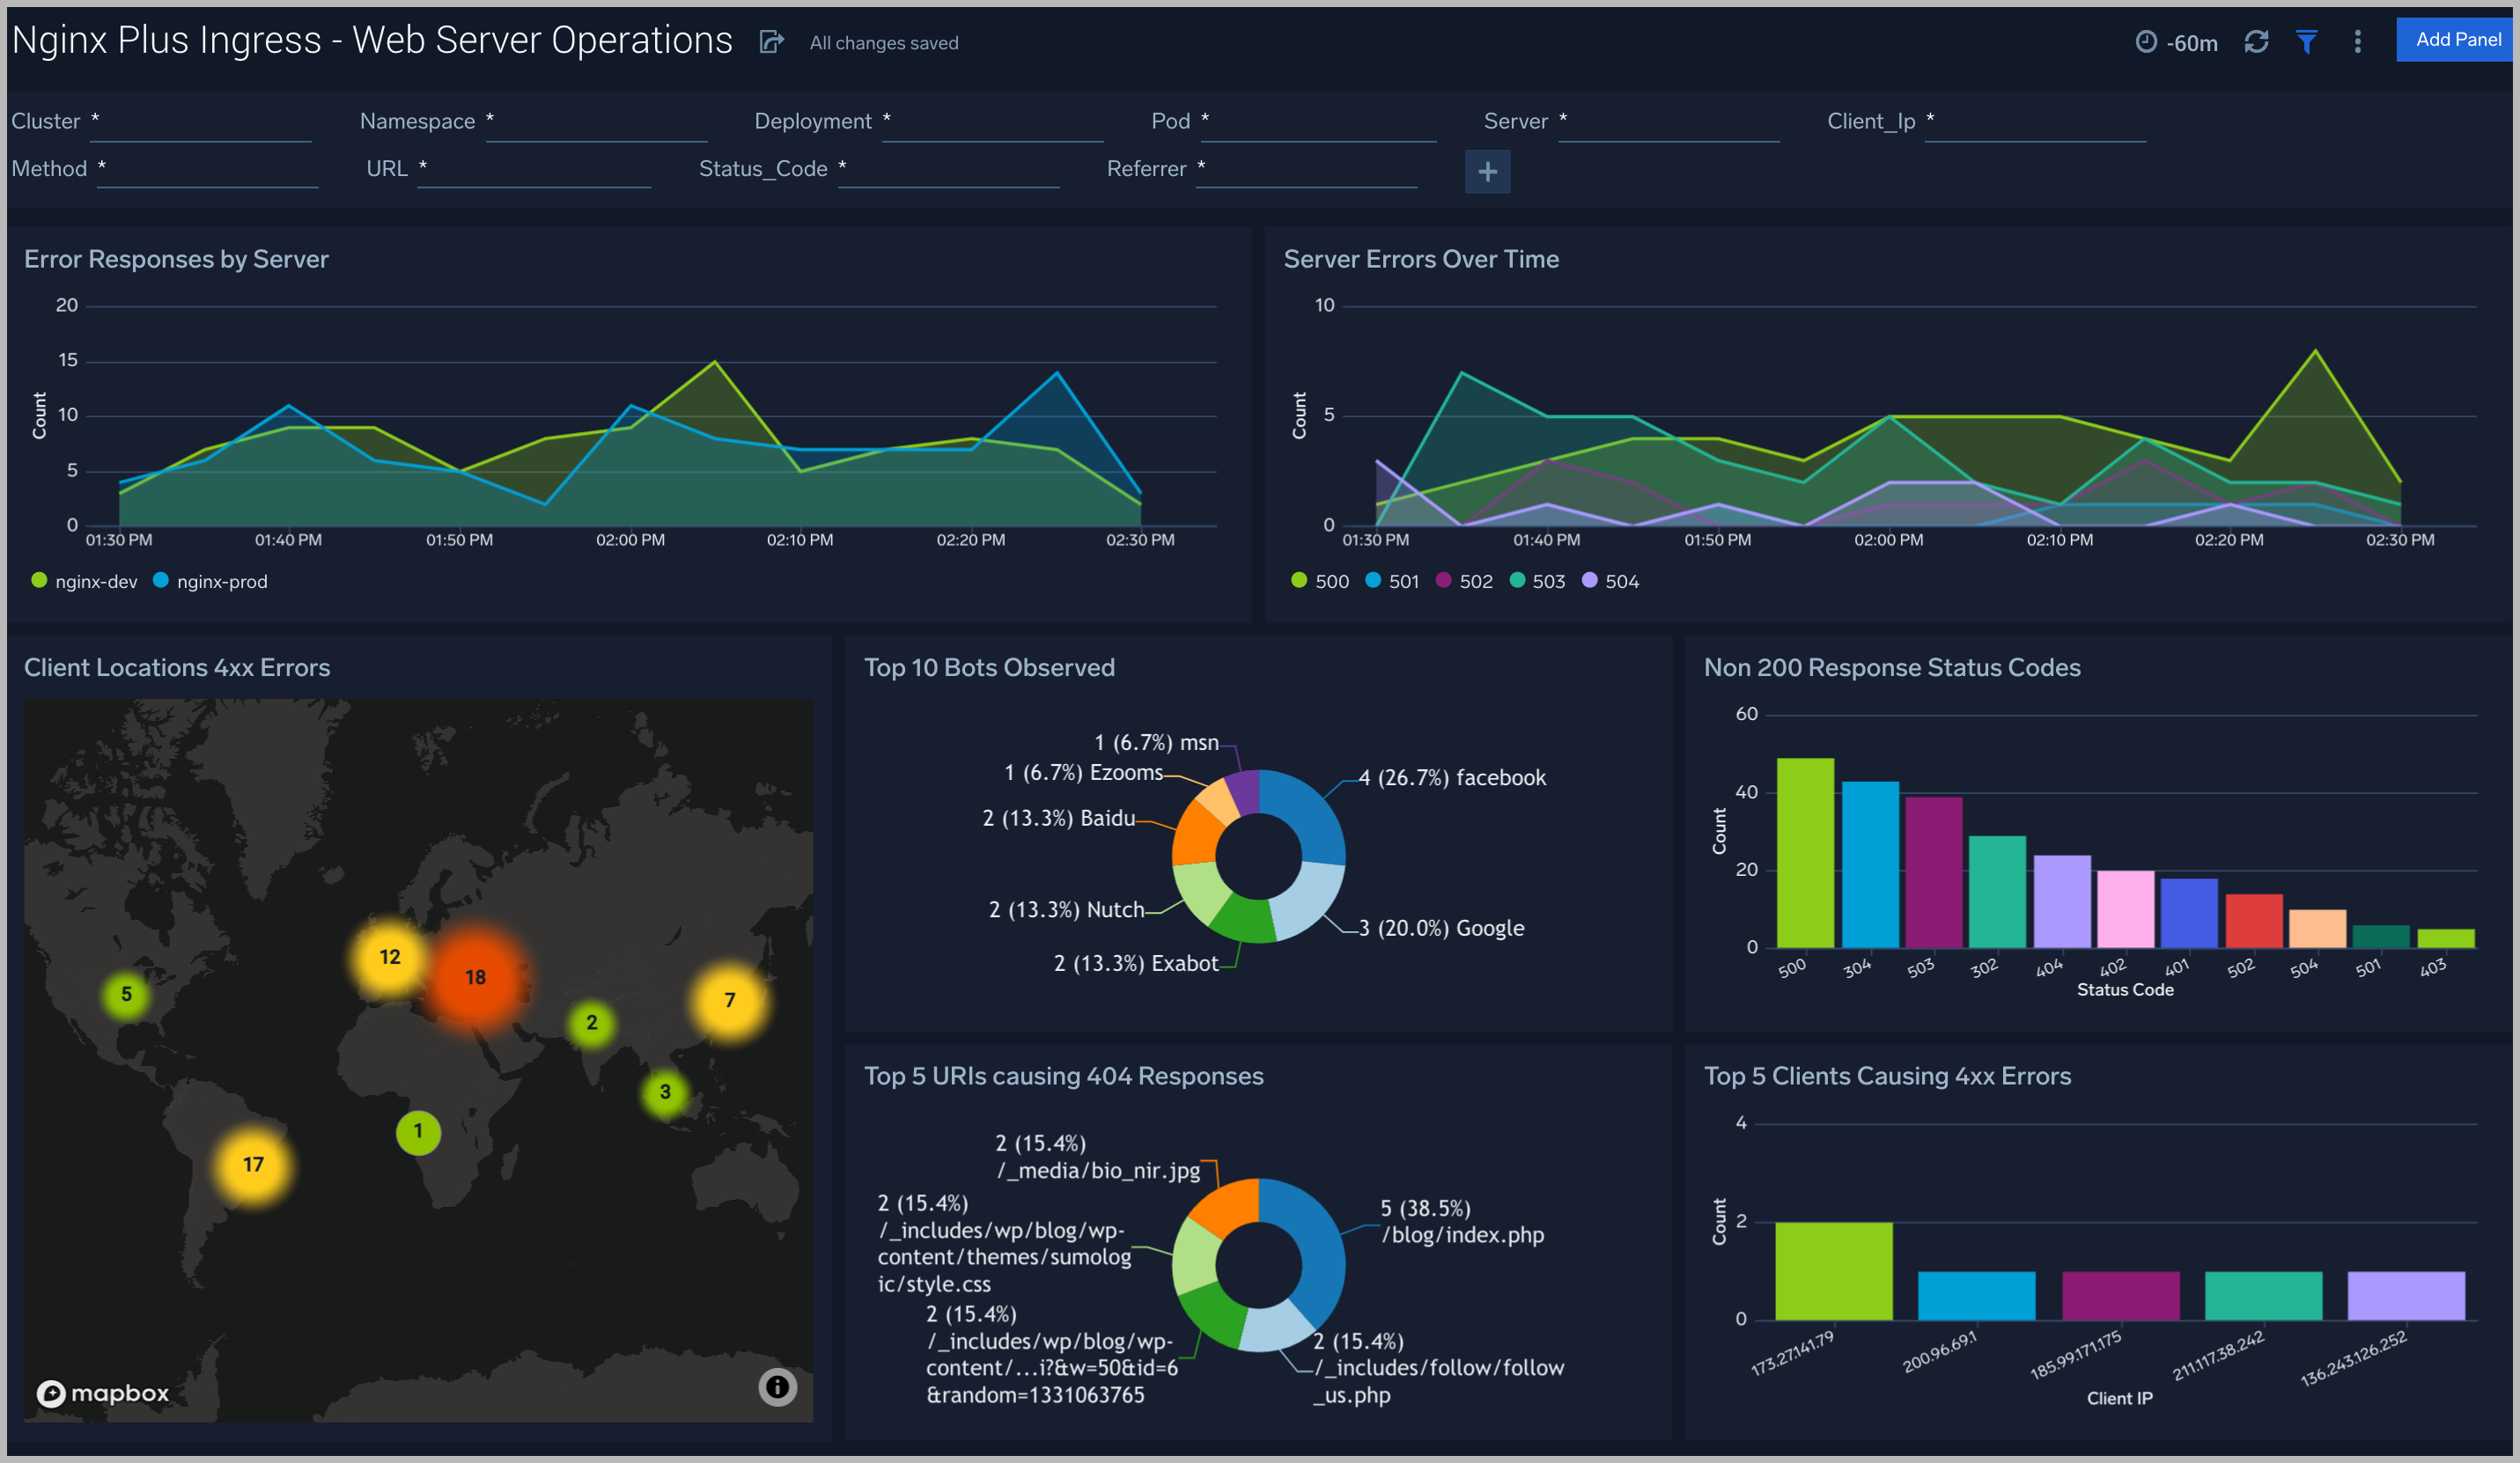
The Nginx Plus Ingress - Web Server Operations dashboard provides a high-level view combined with detailed information on the top ten bots, geographic locations, and data for clients with high error rates, server errors over time, and non 200 response code status codes. Dashboard panels also show information on server error logs, error log levels, error responses by a server, and the top URIs responsible for 404 responses.
Use this dashboard to:
- Gain insights into Client and Server Responses on the Nginx Server. This helps you identify errors in the Nginx Server.
- To identify geolocations of all Client errors. This helps you identify client locations causing errors and helps you to block client IPs.
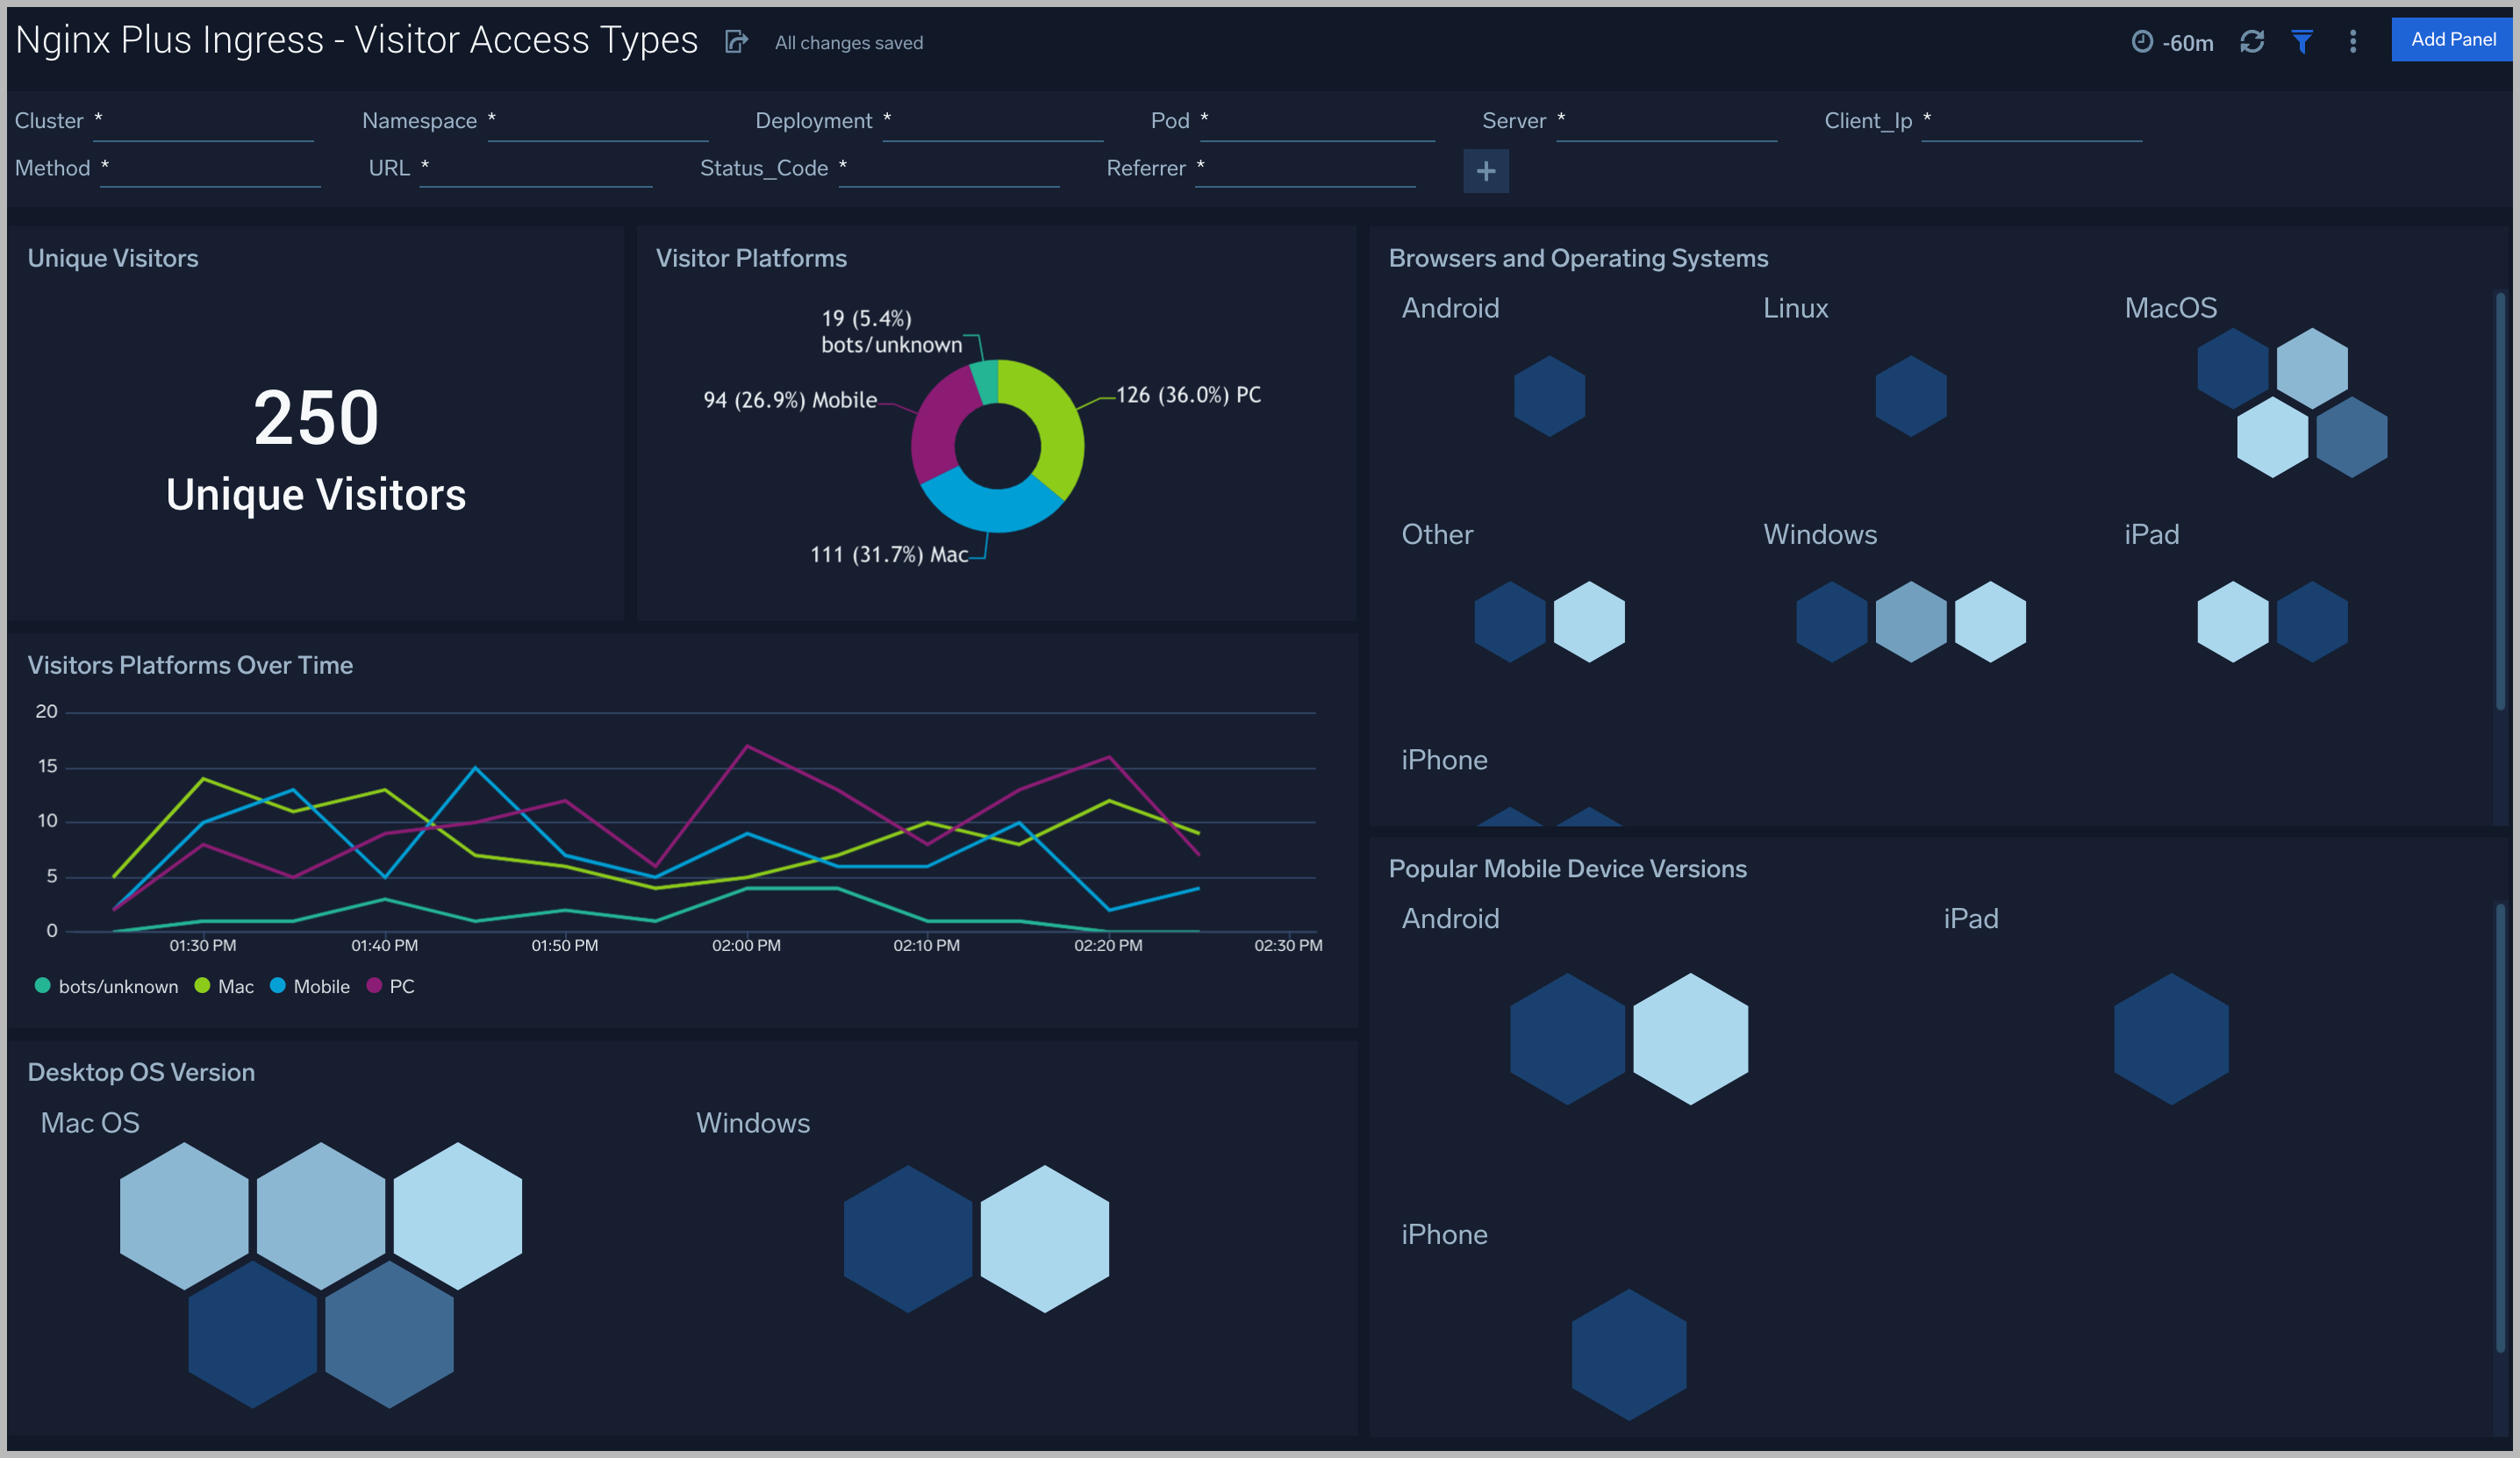
Visitor Access Types
The Nginx Plus Ingress - Visitor Access Types dashboard provides insights into visitor platform types, browsers, and operating systems, as well as the most popular mobile devices, PC, and Mac versions used.
Use this dashboard to:
- Understand which platform and browsers are used to gain access to your infrastructure. These insights can be useful for planning in which browsers, platforms, and operating systems (OS) should be supported by different software services.
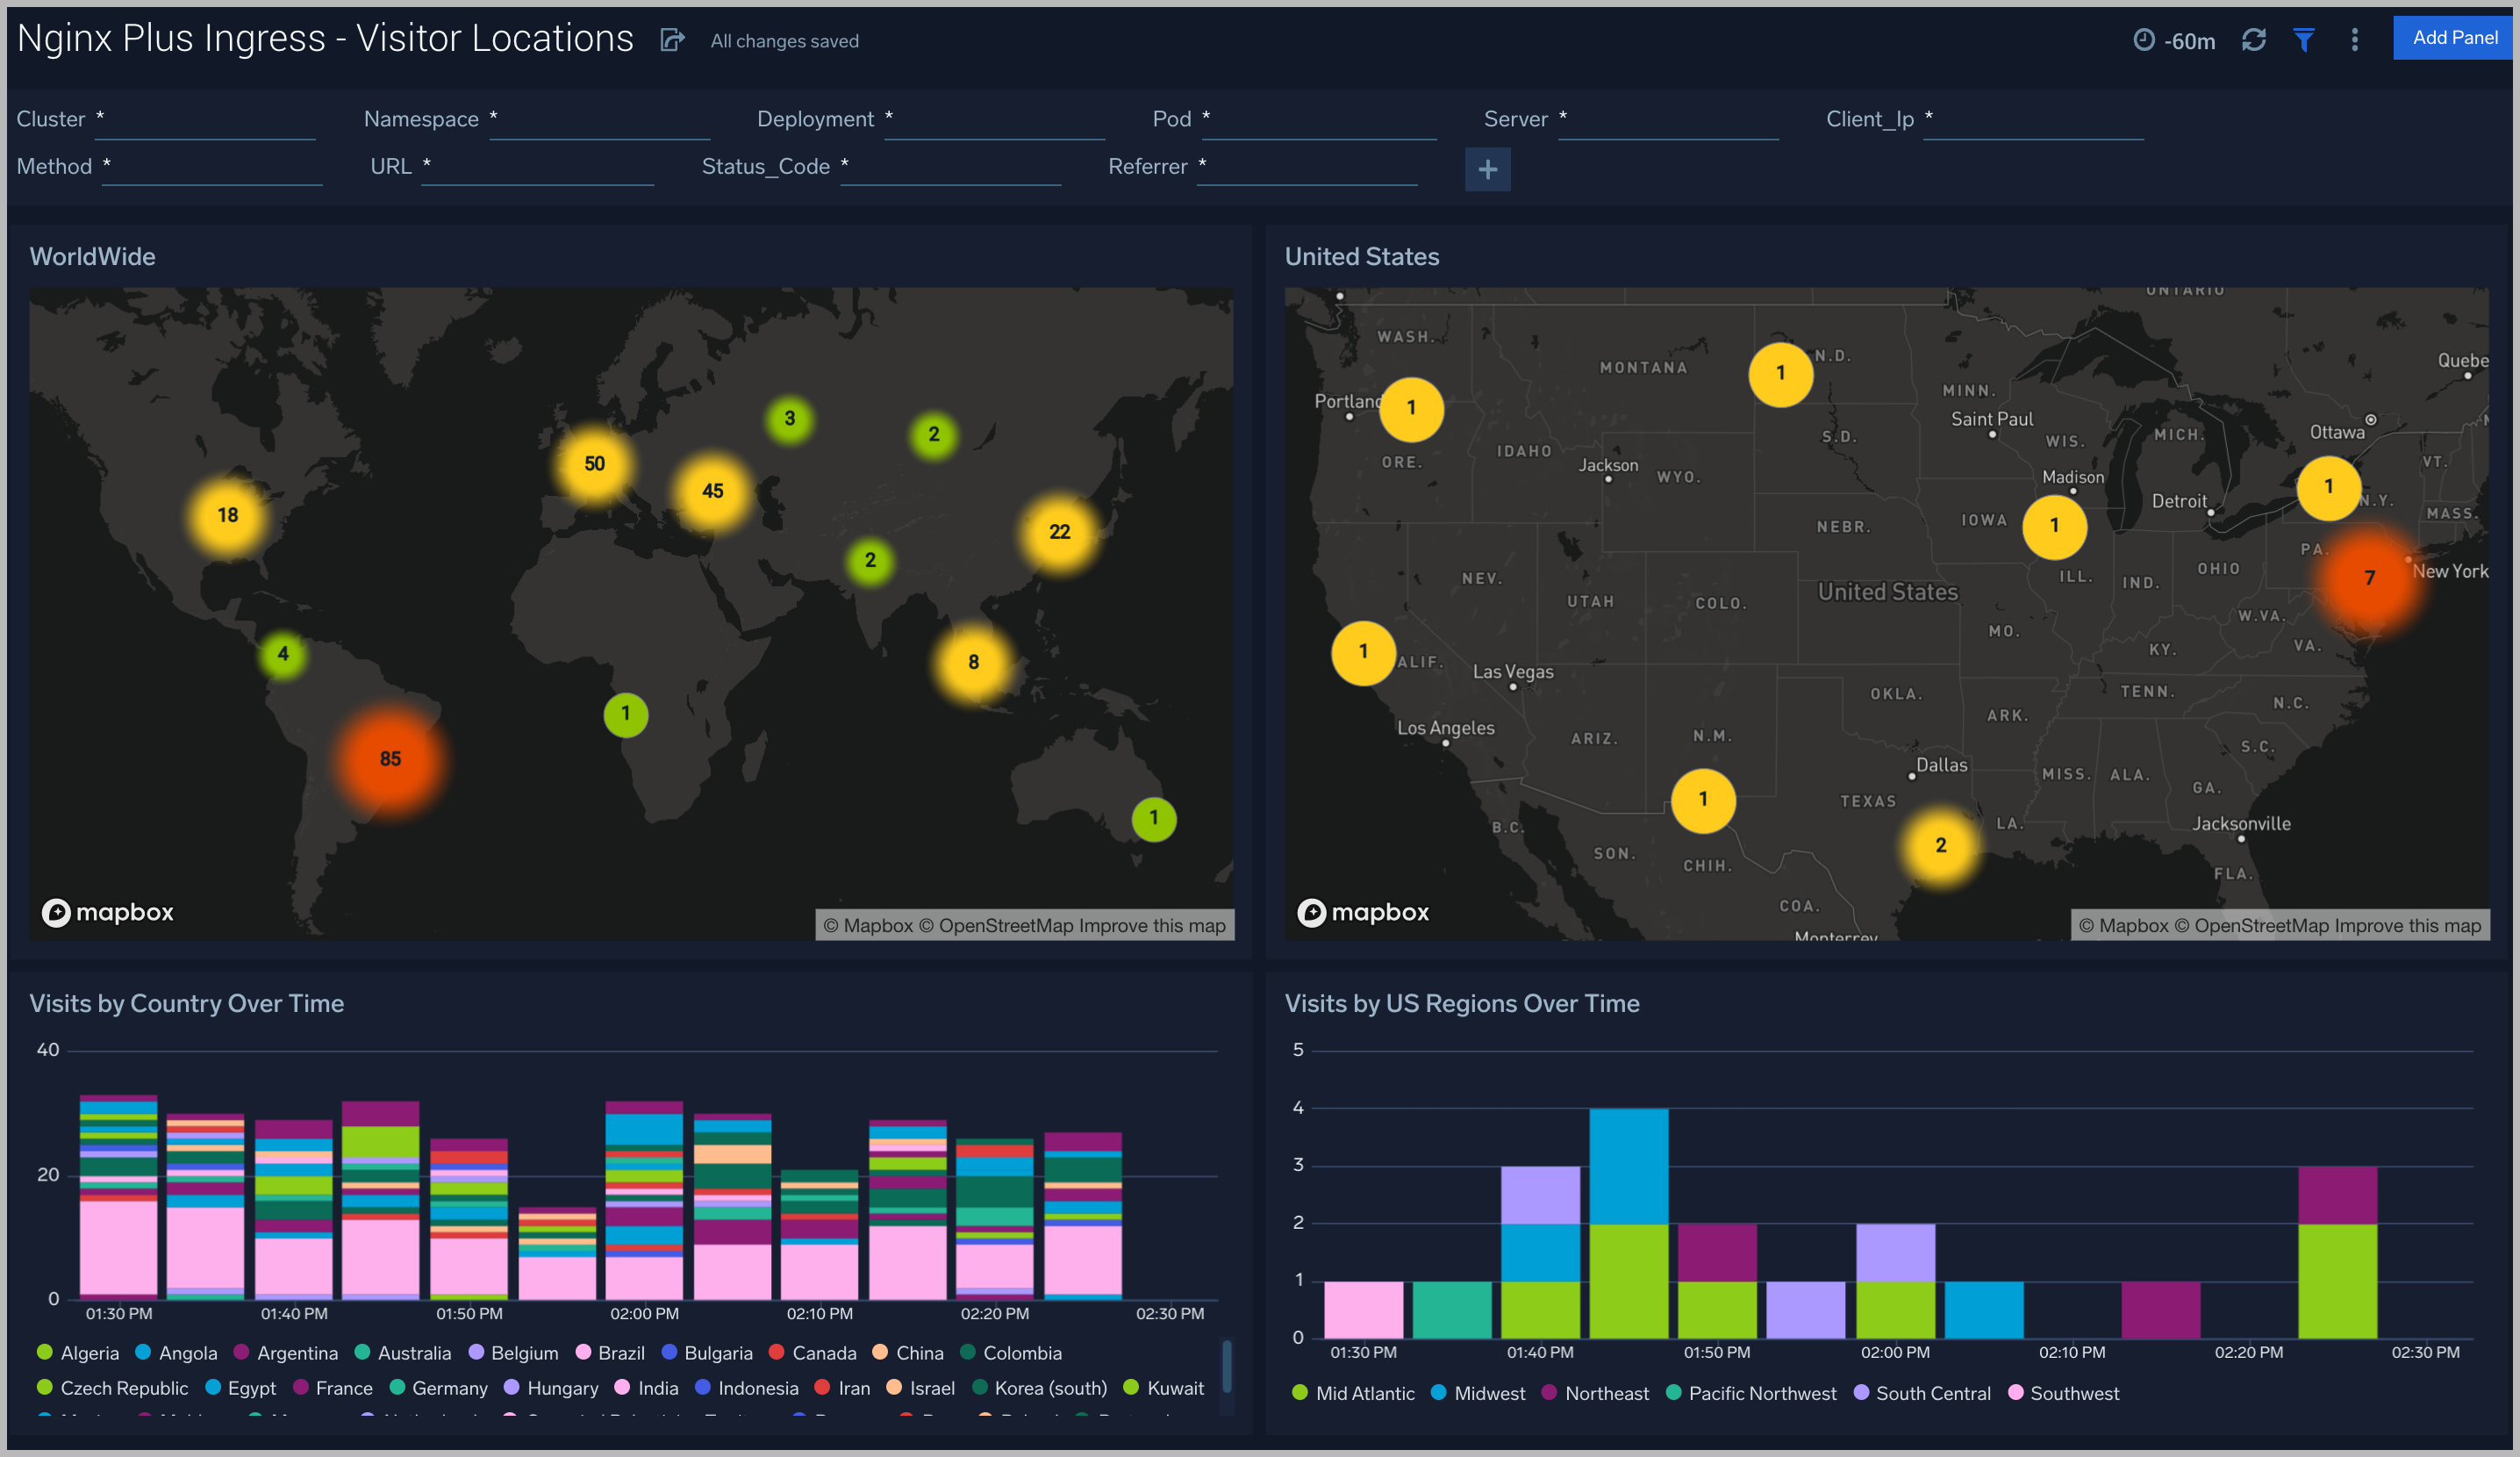
Visitor Locations
The Nginx Plus Ingress - Visitor Locations dashboard provides a high-level view of Nginx visitor geographic locations both worldwide and in the United States. Dashboard panels also show graphic trends for visits by country over time and visits by US region over time.
Use this dashboard to:
- Gain insights into the geographic locations of your user base. This is useful for resource planning in different regions across the globe.
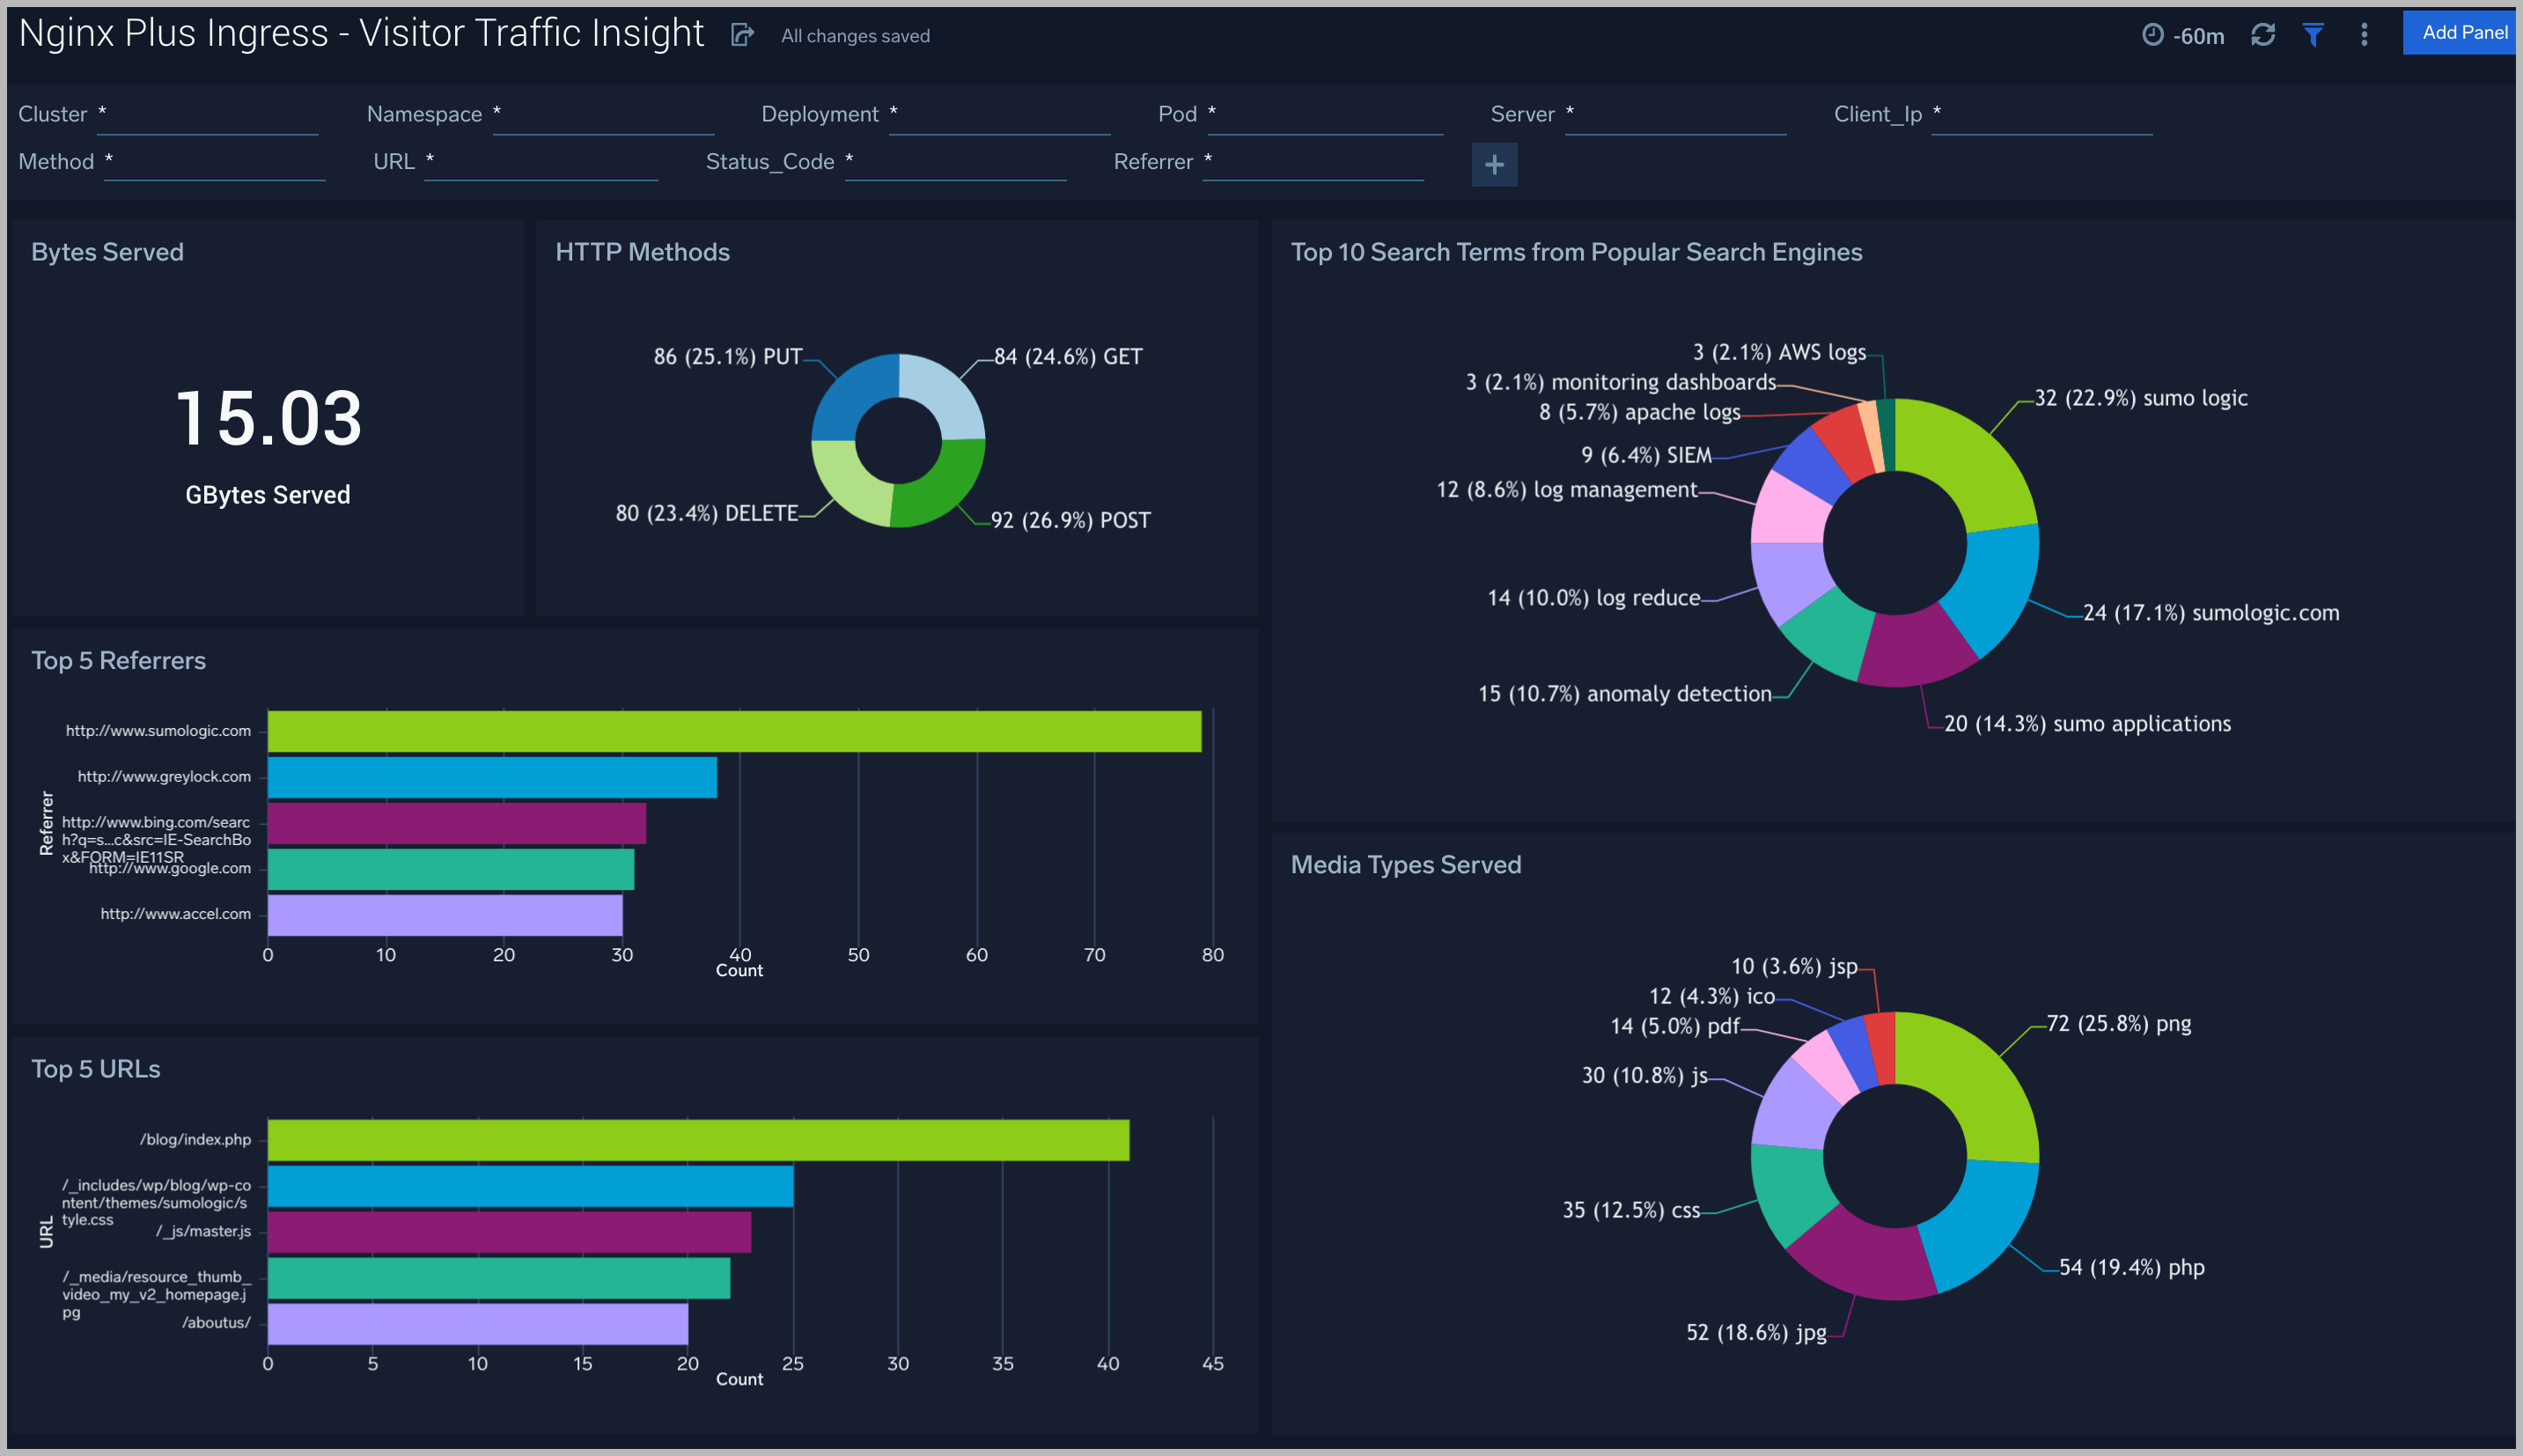
Visitor Traffic Insight
The Nginx Plus Ingress - Visitor Traffic Insight dashboard provides detailed information on the top documents accessed, top referrers, top search terms from popular search engines, and the media types served.
Use this dashboard to:
- To understand the type of content that is frequently requested by users.
- It helps in allocating IT resources according to the content types.
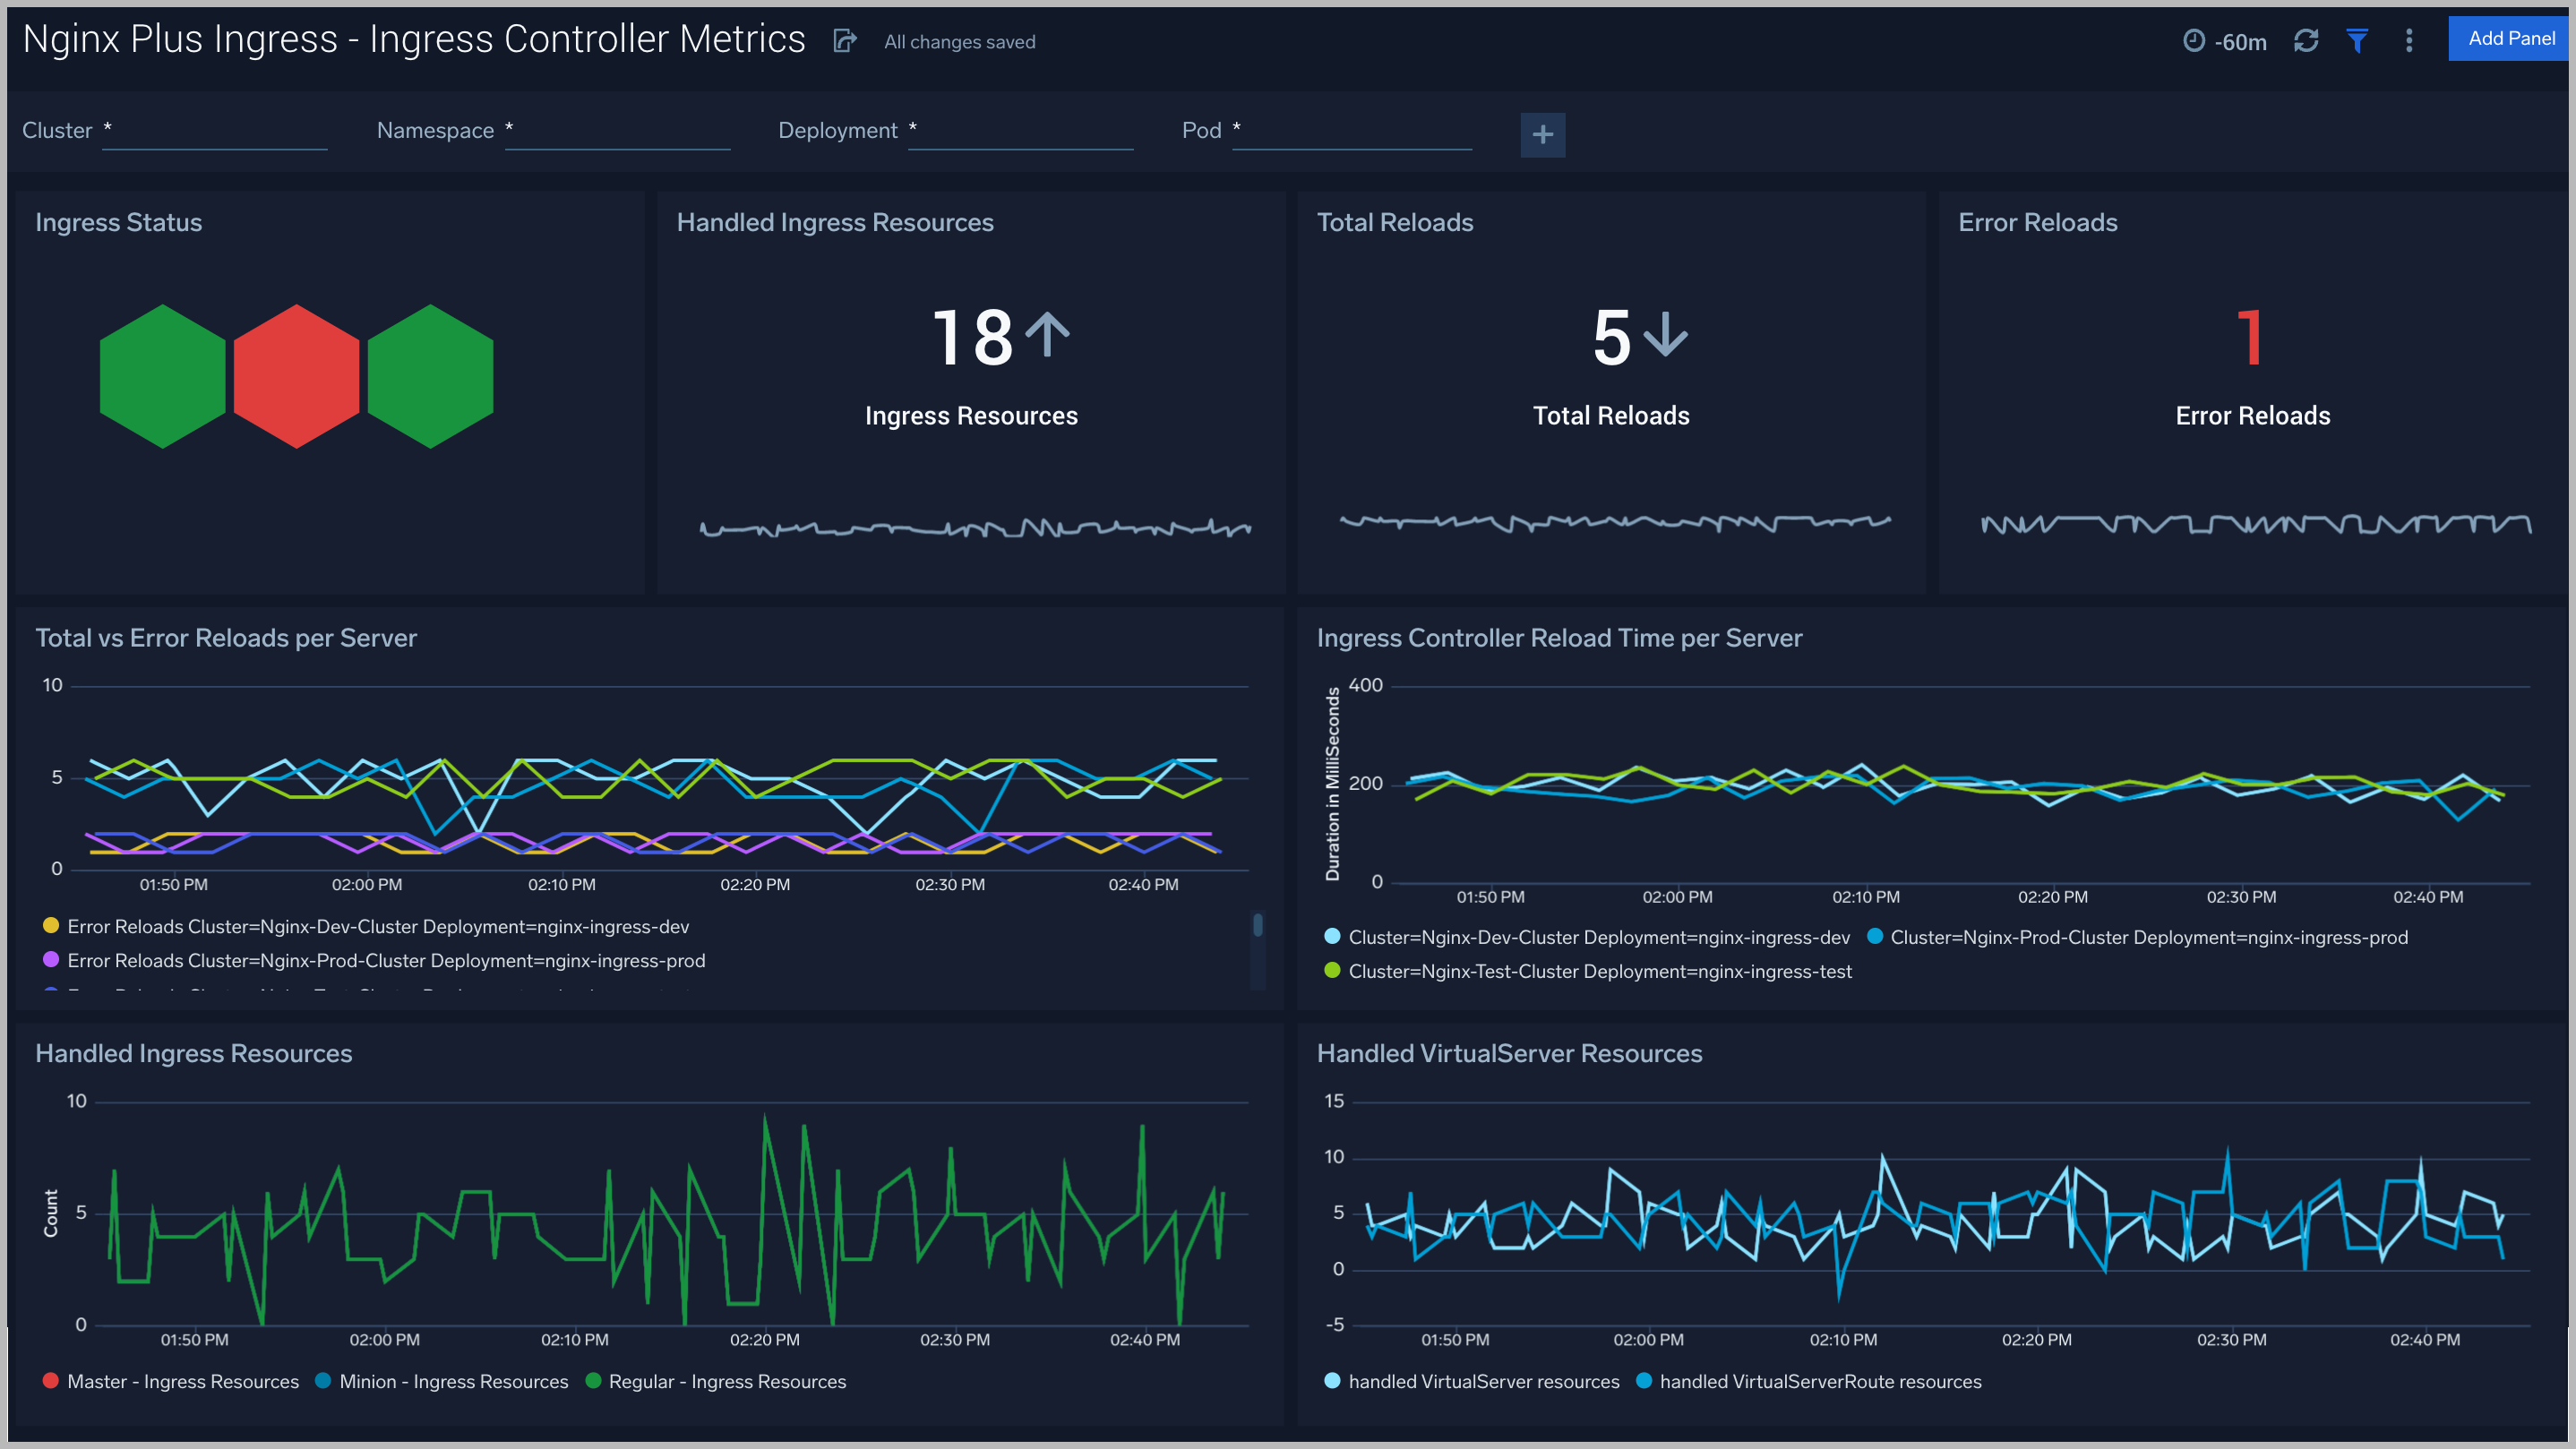
Ingress Controller Metrics
The Nginx Plus Ingress - Ingress Controller Metrics dashboard provides you insight into the status, reloads, and failure of the Kubernetes Nginx Plus ingress controller.
Use this dashboard to:
- Gain information about Nginx ingress Controller status and reloads. This helps you understand the availability of Nginx Ingress controllers.
- Gain information about Nginx reload time and any reload errors.
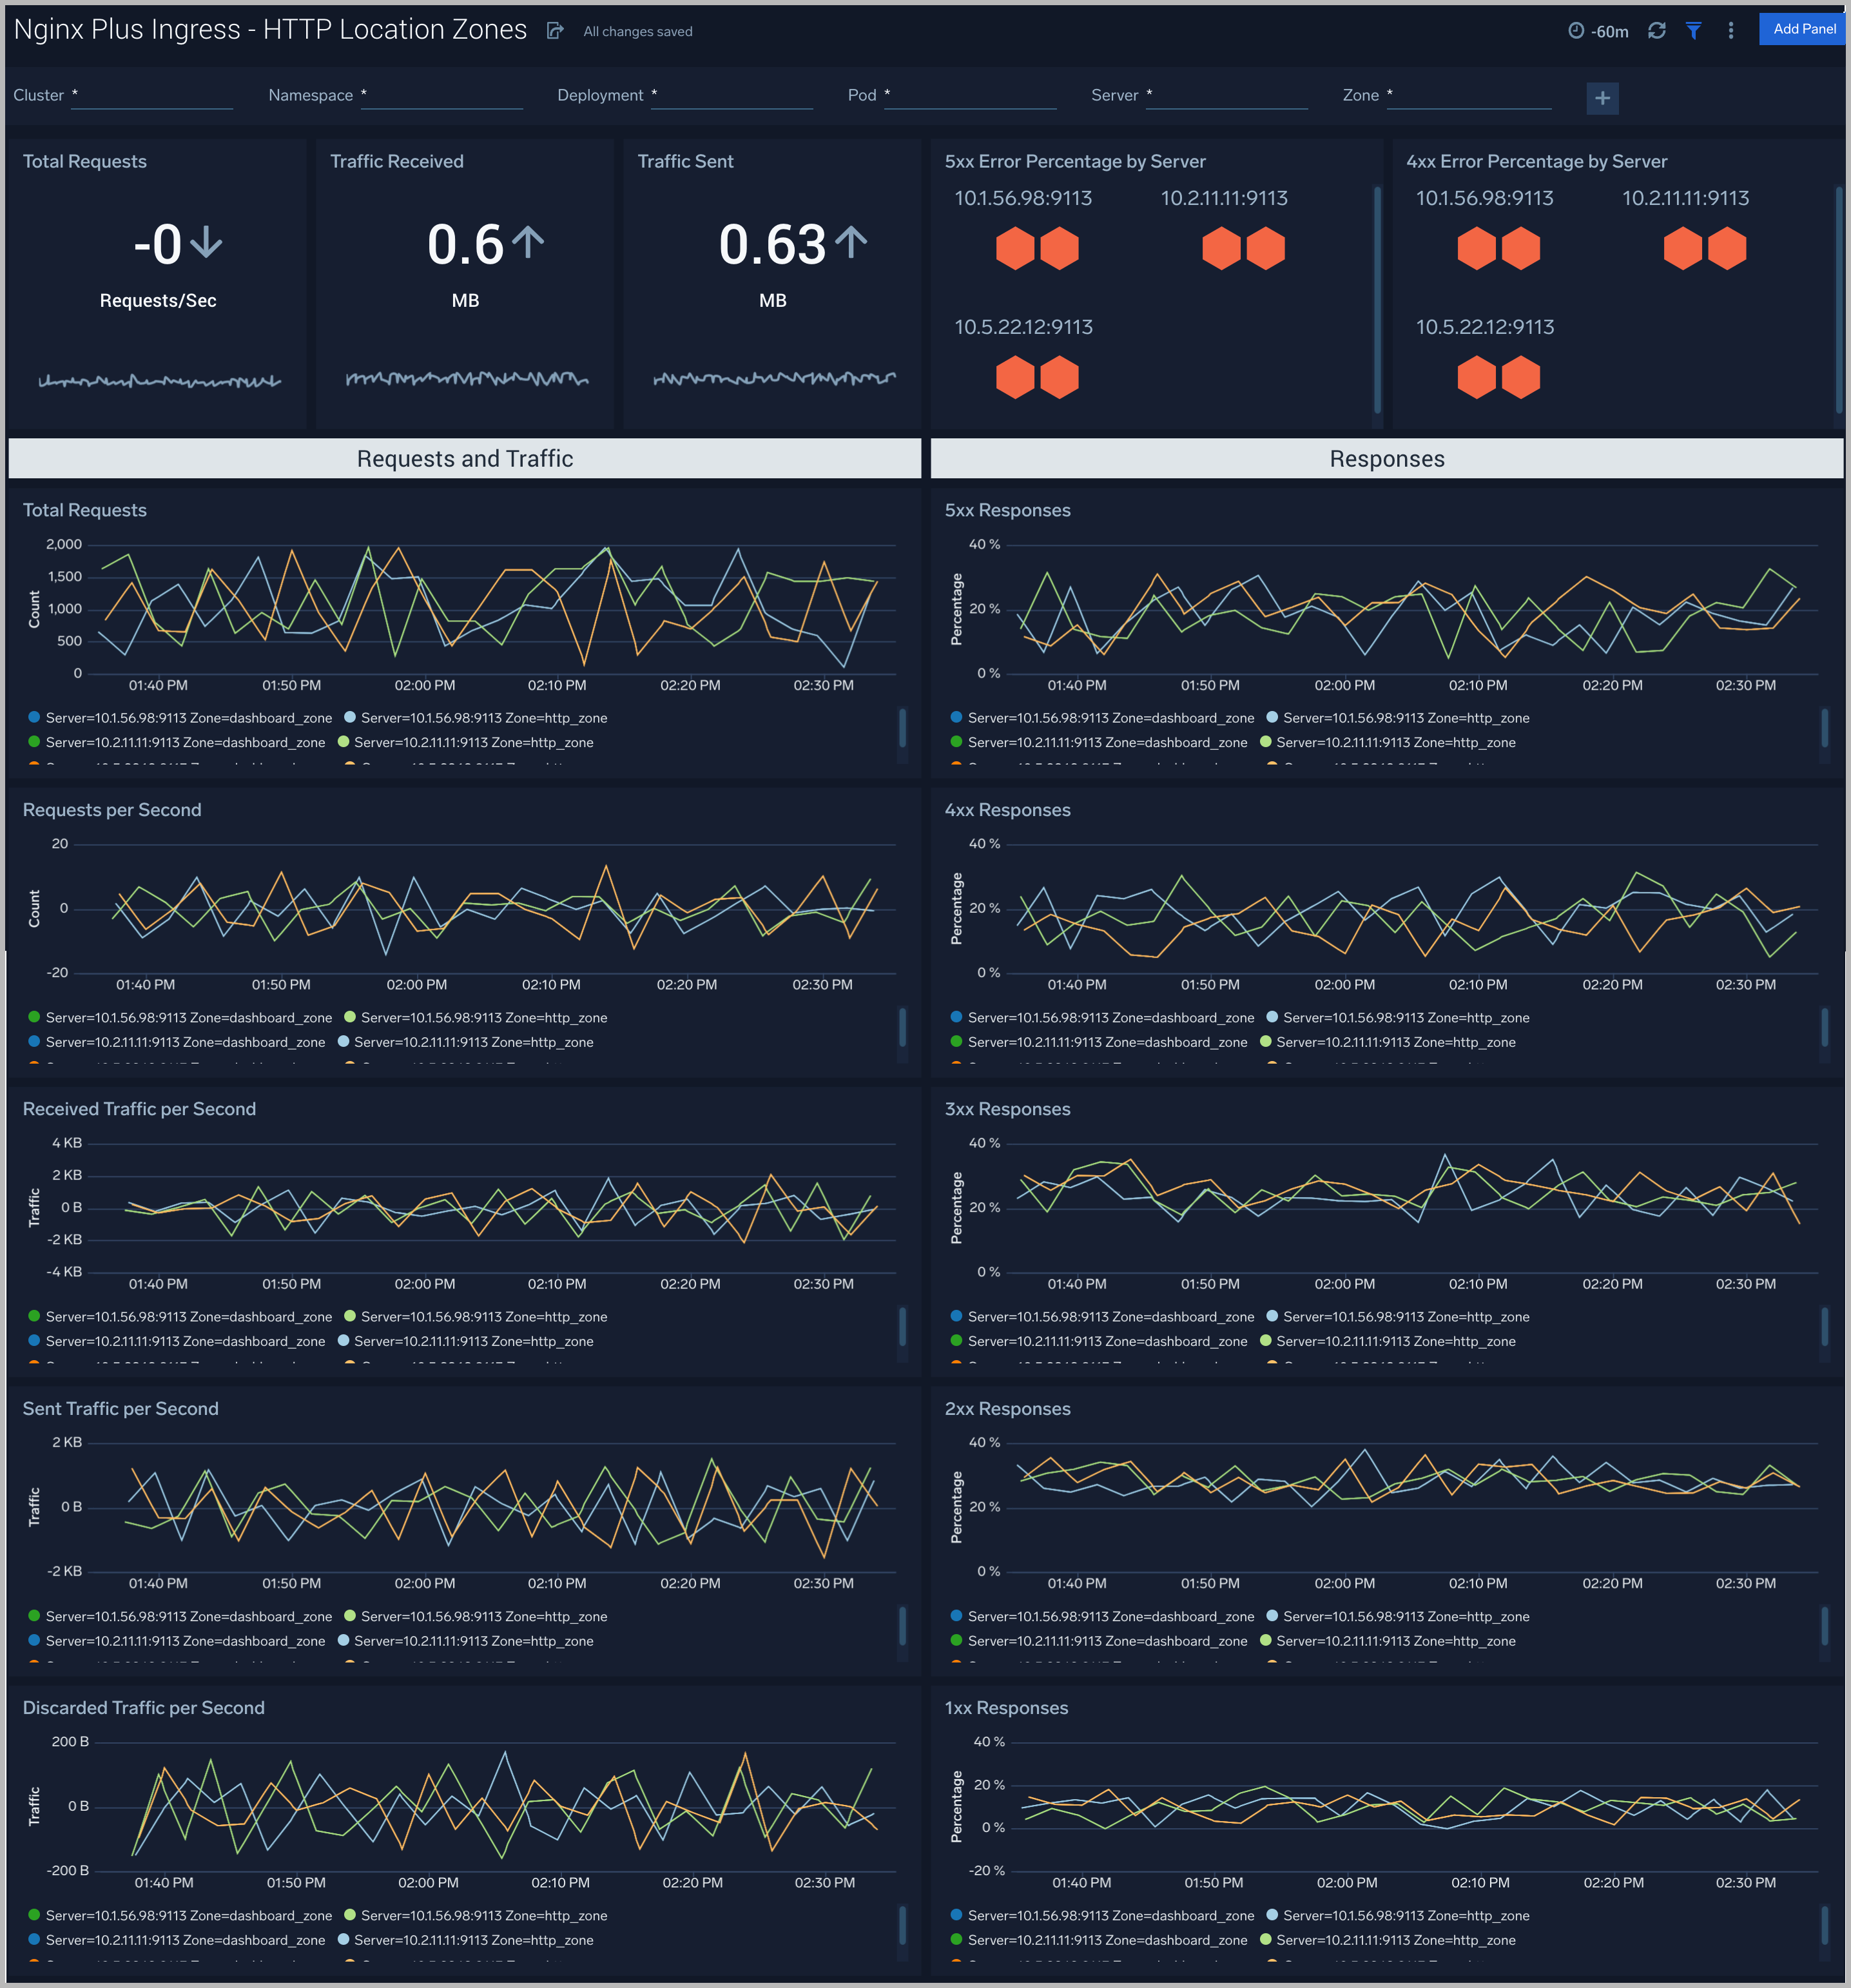
HTTP Location Zones
The Nginx Plus Ingress - HTTP Location Zones metrics dashboard provides detailed statistics on the frontend performance, showing traffic speed, responses/requests count, and various error responses.
Use this dashboard to:
- Gain information about Location HTTP zones traffic: received and sent; speed, requires/responses amount, discarded traffic.
- Gain information about Location HTTP zones error responses: percentage of responses by the server, percentage of each type of error response.
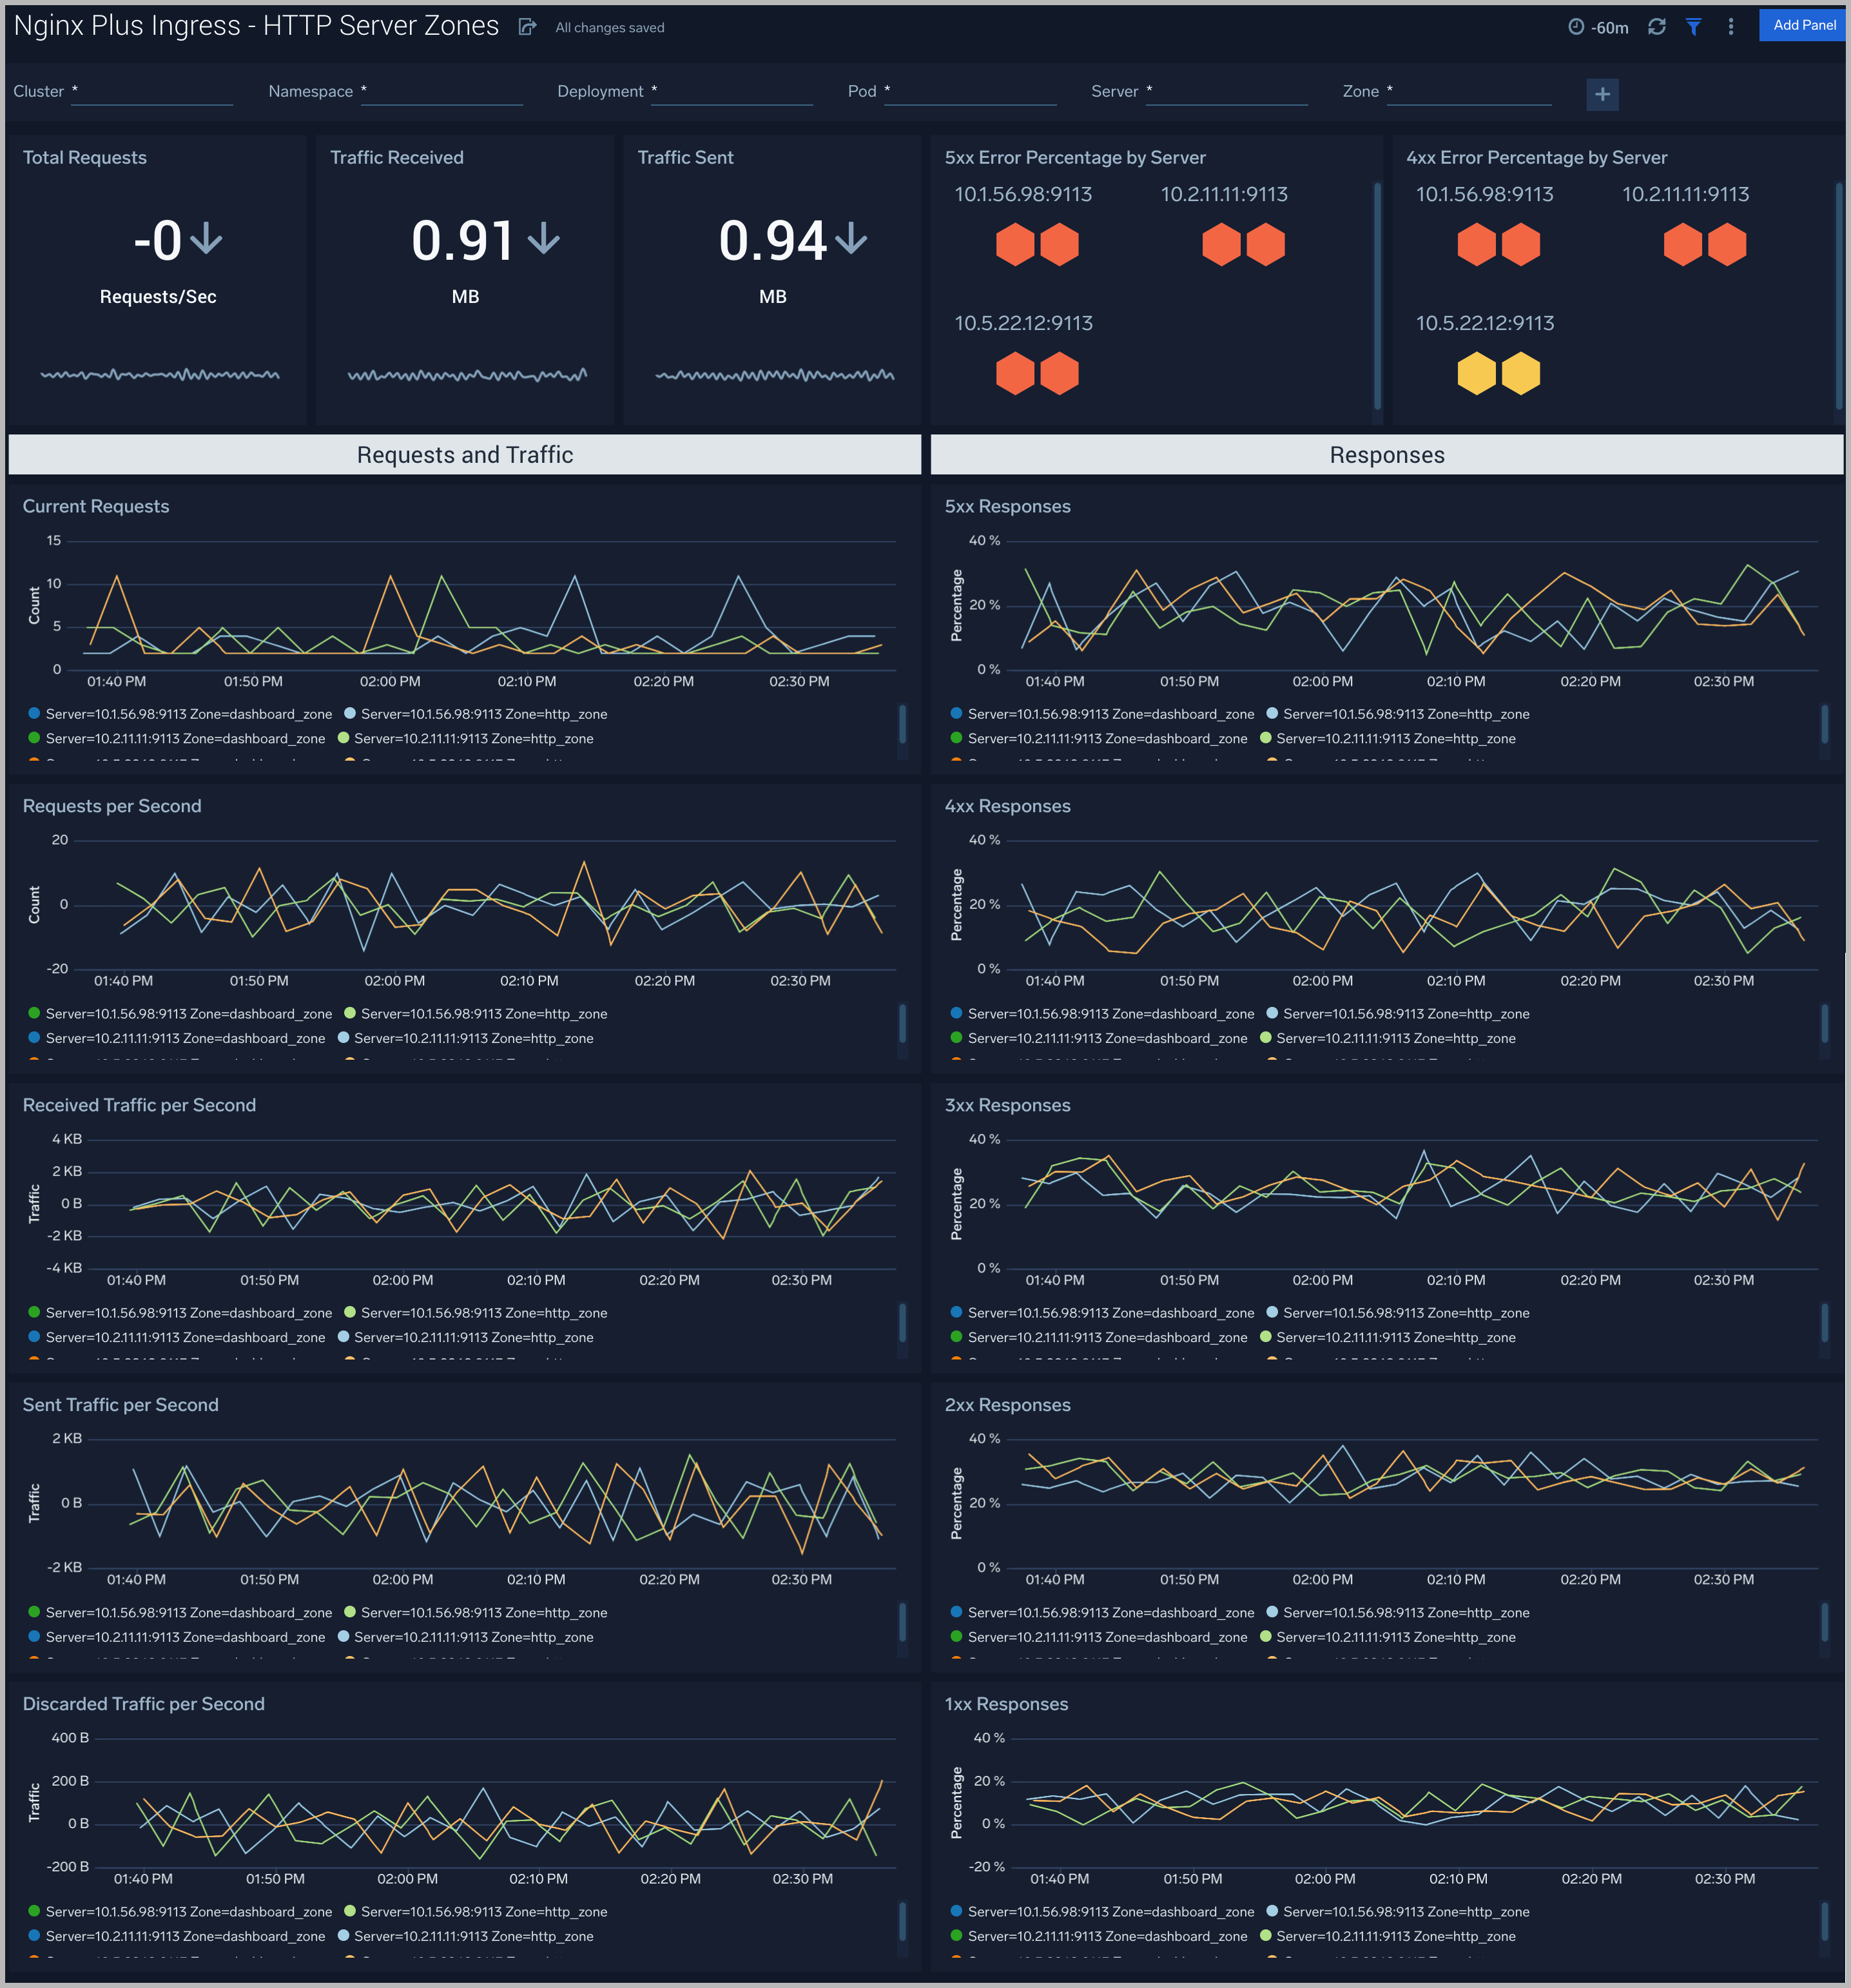
HTTP Server Zones
The Nginx Plus Ingress - HTTP Server Zones metrics dashboard provides detailed statistics on the frontend performance, showing traffic speed, responses/requests count, and various error responses.
Use this dashboard to:
- Gain information about Server HTTP zones traffic: received and sent; speed, requires/responses amount, discarded traffic.
- Gain information about Server HTTP zones error responses: percentage of responses by the server, percentage of each type of error response.
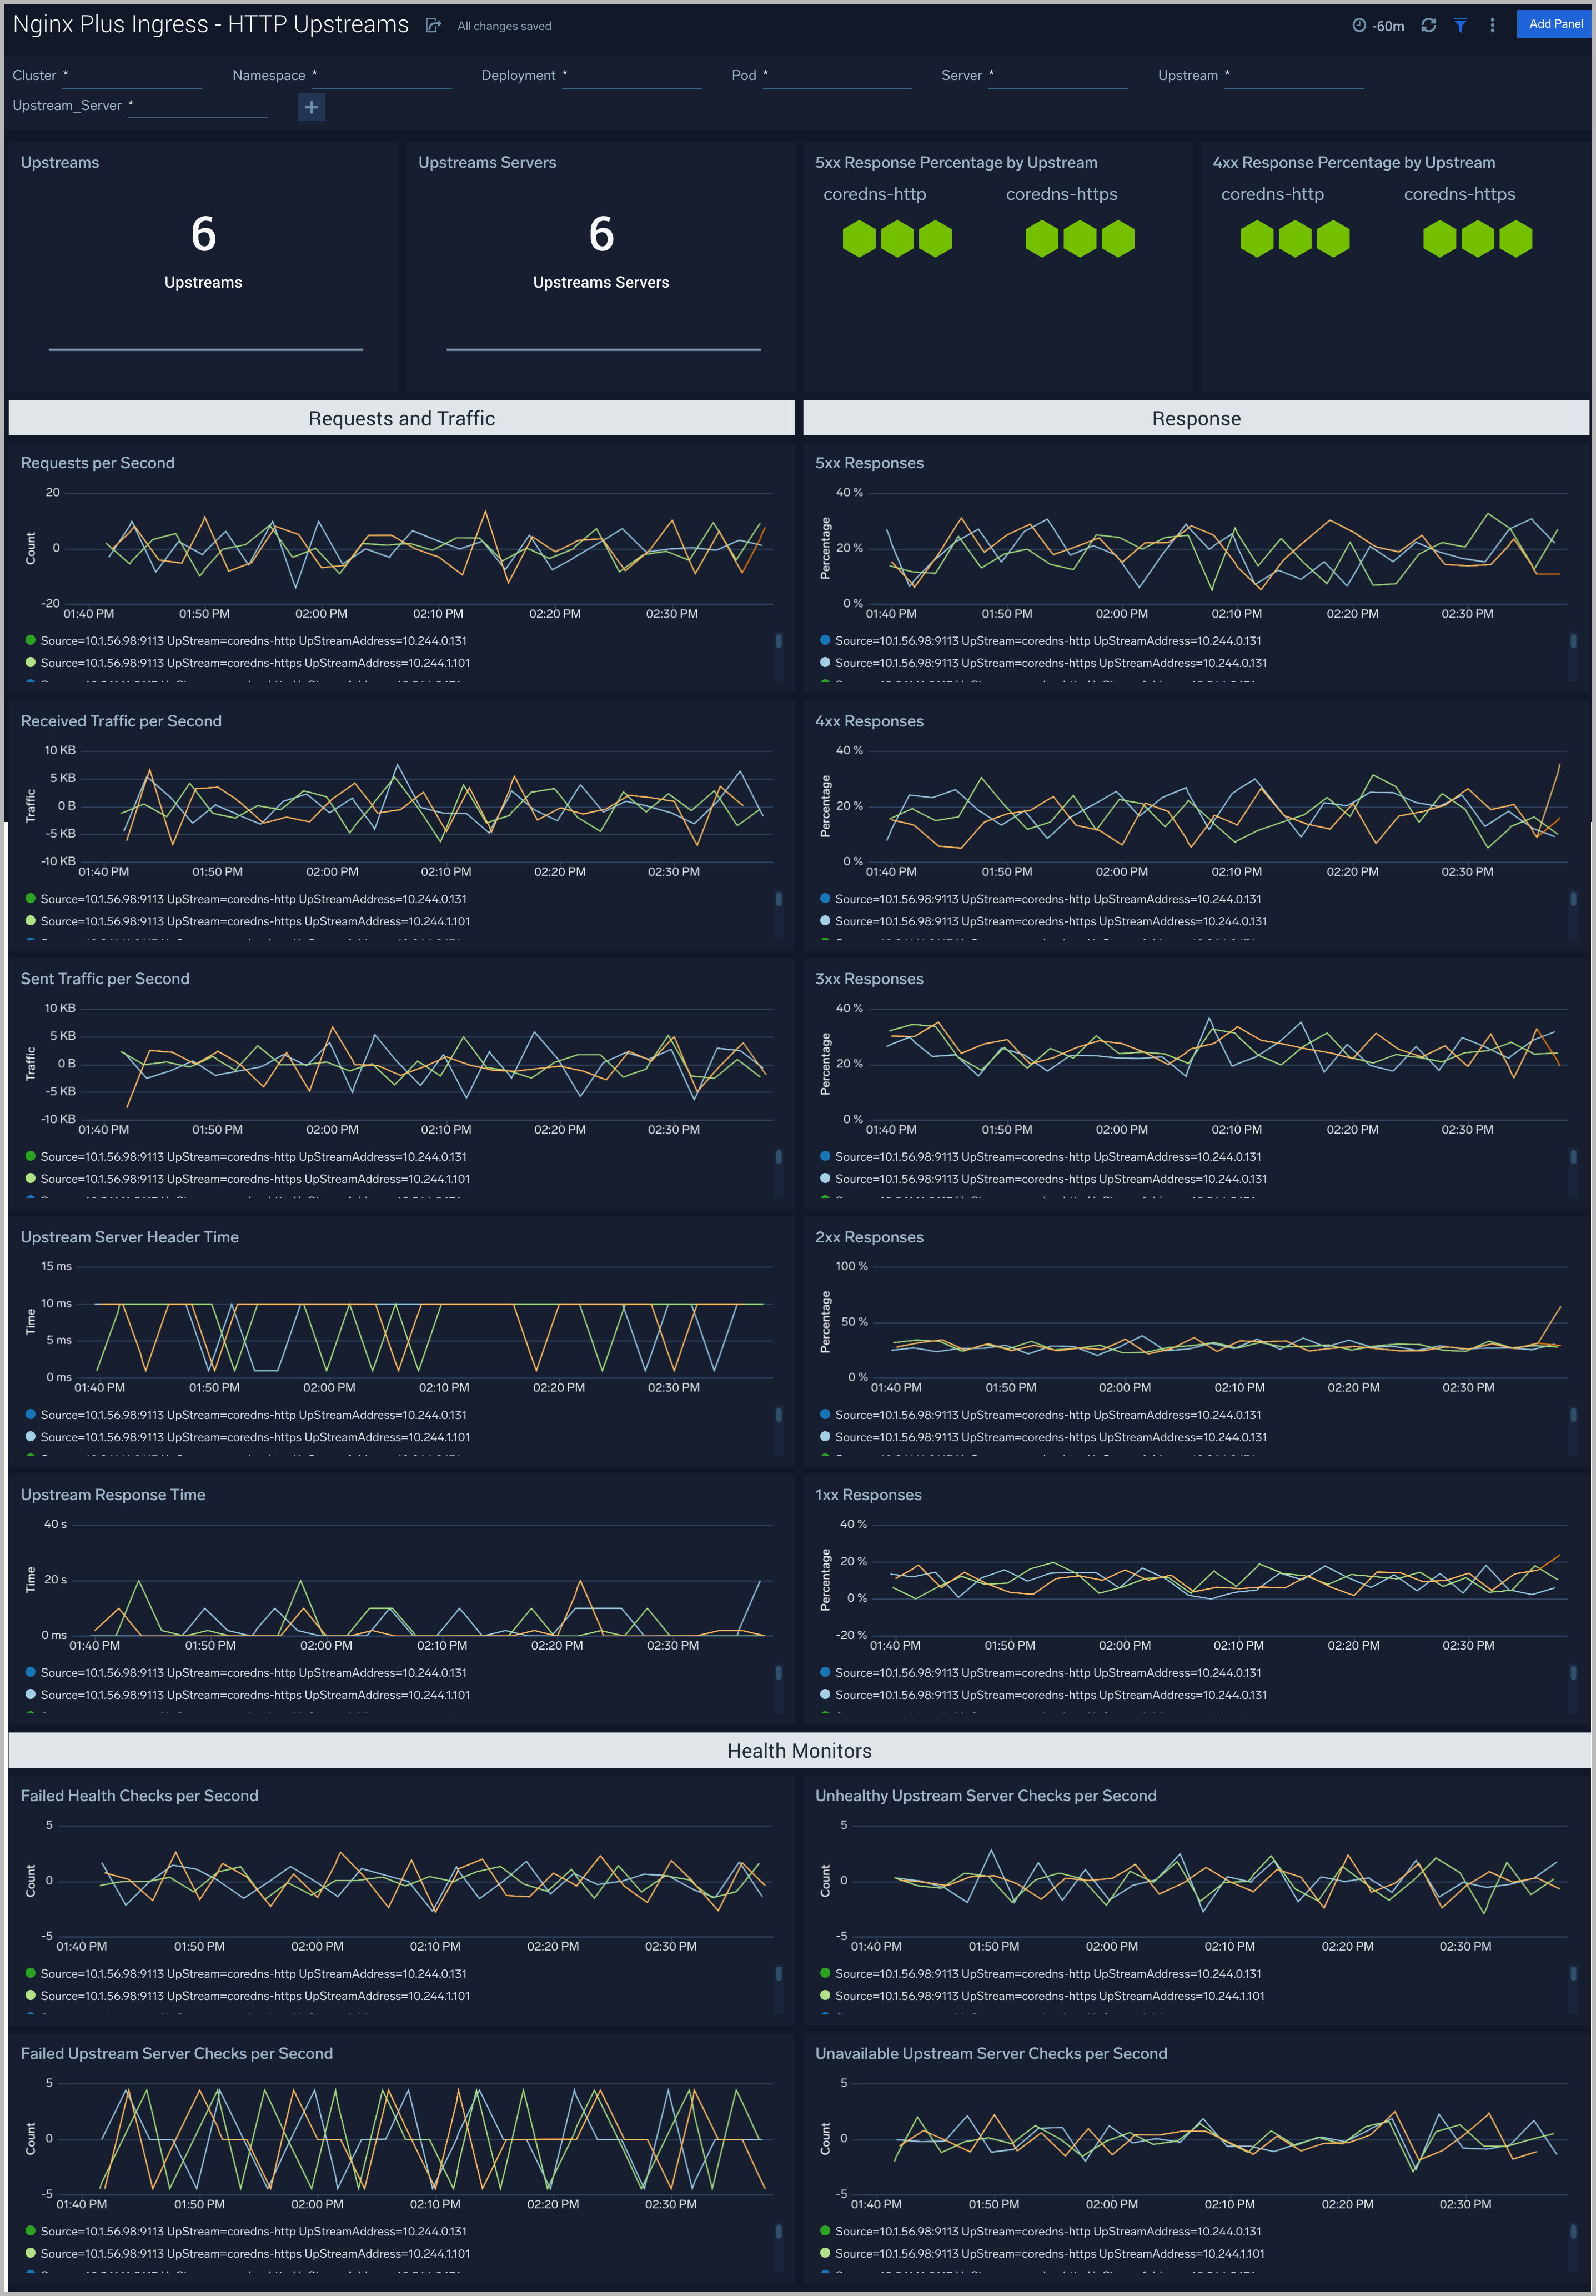
HTTP Upstreams
The Nginx Plus Ingress - HTTP Upstreams metrics dashboard provides information about each upstream group for HTTP and HTTPS traffic, showing the number of HTTP upstreams, servers, backup servers, error responses, and health monitoring.
Use this dashboard to:
- Gain information about HTTP upstreams, servers, and backup servers.
- Gain information about HTTP upstream traffic: received and sent; speed, requires/responses amount, downtime, and response time.
- Gain information about HTTP upstream error responses: percentage of responses by the server, percentage of each type of error response.
- Gain information about HTTP upstream health monitoring.
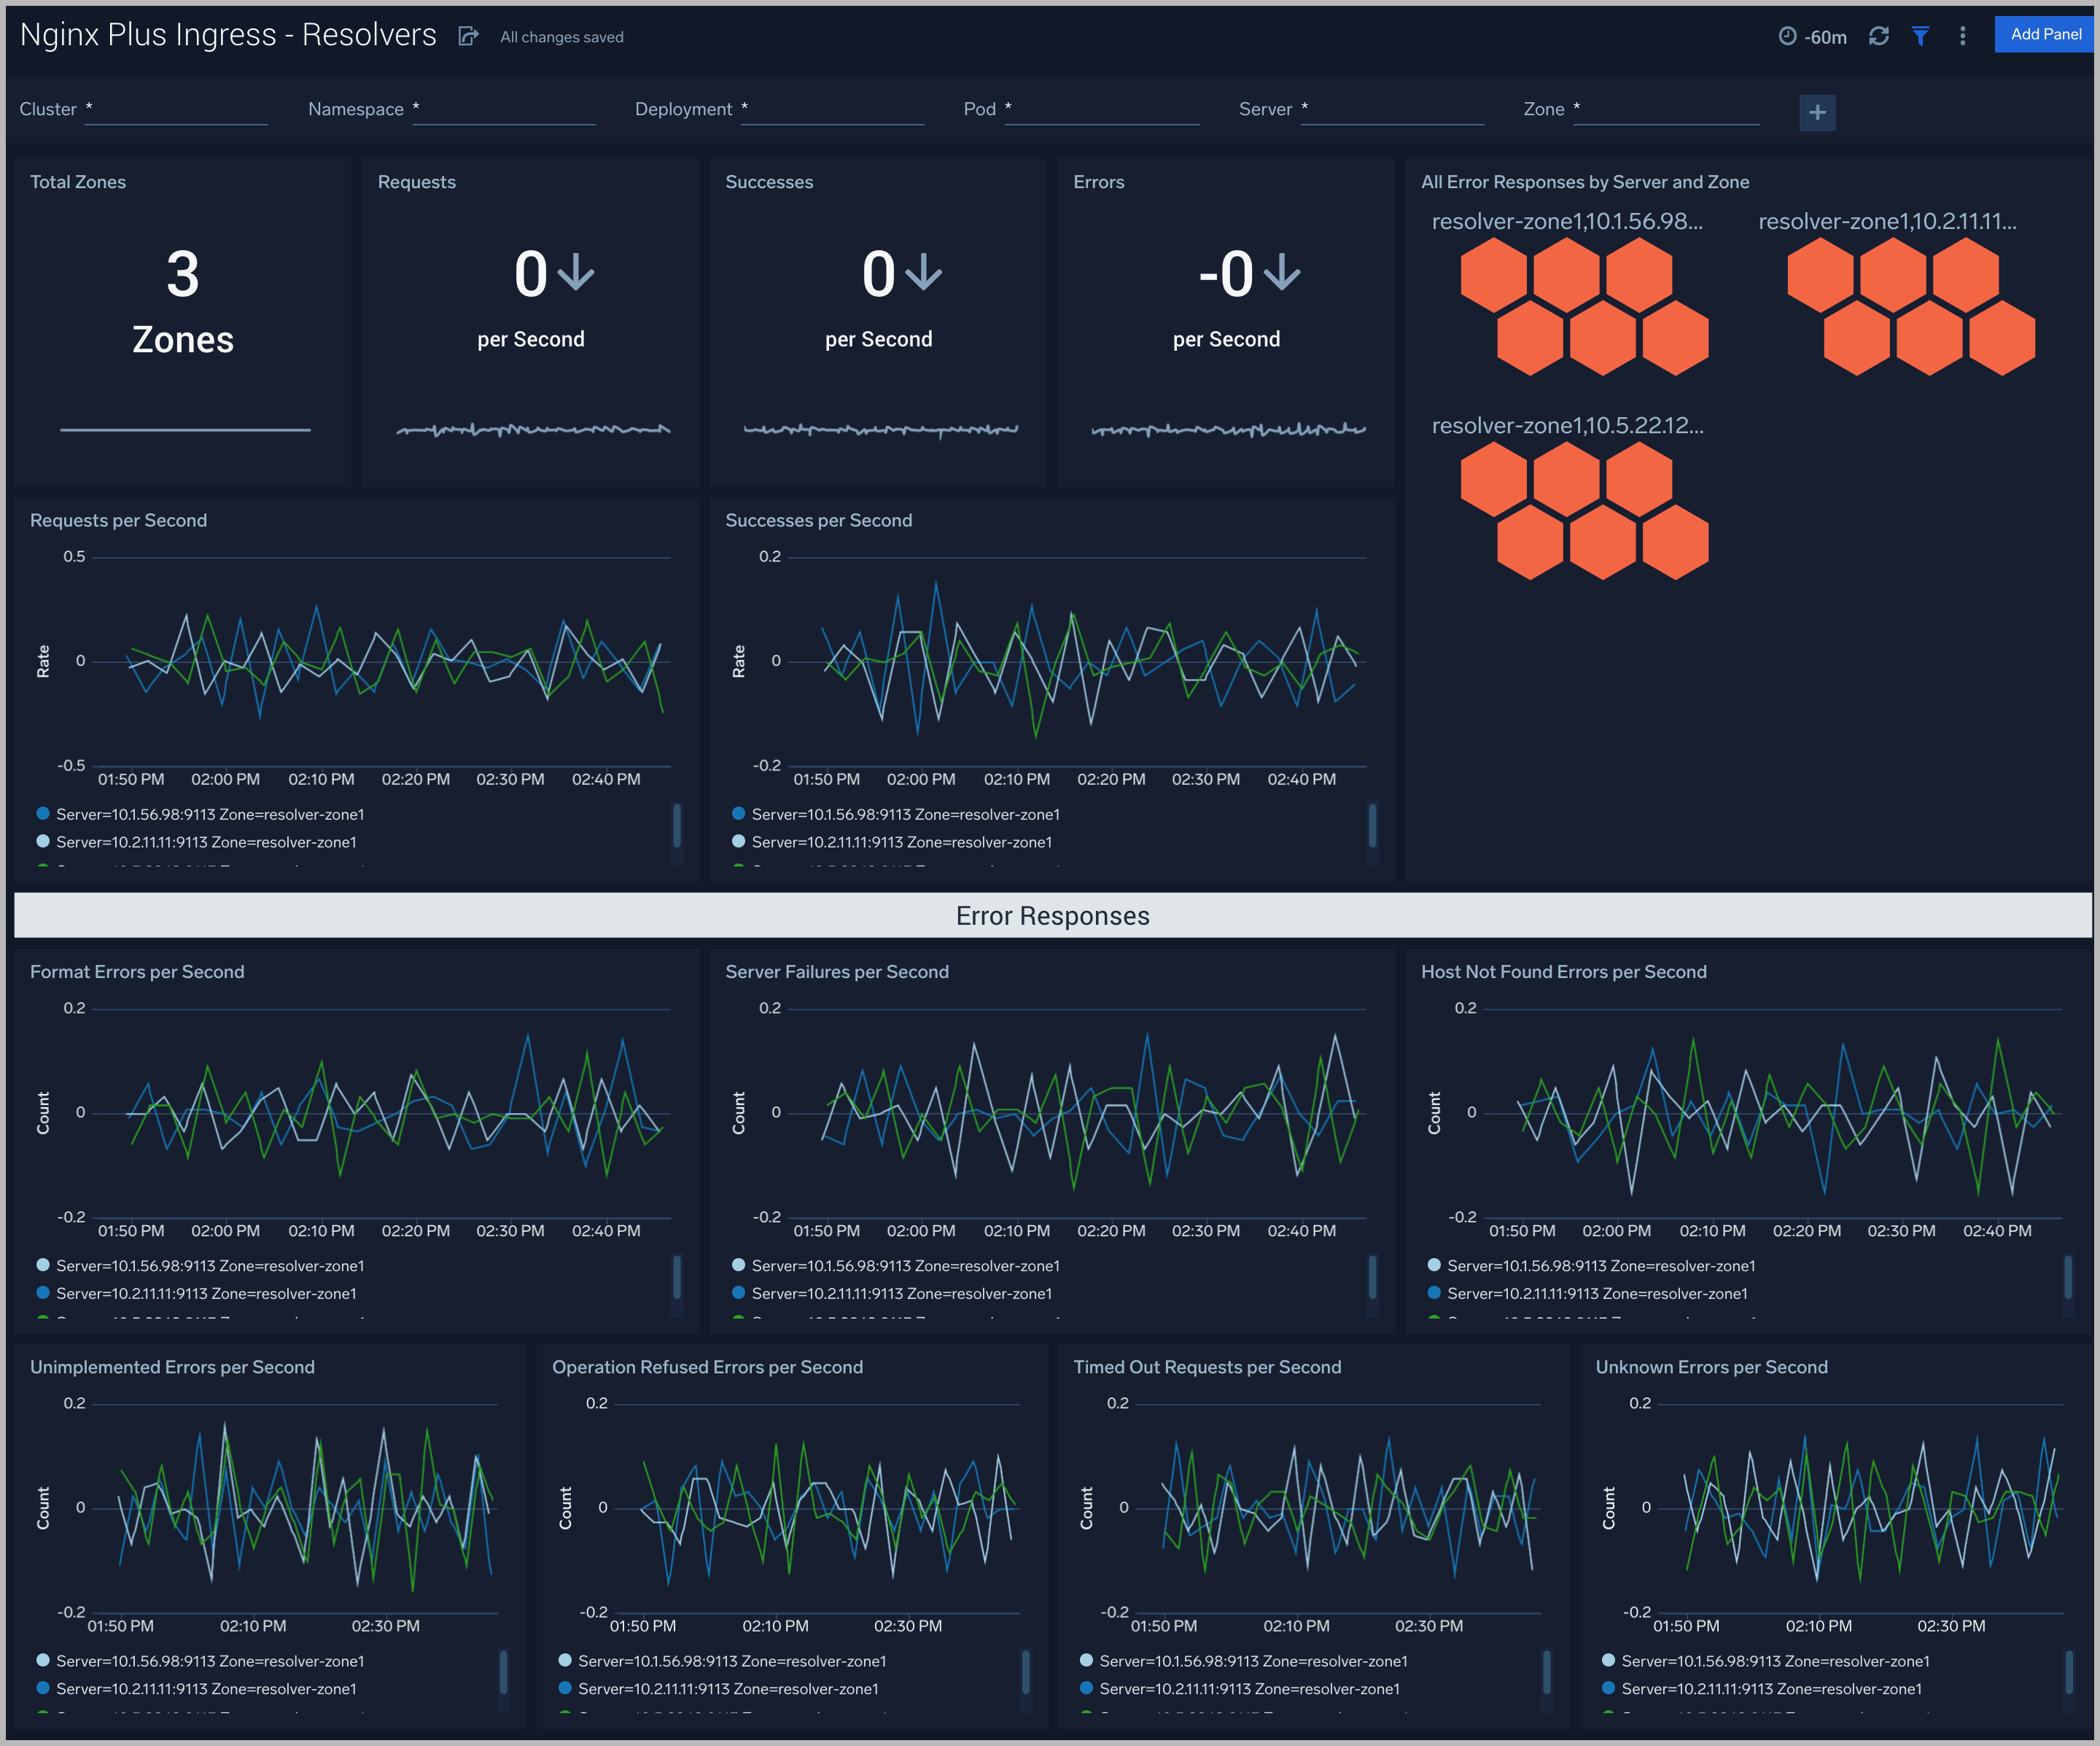
Resolvers
The Nginx Plus Ingress - Resolvers metrics dashboard provides DNS server statistics of requests and responses per each DNS status zone.
Use this dashboard to:
- Gain information about the total number of zones, responses, and request speed.
- Gain information about error responses by each type of error.
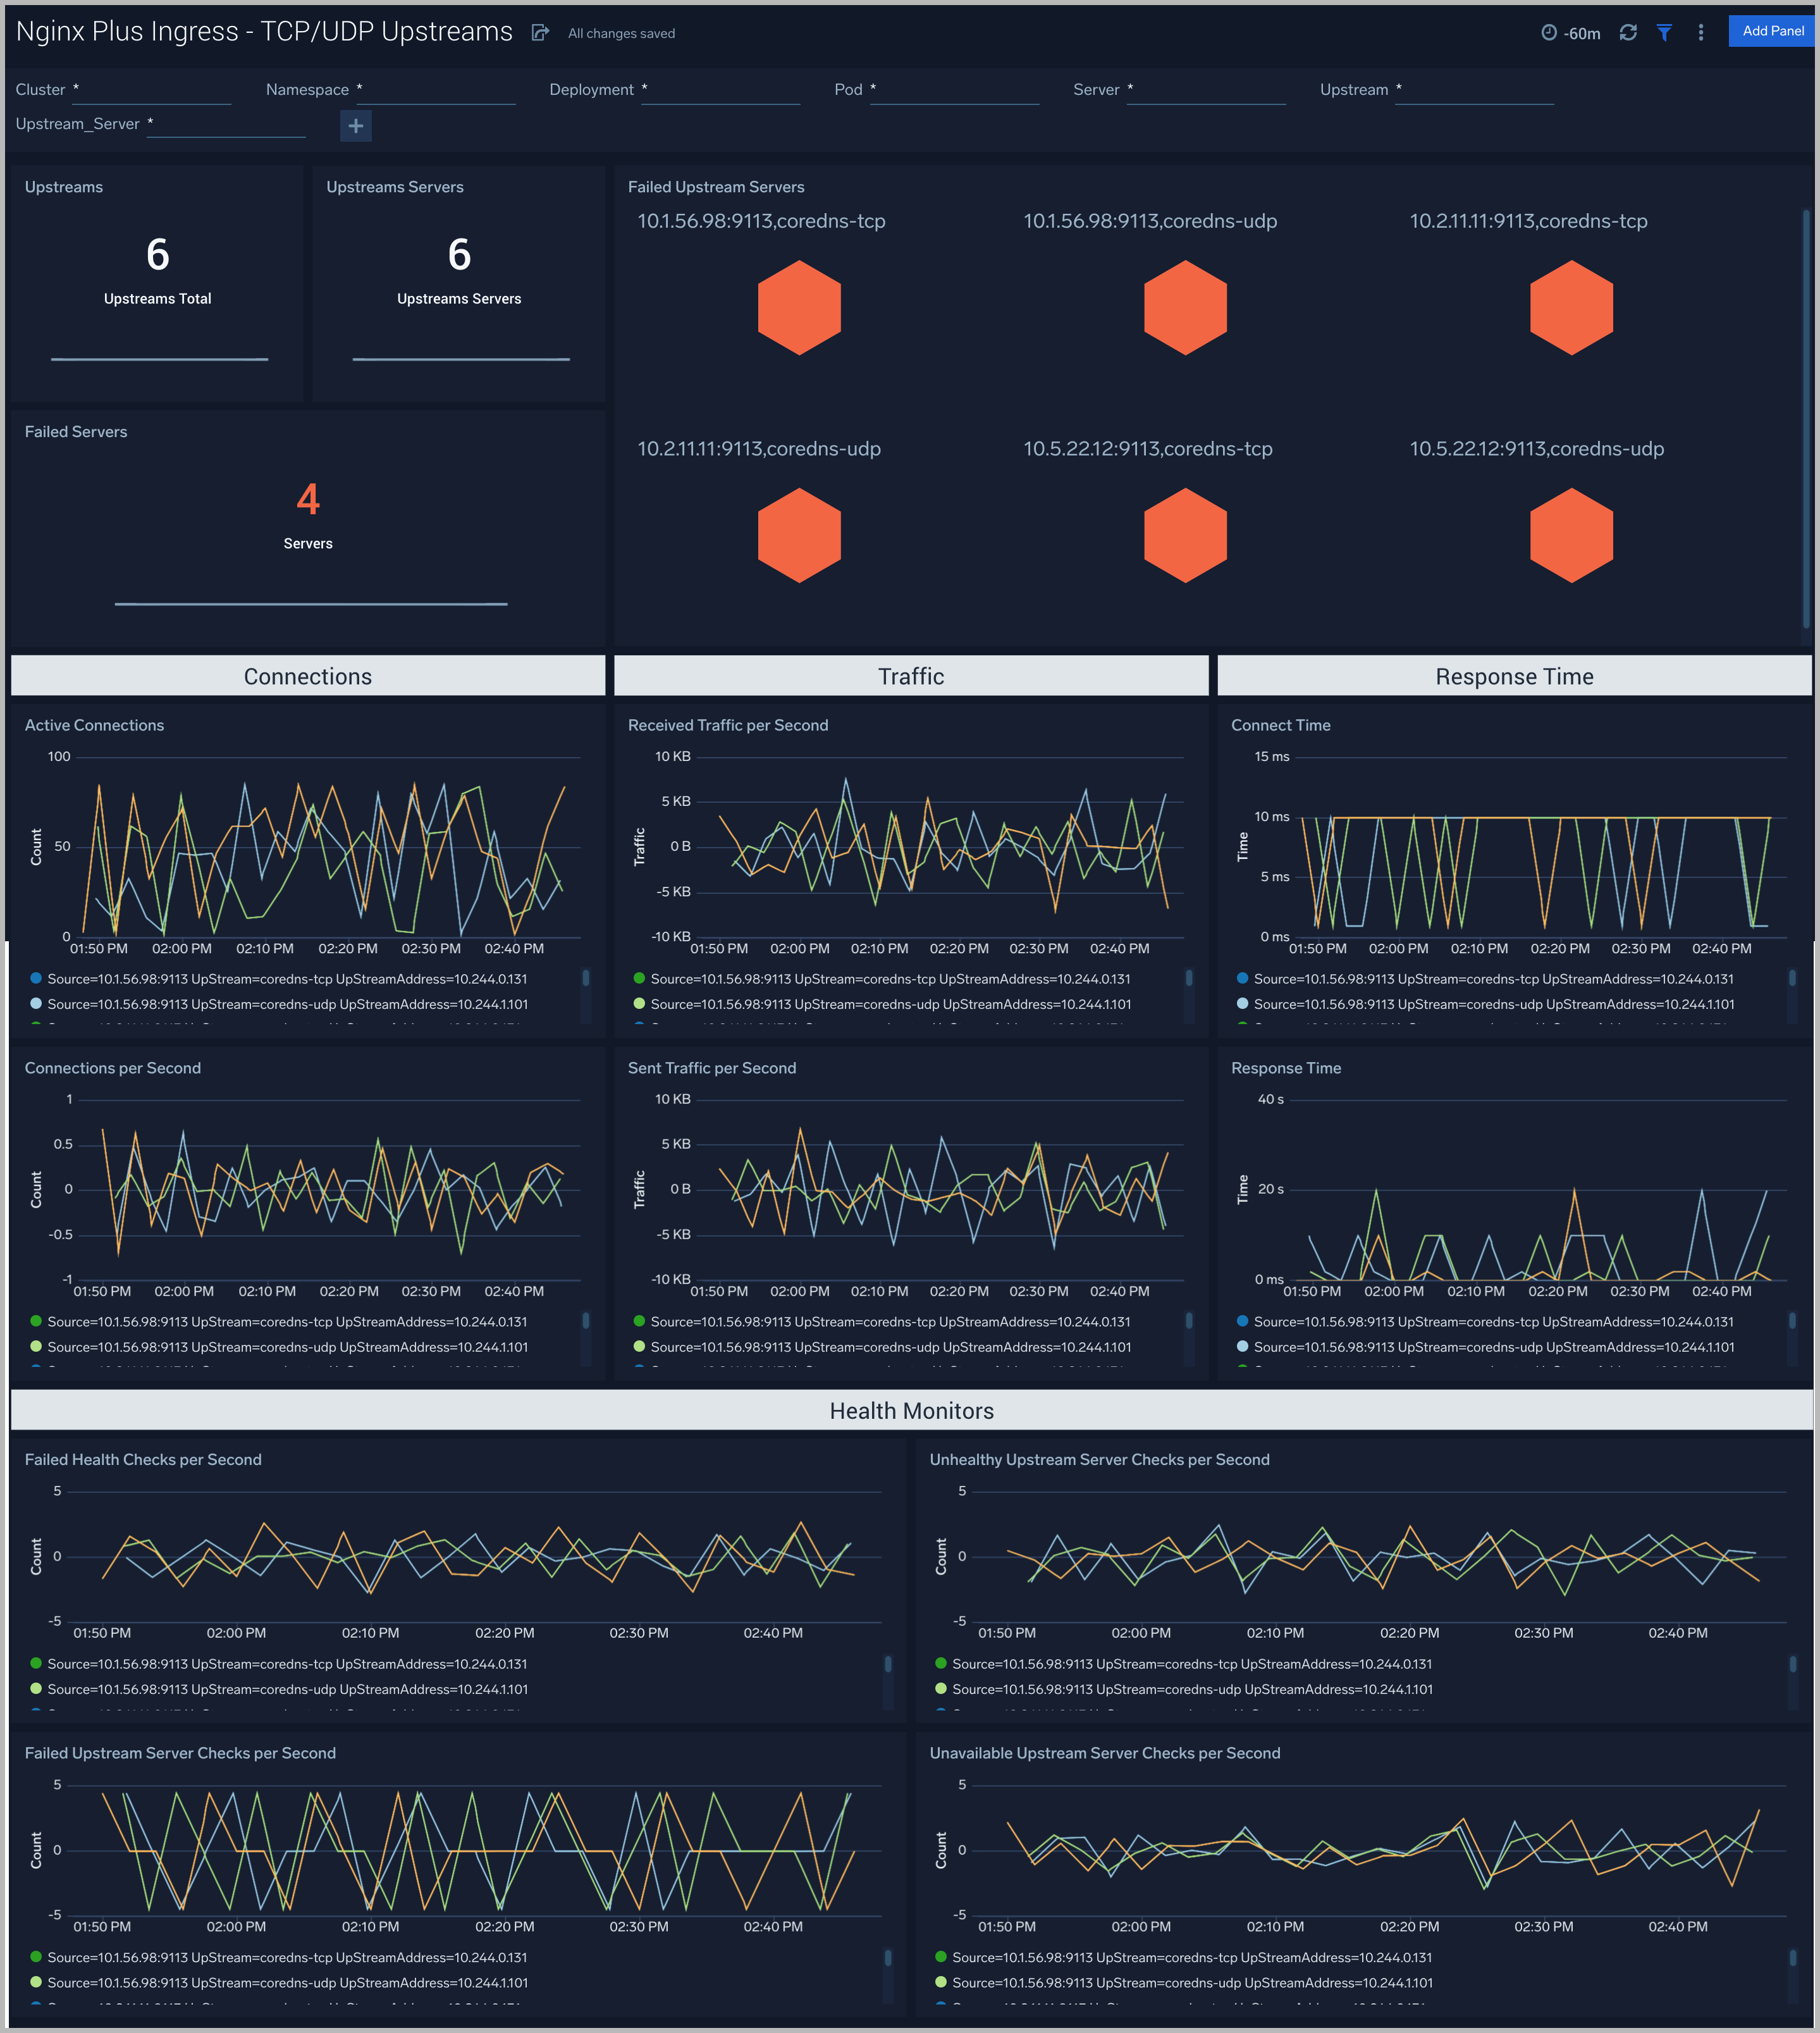
Nginx Plus Ingress- TCP/UDP Upstreams
The Nginx Plus Ingress - TCP/UDP Upstreams metrics dashboard provides information about each upstream group for TCP and UDP traffic, showing the number of TCP and UDP upstreams, servers, backup servers, error responses, and health monitoring.
Use this dashboard to:
- Gain information about TCP and UDP upstream, servers, and backup servers.
- Gain information about TCP and UDP upstream traffic: received and sent; speed, requests/responses amount, downtime, and response time.
- Gain information about TCP and UDP upstream error responses: percentage of responses by the server, percentage of each type of error response.
- Gain information about TCP and UDP upstream health monitoring.
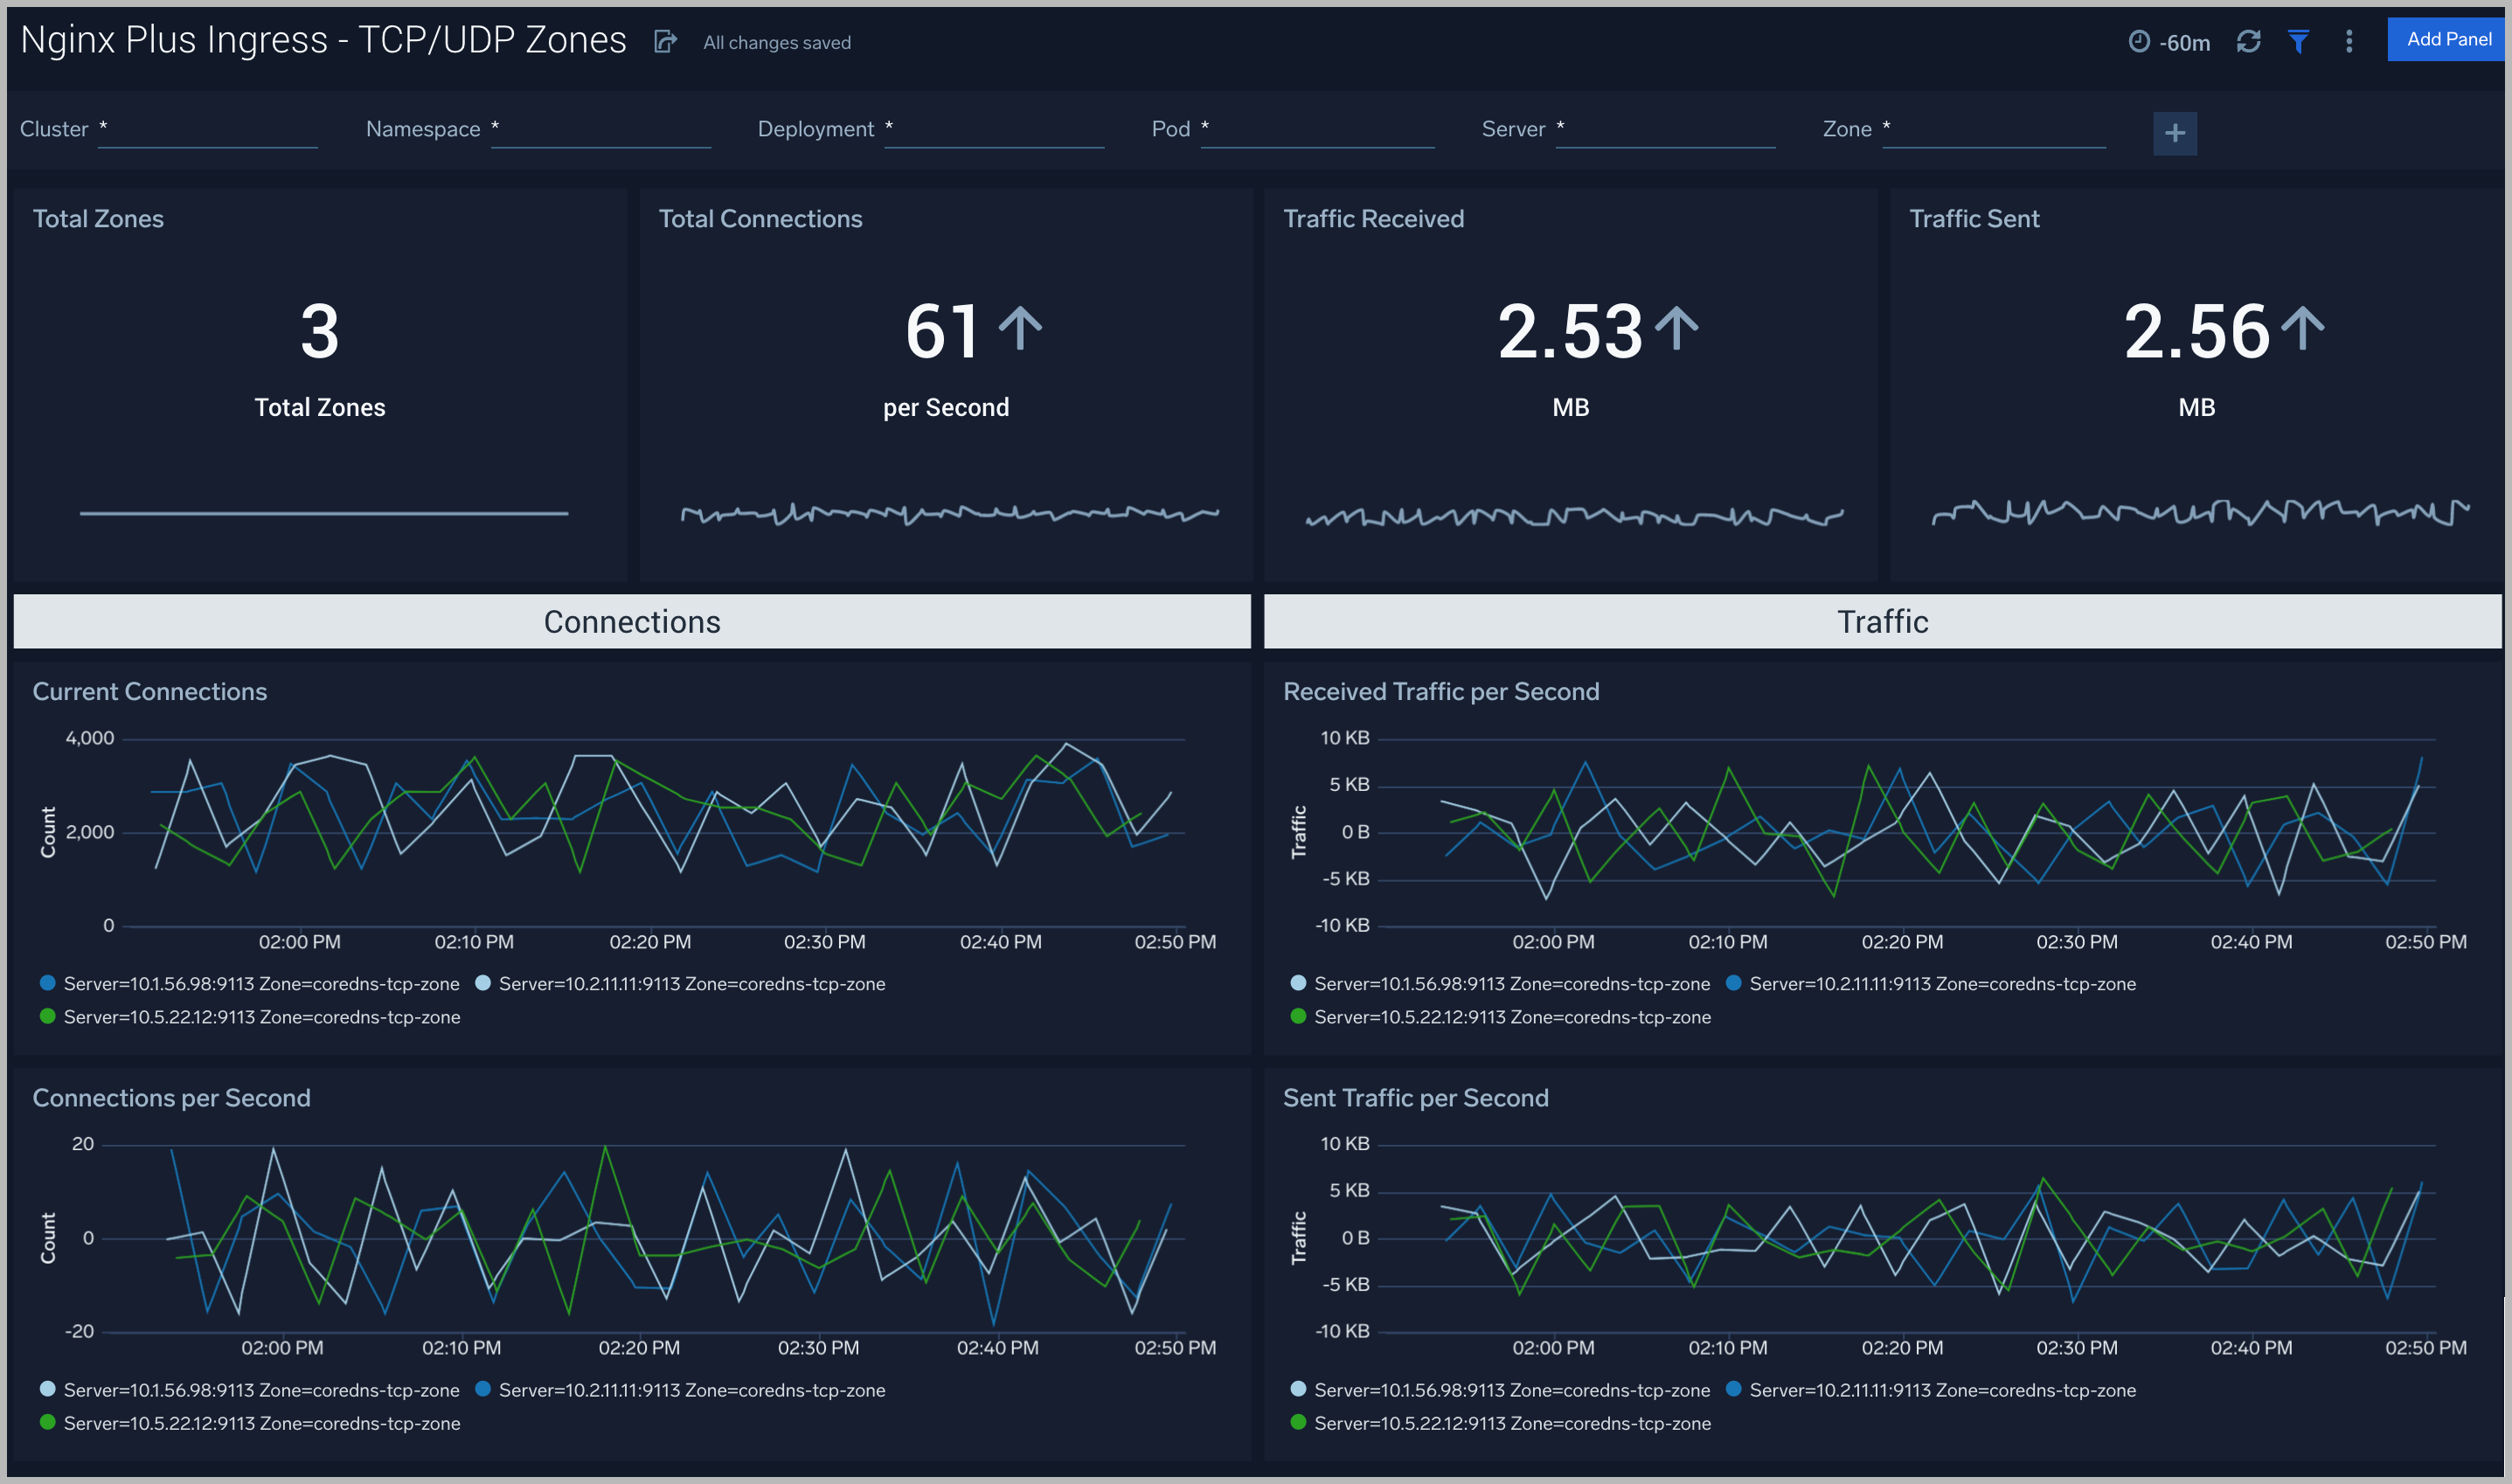
TCP/UDP Zones
The Nginx Plus Ingress - TCP/UDP Zones metrics dashboard provides TCP and UDP status zones with charts for connection limiting.
Use this dashboard to:
- Gain information about TCP and UDP traffic: received and sent; speed, requires/responses amount, discarded traffic.
- Gain information about TCP and UDP error responses: percentage of responses by the server, percentage of each type of error response.
Create monitors for Nginx Plus Ingress app
From your App Catalog:
- From the Sumo Logic navigation, select App Catalog.
- In the Search Apps field, search for and then select your app.
- Make sure the app is installed.
- Navigate to What's Included tab and scroll down to the Monitors section.
- Click Create next to the pre-configured monitors. In the create monitors window, adjust the trigger conditions and notifications settings based on your requirements.
- Scroll down to Monitor Details.
- Under Location click on New Folder.
note
By default, monitor will be saved in the root folder. So to make the maintenance easier, create a new folder in the location of your choice.
- Enter Folder Name. Folder Description is optional.
tip
Using app version in the folder name will be helpful to determine the versioning for future updates.
- Click Create. Once the folder is created, click on Save.
Nginx Plus Ingress alerts
Here are the alerts available for Nginx Plus Ingress (click to expand).
| Alert Name | Alert Description | Alert Condition | Recover Condition |
|---|---|---|---|
| Nginx Plus Ingress - Dropped Connections | This alert fires when we detect dropped connections for a given Nginx Plus server. | > 0 | <=0 |
| Nginx Plus Ingress - Critical Error Messages | This alert fires when we detect critical error messages for a given Nginx Plus server. | > 0 | <=0 |
| Nginx Plus Ingress - Access from Highly Malicious Sources | This alert fires when a Nginx is accessed from highly malicious IP addresses. | > 0 | <=0 |
| Nginx Plus Ingress - High Client (HTTP 4xx) Error Rate | This alert fires when there are too many HTTP requests (>5%) with a response status of 4xx. | > 0 | <=0 |
| Nginx Plus Ingress - High Server (HTTP 5xx) Error Rate | This alert fires when there are too many HTTP requests (>5%) with a response status of 5xx. | > 0 | <=0 |