Nginx Plus

The Sumo Logic app for Nginx Plus supports logs as well as Metrics for Nginx Plus, which is a web server that can be used as a reverse proxy, load balancer, mail proxy, and HTTP cache.
The Nginx Plus app is a unified logs and metrics app that helps you monitor the availability, performance, health, and resource utilization of your Nginx Plus web servers. Preconfigured dashboards and searches provide insight into server status, location zones, server zones, upstreams, resolvers, visitor locations, visitor access types, traffic patterns, errors, web server operations, and access from known malicious sources.
Log and metrics types
The Sumo Logic app for Nginx Plus assumes the NCSA extended/combined log file format for Access logs and the default Nginx error log file format for error logs.
All Dashboards (except the Error Logs Analysis dashboard) assume the Access log format. The Error Logs Analysis Dashboard assumes both access and error log formats, to correlate information between the two. For more details on Nginx/Nginx Plus logs, see Module ngx_http_log_module.
The Sumo Logic app for Nginx Plus assumes Prometheus format Metrics for Requests and Connections. For Nginx Plus Server metrics, the API Module from Nginx Configuration is used. For more details on Nginx Plus Metrics, see Module ngx_http_api_module.
Sample log messages
- Kubernetes environments
- Non-Kubernetes environments
{
	"timestamp":1620821977736,
	"log":"10.244.0.132 - - [12/May/2021:12:19:28 +0000] \"GET //demo-index.html HTTP/1.1\" 200 8777 \"-\" \"curl/7.68.0\"",
	"stream":"stdout",
	"time":"2021-05-12T12:19:28.975861476Z"
}
{
	"timestamp":1620821977737,
	"log":"2021/05/12 12:19:36 [error] 7#7: *8192 upstream timed out (110: Connection timed out) while connecting to upstream, health check \"\" of peer 44.240.53.50:12345 in upstream \"stream_backend2\"",
	"stream":"stderr",
	"time":"2021-05-12T12:19:36.344706832Z"
}
50.1.1.1 - example [23/Sep/2016:19:00:00 +0000] "POST /api/is_individual HTTP/1.1" 200 58 "-"
"python-requests/2.7.0 CPython/2.7.6 Linux/3.13.0-36-generic"
2016/09/23 19:00:00 [error] 1600#1600: *61413 open() "/srv/core/client/dist/client/favicon.ico"
failed (2: No such file or directory), client: 101.1.1.1, server: _, request: "GET /favicon.ico
HTTP/1.1", host: "example.com", referrer: "https://abc.example.com/"
Sample queries
This sample query is from the Nginx Plus - Overview dashboard > Responses Over Time panel.
_sourceCategory=Labs/Nginx/Logs
| json auto maxdepth 1 nodrop
| if (isEmpty(log), _raw, log) as nginx_log_message
| parse regex field=nginx_log_message "(?<Client_Ip>\d{1,3}\.\d{1,3}\.\d{1,3}\.\d{1,3})"
| parse regex field=nginx_log_message "(?<Method>[A-Z]+)\s(?<URL>\S+)\sHTTP/[\d\.]+\"\s(?<Status_Code>\d+)\s(?<Size>[\d-]+)\s\"(?<Referrer>.*?)\"\s\"(?<User_Agent>.+?)\".*"
| where _sourceHost matches "{{Server}}" and Client_Ip matches "{{Client_Ip}}" and Method matches "{{Method}}" and URL matches "{{URL}}" and Status_Code matches "{{Status_Code}}"
| if(Status_Code matches "2*", 1, 0) as Successes
| if(Status_Code matches "3*", 1, 0) as Redirects
| if(status_code matches "4*", 1, 0) as Client_Errors
| if(Status_Code matches "5*", 1, 0) as Server_Errors
| timeslice by 5m
| sum(Successes) as Successes, sum(Client_Errors) as Client_Errors,  sum(Redirects) as Redirects, sum(Server_Errors) as Server_Errors by _timeslice
| sort by _timeslice asc
Collecting logs and metrics for Nginx Plus
This section provides instructions for configuring log and metric collection for the Sumo Logic app for Nginx Plus. Sumo Logic supports a collection of logs and metrics data from Nginx Plus in both Kubernetes and non-Kubernetes environments. Click on the appropriate links below based on the environment where your Nginx Plus servers are hosted.
- Kubernetes environments
- Non-Kubernetes environments
For Kubernetes environments
In Kubernetes environments, we use the Telegraf Operator, which is packaged with our Kubernetes collection. You can learn more about it here. The diagram below illustrates how data is collected from Nginx Plus in Kubernetes environments. In the architecture shown below, there are four services that make up the metric collection pipeline: Telegraf, Telegraf Operator, Prometheus, and Sumo Logic Distribution for OpenTelemetry Collector.
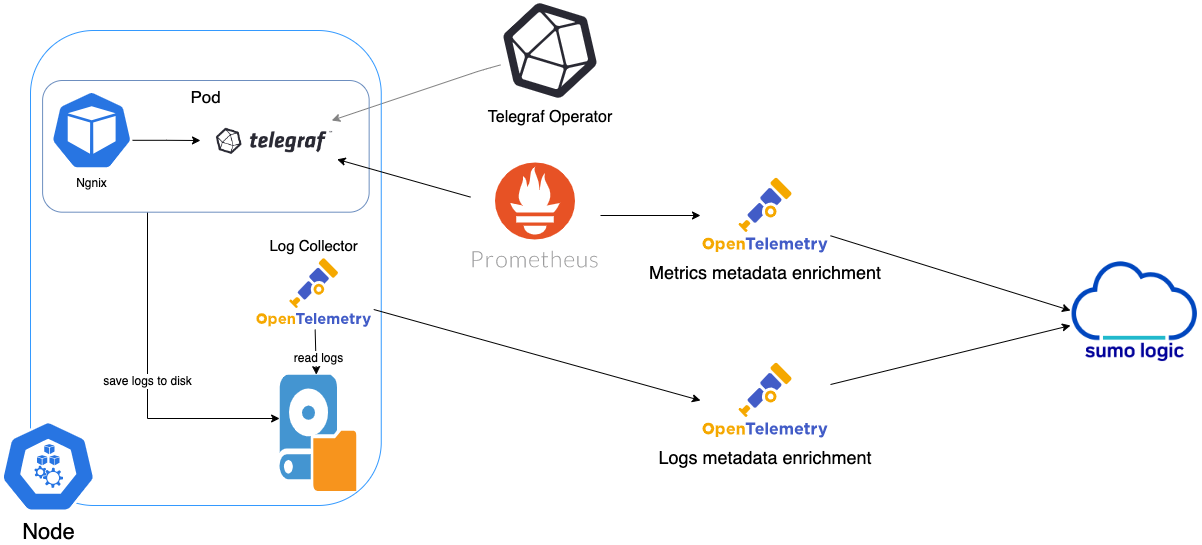
The first service in the pipeline is Telegraf. Telegraf collects metrics from Nginx Plus. Note that we’re running Telegraf in each pod we want to collect metrics from as a sidecar deployment: i.e. Telegraf runs in the same pod as the containers it monitors. Telegraf uses the Nginx Plus input plugin to obtain metrics. For simplicity, the diagram doesn’t show the input plugins. The injection of the Telegraf sidecar container is done by the Telegraf Operator. Prometheus pulls metrics from Telegraf and sends them to Sumo Logic Distribution for OpenTelemetry Collector, which enriches metadata and sends metrics to Sumo Logic.
In the logs pipeline, Sumo Logic Distribution for OpenTelemetry Collector collects logs written to standard out and forwards them to another instance of Sumo Logic Distribution for OpenTelemetry Collector, which enriches metadata and sends logs to Sumo Logic.
Collect logs for Nginx Plus in Kubernetes environment
The Nginx Plus app supports the default access logs and error logs format.
- Before you can configure Sumo Logic to ingest logs, you must configure the logging of errors and processed requests in both Nginx Open Source and Nginx Plus. For instructions, refer to the Configuring Logging documentation.
- Use the Sumologic-Kubernetes-Collection, to send the logs to Sumologic. For more information, visit.
- Identifying the log's metadata: For example, to get Logs data from the pod, you can use the following source
_sourceCategory = "kubernetes/default/nginx"wherekubernetesis Cluster name,defaultis Namespace,nginxis application. - To get log data from Nginx Pods - all nginx logs must be redirected to standard output “stdout” and standard error “stderr”.
Collect metrics for Nginx Plus in Kubernetes environment
The Nginx Plus app supports the metrics for Nginx Plus.
The following steps assume you are collecting Nginx Plus metrics from a Kubernetes environment. In Kubernetes environments, we use the Telegraf Operator, which is packaged with our Kubernetes collection. You can learn more about this here.
- Before you can configure Sumo Logic to ingest metrics, you must enable the API module to expose metrics in NGINX Plus.
- For instructions on Nginx Plus, refer to the following documentation https://docs.nginx.com/nginx/admin-guide/monitoring/live-activity-monitoring/.
- Make a note of the URL where the API is exposed. It will match the format like https://localhost:8080/api.
- Set up Kubernetes Collection with the Telegraf Operator.
- On your Nginx Plus Pods, add the following annotations to configure Telegraf.
annotations:
     telegraf.influxdata.com/inputs: |+
     [[inputs.nginx_plus_api]]
        urls = ["http://localhost:8080/api"]
        response_timeout = "5s"
        api_version = 6
     telegraf.influxdata.com/class: sumologic-prometheus
     prometheus.io/scrape: "true"
     prometheus.io/port: "9273"
telegraf.influxdata.com/inputs. This contains the required configuration for the Telegraf Nginx Plus Input plugin. Please refer to this doc for more information on configuring the Nginx input plugin for Telegraf. Note since telegraf will be run as a sidecar the host should always be localhosttelegraf.influxdata.com/class: sumologic-prometheus. This instructs the Telegraf operator what output to use. This should not be changed.prometheus.io/scrape: "true". This ensures our Prometheus will scrape the metrics.prometheus.io/port: "9273". This tells Prometheus what ports to scrape on. This should not be changed.
For Non-Kubernetes environments
We use the Telegraf operator for Nginx Plus metric collection and the Sumo Logic Installed Collector for collecting Nginx Plus logs. The diagram below illustrates the components of the Nginx Plus collection in a non-Kubernetes environment.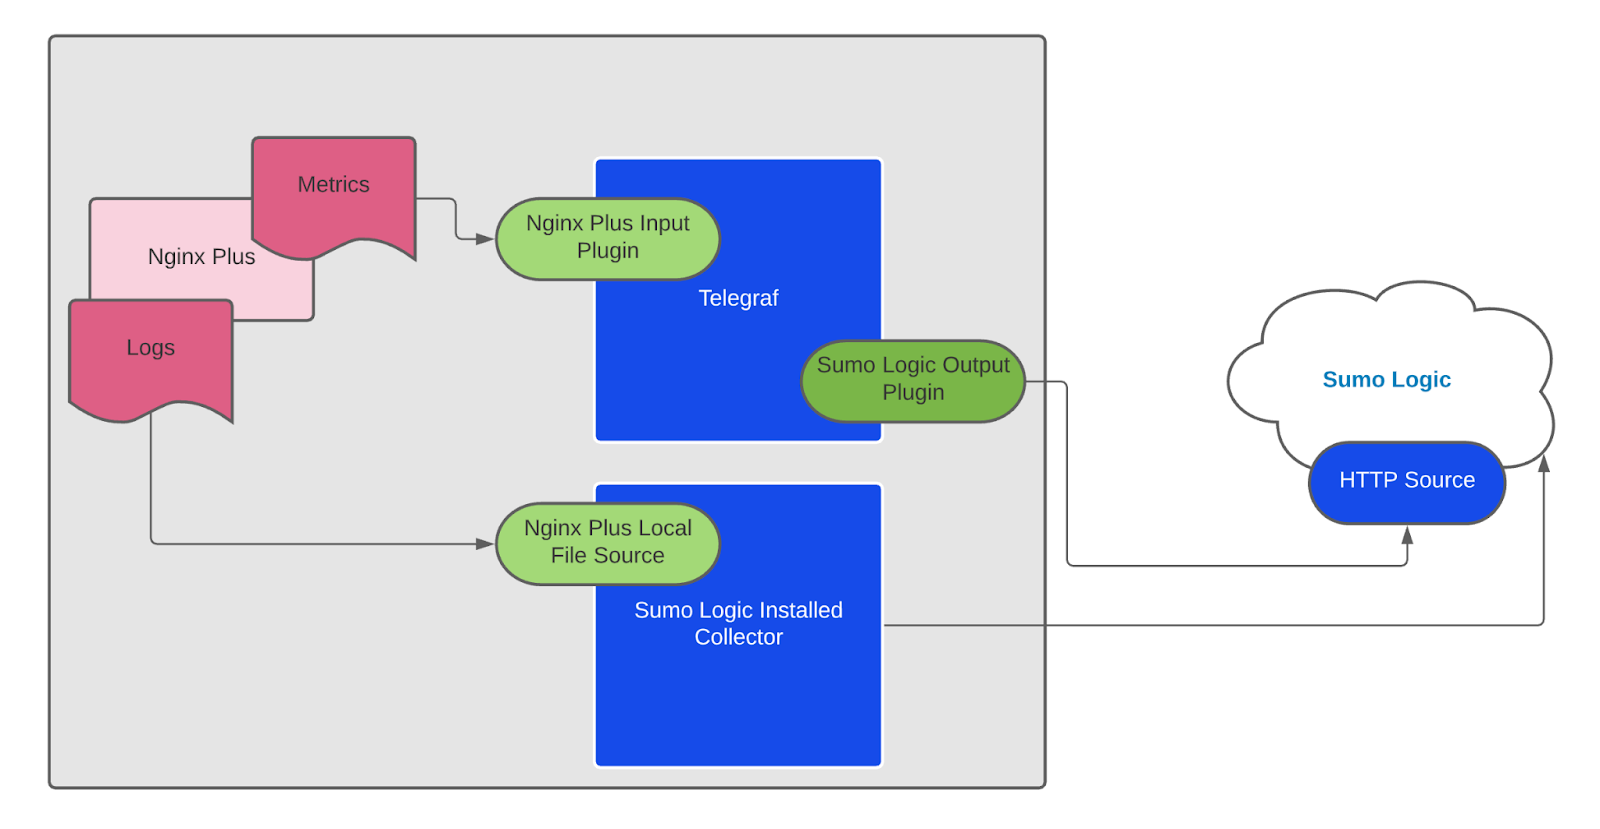
Telegraf runs on the same system as Nginx Plus and uses the Nginx Plus input plugin to obtain Nginx Plus metrics, and the Sumo Logic output plugin to send the metrics to Sumo Logic. Logs from Nginx on the other hand are sent to either a Sumo Logic Local File source.
Collect logs for Nginx Plus in Non-Kubernetes environment
The Nginx Plus app supports the default access logs and error logs format.
This section provides instructions for configuring log collection for the Sumo Logic app for Nginx Plus. Follow the instructions below to set up the Log collection.
- Configure logging in Nginx. Before you can configure Sumo Logic to ingest logs, you must configure the logging of errors and processed requests in NGINX Open Source and NGINX Plus. For instructions, refer to the following documentation: https://www.nginx.com/resources/admin-guide/logging-and-monitoring/
- Configure a Collector. Use one of the following Sumo Logic Collector options:
- To collect logs directly from the Nginx Plus machine, configure an Installed Collector.
- If you're using a service like Fluentd, or you would like to upload your logs manually, Create a Hosted Collector.
- Configure a Source. Choose a method:
For an Installed Collector
To collect logs directly from your Nginx Plus machine, use an Installed Collector and a Local File Source.
- Add a Local File Source.
- Configure the Local File Source fields as follows:
- Name. (Required)
- Description. (Optional)
- File Path (Required). Enter the path to your error.log or access.log. The files are typically located in
/var/log/nginx/*.log. If you're using a customized path, check the nginx.conf file for this information. If you're using Passenger, you may have instructed Passenger to log to a specific log using the passenger_log_file option. - Source Host. Sumo Logic uses the hostname assigned by the OS unless you enter a different hostname.
- Source Category. Enter any string to tag the output collected from this Source, such as Nginx/Access or Nginx/Error. (The Source Category metadata field is a fundamental building block to organize and label Sources. For details, see Best Practices.)
- Configure the Advanced section:
- Enable Timestamp Parsing. Select Extract timestamp information from log file entries.
- Time Zone. Automatically detect.
- Timestamp Format. The timestamp format is automatically detected.
- Encoding. Select UTF-8 (Default).
- Enable Multiline Processing.
- Error logs. Select Detect messages spanning multiple lines and Infer Boundaries - Detect message boundaries automatically.
- Access logs. These are single-line logs, uncheck Detect messages spanning multiple lines.
- Click Save.
For a Hosted Collector
If you're using a service like Fluentd, or you would like to upload your logs manually, use a Hosted Collector and an HTTP Source.
- Add an HTTP Source.
- Configure the HTTP Source fields as follows:
- Name. (Required)
- Description. (Optional)
- Source Host. Sumo Logic uses the hostname assigned by the OS unless you enter a different hostname.
- Source Category. Enter any string to tag the output collected from this Source, such as Nginx/Access or Nginx/Error. (The Source Category metadata field is a fundamental building block to organize and label Sources. For details, see Best Practices.)
- Configure the Advanced section:
- Enable Timestamp Parsing. Select Extract timestamp information from log file entries.
- Time Zone. For Access logs, use the time zone from the log file. For Error logs, make sure to select the correct time zone.
- Timestamp Format. The timestamp format is automatically detected.
- Enable Multiline Processing.
- Error logs: Select Detect messages spanning multiple lines and Infer Boundaries - Detect message boundaries automatically.
- Access logs: These are single-line logs, uncheck Detect messages spanning multiple lines.
- Click Save.
- When the URL associated with the HTTP Source is displayed, copy the URL so you can add it to the service you are using, such as Fluentd.
Collect metrics for Nginx Plus in Non-Kubernetes environment
The Nginx Plus app supports the metrics for Nginx Plus.
This section provides instructions for configuring metrics collection for the Sumo Logic app for Nginx Plus. Follow the below instructions to set up the metric collection.
- Configure Metrics in Nginx Plus. Before you can configure Sumo Logic to ingest metrics, you must enable the API module to expose metrics in NGINX Plus.
- The live activity monitoring data is generated by the NGINX Plus API. Visit live activity monitoring to configure the API module.
- Make a note of the URL where the API is exposed. It will match the format like http://localhost/api.
- Configure a Hosted Collector. To create a new Sumo Logic hosted collector, perform the steps in theCreate a Hosted Collector section of the Sumo Logic documentation.
- Configure a Metrics Source. Create a new HTTP Logs and Metrics Source in the hosted collector created above by following these instructions. Make a note of the HTTP Source URL.
- Install Telegraf. Use the following steps to install Telegraf.
- Configure and start Telegraf. Create a file called telegraf.conf and add the appropriate configuration. The following is a basic example:
[agent]
  interval = "60s"
-- Read Nginx Plus full API information (ngx_http_api_module)
[[inputs.nginx_plus_api]]
-- An array of Nginx Plus API URLs to gather stats.
 urls = ["http://localhost/api"]
-- HTTP response timeout (default: 5s)
 response_timeout = "5s"
-- Nginx Plus API version, default: 3
 api_version = 6
[[outputs.sumologic]]
  url = "<URL Created in Step 3>"
  data_format = "prometheus"
interval- This is the frequency to send data to Sumo Logic, in this example, we will send the metrics every 60 seconds. Please refer to this doc for more parameters that can be configured in the Telegraf agent globally.urls- The URL to the Nginx Plus server with the API enabled. This can be a comma-separated list to connect to multiple Nginx Plus servers. Please refer to this doc for more information on configuring the Nginx API input plugin for Telegraf.url- This is the HTTP source URL created in step 3. Please refer to this doc for more information on configuring the Sumo Logic Telegraf output plugin.data_format- The format to use when sending data to Sumo Logic. Please refer to this doc for more information on configuring the Sumo Logic Telegraf output plugin.
- Once you have finalized your telegraf.conf file, you can run the following command to start Telegraf.
telegraf --config /path/to/telegraf.conf
Installing the Nginx Plus app
This section has instructions for installing the Sumo app for Nginx Plus. The instructions assume you have already set up the collection as described above.
To install the app, do the following:
Next-Gen App: To install or update the app, you must be an account administrator or a user with Manage Apps, Manage Monitors, Manage Fields, Manage Metric Rules, and Manage Collectors capabilities depending upon the different content types part of the app.
- Select App Catalog.
- In the 🔎 Search Apps field, run a search for your desired app, then select it.
- Click Install App.
note
Sometimes this button says Add Integration.
- Click Next in the Setup Data section.
- In the Configure section of your respective app, complete the following fields.
- Field Name. If you already have collectors and sources set up, select the configured metadata field name (eg _sourcecategory) or specify other custom metadata (eg: _collector) along with its metadata Field Value.
- Is K8S deployment involved. Specify if resources being monitored are partially or fully deployed on Kubernetes (K8s)
- Click Next. You will be redirected to the Preview & Done section.
Post-installation
Once your app is installed, it will appear in your Installed Apps folder, and dashboard panels will start to fill automatically.
Each panel slowly fills with data matching the time range query received since the panel was created. Results will not immediately be available but will be updated with full graphs and charts over time.
Viewing Nginx Plus dashboards
All dashboards have a set of filters that you can apply to the entire dashboard. Use these filters to drill down and examine the data to a granular level.
- You can change the time range for a dashboard or panel by selecting a predefined interval from a drop-down list, choosing a recently used time range, or specifying custom dates and times. Learn more.
- You can use template variables to drill down and examine the data on a granular level. For more information, see Filtering Dashboards with Template Variables.
- Most Next-Gen apps allow you to provide the scope at the installation time and are comprised of a key (
_sourceCategoryby default) and a default value for this key. Based on your input, the app dashboards will be parameterized with a dashboard variable, allowing you to change the dataset queried by all panels. This eliminates the need to create multiple copies of the same dashboard with different queries.
Overview
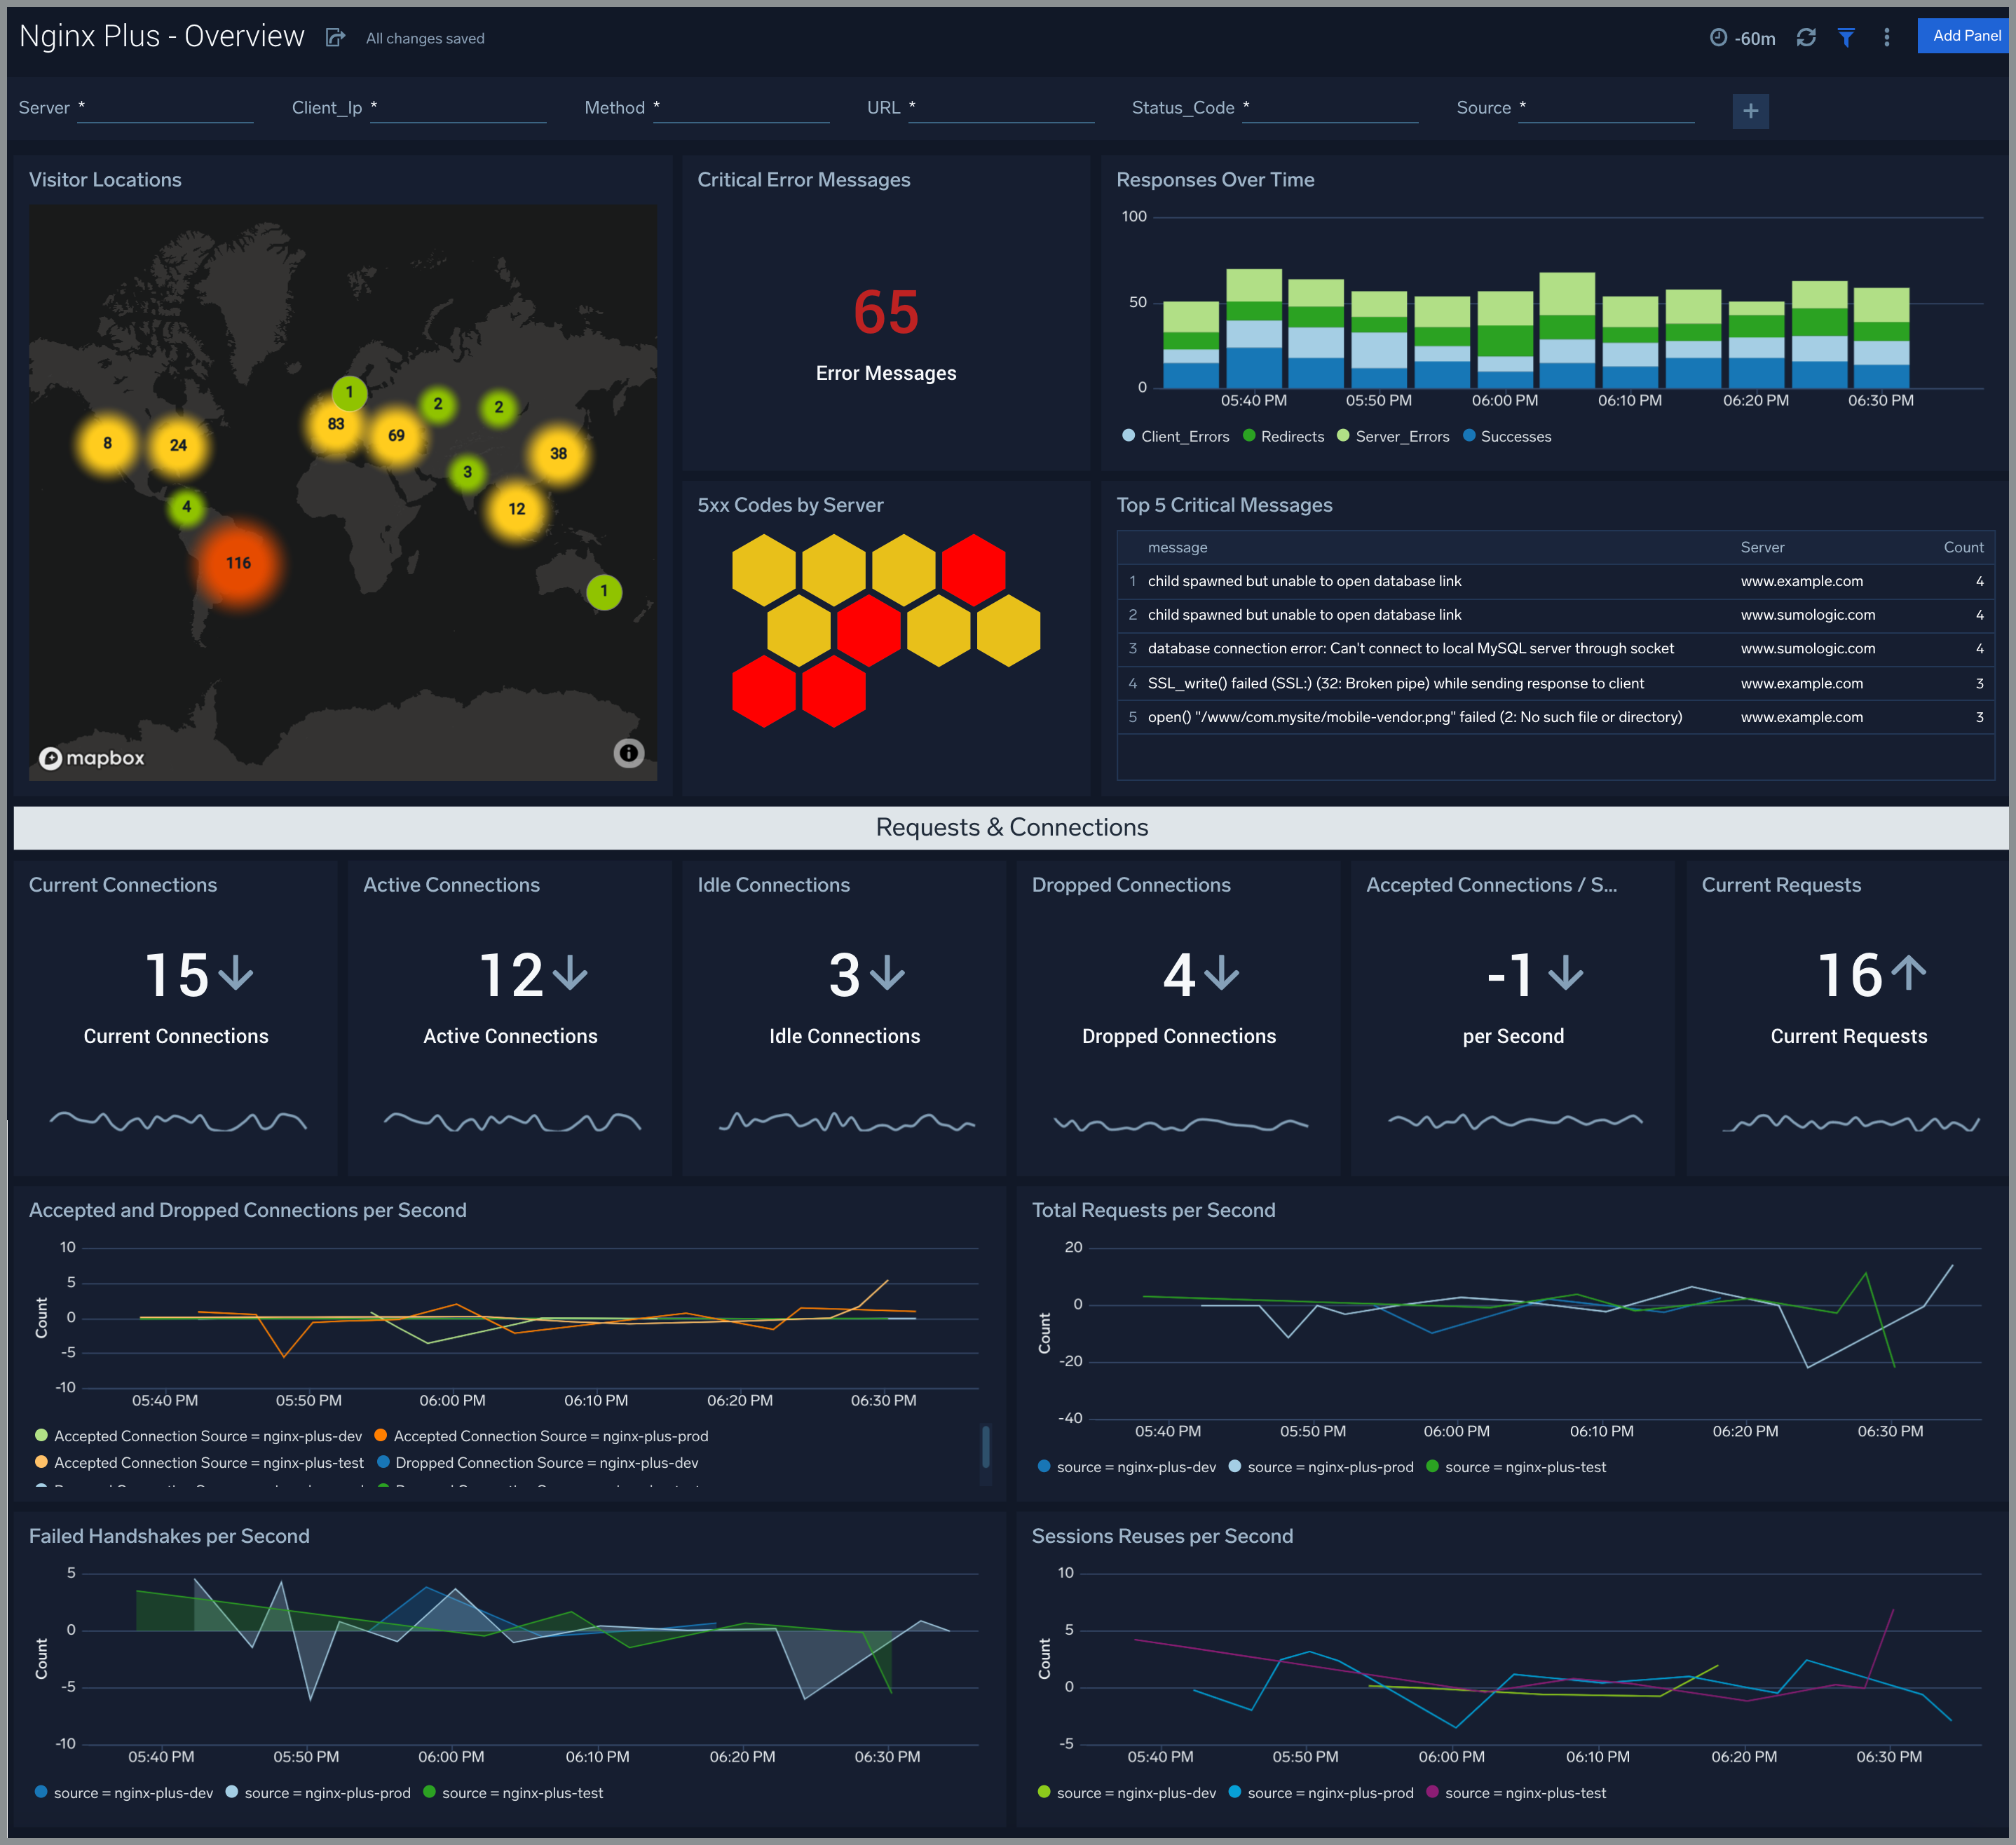
The Nginx Plus - Overview dashboard provides an at-a-glance view of the Nginx Plus server access locations, error logs, and connection metrics.
Use this dashboard to:
- Gain insights into originated traffic location by region. This can help you allocate computer resources to different regions according to their needs.
- Gain insights into your Nginx health using Critical Errors and Status of Nginx Server.
- Get insights into Active and dropped connections.
Error Logs Analysis
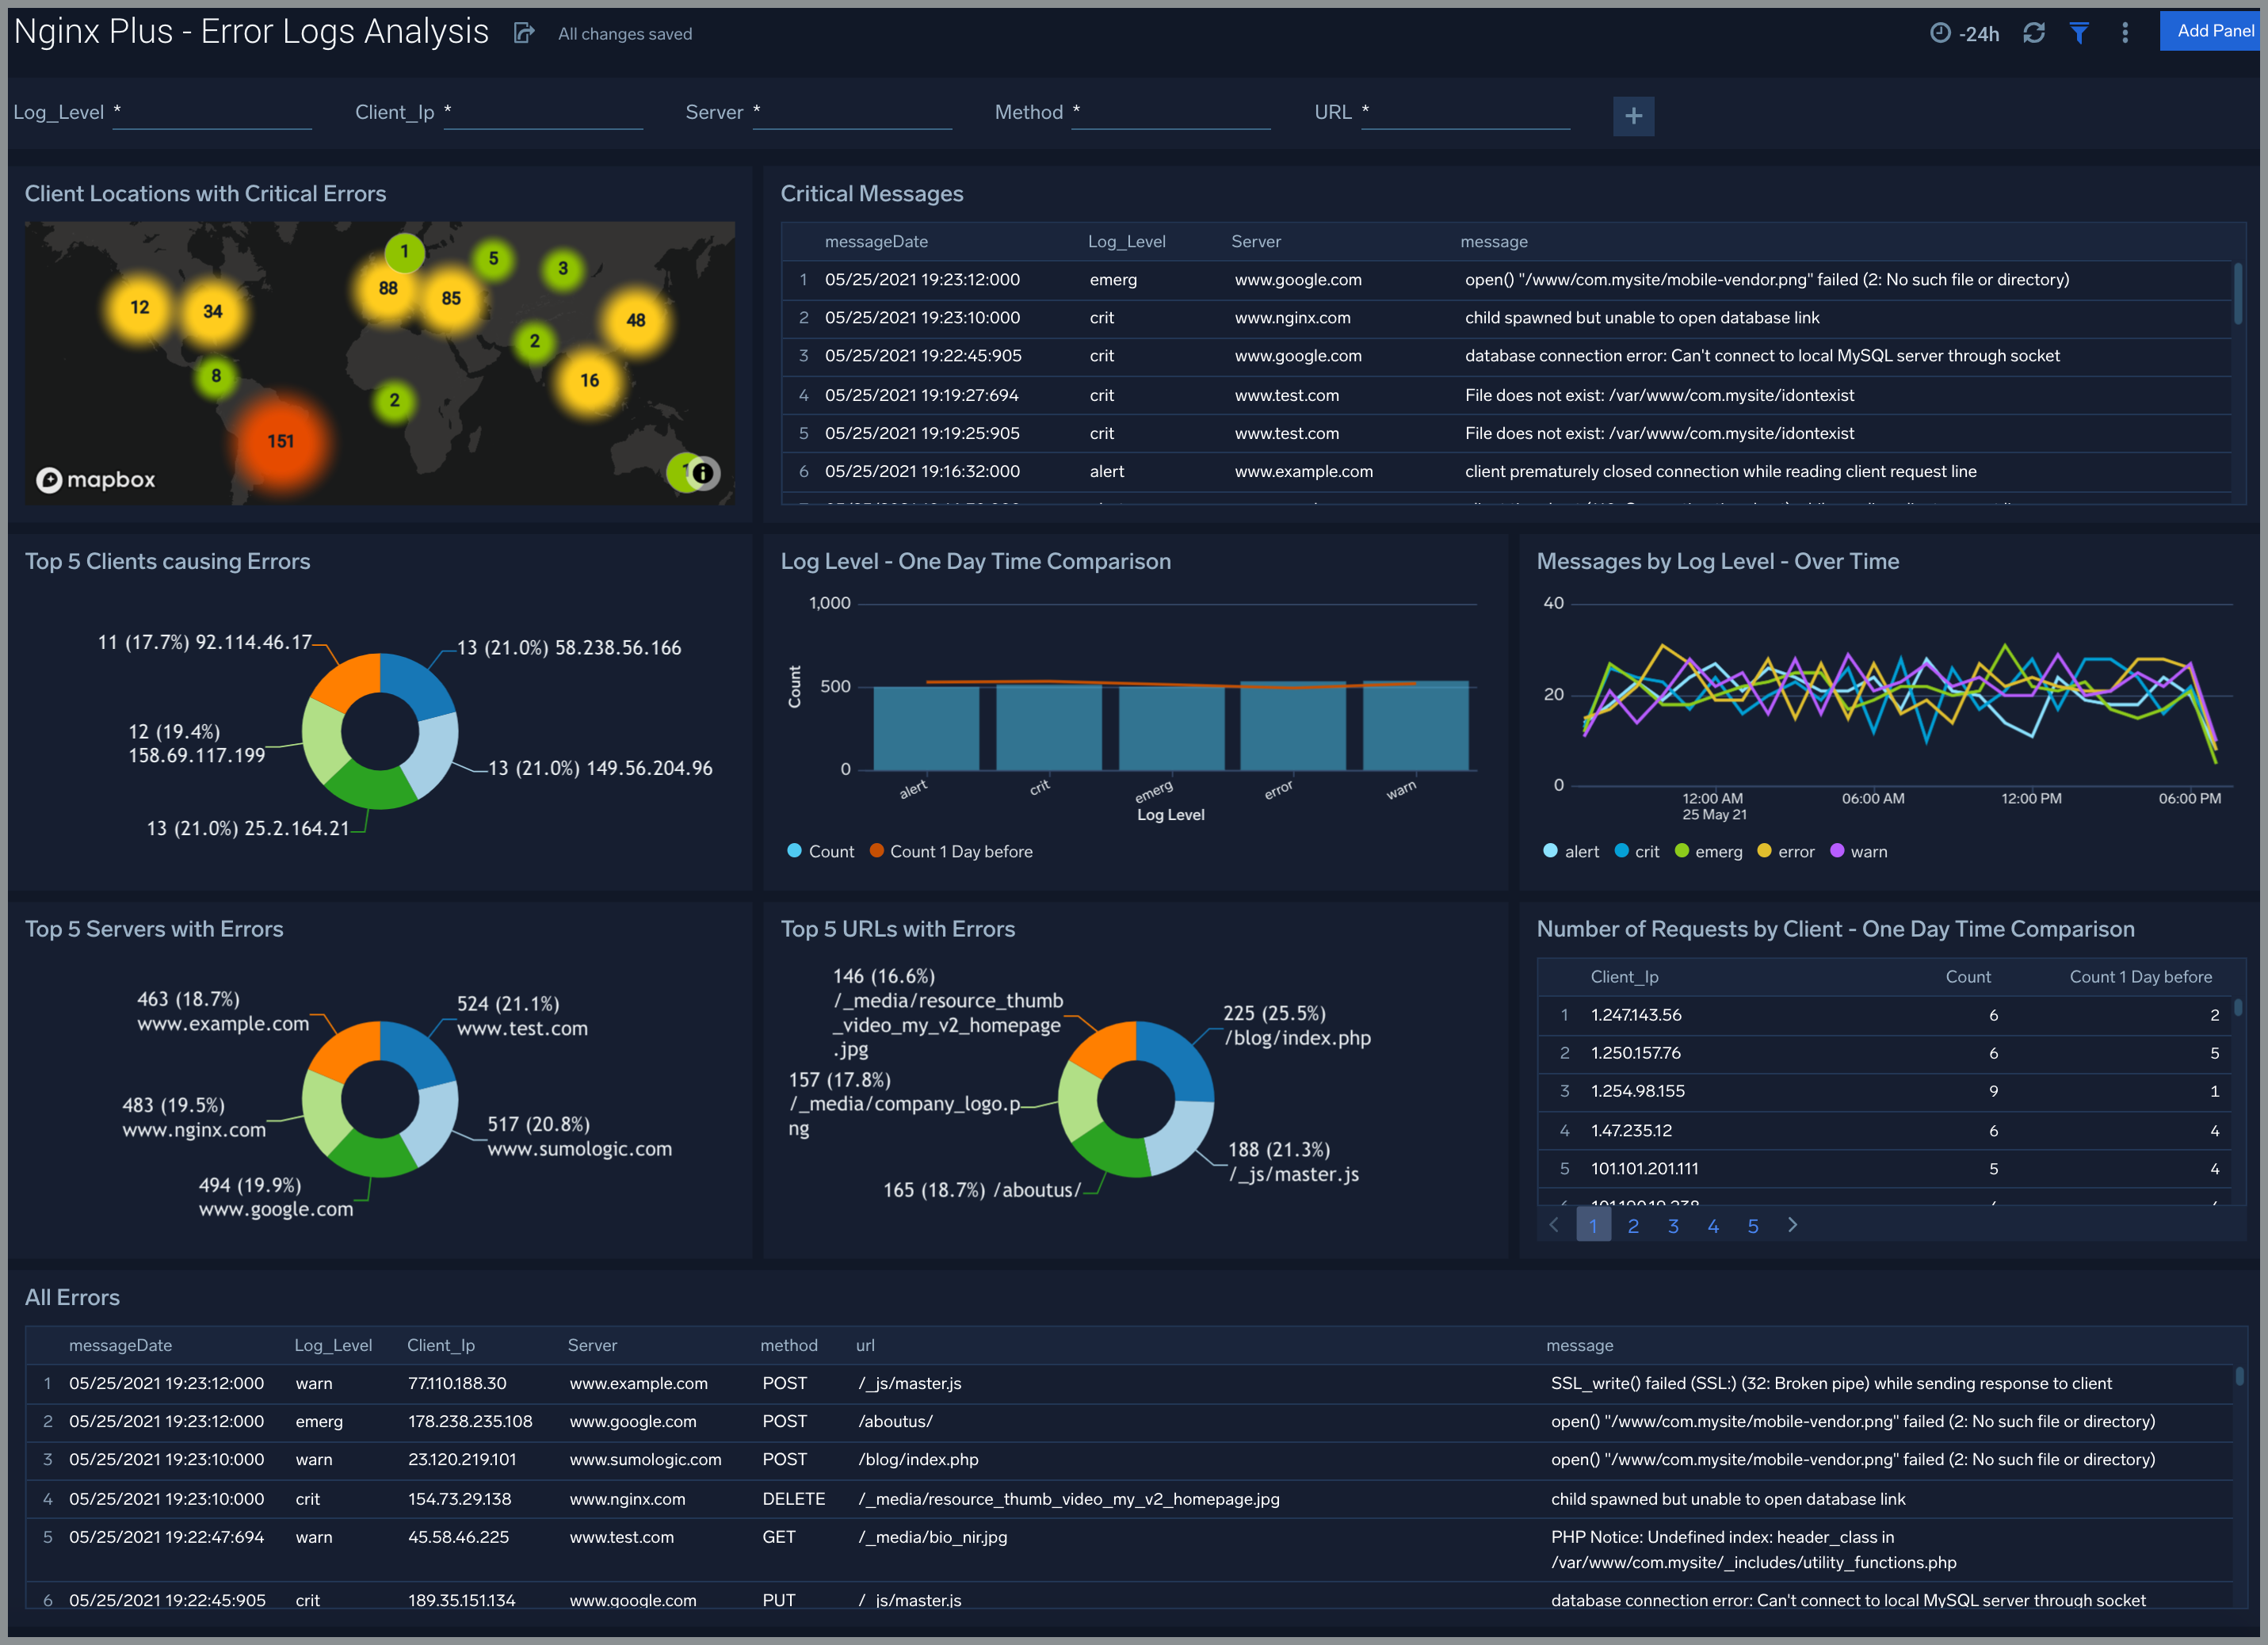
The Nginx Plus - Error Logs Analysis dashboard provides a high-level view of log level breakdowns, comparisons, and trends. The panels also show the geographic locations of clients and clients with critical messages, new connections, and outliers, client requests, request trends, and request outliers.
Use this dashboard to:
- Track requests from clients. A request is a message asking for a resource, such as a page or an image.
- Track and view client geographic locations generating errors.
- Track critical alerts and emergency error alerts.
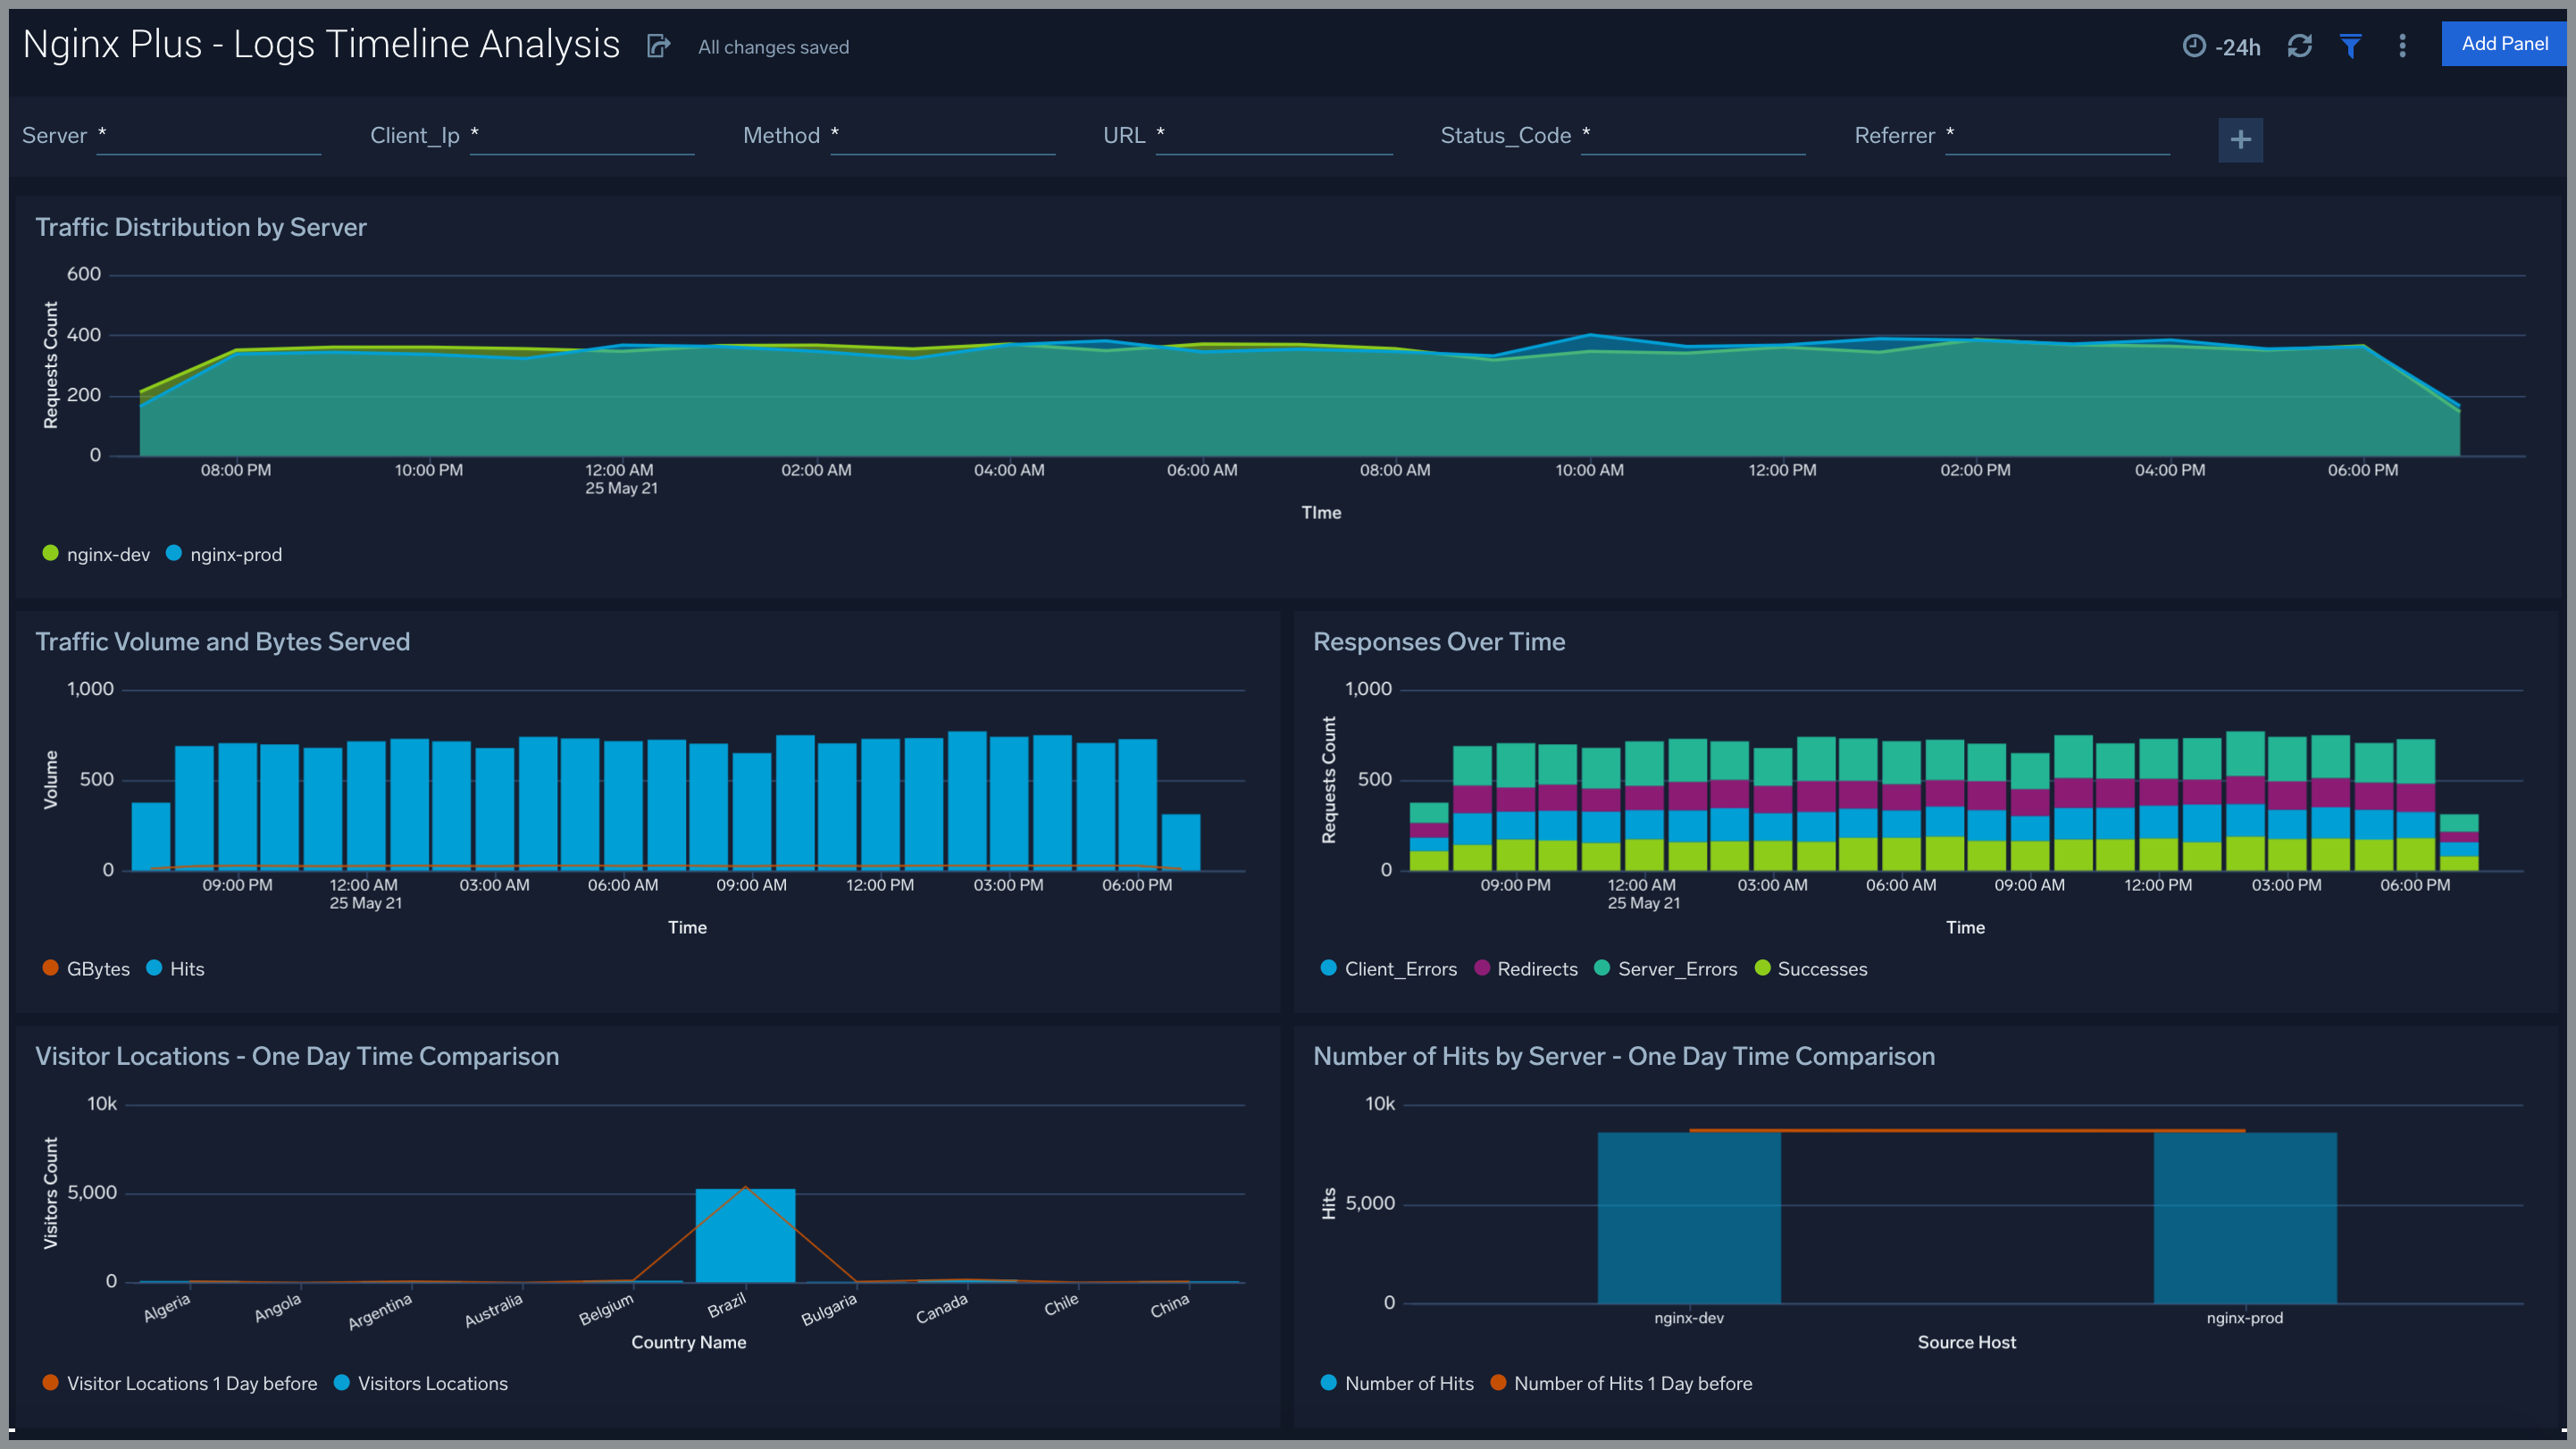
Logs Timeline Analysis
The Nginx Plus - Logs Timeline Analysis dashboard provides a high-level view of the activity and health of Nginx servers on your network. Dashboard panels display visual graphs and detailed information on traffic volume and distribution, responses over time, as well as time comparisons for visitor locations and server hits.
Use this dashboard to:
- Understand the traffic distribution across servers, and provide insights for resource planning by analyzing data volume and bytes served.
- Gain insights into originated traffic location by region. This can help you allocate compute resources to different regions according to their needs.
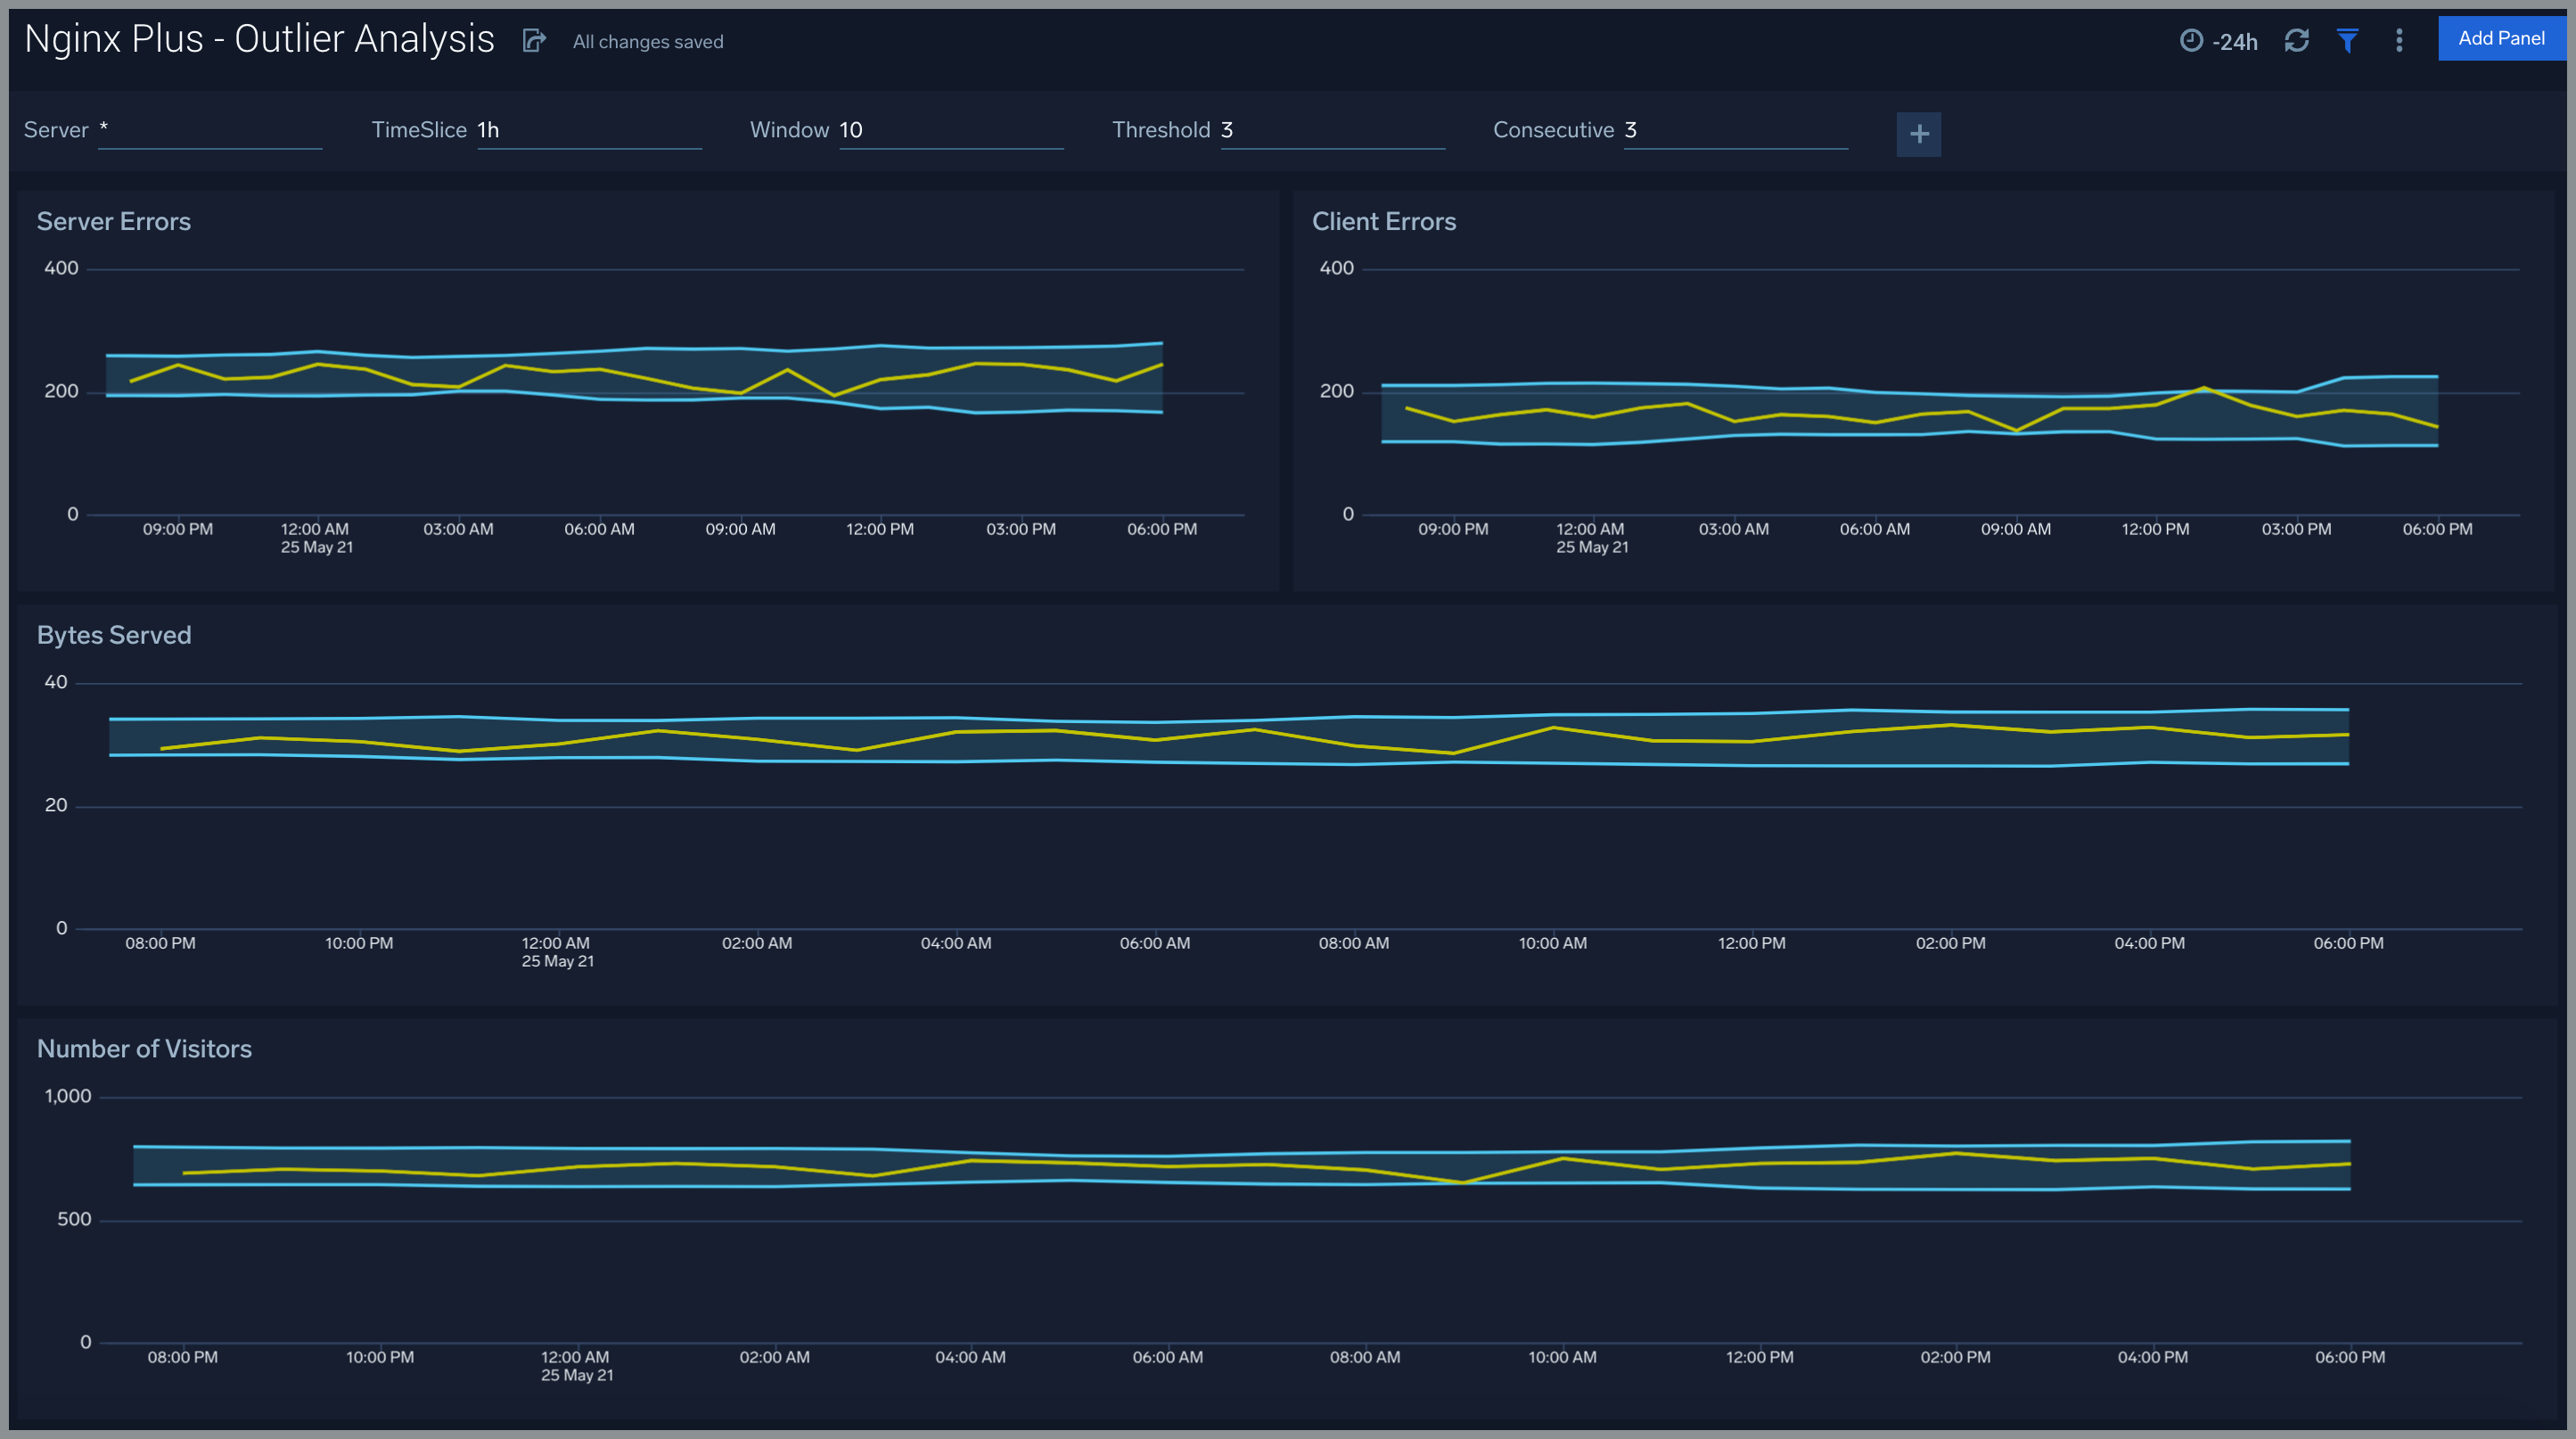
Outlier Analysis
The Nginx Plus - Outlier Analysis dashboard provides a high-level view of Nginx server outlier metrics for bytes served, number of visitors, and server errors. You can select the time interval over which outliers are aggregated, then hover the cursor over the graph to display detailed information for that point in time.
Use this dashboard to:
- Detects outliers in your infrastructure with Sumo Logic’s machine learning algorithm.
- To identify outliers in incoming traffic and the number of errors encountered by your servers.
You can use schedule searches to send alerts to yourself whenever there is an outlier detected by Sumo Logic.
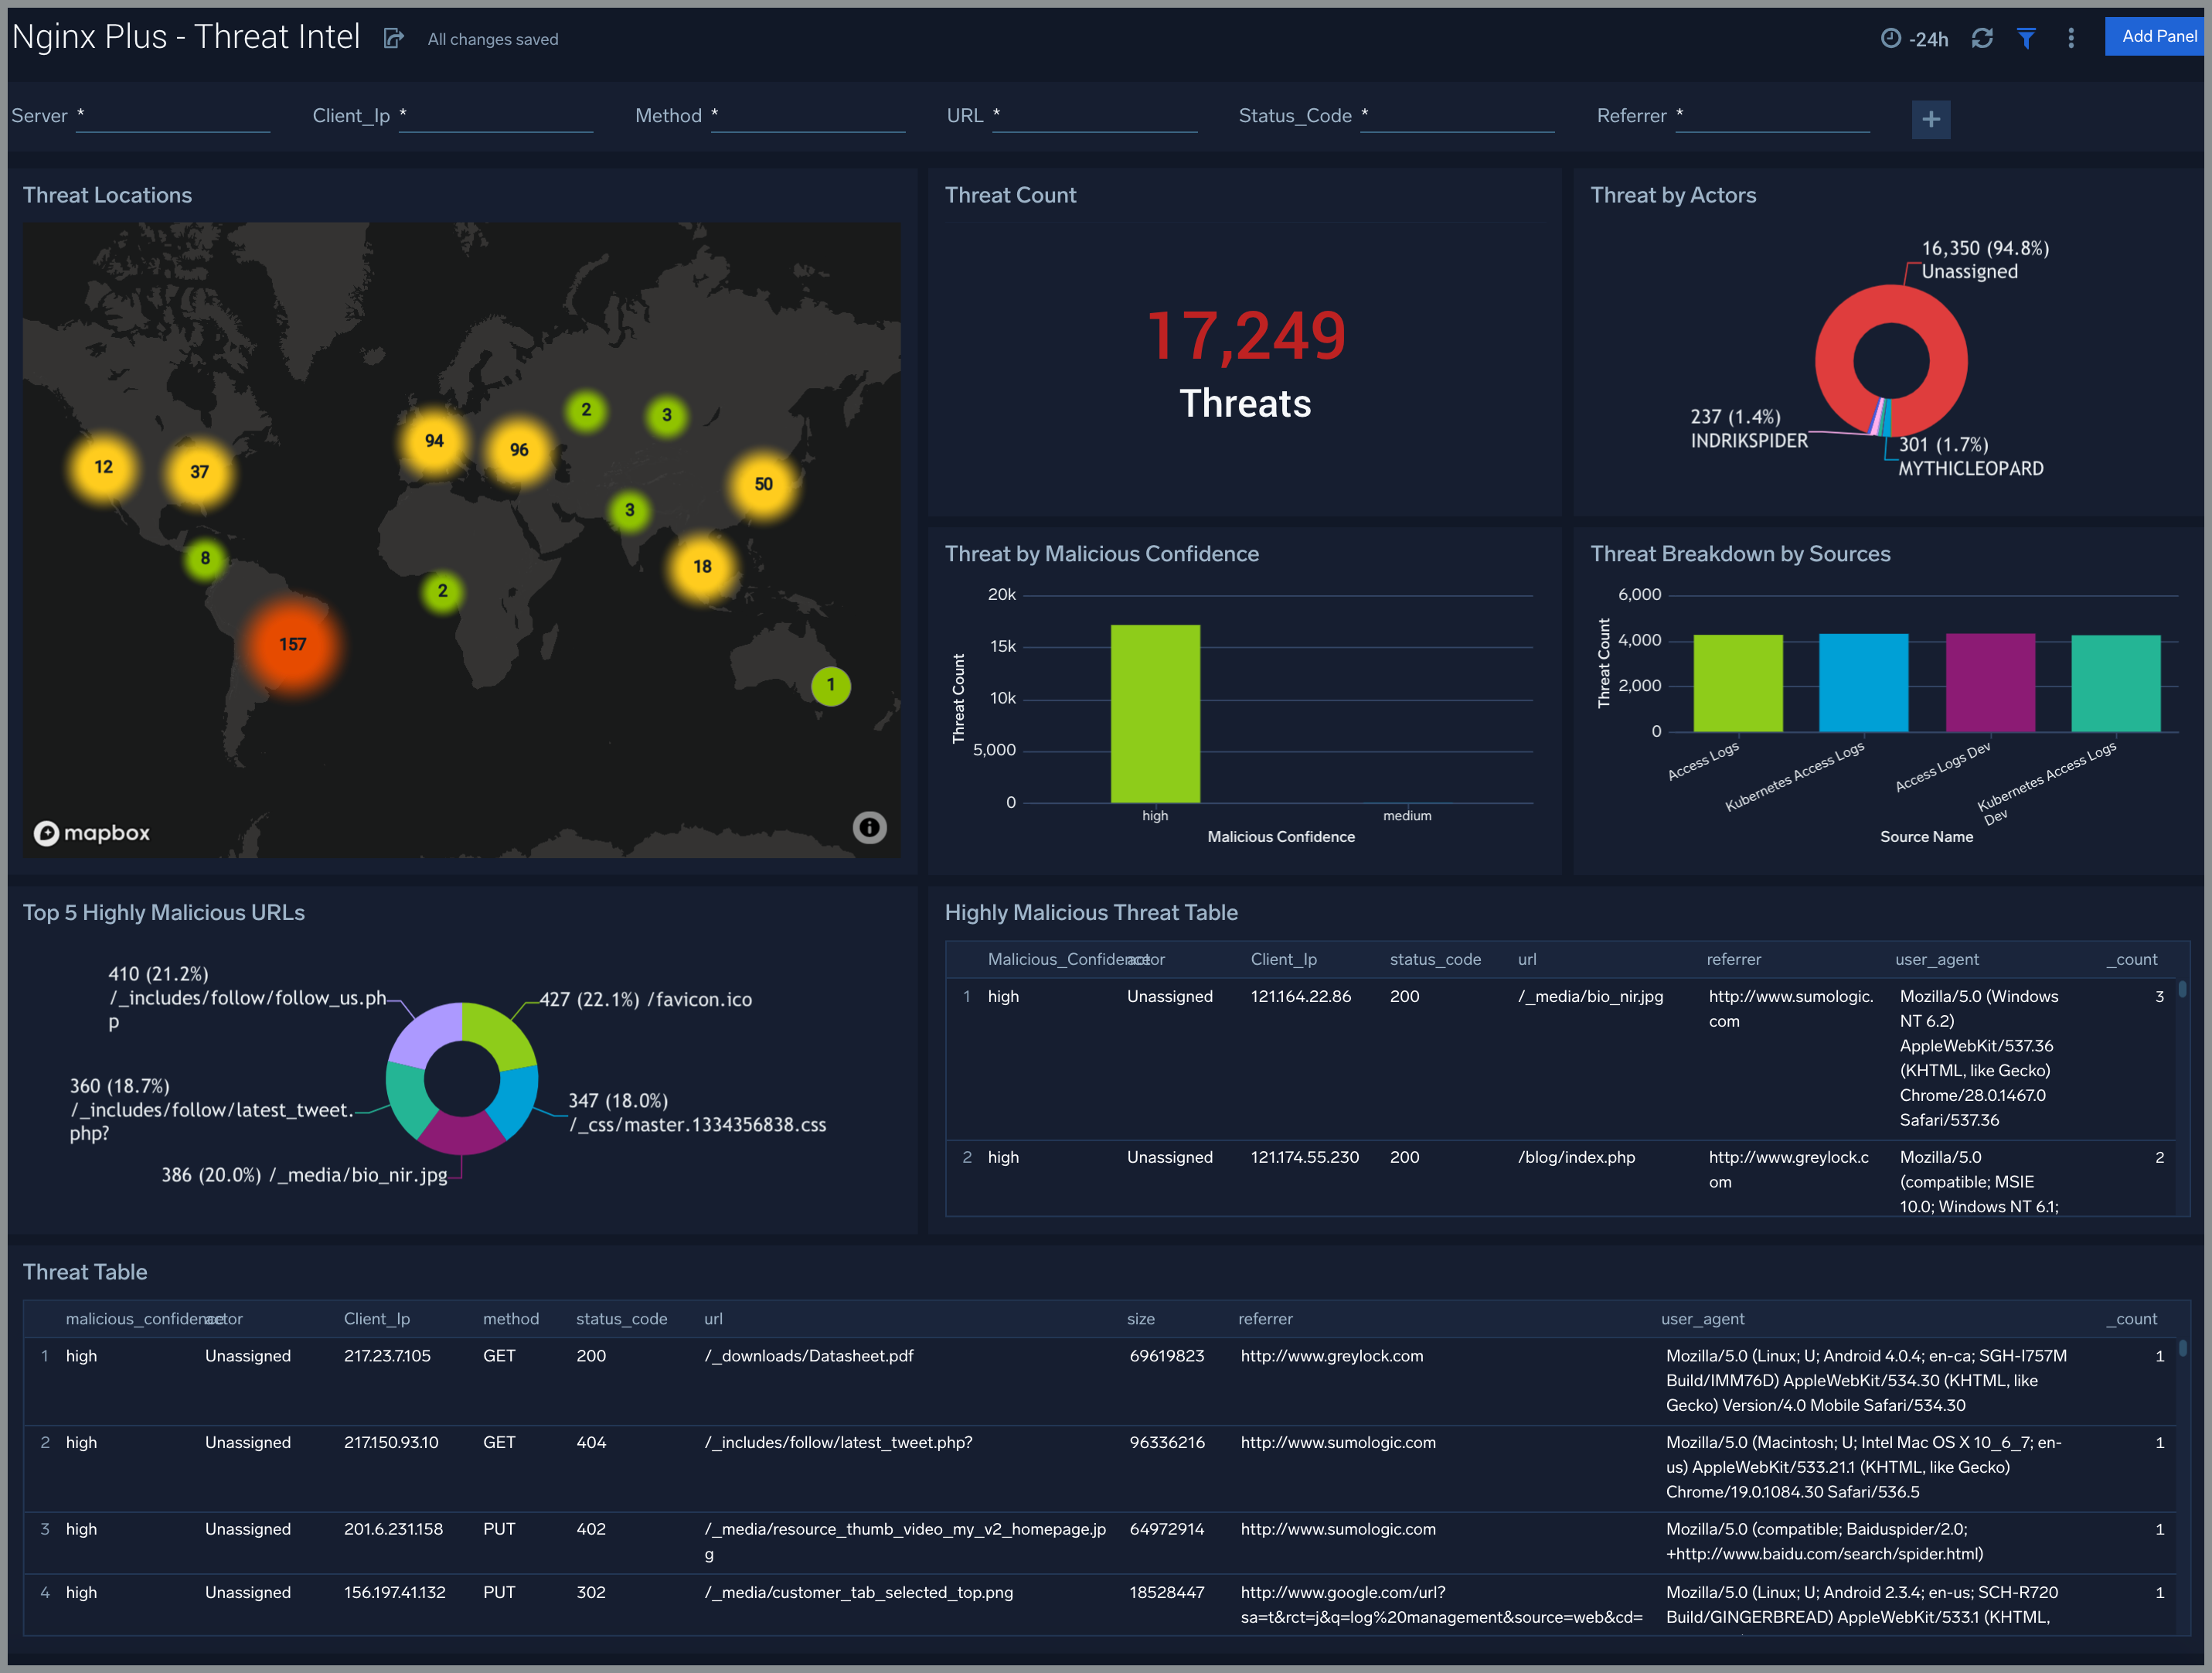
Threat Intel
The Nginx Plus - Threat Intel dashboard provides an at-a-glance view of threats to Nginx servers on your network. Dashboard panels display the threat count over a selected time period, geographic locations where threats occurred, source breakdown, actors responsible for threats, severity, and a correlation of IP addresses, method, and status code of threats.
Use this dashboard to:
- To gain insights and understand threats in incoming traffic and discover potential IOCs. Incoming traffic requests are analyzed using Sumo Logic threat intelligence.
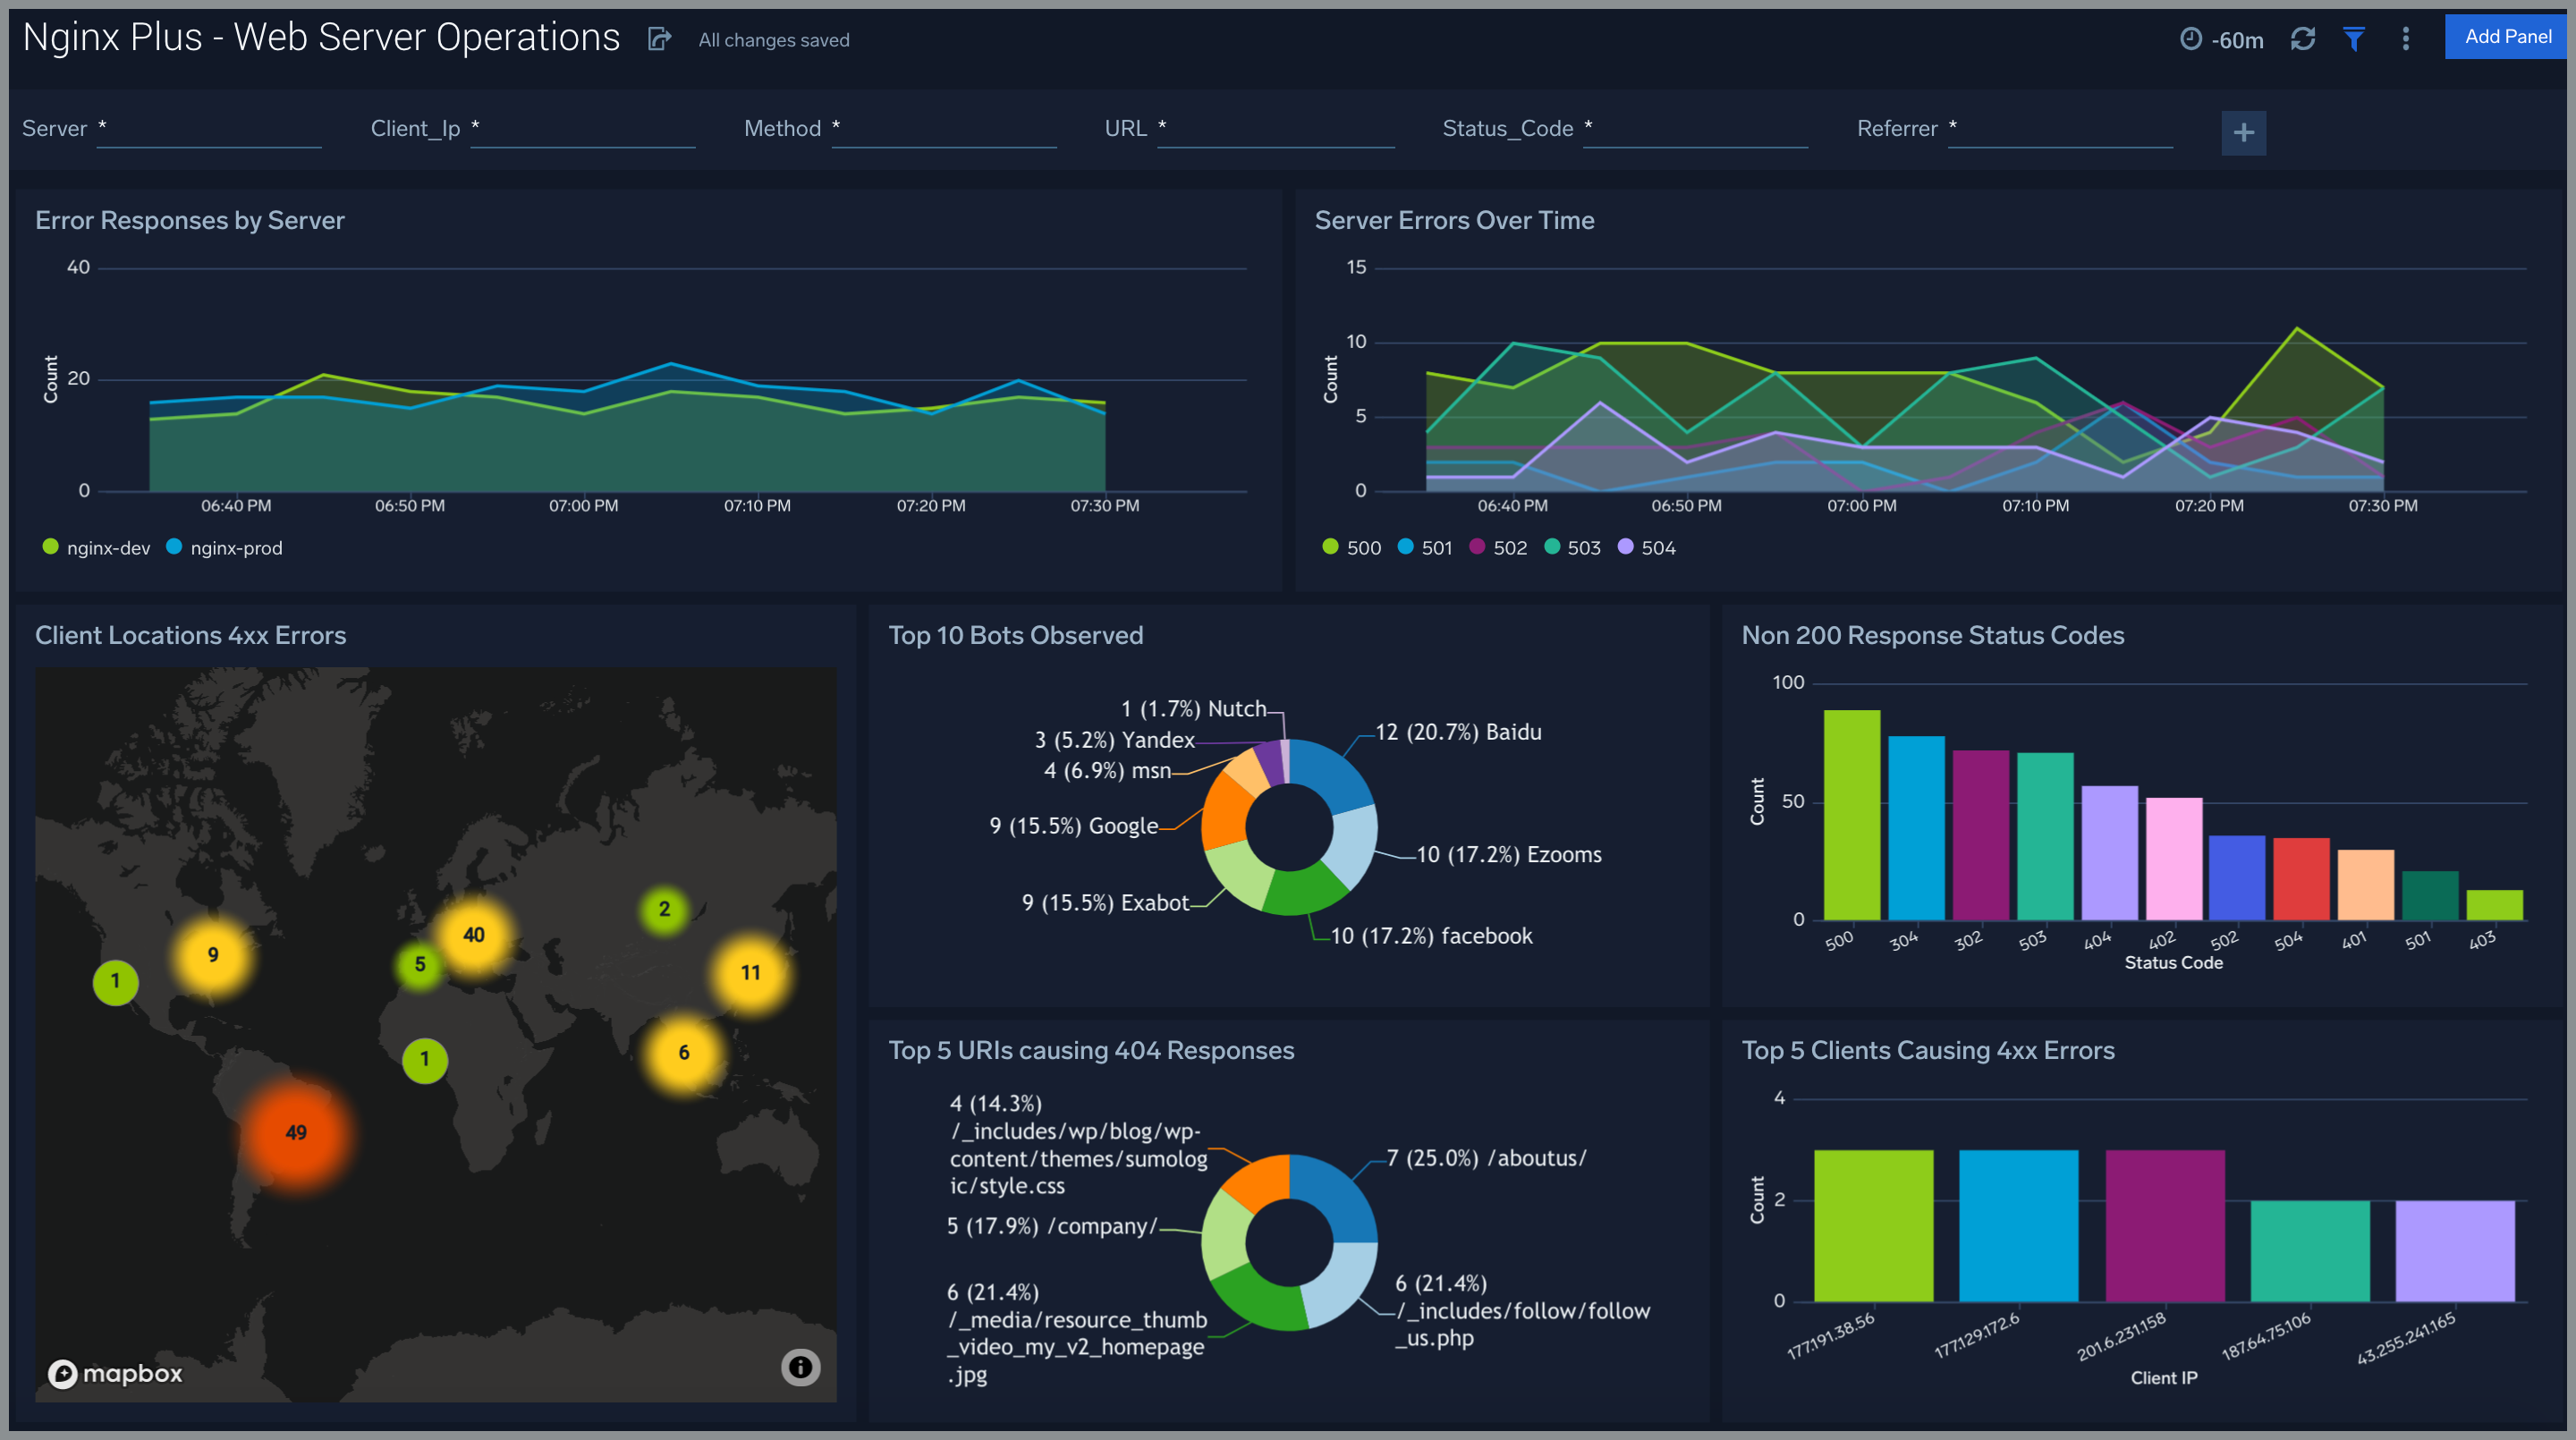
Web Server Operations
The Nginx Plus - Web Server Operations dashboard provides a high-level view combined with detailed information on the top ten bots, geographic locations, and data for clients with high error rates, server errors over time, and non 200 response code status codes. Dashboard panels also show information on server error logs, error log levels, error responses by a server, and the top URIs responsible for 404 responses.
Use this dashboard to:
- Gain insights into Client and Server Responses on the Nginx Server. This helps you identify errors in the Nginx Server.
- To identify geolocations of all Client errors. This helps you identify client locations causing errors and helps you to block client IPs.
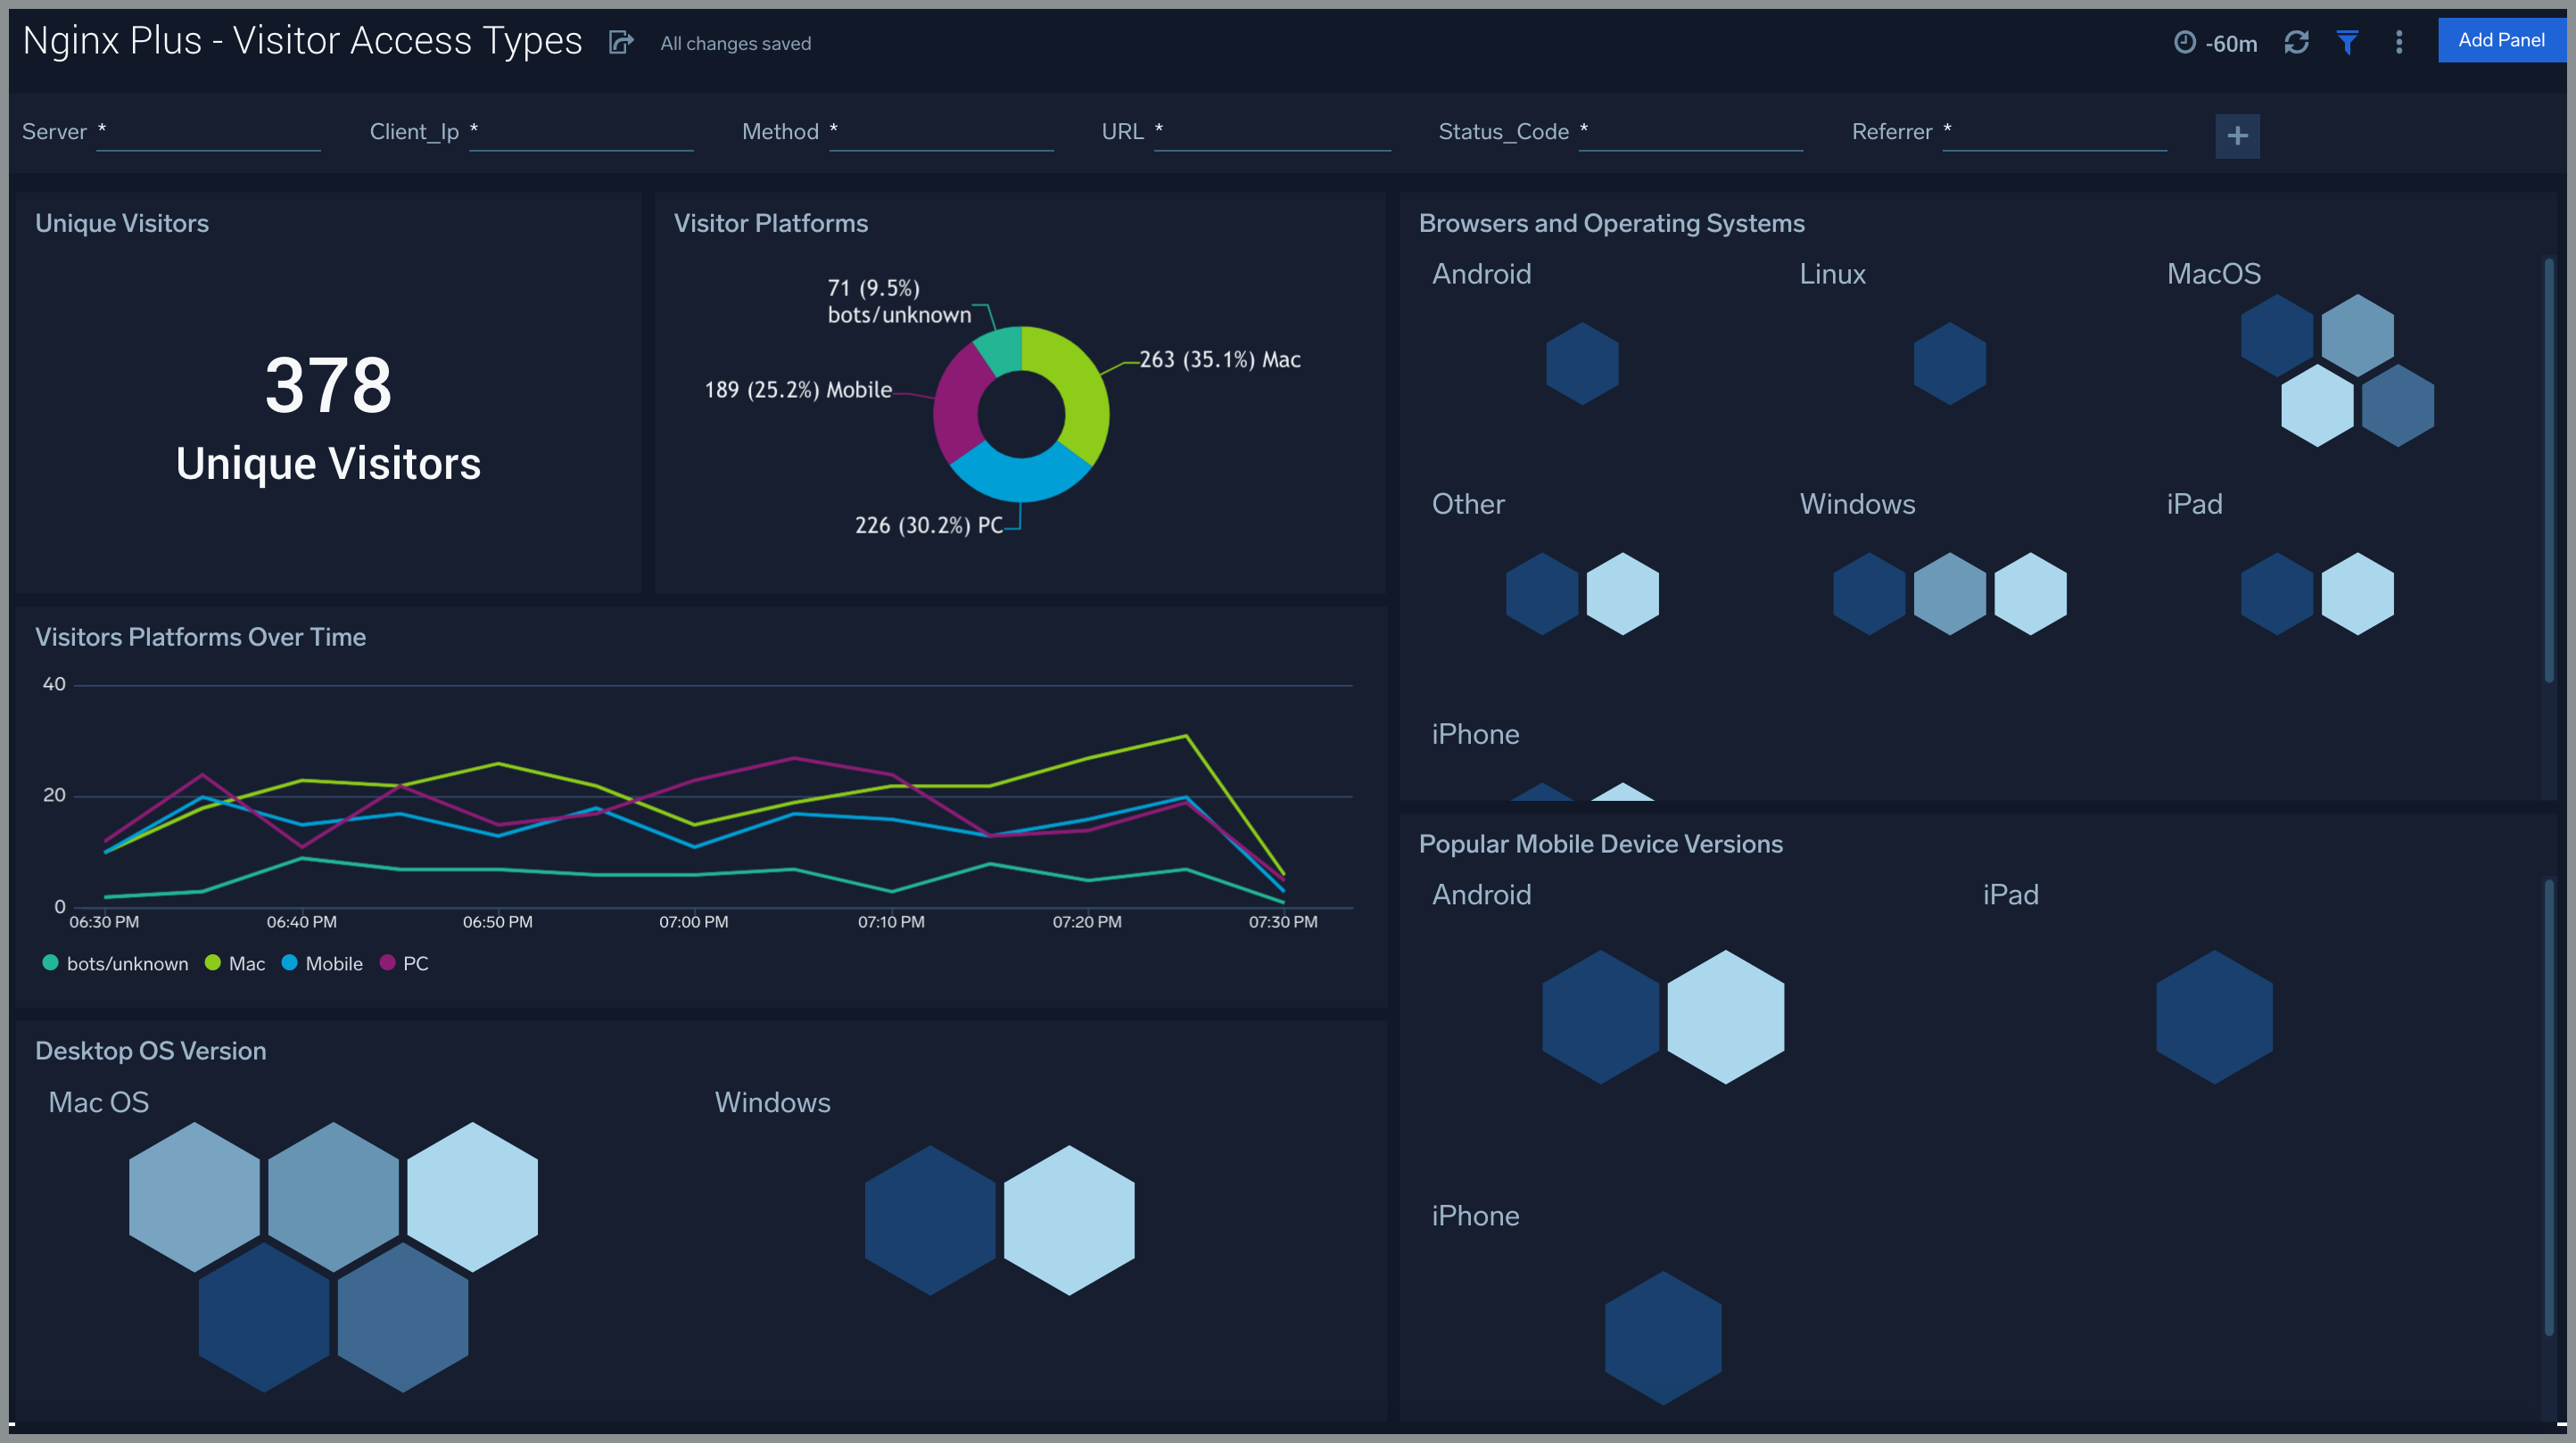
Visitor Access Types
The Nginx Plus - Visitor Access Types dashboard provides insights into visitor platform types, browsers, and operating systems, as well as the most popular mobile devices, PC and Mac versions used.
Use this dashboard to:
- Understand which platform and browsers are used to gain access to your infrastructure. These insights can be useful for planning in which browsers, platforms, and operating systems (OS) should be supported by different software services.
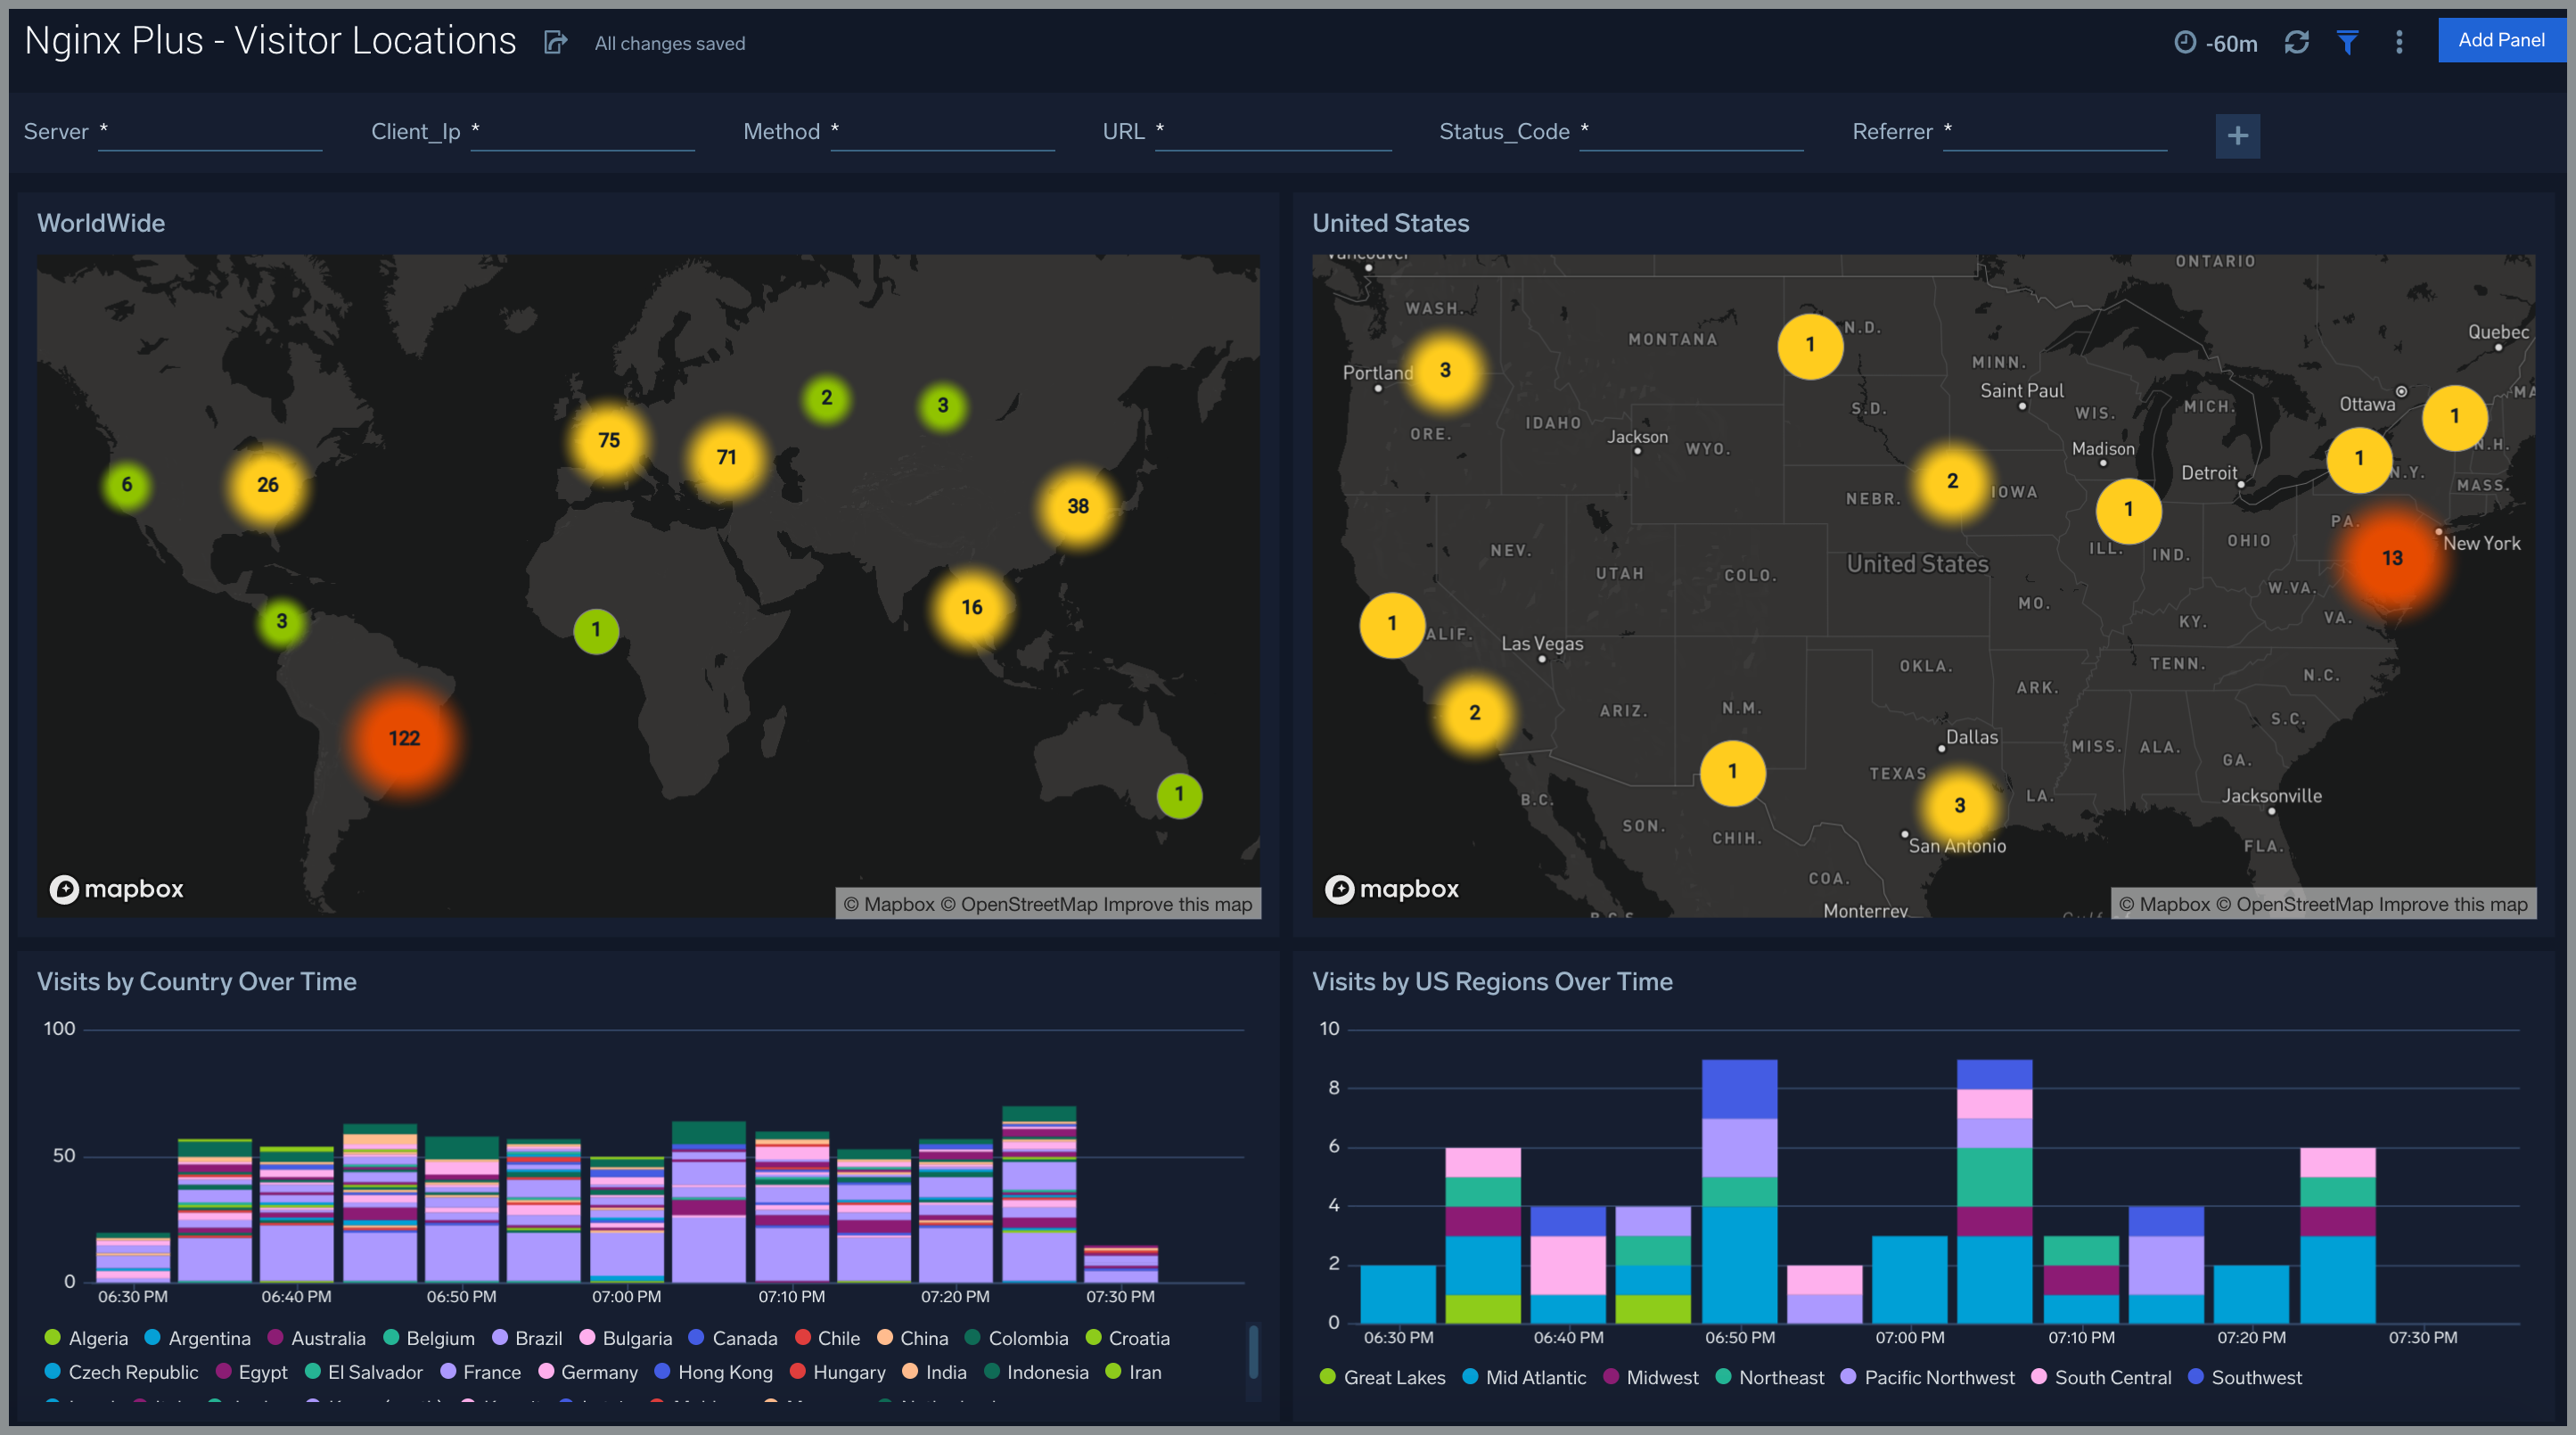
Viitor Locations
The Nginx Plus - Visitor Locations dashboard provides a high-level view of Nginx visitor geographic locations both worldwide and in the United States. Dashboard panels also show graphic trends for visits by country over time and visits by US region over time.
Use this dashboard to:
- Gain insights into the geographic locations of your user base. This is useful for resource planning in different regions across the globe.
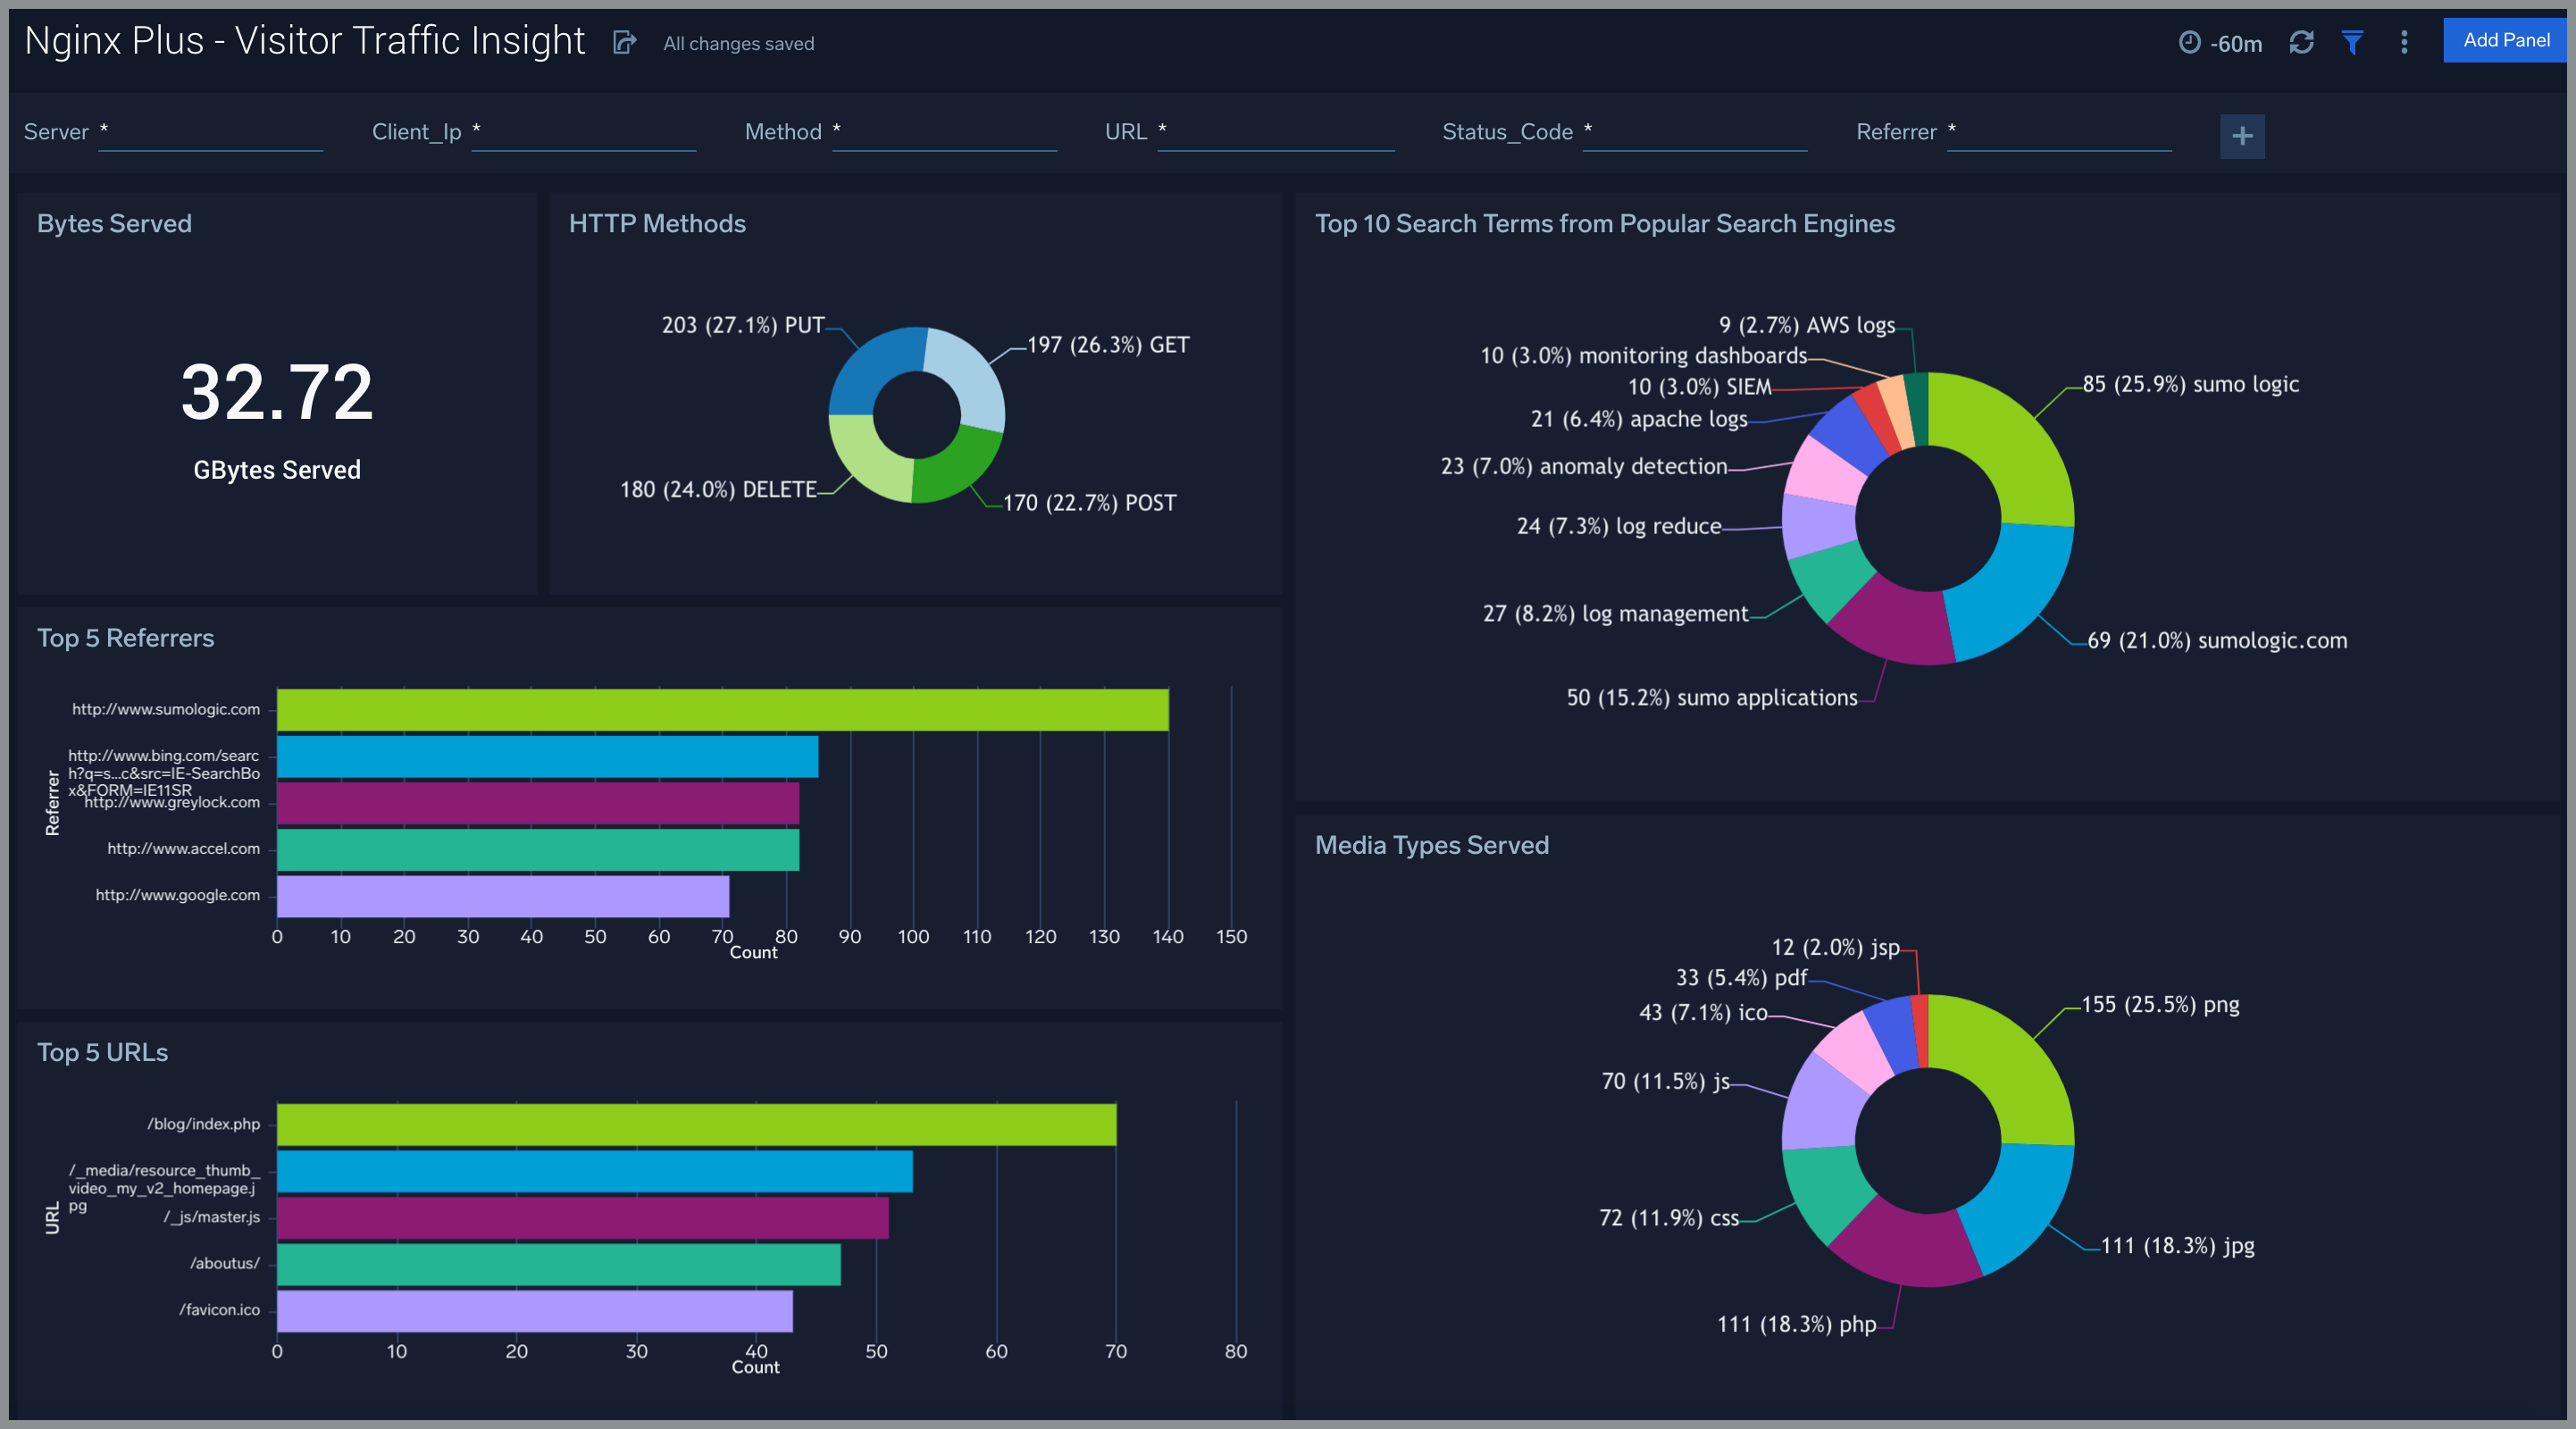
Visitor Traffic Insight
The Nginx Plus - Visitor Traffic Insight dashboard provides detailed information on the top documents accessed, top referrers, top search terms from popular search engines, and the media types served.
Use this dashboard to:
- To understand the type of content that is frequently requested by users.
- It helps in allocating IT resources according to the content types.
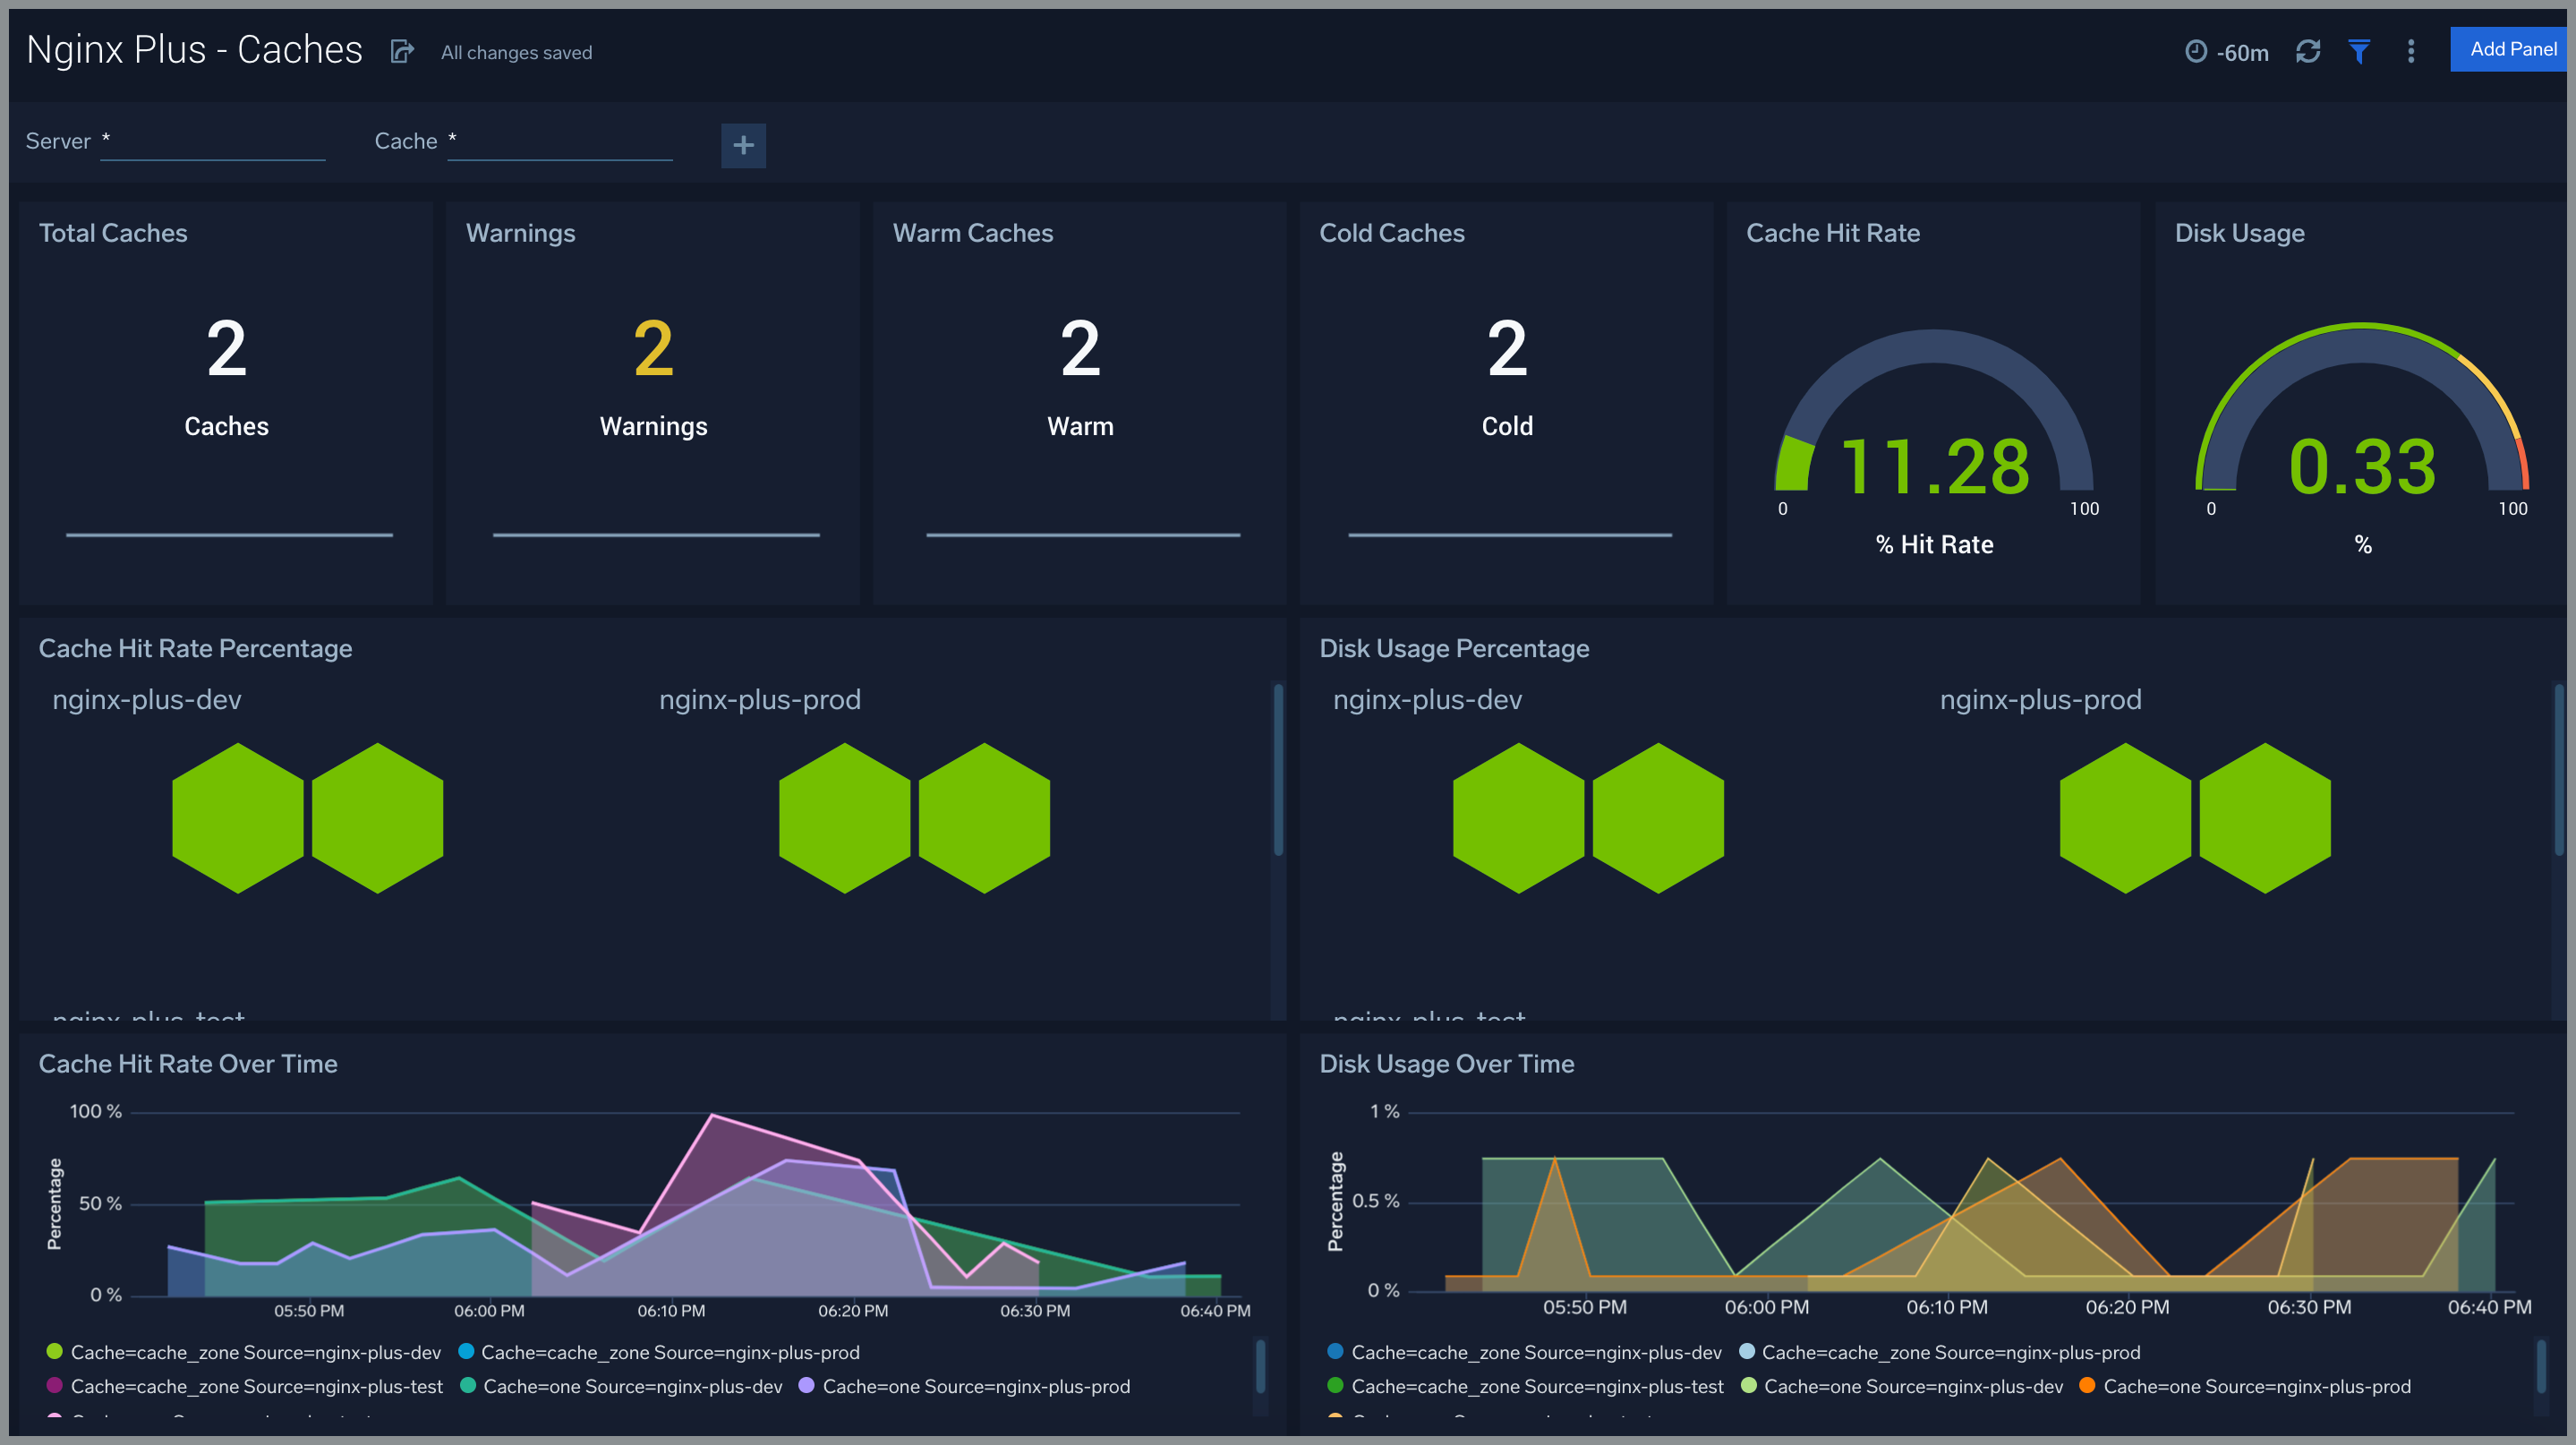
Caches
The Nginx Plus - Caches dashboard provides insight into cache states, cache hit rate, and cache disk usage over time.
Use this dashboard to:
- Gain information about the number of caches used, how many of them are in an active (hot) state and what is the hit rate of the cache.
- Gain information about how much disk space is used for cache.
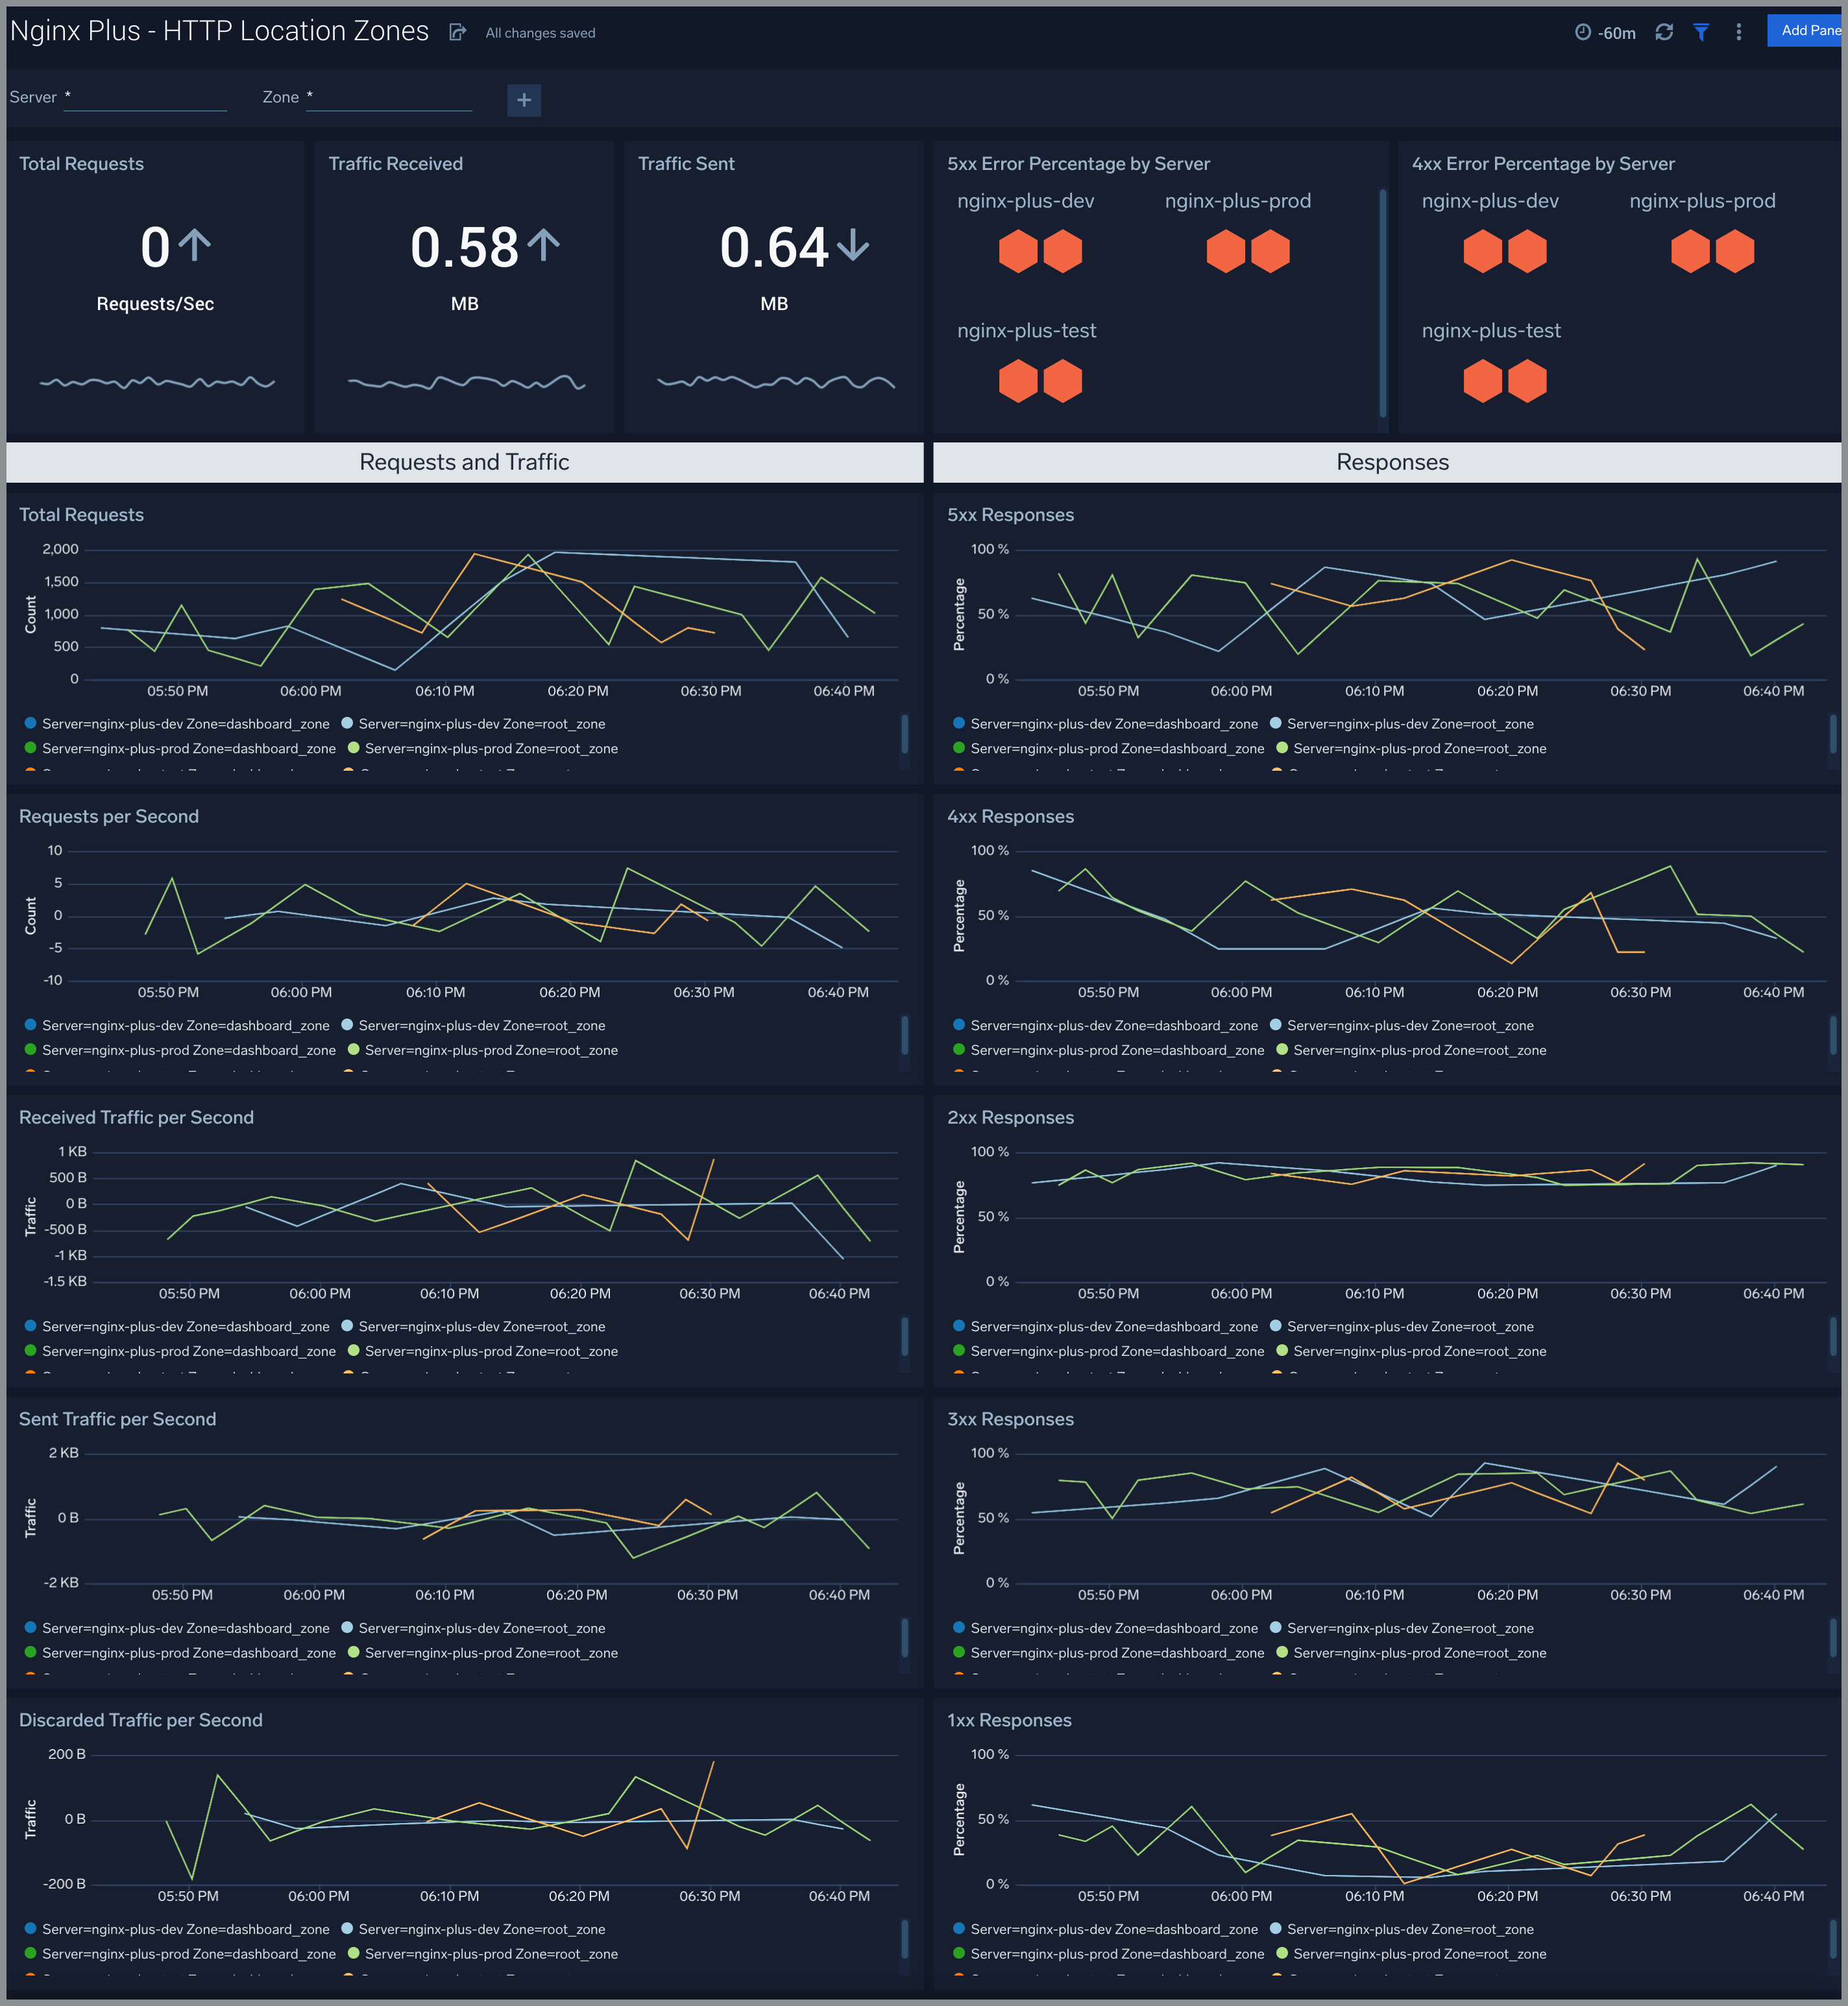
HTTP Location Zones
The Nginx Plus - HTTP Location Zones dashboard provides detailed statistics on the frontend performance, showing traffic speed, responses/requests count, and various error responses.
Use this dashboard to:
- Gain information about Location HTTP zones traffic: received and sent; speed, requires/responses amount, discarded traffic.
- Gain information about Location HTTP zones error responses: percentage of responses by the server, percentage of each type of error responses.
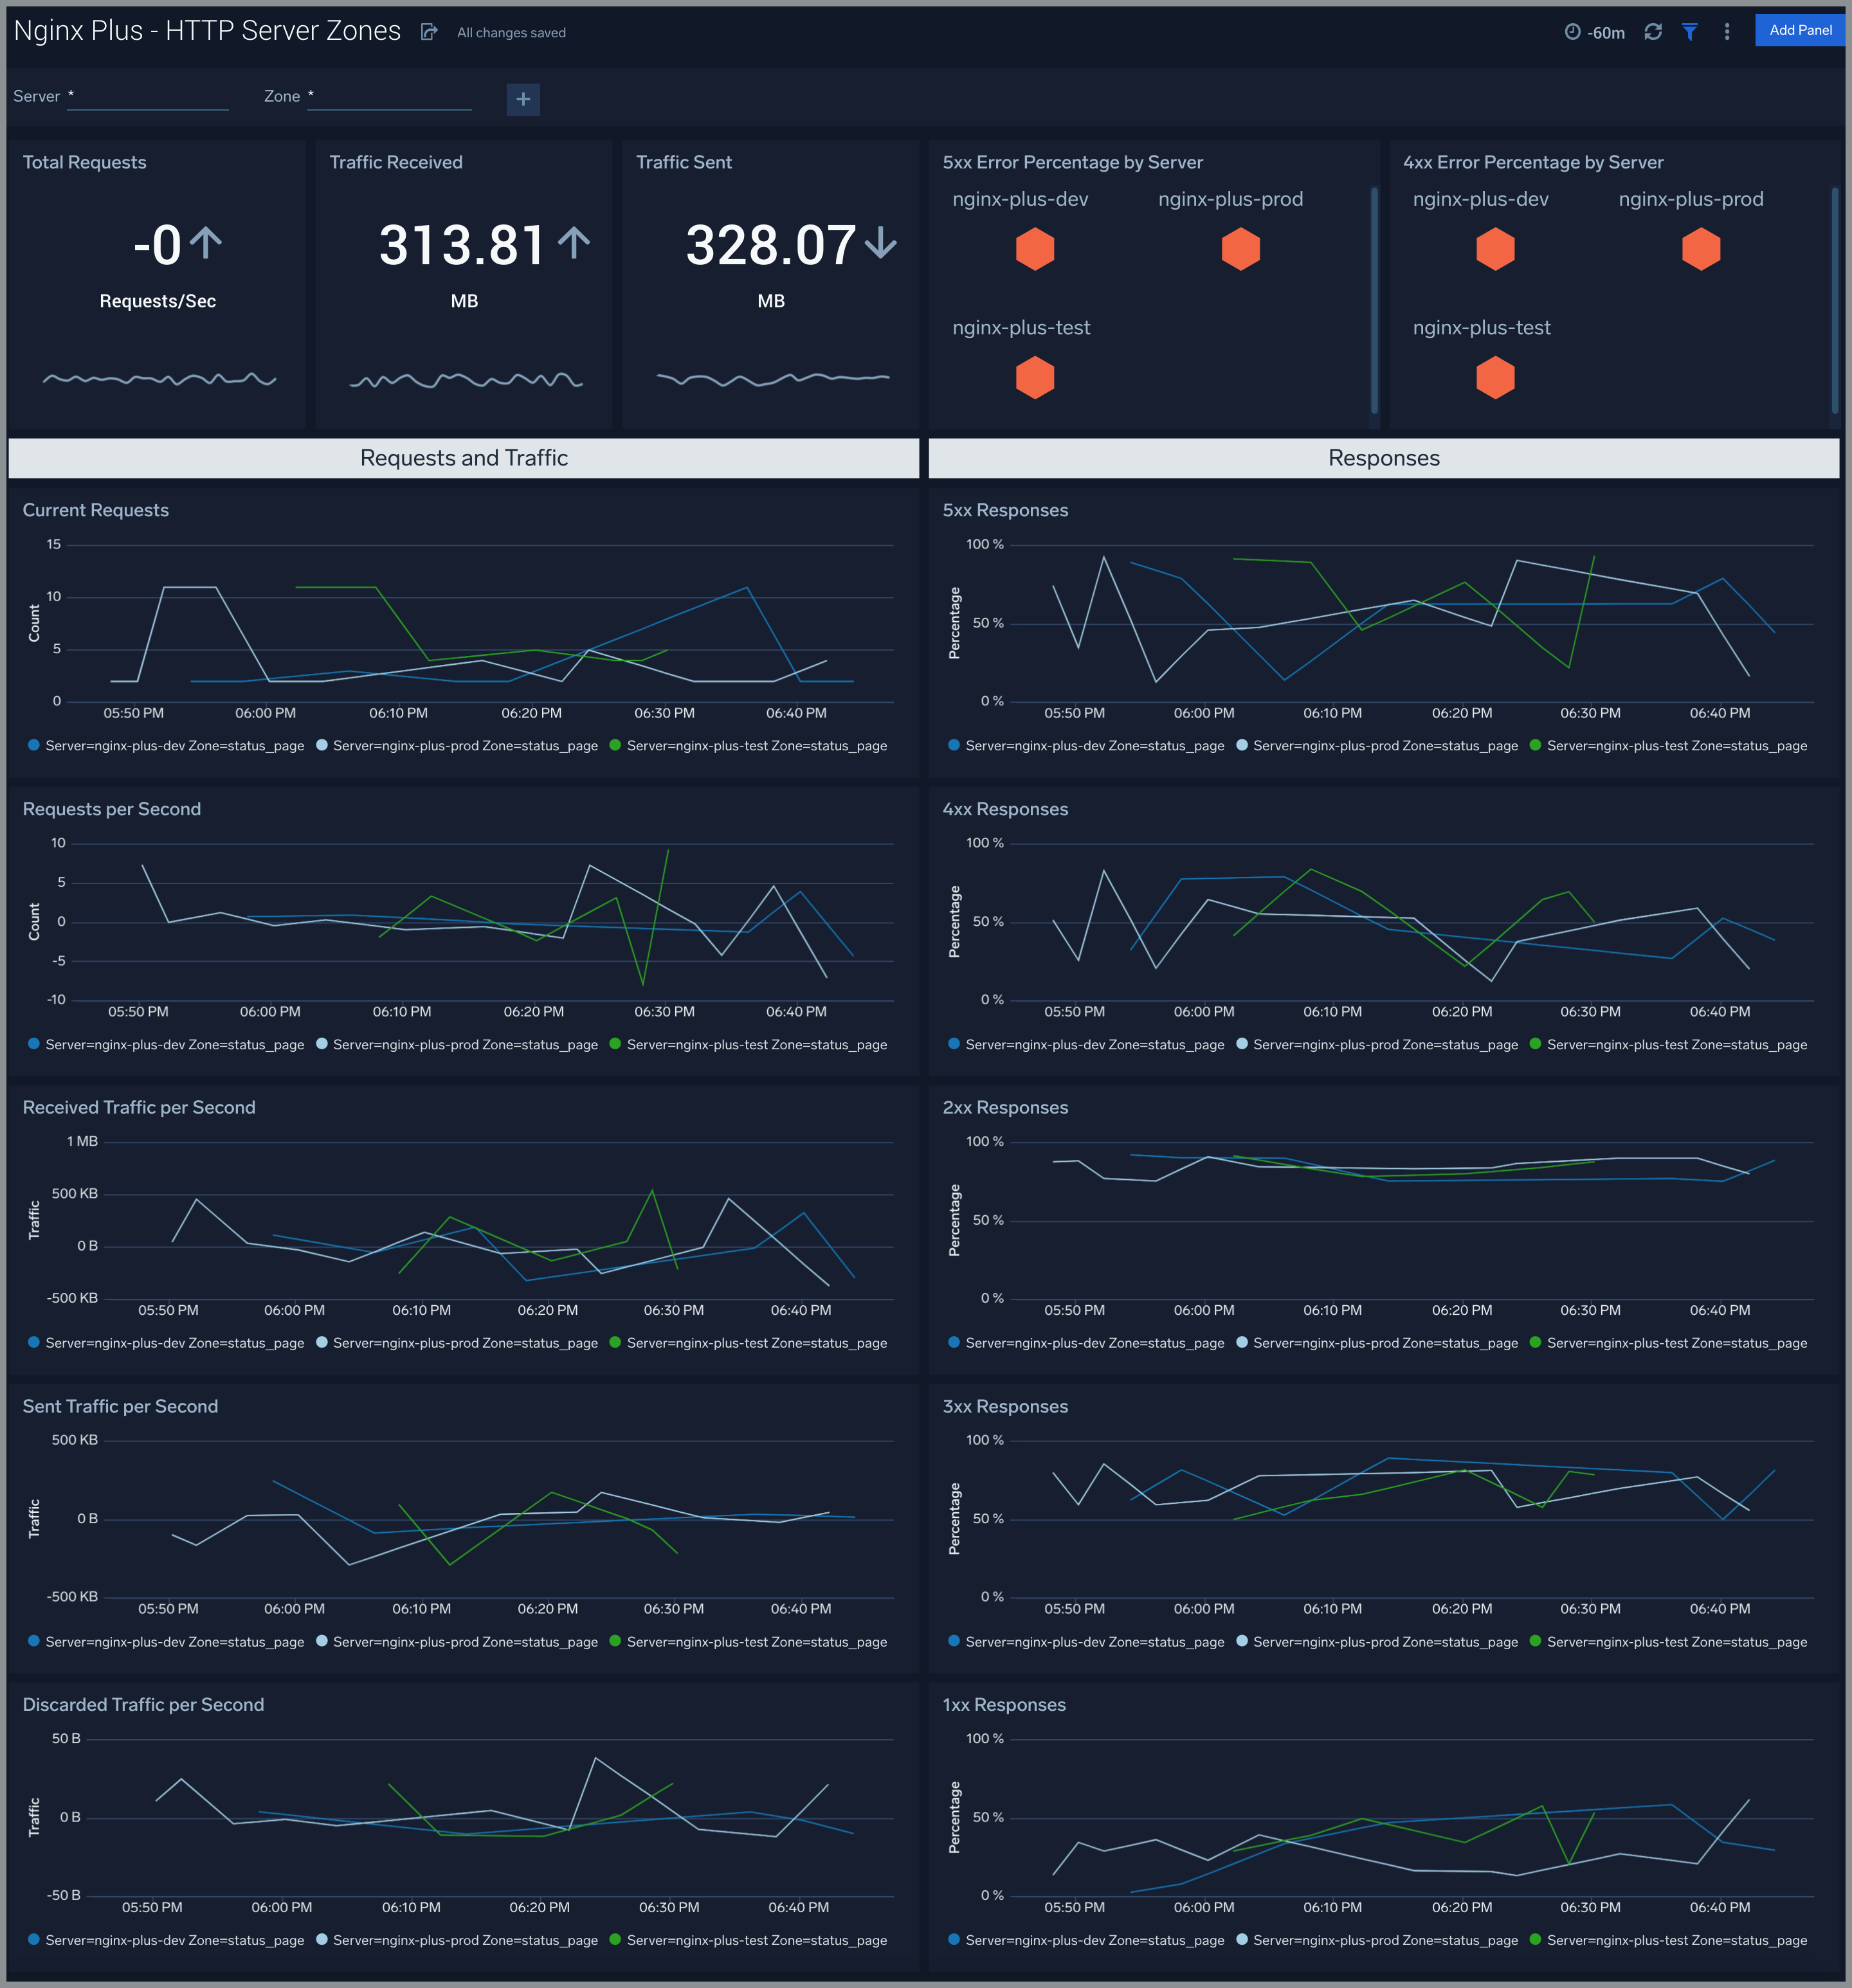
HTTP Server Zones
The Nginx Plus - HTTP Server Zones dashboard provides detailed statistics on the frontend performance, showing traffic speed, responses/requests count, and various error responses.
Use this dashboard to:
- Gain information about Server HTTP zones traffic: received and sent; speed, requires/responses amount, discarded traffic.
- Gain information about Server HTTP zones error responses: percentage of responses by server, percentage of each type of error response.
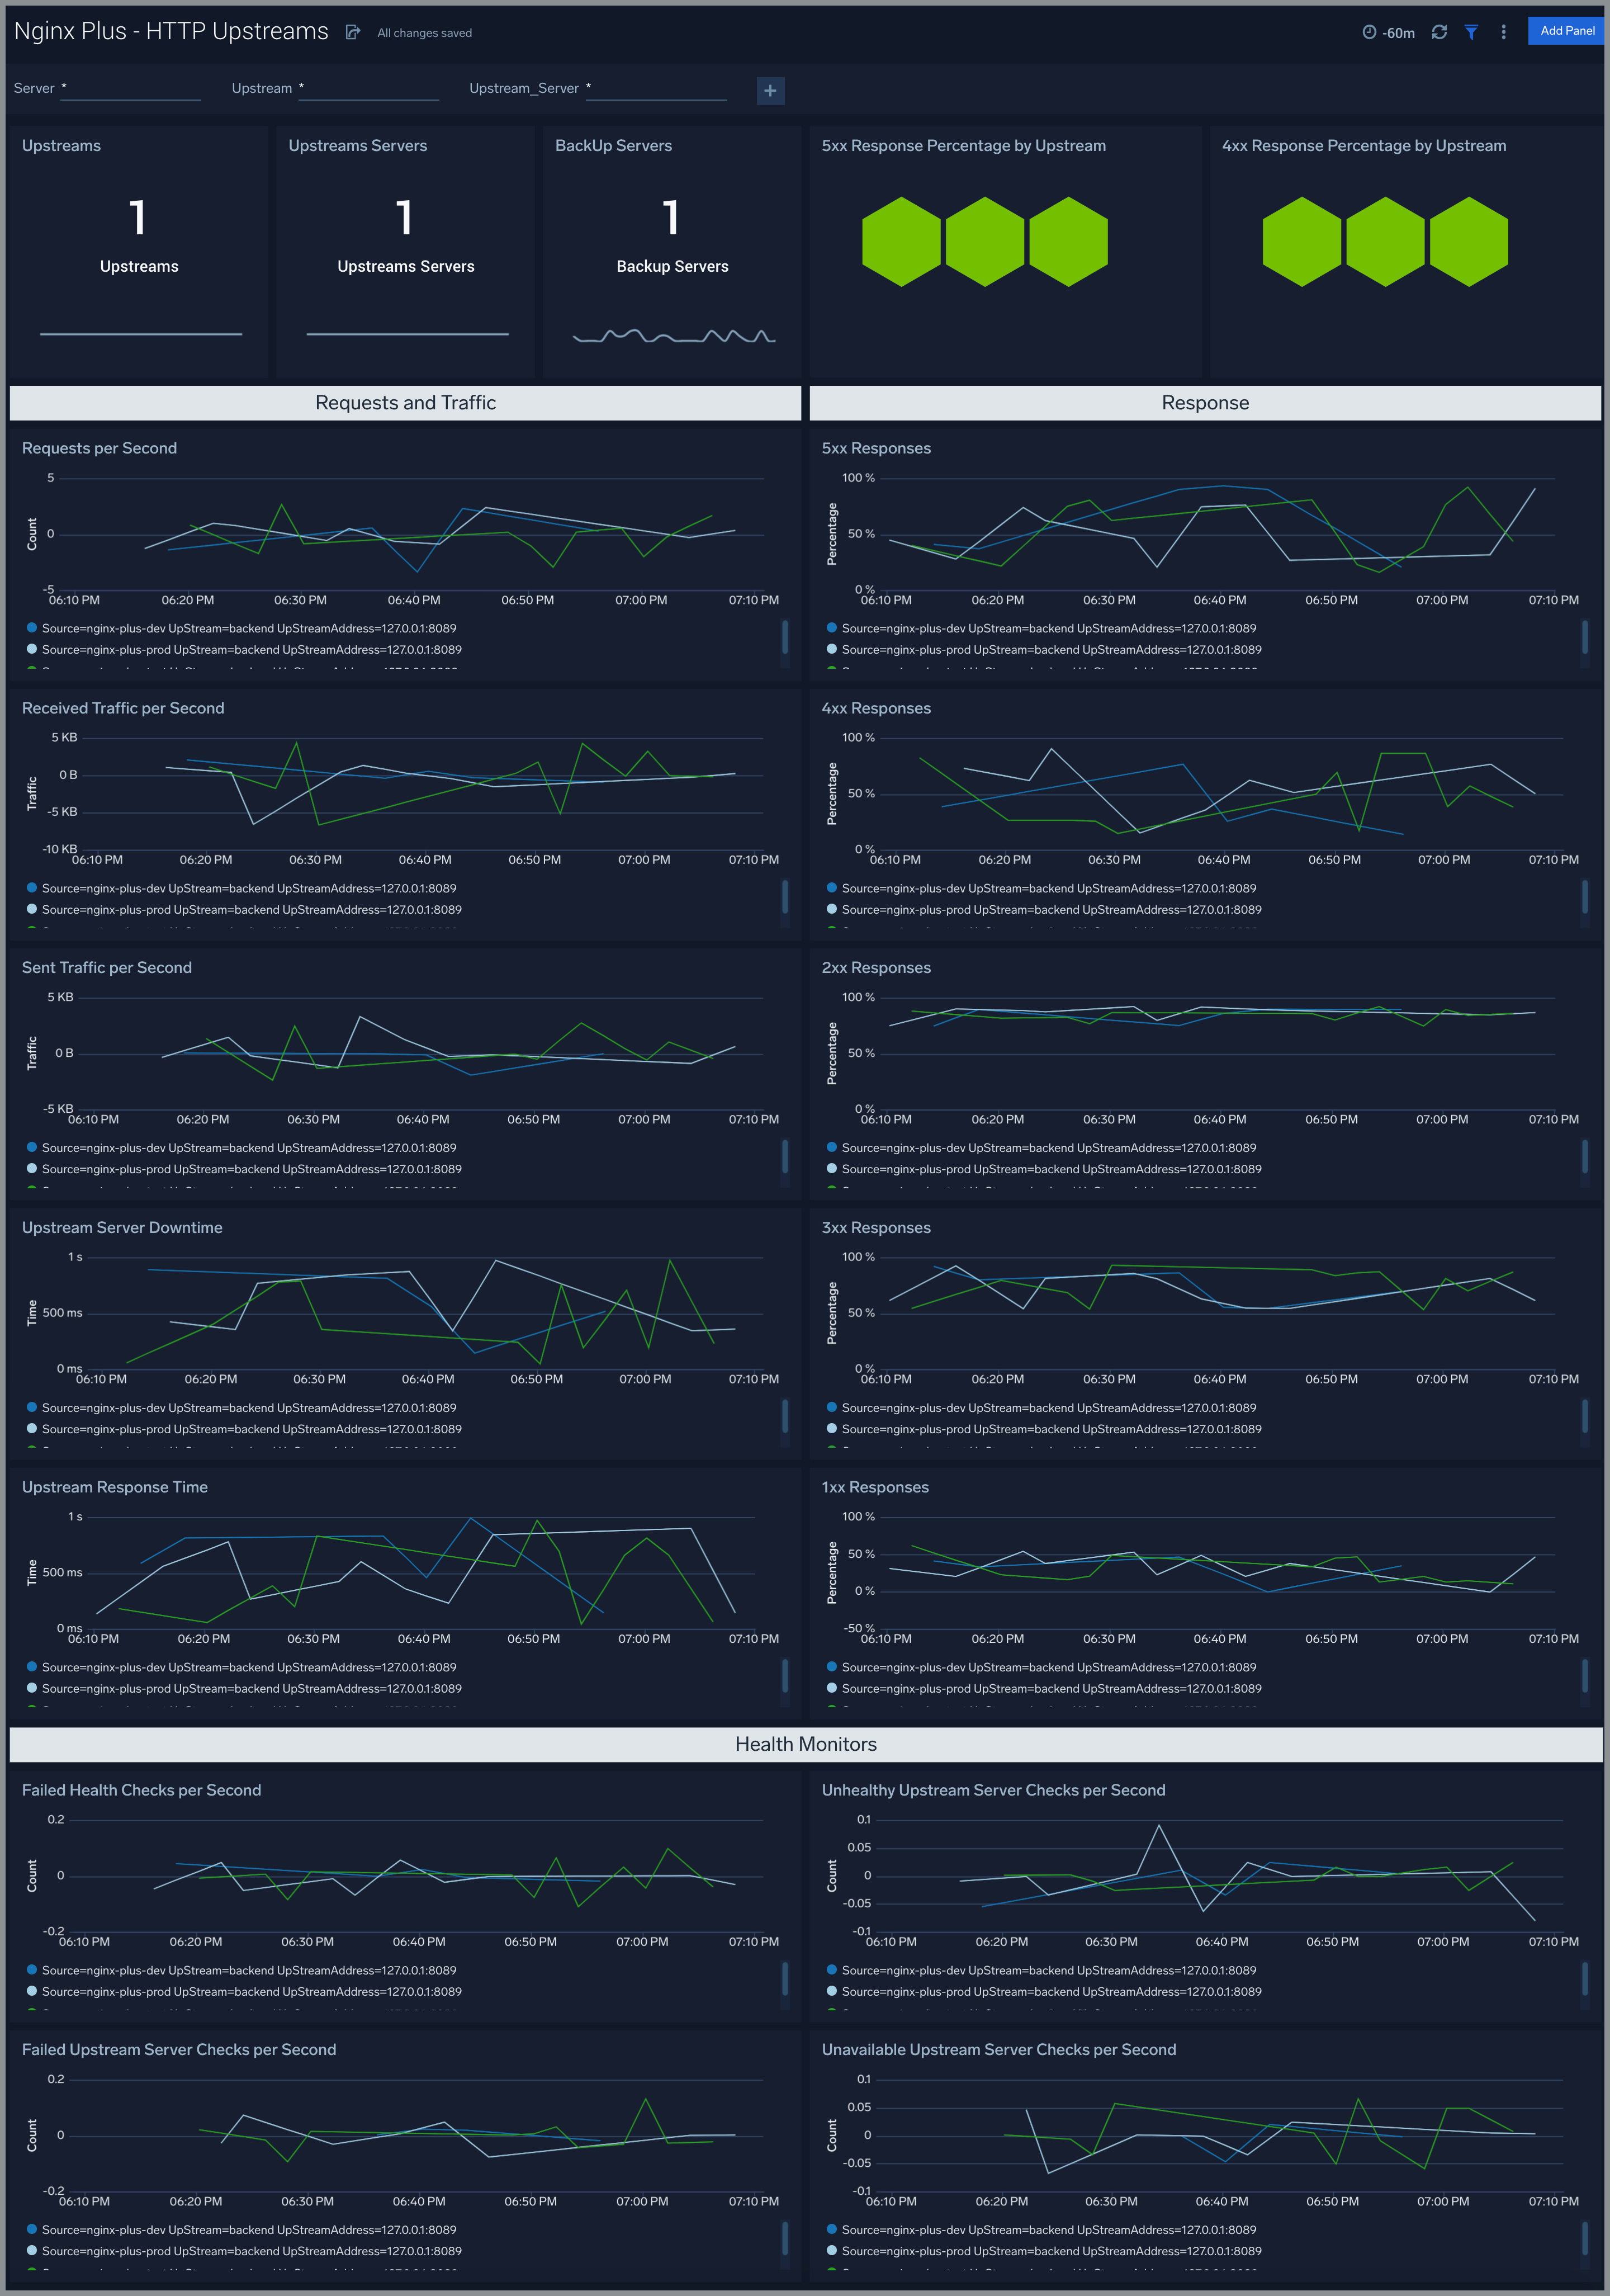
HTTP Upstreams
The Nginx Plus - HTTP Upstreams dashboard provides information about each upstream group for HTTP and HTTPS traffic, showing the number of HTTP upstreams, servers, backup servers, error responses, and health monitoring.
Use this dashboard to:
- Gain information about HTTP upstreams, servers, and backup servers.
- Gain information about HTTP upstream traffic: received and sent; speed, requires/responses amount, downtime, and response time.
- Gain information about HTTP upstream error responses: percentage of responses by the server, percentage of each type of error response.
- Gain information about HTTP upstream health monitoring.
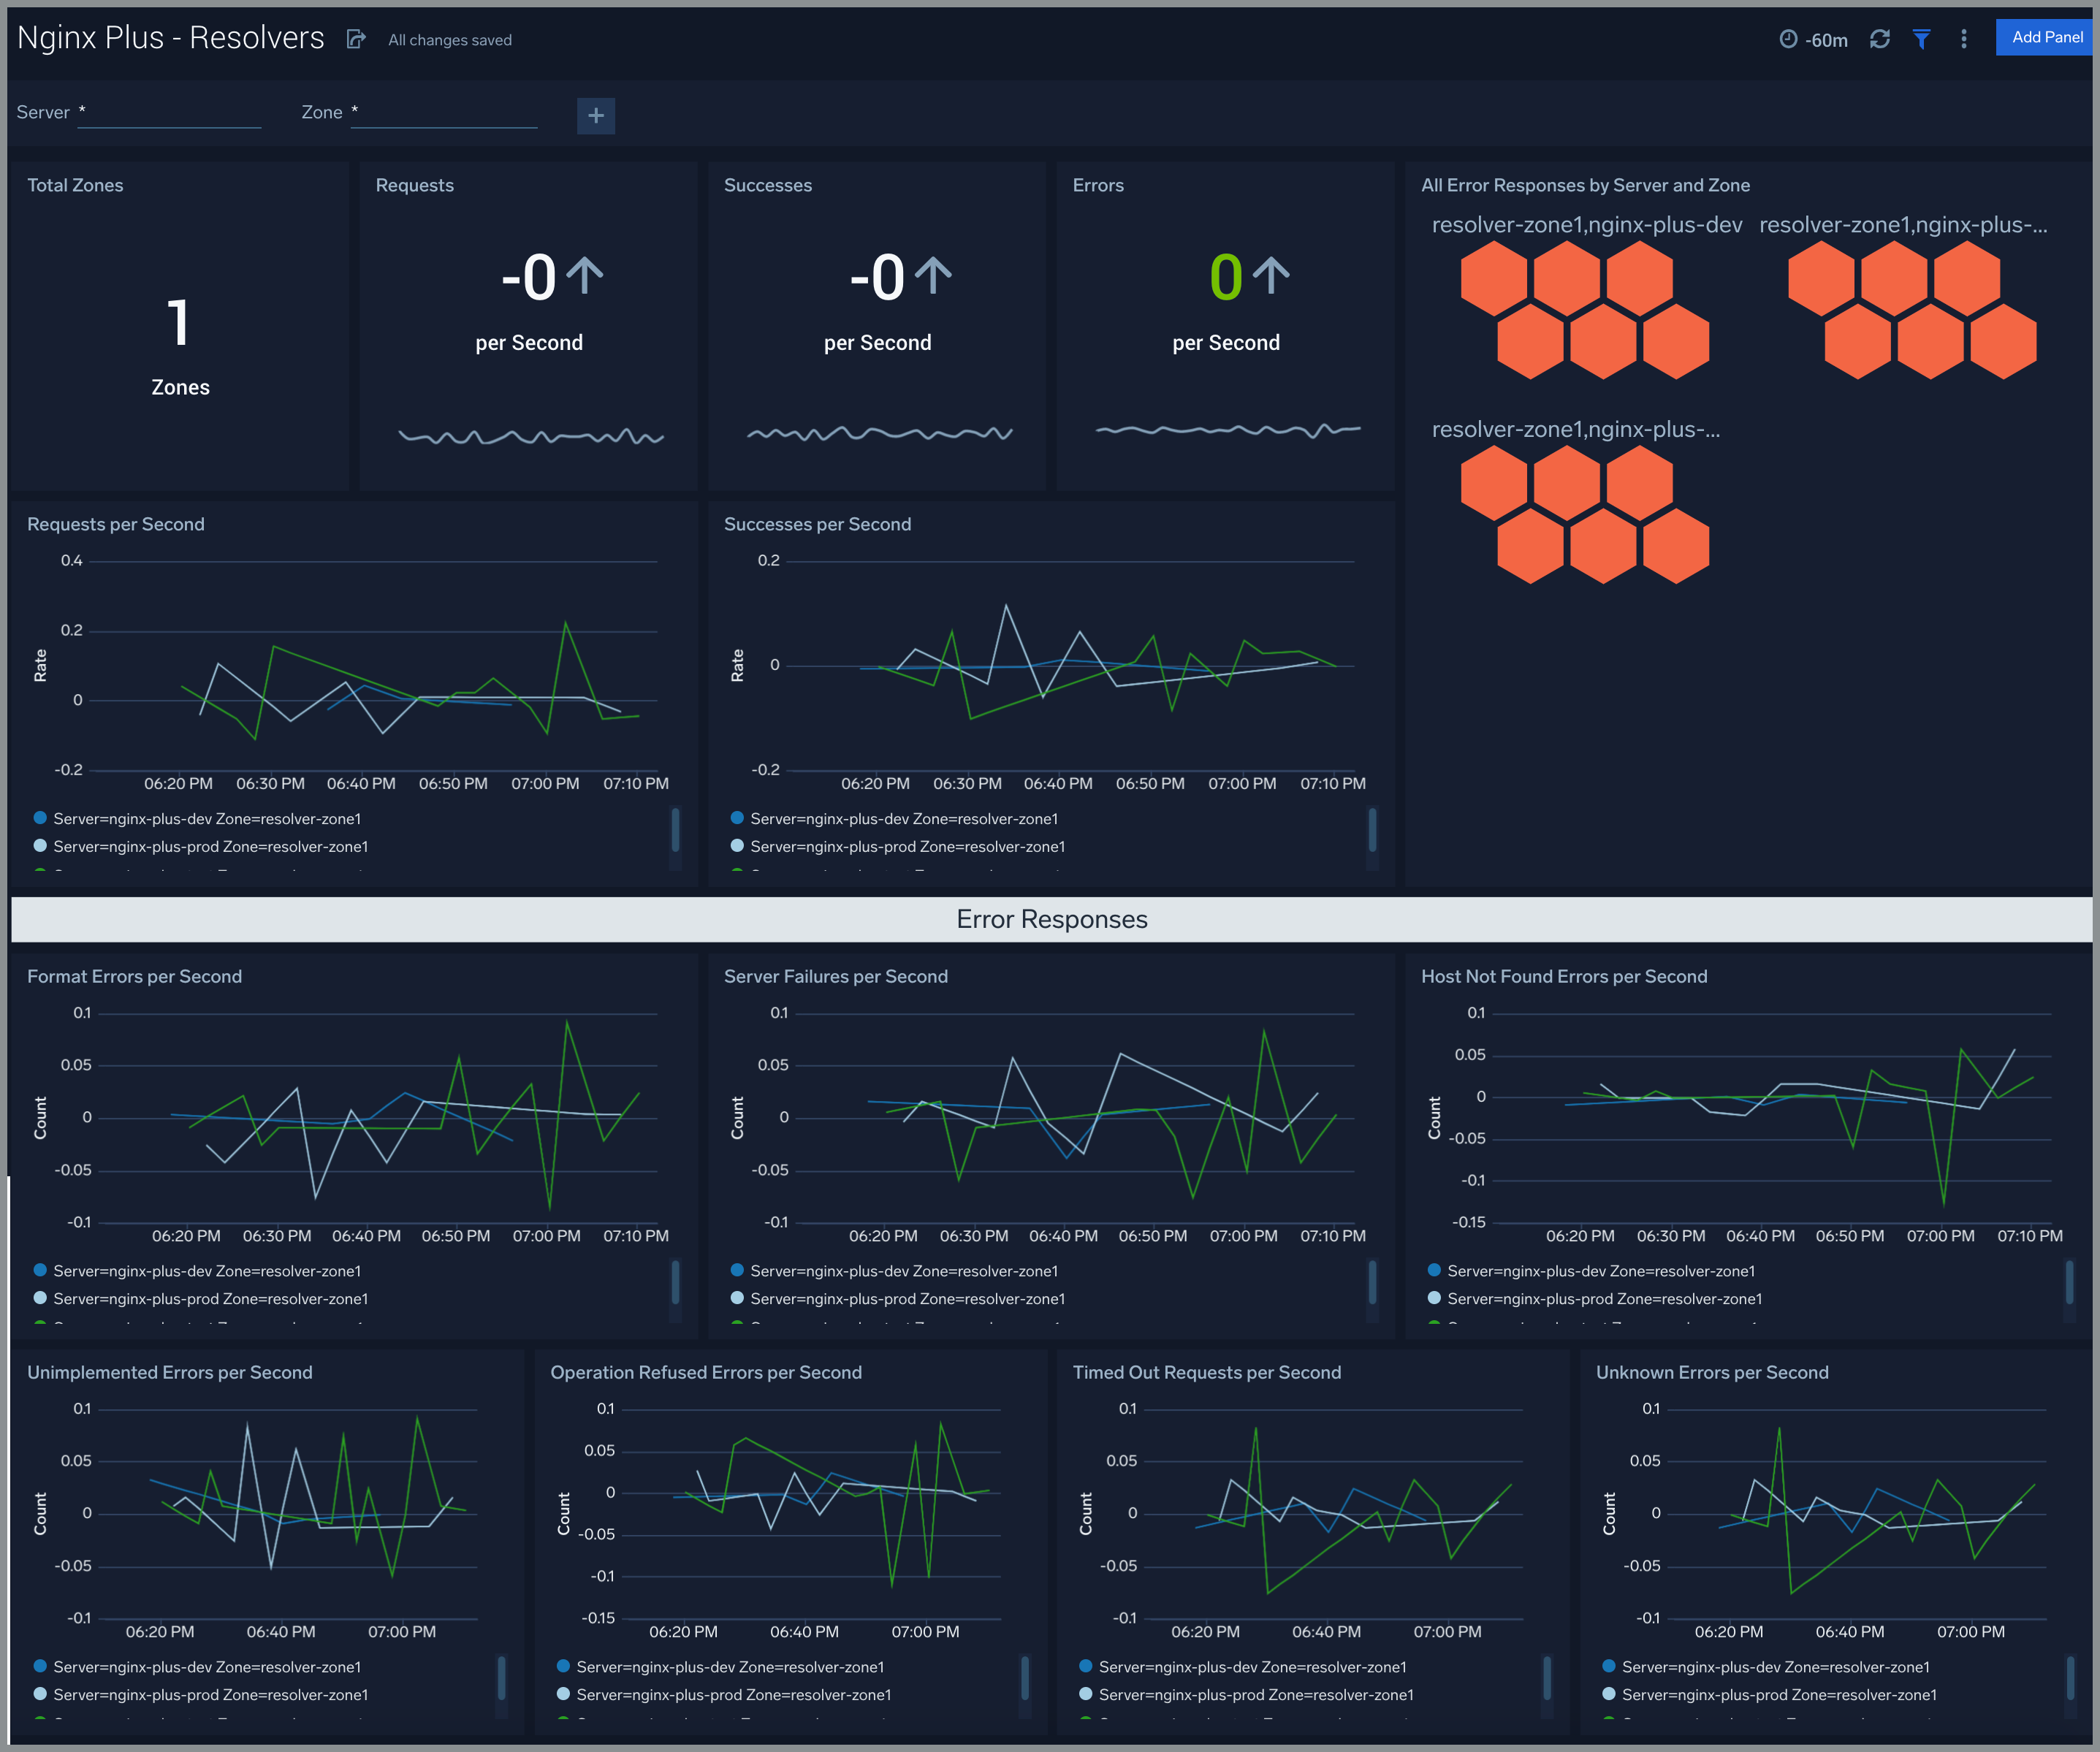
Resolvers
The Nginx Plus - Resolvers dashboard provides DNS server statistics of requests and responses per each DNS status zone.
Use this dashboard to:
- Gain information about the total number of zones, responses, and request speed.
- Gain information about error responses by each type of error.
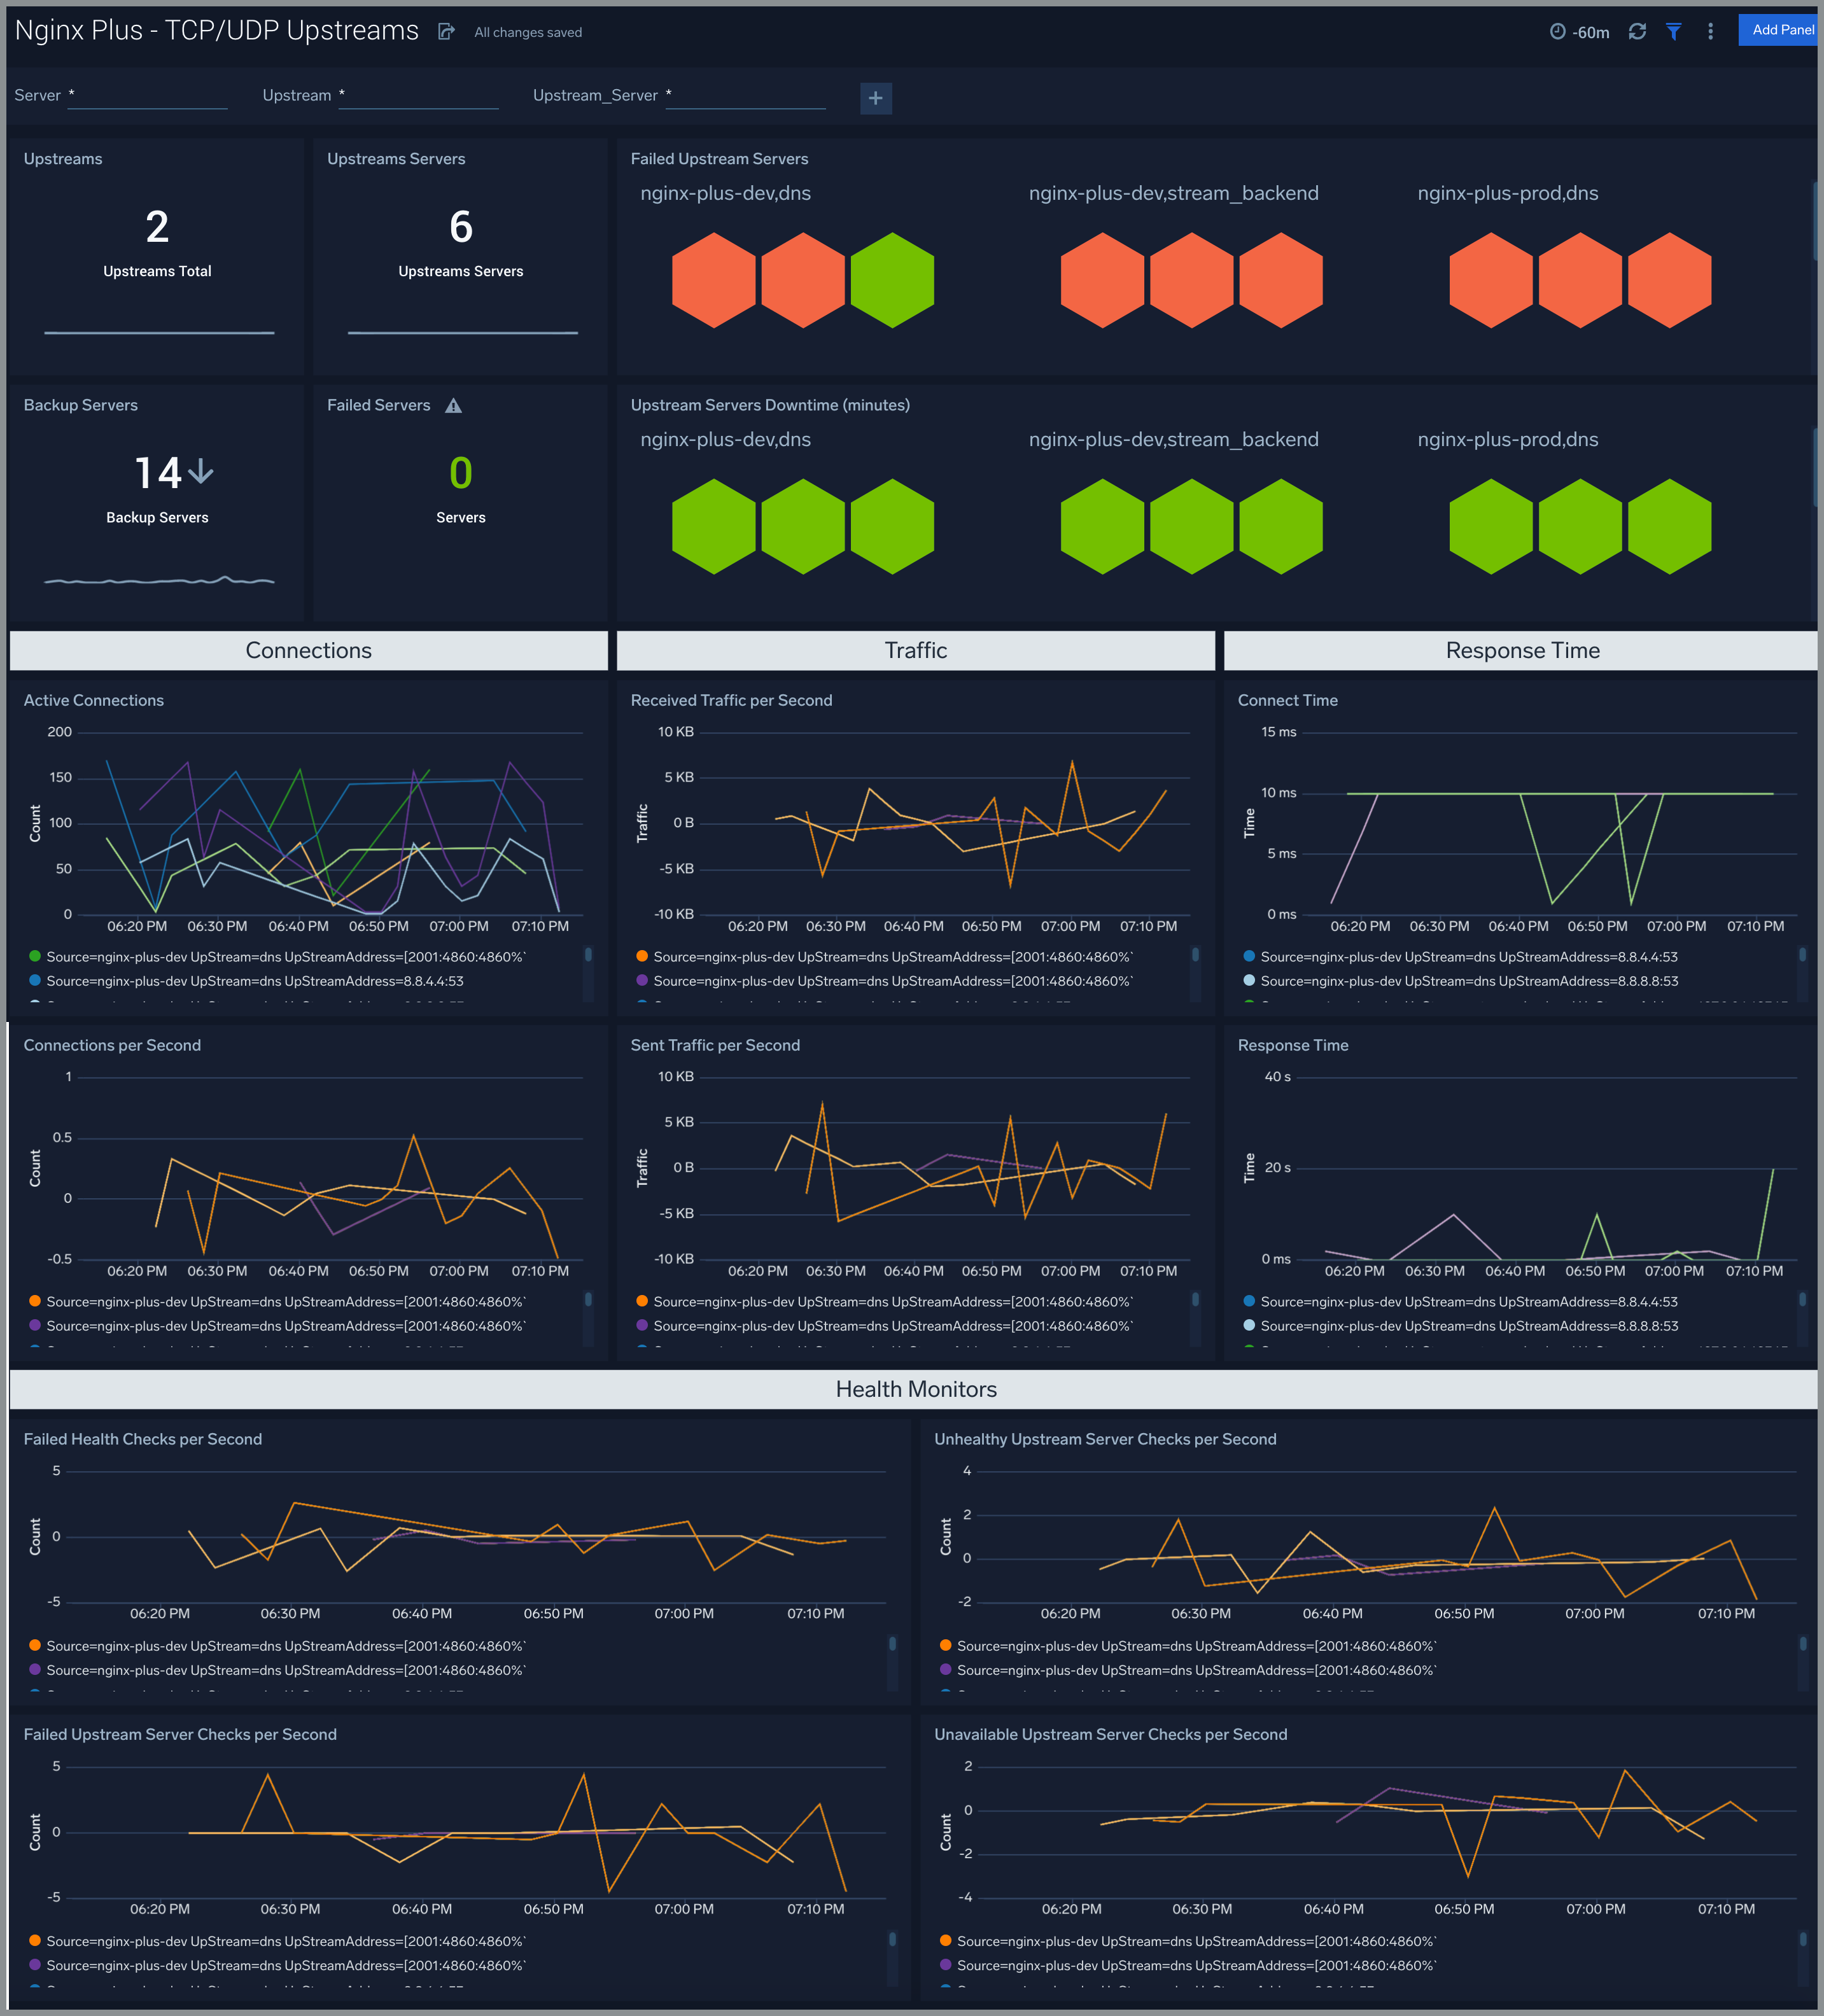
TCP/UDP Upstreams
The Nginx Plus - TCP/UDP Upstreams dashboard provides information about each upstream group for TCP and UDP traffic, showing the number of TCP and UDP upstreams, servers, backup servers, error responses, and health monitoring.
Use this dashboard to:
- Gain information about TCP and UDP upstreams, servers, and backup servers.
- Gain information about TCP and UDP upstream traffic: received and sent; speed, requests/responses amount, downtime, and response time.
- Gain information about TCP and UDP upstream error responses: percentage of responses by the server, percentage of each type of error response.
- Gain information about TCP and UDP upstream health monitoring.
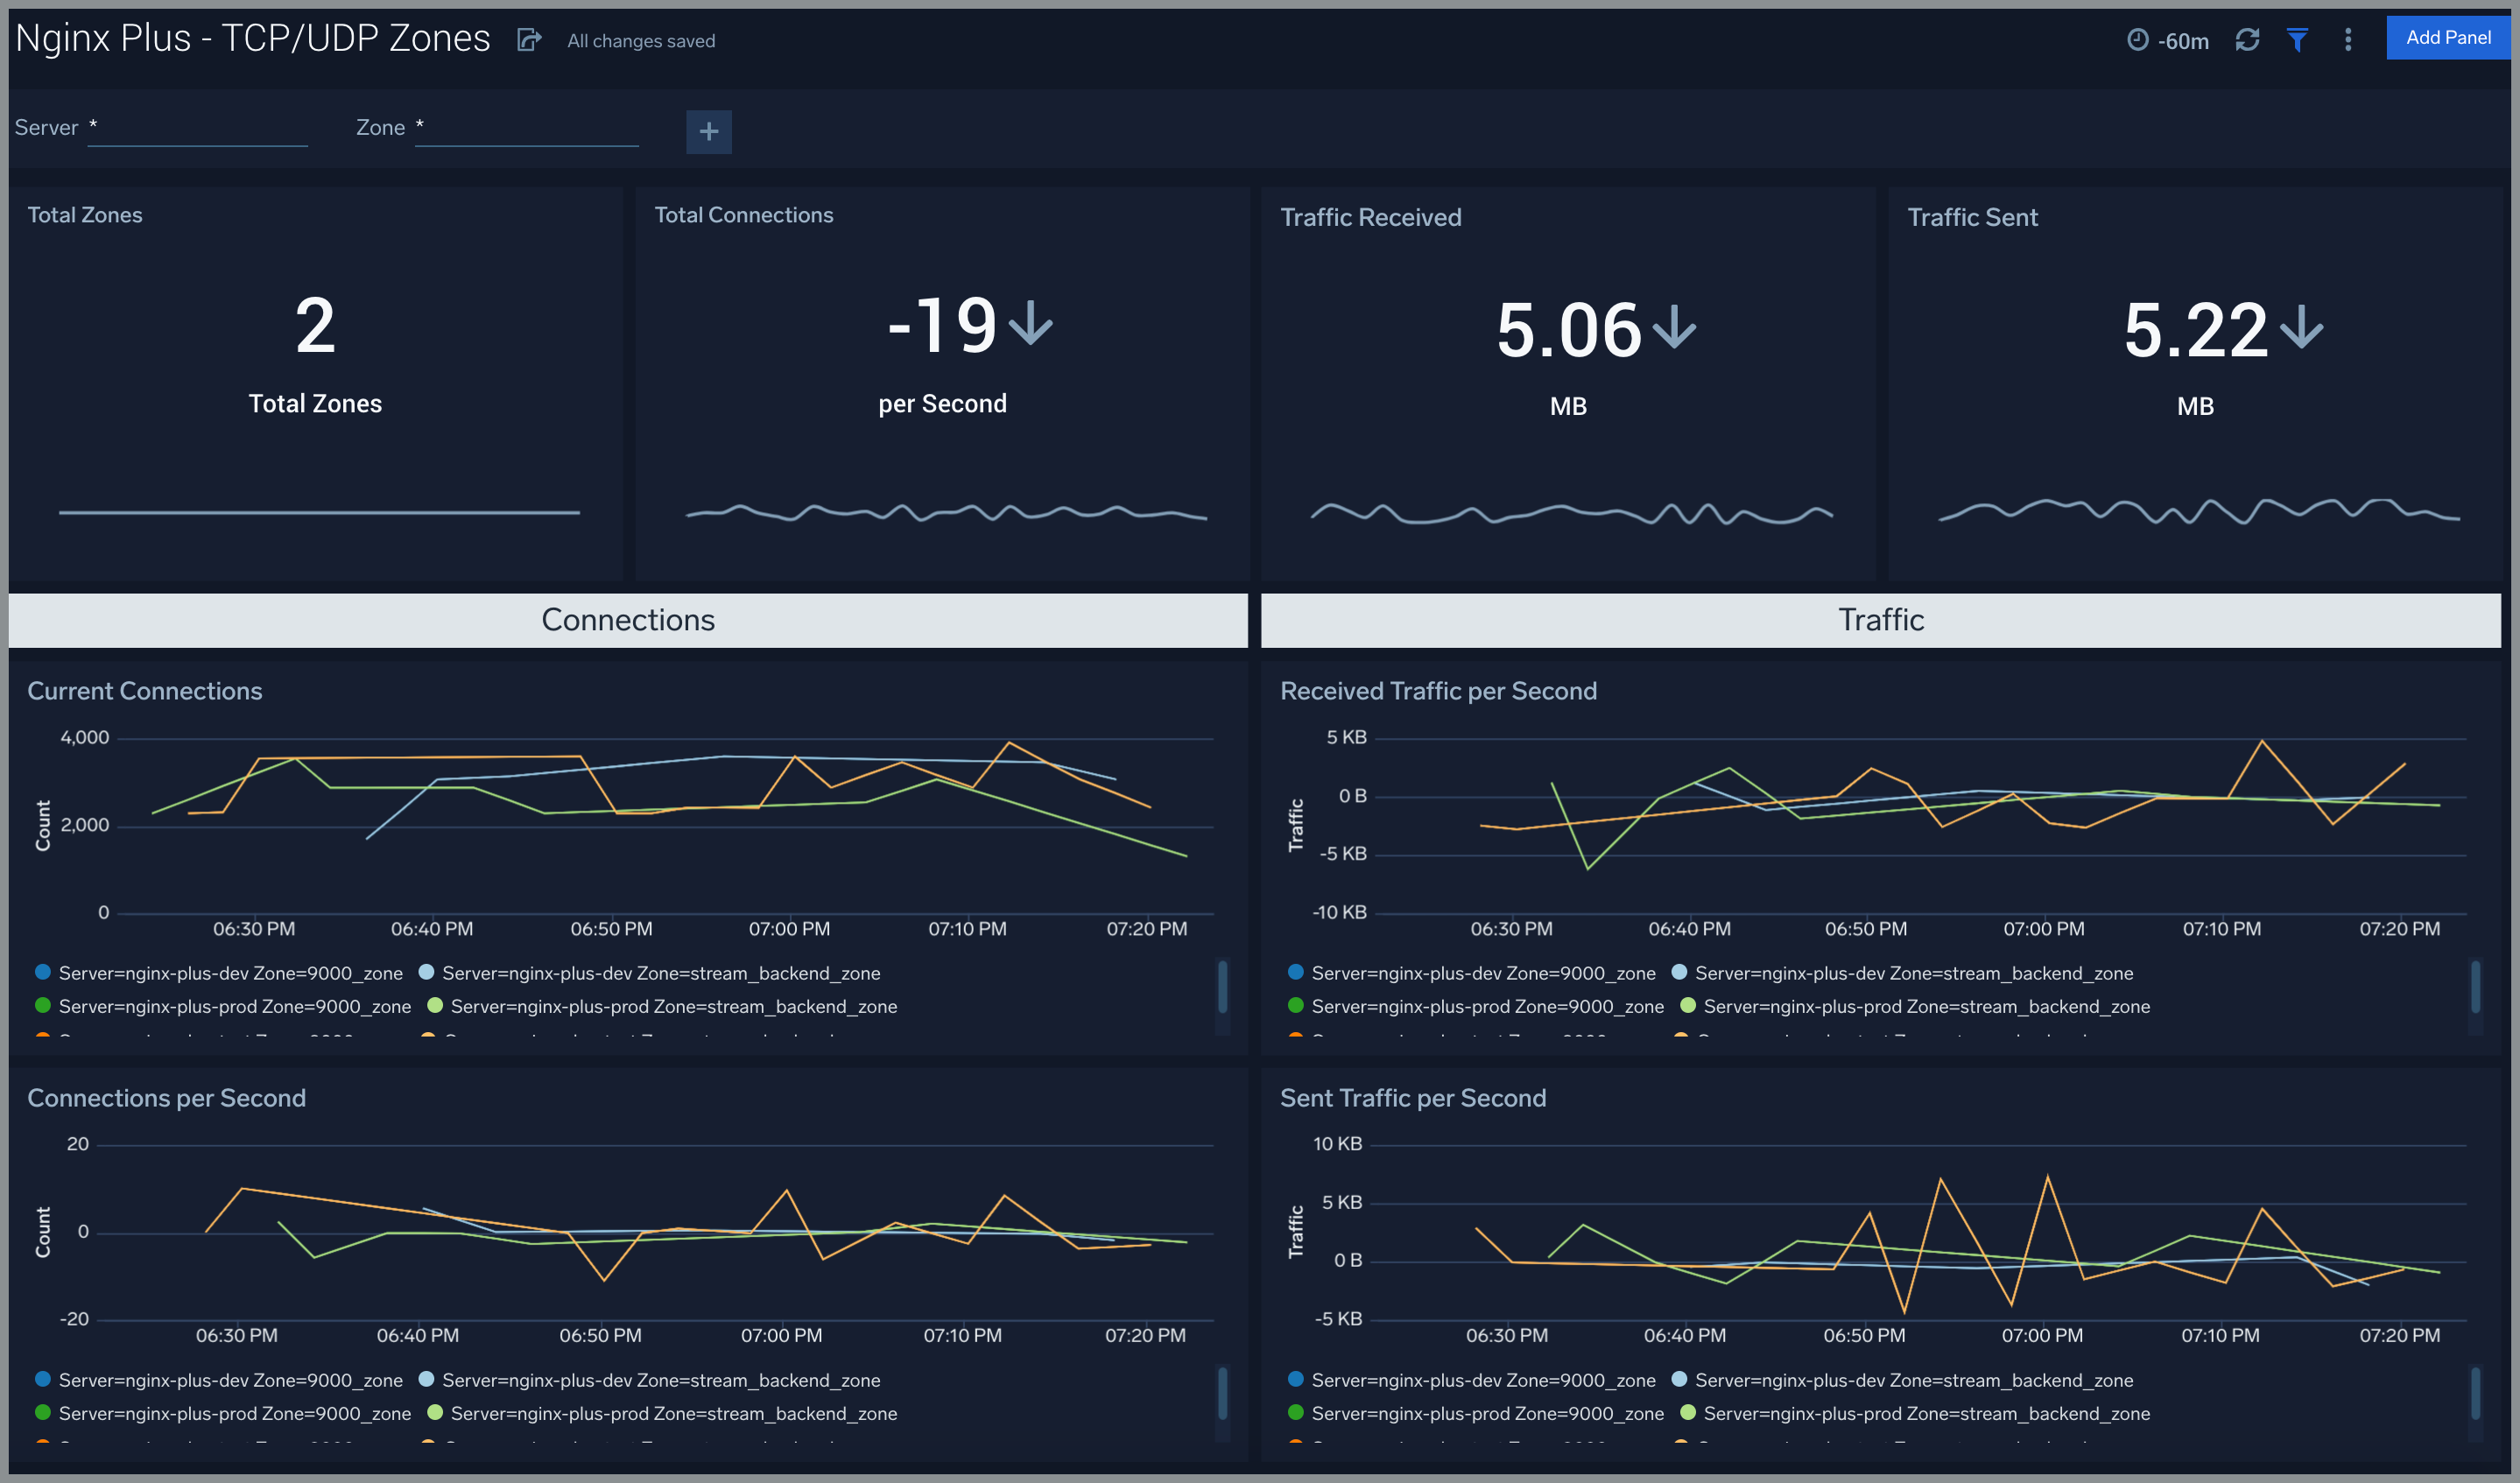
TCP/UDP Zones
The Nginx Plus - TCP/UDP Zones dashboard provides TCP and UDP status zones with charts for connection limiting.
Use this dashboard to:
- Gain information about TCP and UDP traffic: received and sent; speed, requires/responses amount, discarded traffic.
- Gain information about TCP and UDP error responses: percentage of responses by the server, percentage of each type of error response.
Create monitors for Nginx Plus app
From your App Catalog:
- From the Sumo Logic navigation, select App Catalog.
- In the Search Apps field, search for and then select your app.
- Make sure the app is installed.
- Navigate to What's Included tab and scroll down to the Monitors section.
- Click Create next to the pre-configured monitors. In the create monitors window, adjust the trigger conditions and notifications settings based on your requirements.
- Scroll down to Monitor Details.
- Under Location click on New Folder.
note
By default, monitor will be saved in the root folder. So to make the maintenance easier, create a new folder in the location of your choice.
- Enter Folder Name. Folder Description is optional.
tip
Using app version in the folder name will be helpful to determine the versioning for future updates.
- Click Create. Once the folder is created, click on Save.
Nginx Plus alerts
Here are the alerts available for Nginx Plus (click to expand).
| Name | Description | Alert Condition | Recover Condition |
|---|---|---|---|
| Nginx Plus - Dropped Connections | This alert fires when we detect dropped connections for a given Nginx Plus server. | > 0 | < = 0 |
| Nginx Plus - Critical Error Messages | This alert fires when we detect critical error messages for a given Nginx Plus server. | > 0 | < = 0 |
| Nginx Plus - Access from Highly Malicious Sources | This alert fires when a Nginx Plus is accessed from highly malicious IP addresses. | > 0 | < = 0 |
| Nginx Plus - High Client (HTTP 4xx) Error Rate | This alert fires when there are too many HTTP requests (>5%) with a response status of 4xx. | > 0 | < = 0 |
| Nginx Plus - High Server (HTTP 5xx) Error Rate | This alert fires when there are too many HTTP requests (>5%) with a response status of 5xx. | > 0 | < = 0 |