IIS 10 - OpenTelemetry Collector

The Internet Information Services (IIS) 10 app is a logs and metrics app designed to monitor the availability and performance of your IIS web servers. Preconfigured dashboards and searches provide insight into application pools, ASP.NET applications, requests, latency, visitor locations, visitor access types, traffic patterns, errors, web server operations, and access from known malicious sources.
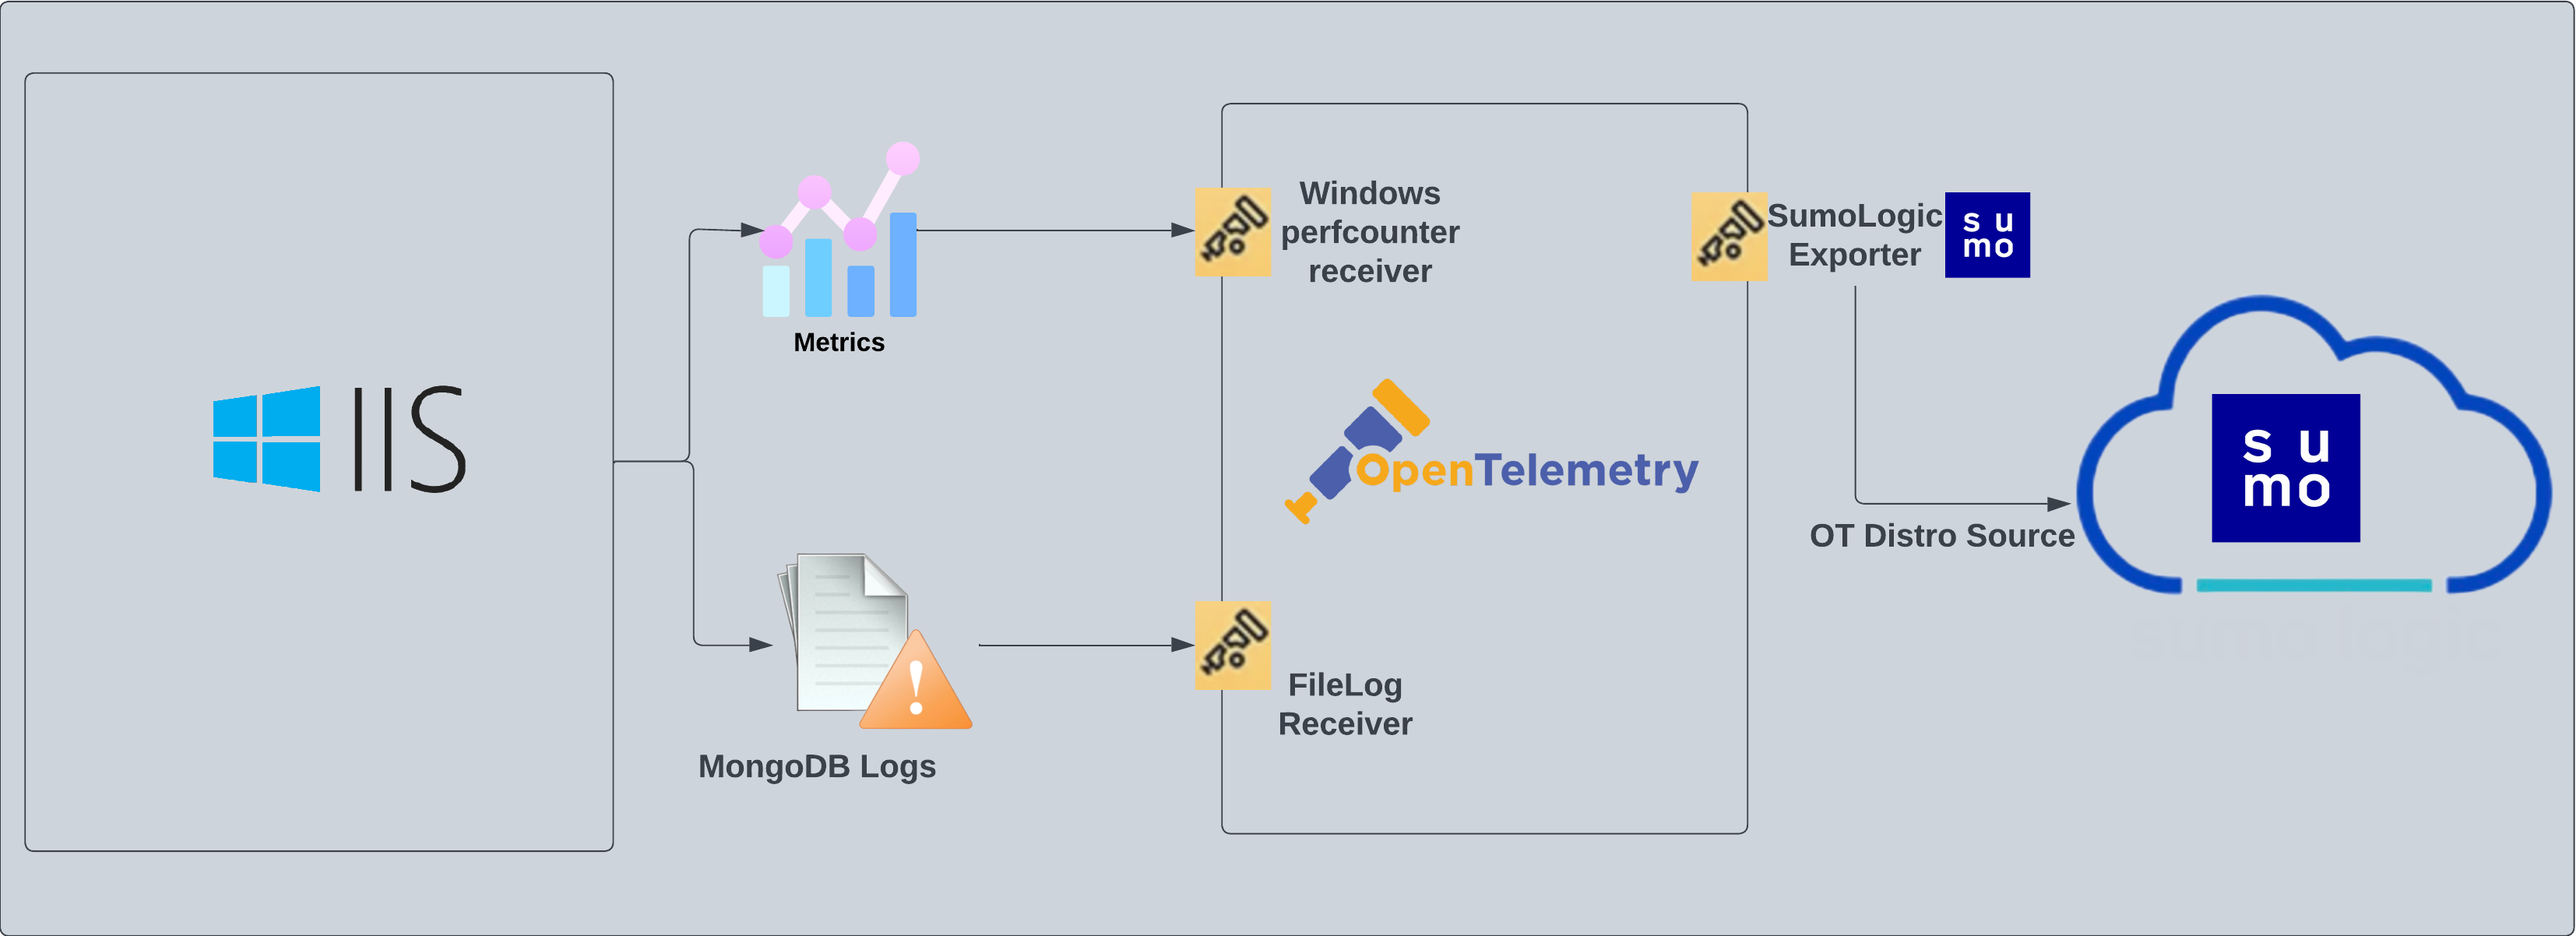
IIS logs are sent to Sumo Logic through OpenTelemetry filelog receiver.
IIS metrics are sent to Sumo Logic through OpenTelemetry through windowsperfcountersreceiver. This receiver captures the configured system, application, or custom performance counter data from the Windows registry using the PDH interface. It is based on the Telegraf Windows Performance Counters Input Plugin.
Fields creation in Sumo Logic for IIS
Following are the Fields which will be created as part of IIS App install if not already present.
sumo.datasource. Has fixed value of iis.deployment.environment. User configured. This is the deployment environment where the IIS cluster resides. For example:dev,prod, orqa.webengine.cluster.name. User configured. Enter a name to uniquely identify your IIS web server cluster. This web server cluster name will be shown in the Sumo Logic dashboards.webengine.system. Has fixed value of iis.webengine.node.name. Holds the value of the Fully Qualified Domain Name (FQDN) of the machine from which the OpenTelemetry collector is collecting logs and metrics.
Prerequisites
This section provides instructions for configuring log collection for IIS running on a non-Kubernetes environment for the Sumo Logic App for IIS. Sumo Logic supports the collection of logs from an IIS server in standalone environments. By default, IIS logs are stored in a log file.
This section covers the following default log formats for IIS 10 and IIS 8.5:
- IIS Access Logs (W3C format)
- HTTP Error Logs
Default log formats are used by IIS App. IIS allows you to choose which fields to log in IIS access logs. To understand the various fields and their significance see this link.
IIS Log files are generated as local files. For a standard Windows Server, the default log location is: %SystemDrive%\inetpub\logs\LogFiles. For example: c:\inetpub\logs\LogFiles\.
Within the folder, you will find subfolders for each site configured with IIS. The logs are stored in folders that follow a naming pattern like W3SVC1, W3SVC2, W3SVC3, etc. The number at the end of the folder name corresponds to your site ID. For example, W3SVC2 is for site ID 2.
- IIS Access Logs (W3C default format) Sumo Logic expects logs in W3C format with following fields:
#Fields: date time s-ip cs-method cs-uri-stem cs-uri-query s-port cs-username c-ip cs(User-Agent) cs(Referer) sc-status sc-substatus sc-win32-status time-taken- IIS allows you to choose fields to log in IIS access logs. For explanations on the various fields and their significance see this link.
- HTTP Error Logs Sumo Logic expects Error logs in following format:
#Fields: date time c-ip c-port s-ip s-port protocol_version verb cookedurl_query protocol_status siteId Reason_Phrase Queue_Name
For information on HTTP Error Logs configuration and various HTTP Error Log fields, see this link.
For Windows systems, log files which are collected should be accessible by the SYSTEM group. Use the following set of PowerShell commands if the SYSTEM group does not have access.
$NewAcl = Get-Acl -Path "<PATH_TO_LOG_FILE>"
# Set properties
$identity = "NT AUTHORITY\SYSTEM"
$fileSystemRights = "ReadAndExecute"
$type = "Allow"
# Create new rule
$fileSystemAccessRuleArgumentList = $identity, $fileSystemRights, $type
$fileSystemAccessRule = New-Object -TypeName System.Security.AccessControl.FileSystemAccessRule -ArgumentList $fileSystemAccessRuleArgumentList
# Apply new rule
$NewAcl.SetAccessRule($fileSystemAccessRule)
Set-Acl -Path "<PATH_TO_LOG_FILE>" -AclObject $NewAcl
Enable logging on your IIS Server
Perform the following task, if logging on your IIS Server is not already enabled. To enable logging on your IIS Server, do the following:
- Open IIS Manager.
- Select the site or server in the Connections pane, then double-click Logging.
note
Enhanced logging is only available for site-level logging. If you select the server in the Connections pane, then the Custom Fields section of the W3C Logging Fields dialog is disabled.
- In the Format field under Log File, select W3C and then click Select Fields. IIS App works on default fields selection.
- Select following fields, if not already selected. Sumo Logic expects these fields in IIS logs for the IIS App to work by default:
date time s-ip cs-method cs-uri-stem cs-uri-query s-port cs-username c-ip cs(User-Agent) cs(Referer) sc-status sc-substatus sc-win32-status time-taken
For more information about IIS log format and log configuration refer to this link.
Once the logs are configured to be written into a local file follow the below step to configure collection in Sumo.
Collection configuration and app installation
As part of data collection setup and app installation, you can select the App from App Catalog and click on Install App. Follow the steps below.
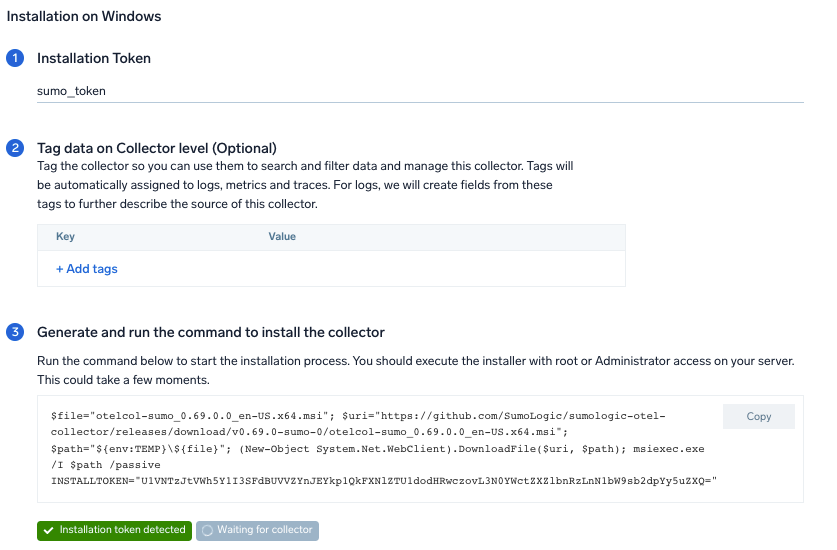
Step 1: Set up Collector
If you want to use an existing OpenTelemetry Collector, you can skip this step by selecting the Use an existing Collector option.
To create a new Collector:
- Select the Add a new Collector option.
- Select the platform where you want to install the Sumo Logic OpenTelemetry Collector.
This will generate a command that you can execute in the machine environment you need to monitor. Once executed, it will install the Sumo Logic OpenTelemetry Collector.
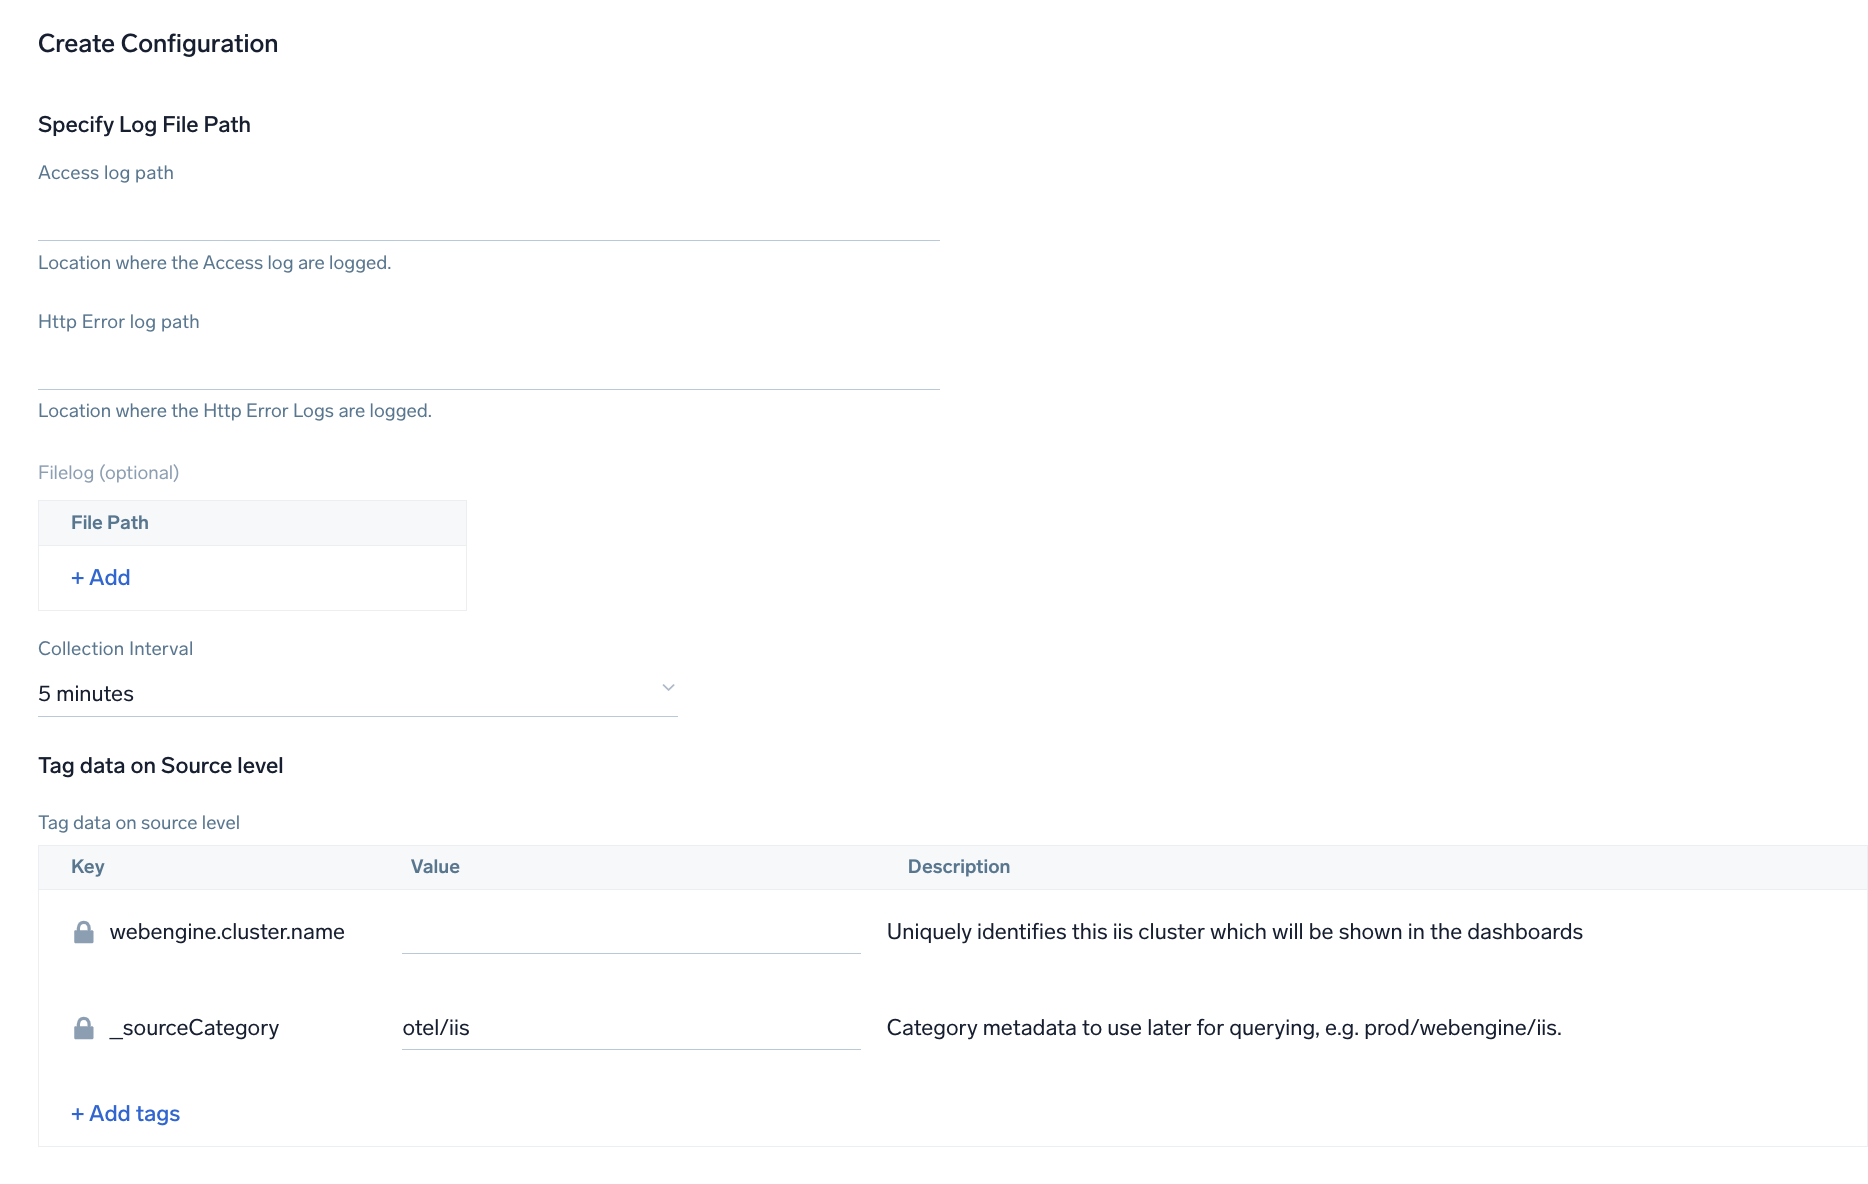
Step 2: Configure integration
In this step, you will configure the yaml required for IIS Collection.
The path of the log file configured to capture IIS logs is needed to be given here, refer to Prerequisites.
Metrics for IIS app are collected through windows perf counters. You can specify the Collection Interval to specify at what interval should the metrics be scrapped. You can add any custom fields which you want to tag along with the data ingested in Sumo Logic.
Click on the Download YAML File button to get the yaml file.
Step 3: Send logs to Sumo Logic
Once you have downloaded the YAML file as described in the previous step, follow the below steps based on your platform.
- Windows
- Chef
- Ansible
- Puppet
- Copy the yaml file to
C:\ProgramData\Sumo Logic\OpenTelemetry Collector\config\conf.dfolder in the machine which needs to be monitored. - Restart the collector using:
Restart-Service -Name OtelcolSumo
- Copy the yaml file into your Chef cookbook files directory
files/<downloaded_yaml_file>. - Use a Chef file resource in a recipe to manage it.
cookbook_file '/etc/otelcol-sumo/conf.d/<downloaded_yaml_file>' do mode 0644 notifies :restart, 'service[otelcol-sumo]', :delayed end - Add the recipe to your collector setup to start collecting the data. Every team typically has their established way of applying the Chef recipe. The resulting Chef recipe should look something like:
cookbook_file '/etc/otelcol-sumo/conf.d/<downloaded_yaml_file>' do
mode 0644
notifies :restart, 'service[otelcol-sumo]', :delayed
end
- Place the file into your Ansible playbook files directory.
- Run the Ansible playbook.
ansible-playbook -i inventory install_sumologic_otel_collector.yaml
-e '{"installation_token": "<YOUR_TOKEN>", "collector_tags": {<YOUR_TAGS>}, "src_config_path": "files/conf.d"}'
- Place the file into your Puppet module files directory
modules/install_otel_collector/files/<downloaded_yaml>. - Use a Puppet file resource to manage it.
file { '/etc/otelcol-sumo/conf.d/<downloaded_yaml_file>':
    ensure => present,
    source => 'puppet:///modules/install_otel_collector/<downloaded_yaml_file>',
    mode => '0644',
    notify => Service[otelcol-sumo],
} - Apply the Puppet manifest. Every team typically has their established way of applying the Puppet manifest. The resulting Puppet manifest should look something like:
node 'default' {
    class { 'install_otel_collector'
      installation_token => '<YOUR_TOKEN>',
      collector_tags => { <YOUR_TAGS> },
    }

    service { 'otelcol-sumo':
      provider => 'systemd',
      ensure => running,
      enable => true,
      require => Class['install_otel_collector'],
    }

    file { '/etc/otelcol-sumo/conf.d/<downloaded_yaml_file>':
      ensure => present,
      source => 'puppet:///modules/install_otel_collector/<downloaded_yaml_file>',
      mode => '0644',
      notify => Service[otelcol-sumo],
    }
  }
After successfully executing the above command, Sumo Logic will start receiving data from your host machine.
Click Next. This will install the app (dashboards and monitors) to your Sumo Logic Org.
Dashboard panels will start to fill automatically. It's important to note that each panel fills with data matching the time range query and received since the panel was created. Results won't immediately be available, but within 20 minutes, you'll see full graphs and maps.
A warning message will be printed if any one of the specified performance counters cannot be loaded on startup. The application will not fail fast with this warning. It is expected that some performance counters may not exist on some systems due to different OS configuration.
Sample log messages
2023-01-13 10:56:55 10.0.0.111 GET / ProgramID=236 443 - 207.235.176.5 Mozilla/5.0+(compatible;+Nimbostratus-Bot/v1.3.2;+http://cloudsystemnetworks.com) http://www.google.com/url?sa=t&rct=j&q=anomaly%20detection&source=web&cd=4 304 11 1236 70
Sample metrics
{
    "queryId": "A",
    "_source": "iis/windowsperfcounters",
    "_metricId": "UHWuWs-fdl2-SSVRh6Yfww",
    "webengine.node.name": "EC2AMAZ-ENUFFVK",
    "_sourceName": "iis",
    "host.group": "anemawiniis",
    "os.type": "windows",
    "webengine.cluster": "test",
    "sumo.datasource": "iis",
    "instance": "*",
    "_sourceCategory": "OTC Metric Input",
    "deployment.environment": "anemawiniis",
    "_contentType": "win_password",
    "host.name": "EC2AMAZ-ENUFFVK",
    "metric": "win.aspnet.Request.Execution.Time",
    "_collectorId": "00005AF310C7F19E",
    "_sourceId": "0000000000000000",
    "webengine.system": "iis",
    "_sourceHost": "EC2AMAZ-ENUFFVK",
    "_collector": "EC2AMAZ-ENUFFVK",
    "max": 0,
    "min": 0,
    "avg": 0,
    "sum": 0,
    "latest": 0,
    "count": 1
}
Sample log query
This sample Query is from the IIS - Overview > Visitor Location panel.
" %\"sumo.datasource\"=iis %\"webengine.cluster.name\"=* | json \"log\" as _rawlog nodrop \n| if (isEmpty(_rawlog), _raw, _rawlog) as iis_log_message\n| parse regex field=iis_log_message \"(?<server_ip>\\d{1,3}\\.\\d{1,3}\\.\\d{1,3}\\.\\d{1,3}) (?<method>\\S+?) (?<cs_uri_stem>\\S+?) (?<cs_uri_query>\\S+?) (?<s_port>\\S+?) (?<cs_username>\\S+?) (?<c_ip>\\S+?) (?<cs_User_Agent>\\S+?) (?<cs_referer>\\S+?) (?<sc_status>\\S+?) (?<sc_substatus>\\S+?) (?<sc_win32_status>\\S+?) (?<time_taken>\\S+?)$\"\n| count by c_ip\n| lookup latitude, longitude, country_name from geo://location on ip=c_ip\n| where !isNull(latitude)"
Sample metric query
sumo.datasource=iis deployment.environment=* webengine.cluster.name=* webengine.node.name=* instance=* metric=win.app.pool.was.Current.Application.Pool.State | filter latest = 3 | count
Viewing IIS dashboards
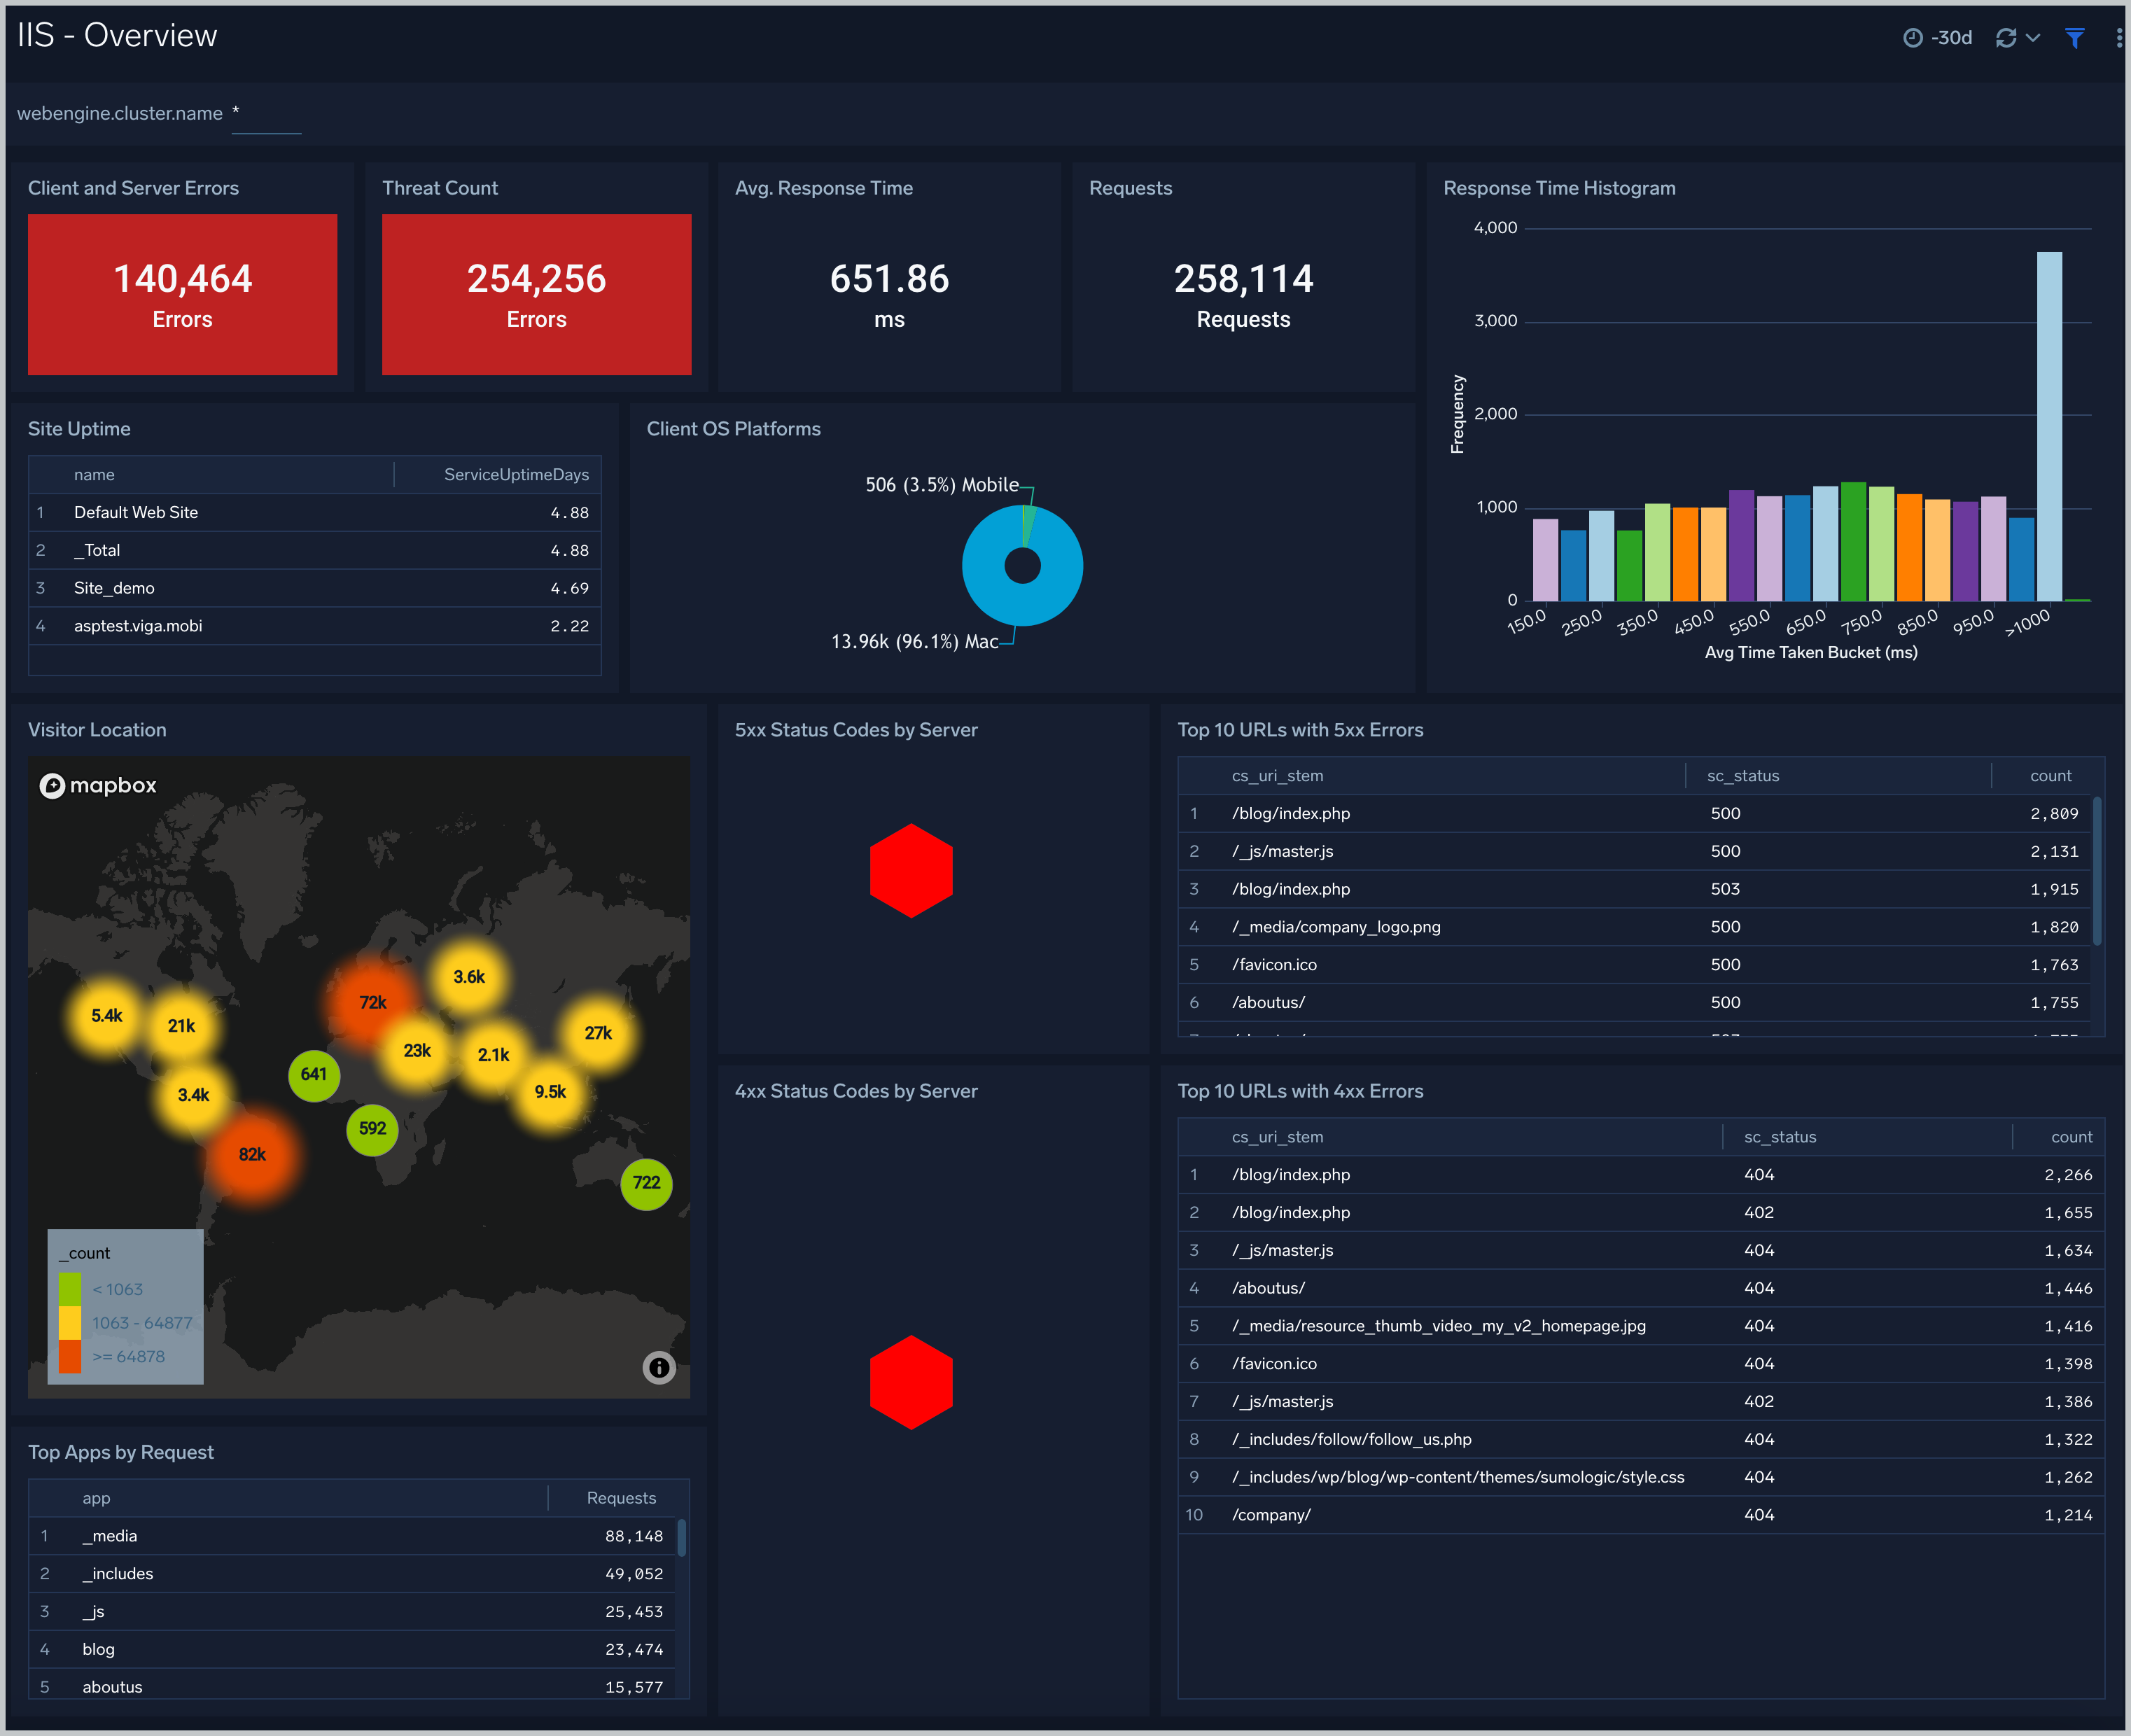
Overview
The IIS - Overview dashboard provides a high-level view of the performance and integrity of your Microsoft Internet Information Services (IIS) infrastructure. Dashboard panels display visual graphs and detailed information on IIS versions, platforms, and log formats. Panels also show visitor geographic locations, top app requests. OS platforms, response status, response times, and client and server errors.
Use this dashboard to:
- Get a high-level overview of sites, requests, connect, cache, data received and sent, queue, application pool, client location, client platforms, error and threats identified.
- Drill Down to specific use cases by clicking on specific panels of interest.
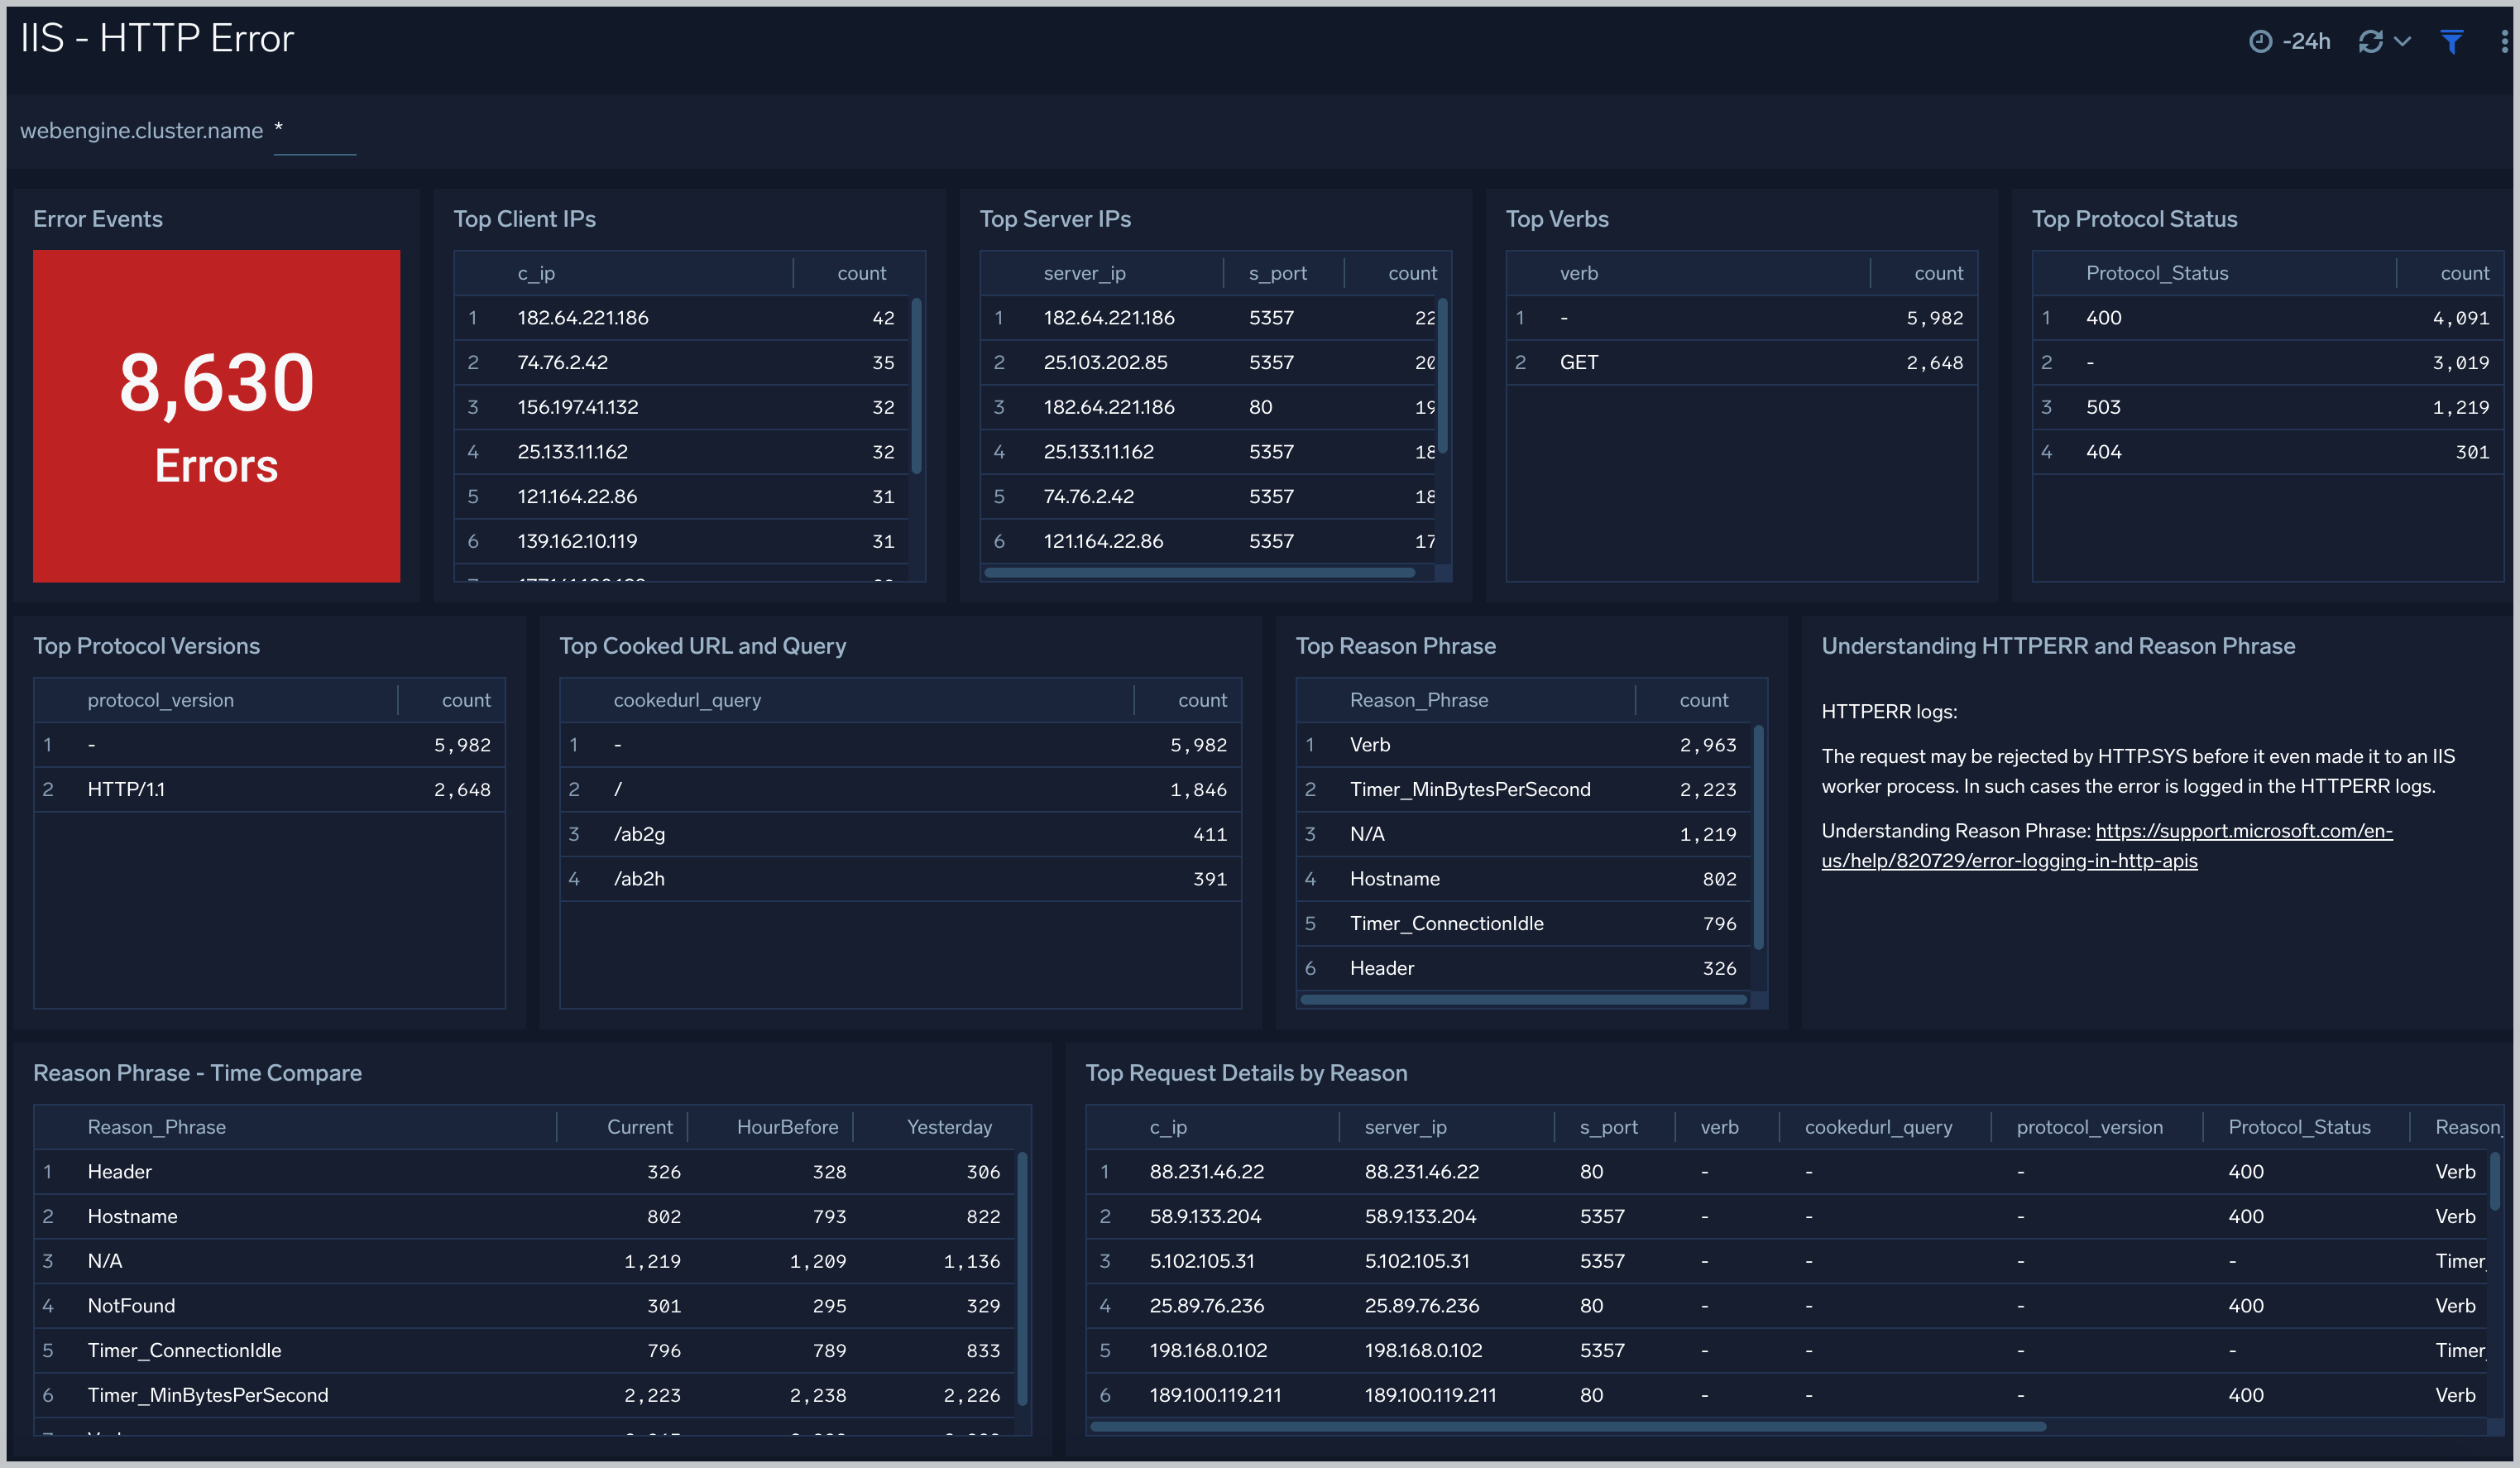
HTTP Error
The IIS - HTTP Error dashboard provides detailed information on IIS error logging in HTTP. Dashboard panels show details on error events, top client and server IP addresses, top protocol versions and protocol status. Panels also show information on top reason phrases and verbs associated with HTTP errors, as well as top request details by reason.
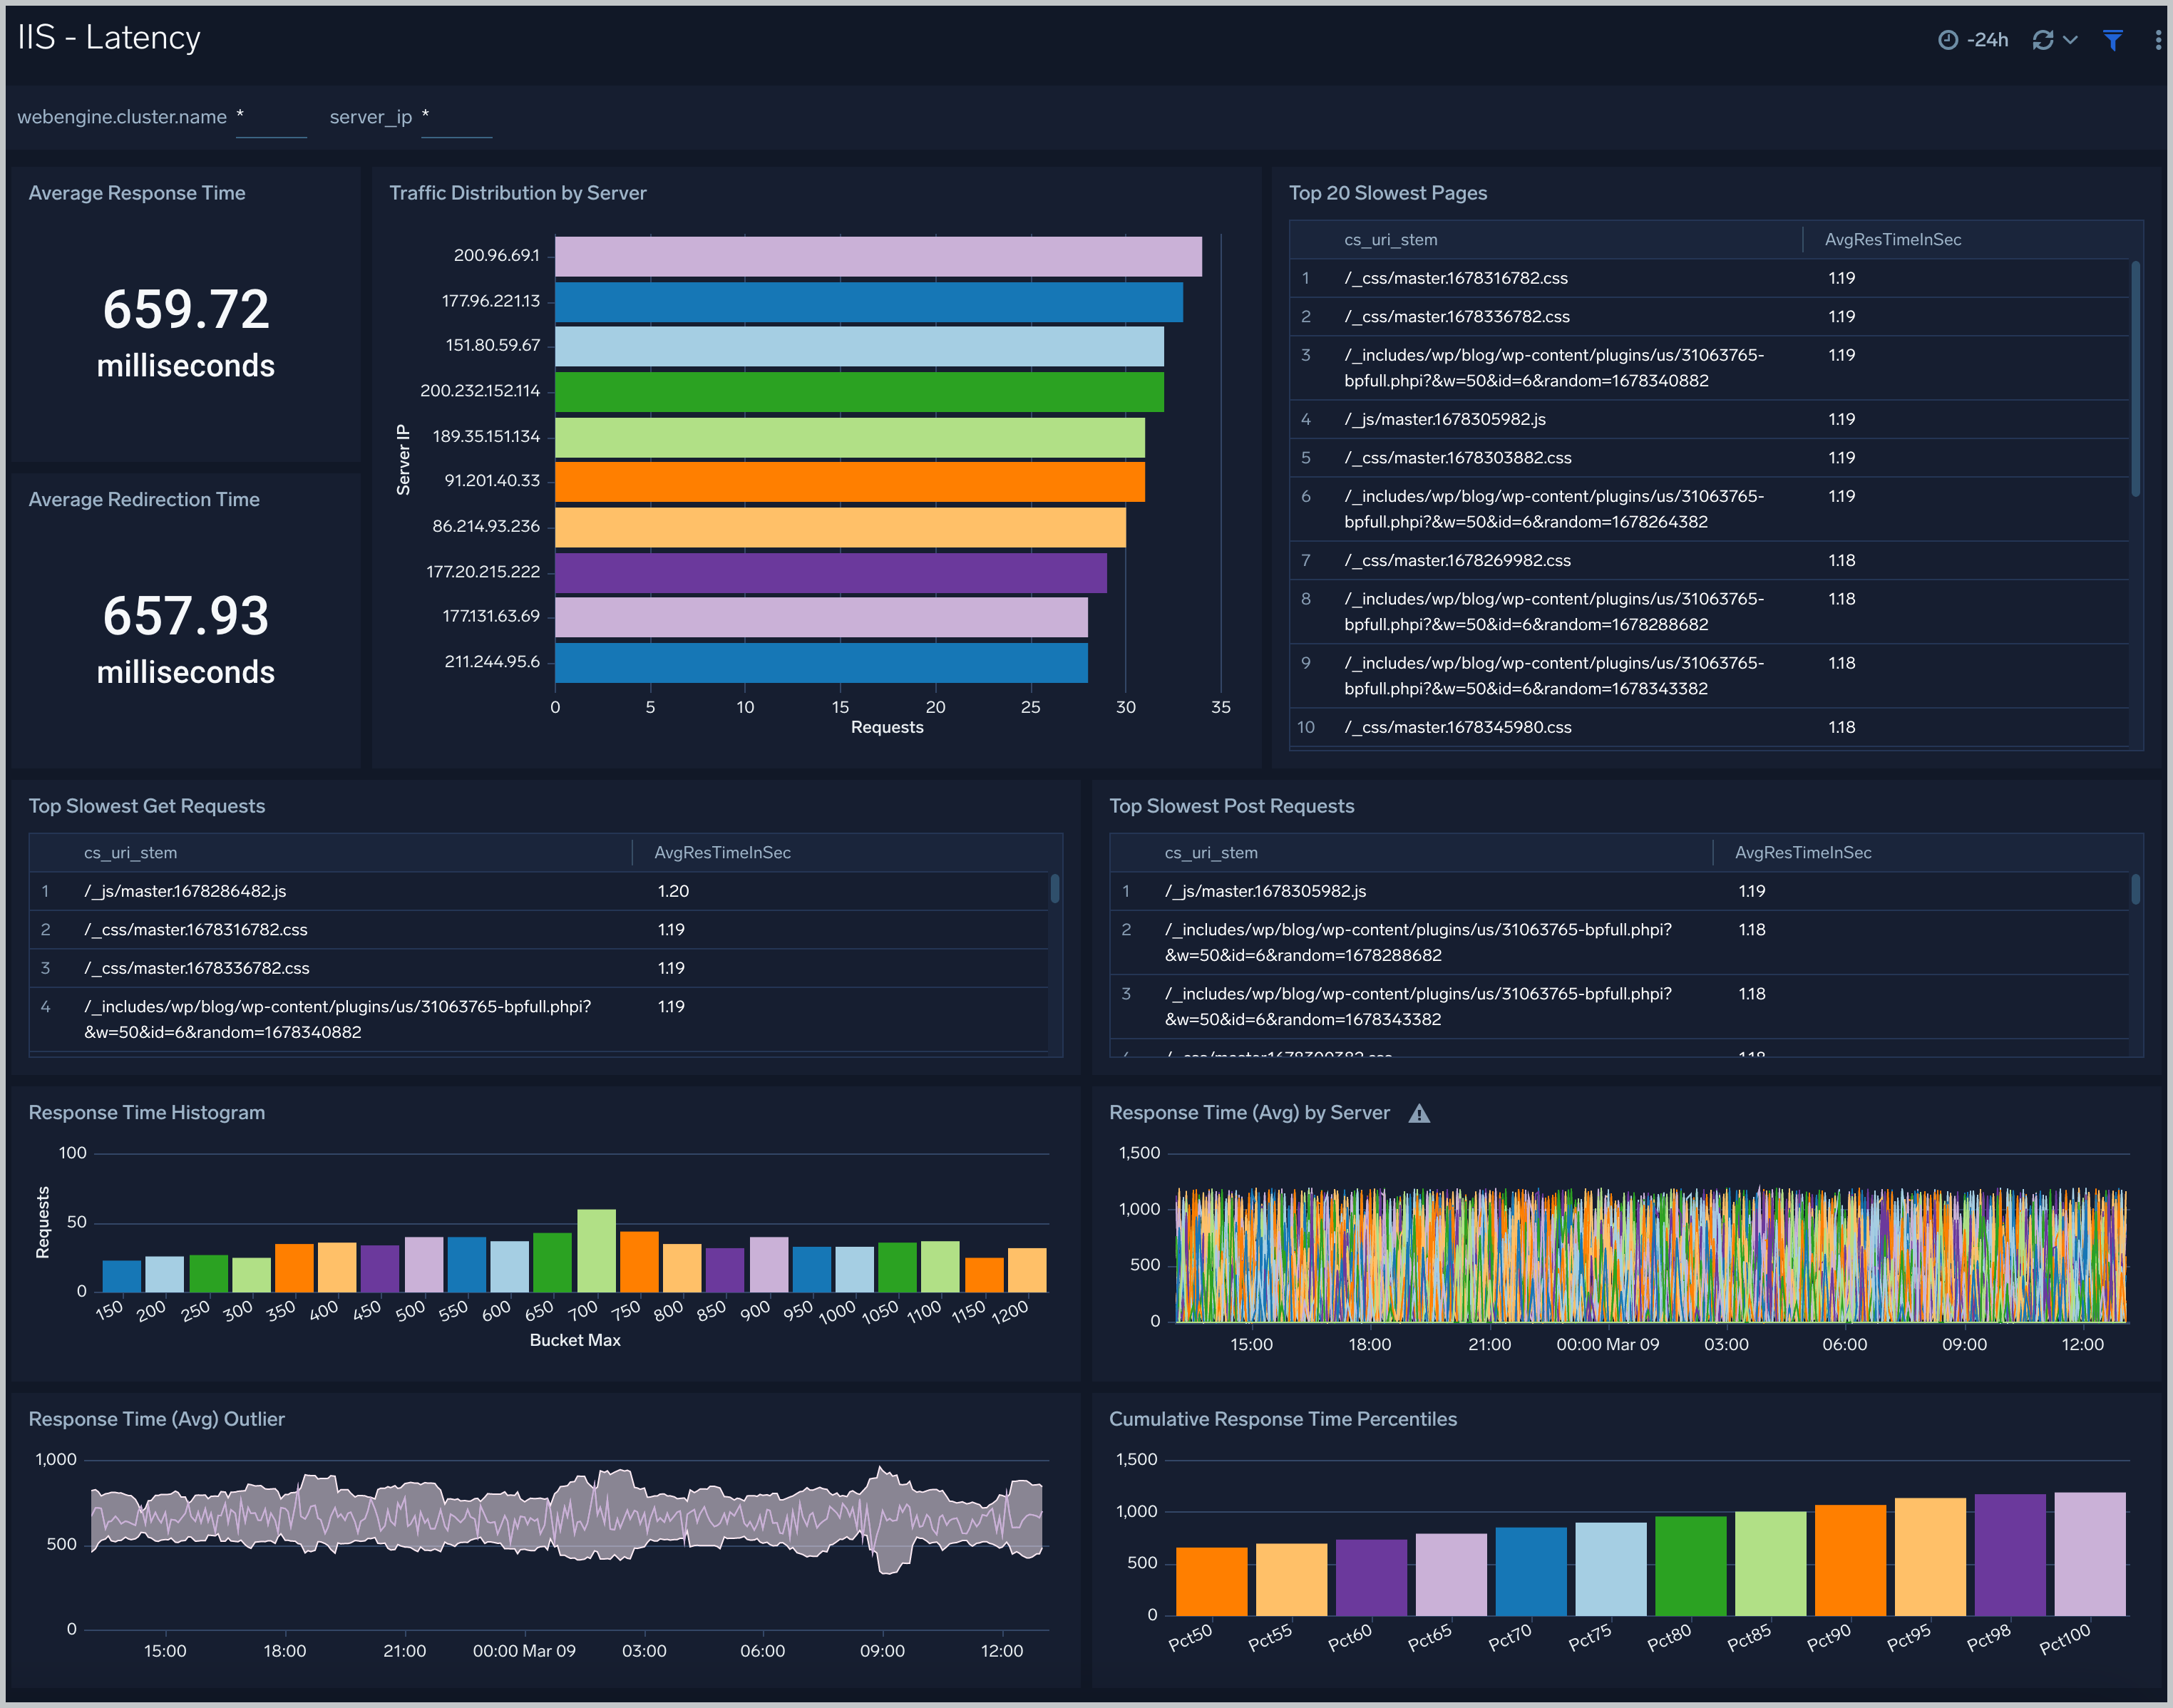
Latency
The IIS - Latency dashboard provides visual graphs and detailed information for the integrity of performance throughout your IIS infrastructure. Dashboard panels show response time averages, cumulative percentiles, histograms, and outliers. Panels also show details for traffic distribution, slowest pages, slowest GET and POST requests, and average redirection time.
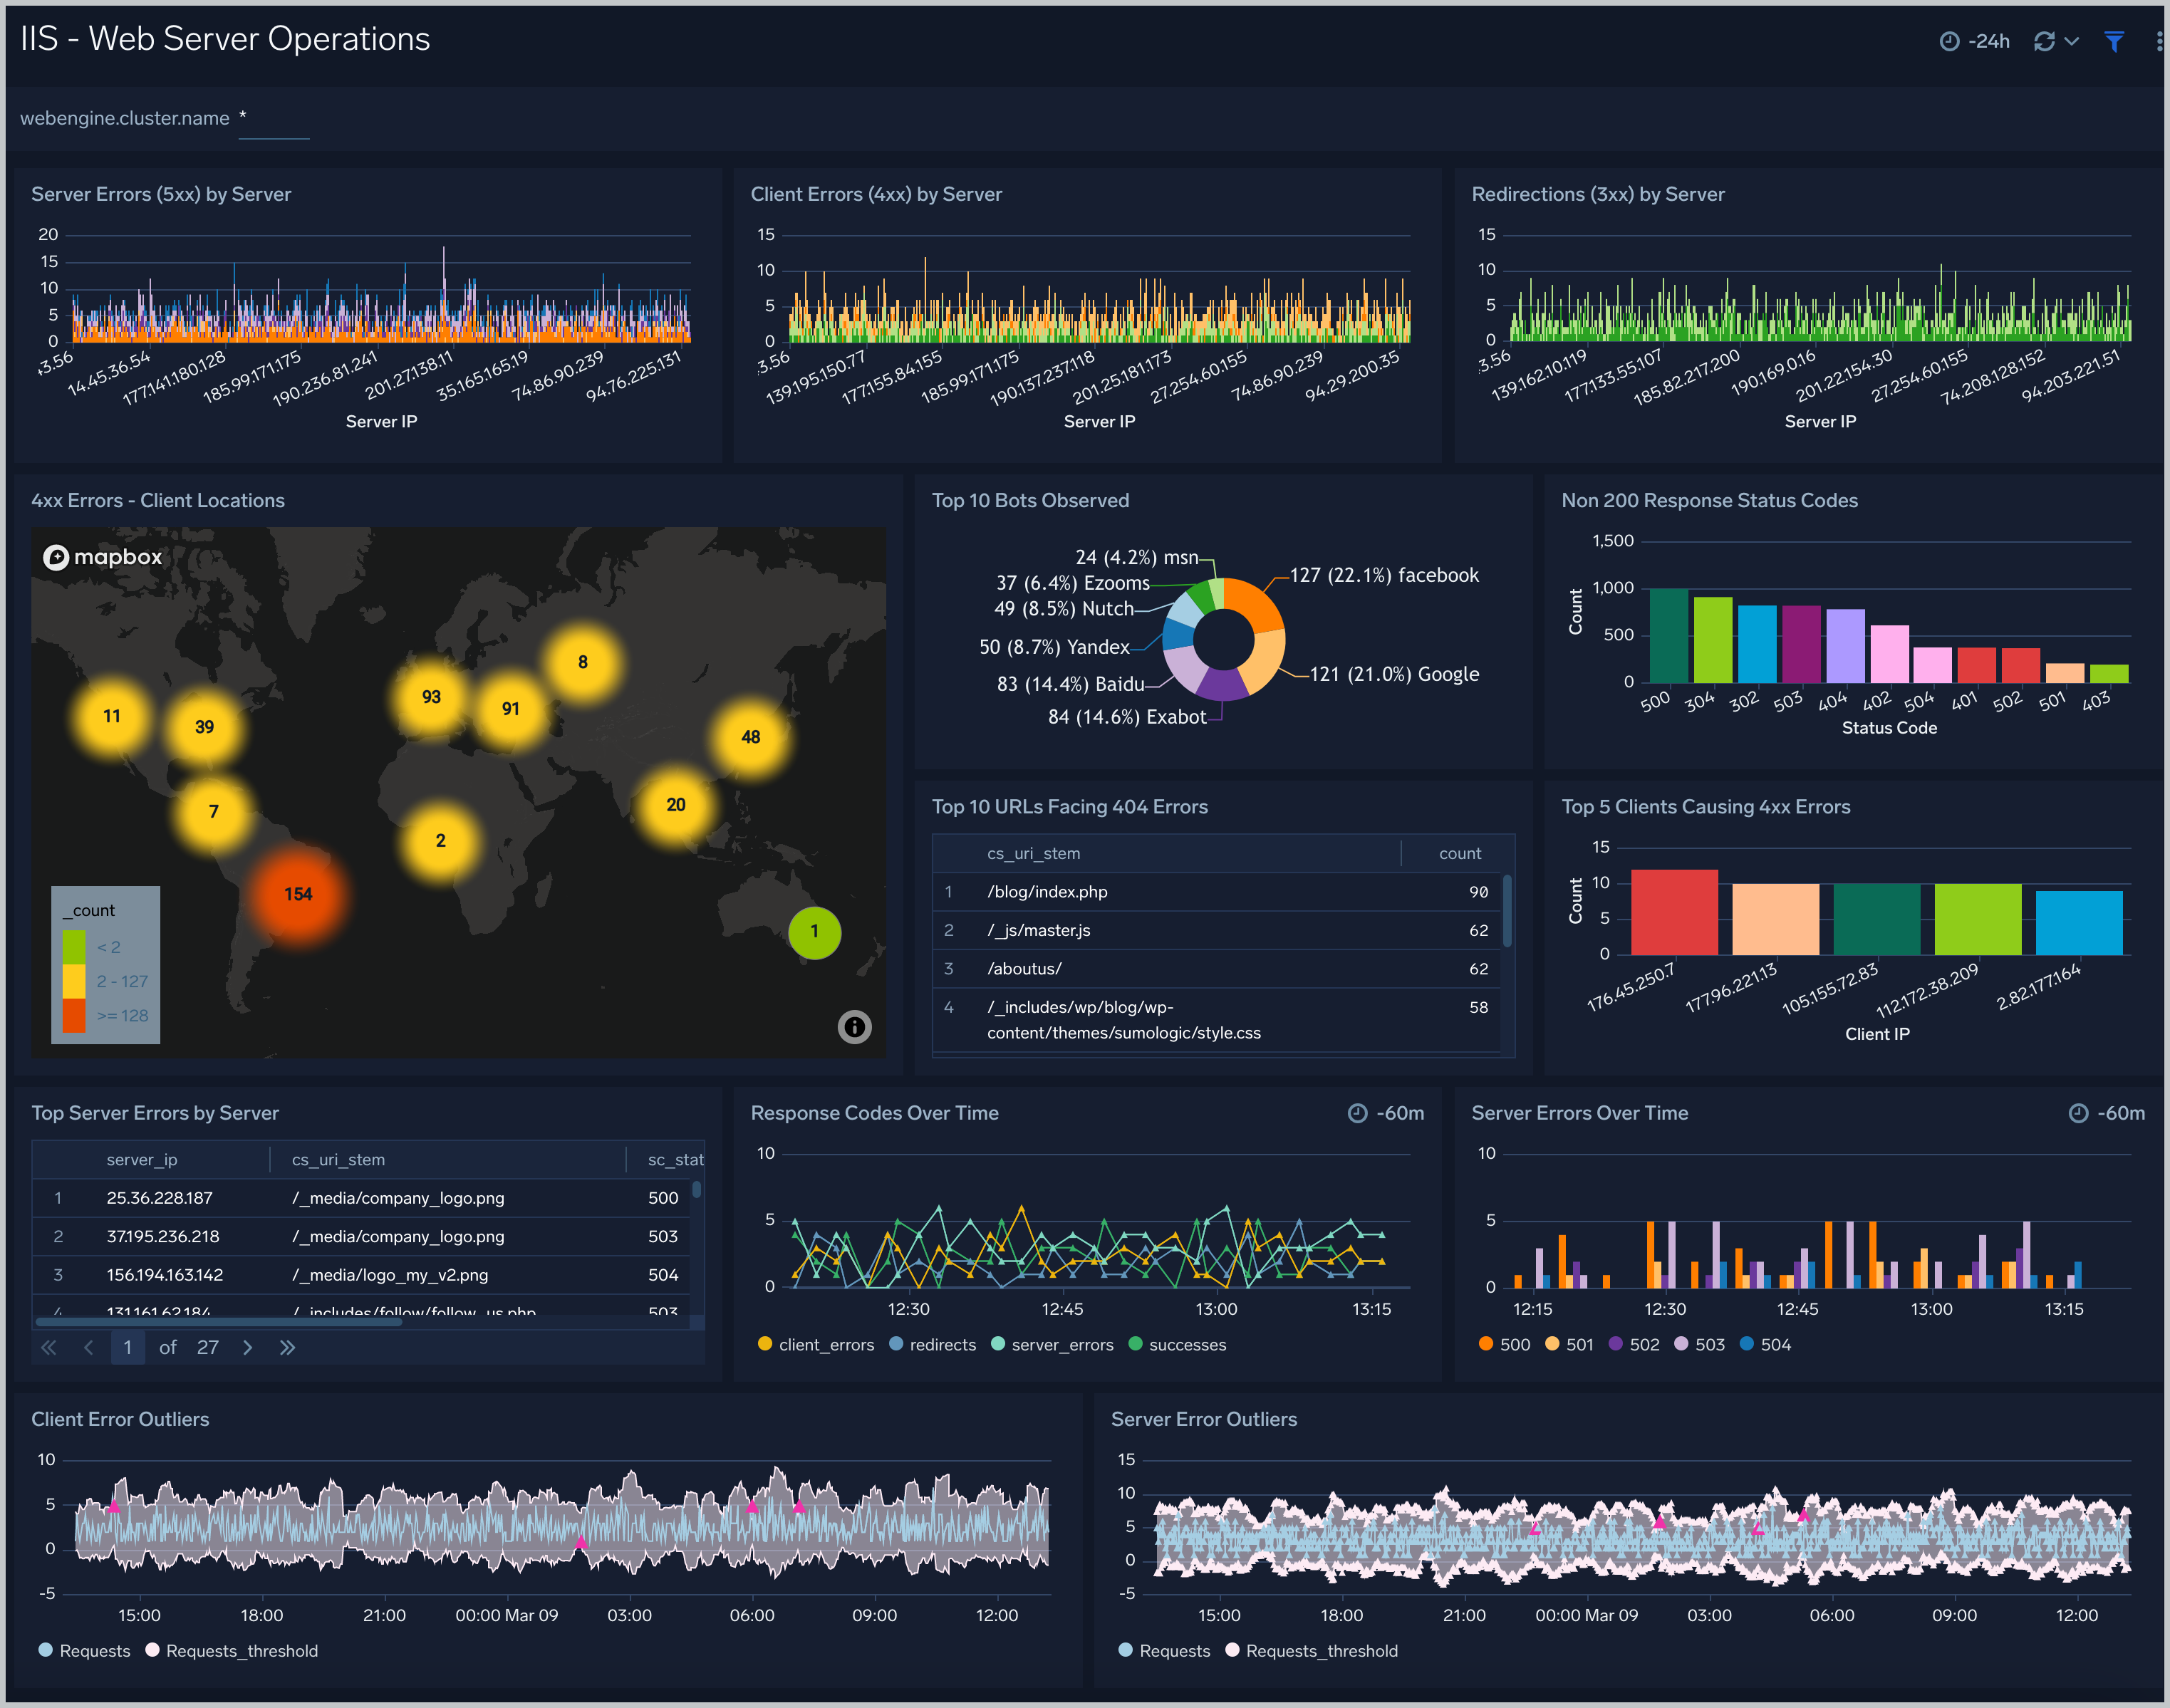
Web Server Operations
The IIS - Web Server Operations dashboard provides visual graphs and detailed information on server operation errors in your IIS infrastructure. Dashboard panels show server errors by the server, server errors over time, server error outliers, and redirections by the server. Panels also show client errors by the server, client error outliers, top URLs with 404 errors, and response codes over time.
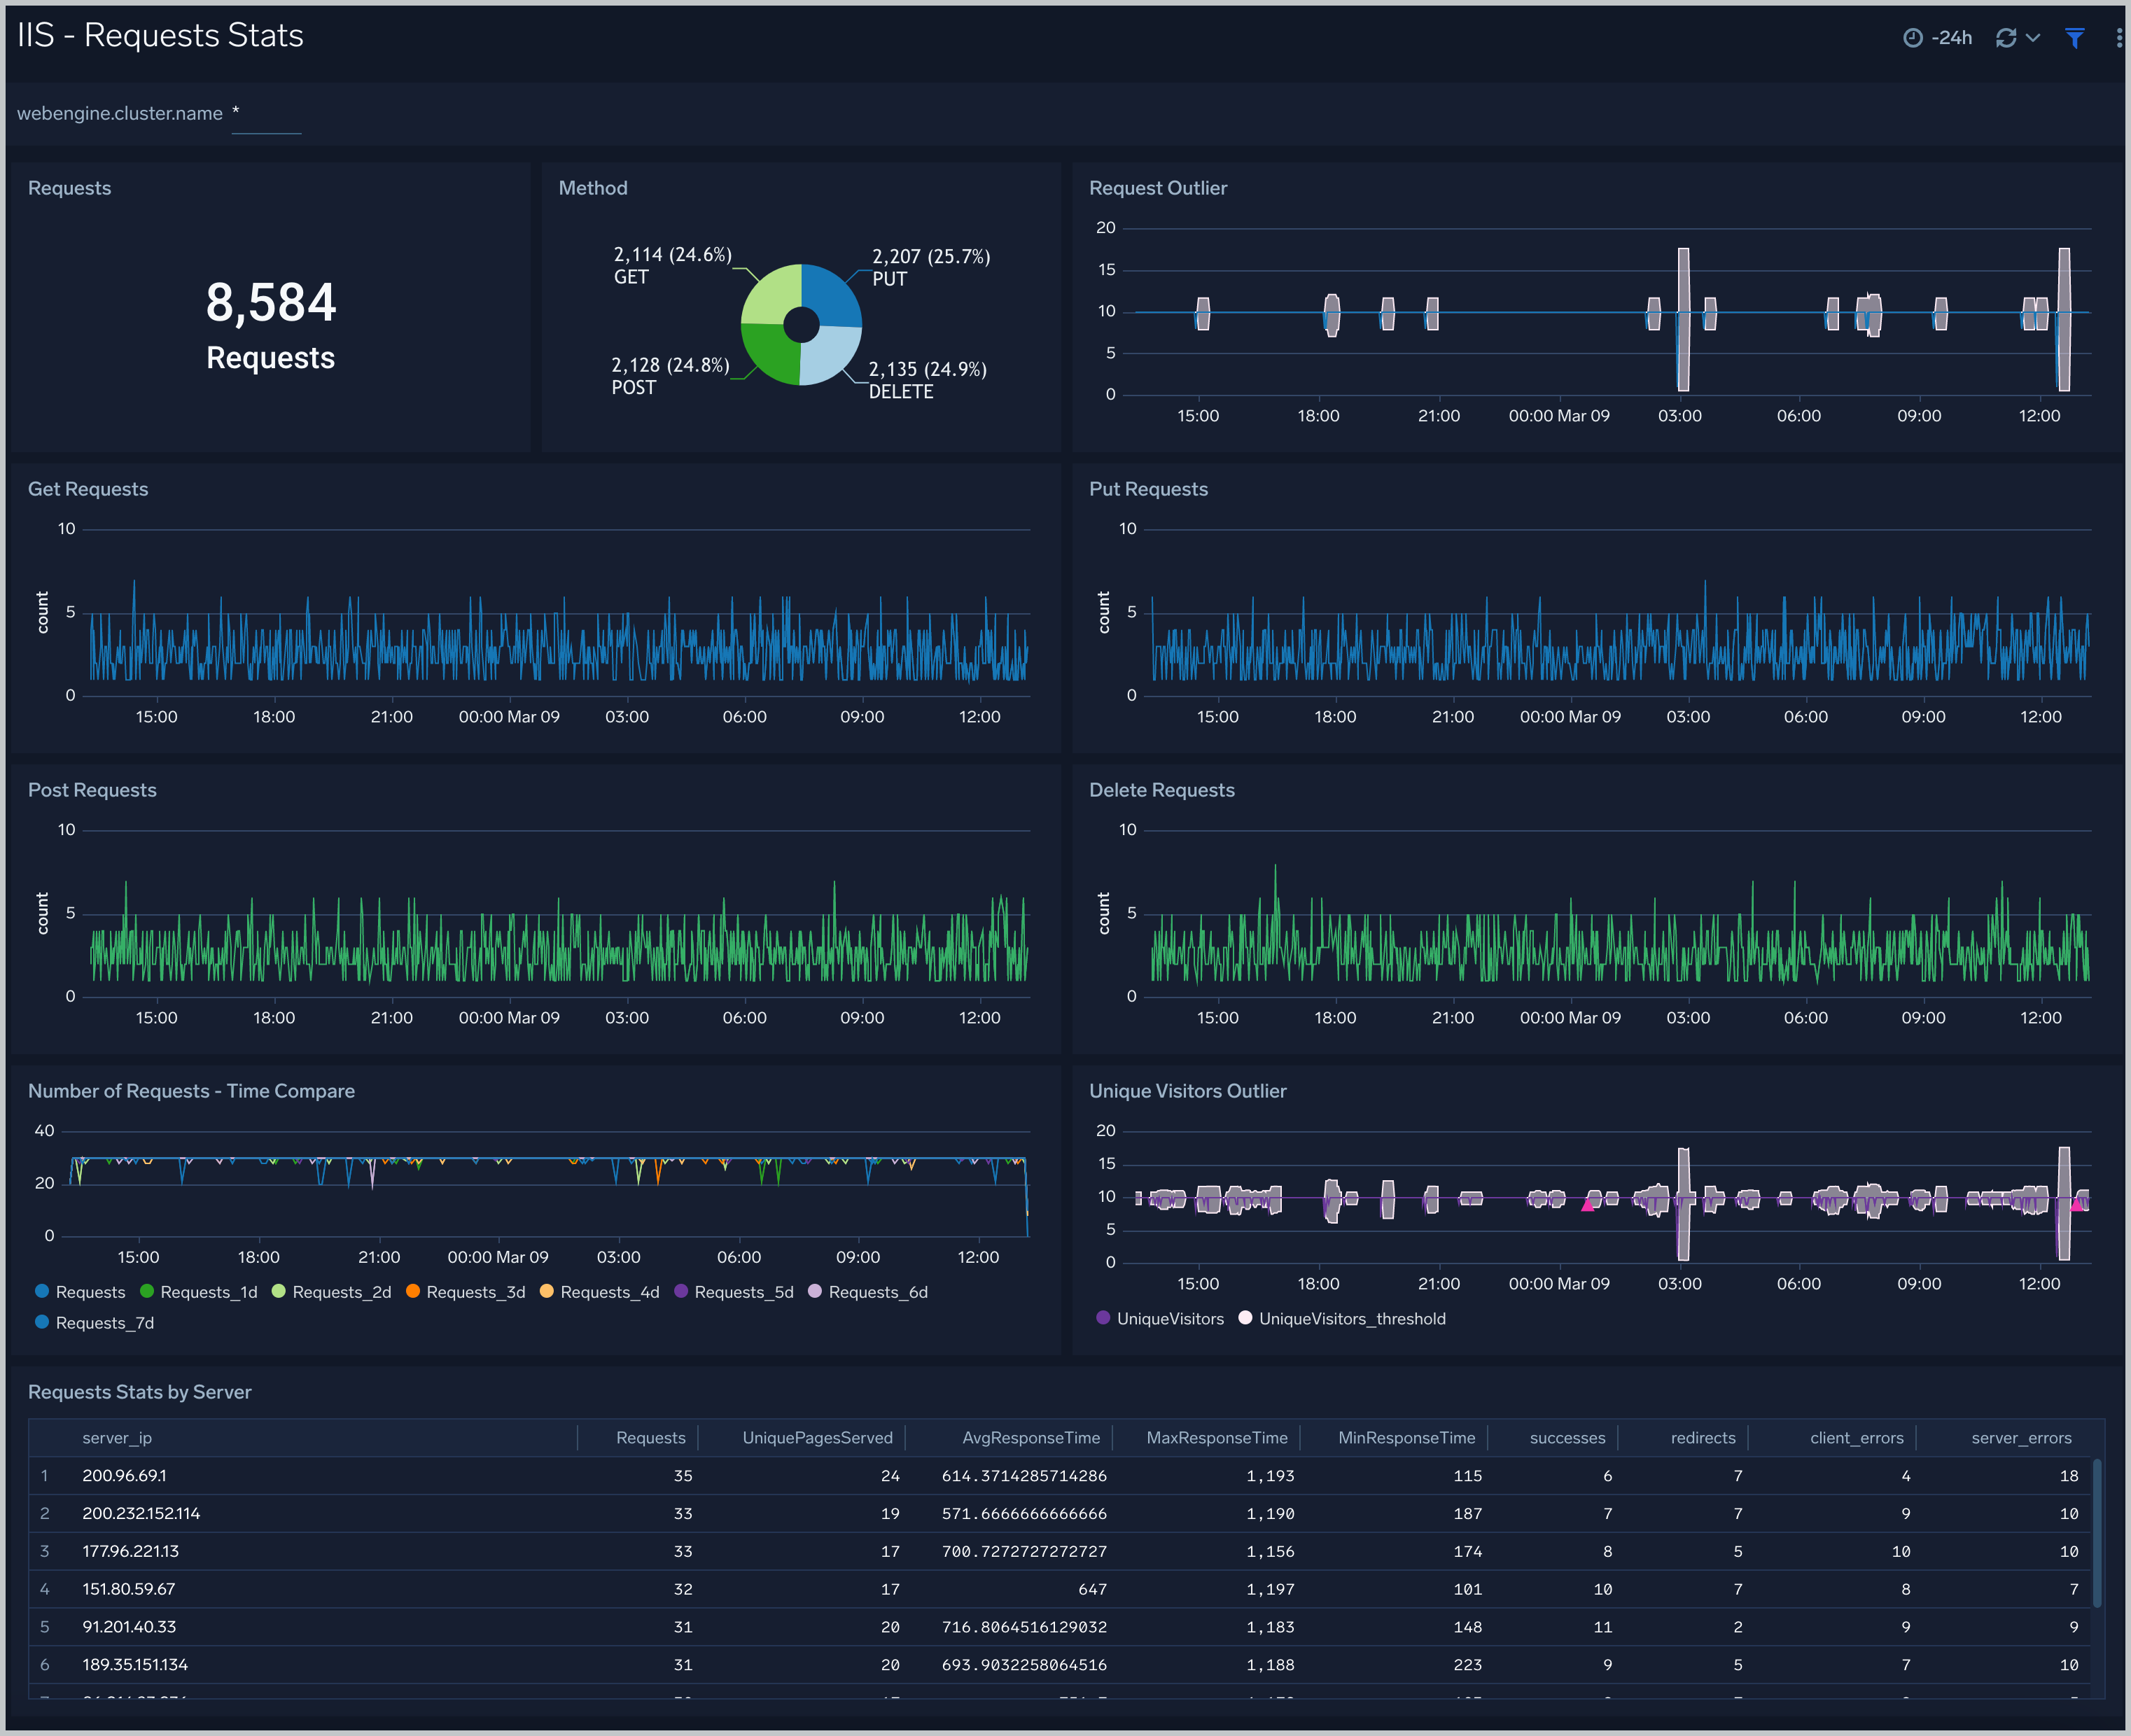
Requests Stats
The IIS - Requests Stats dashboard provides visual graphs and statistics for requests made throughout your IIS infrastructure. Dashboard panels show the number of requests, request methods, request outliers, and requests by server. Panels also show details on GET, PUT, POST, and DELETE requests, as well as requests time, compare and unique visitors outlier.
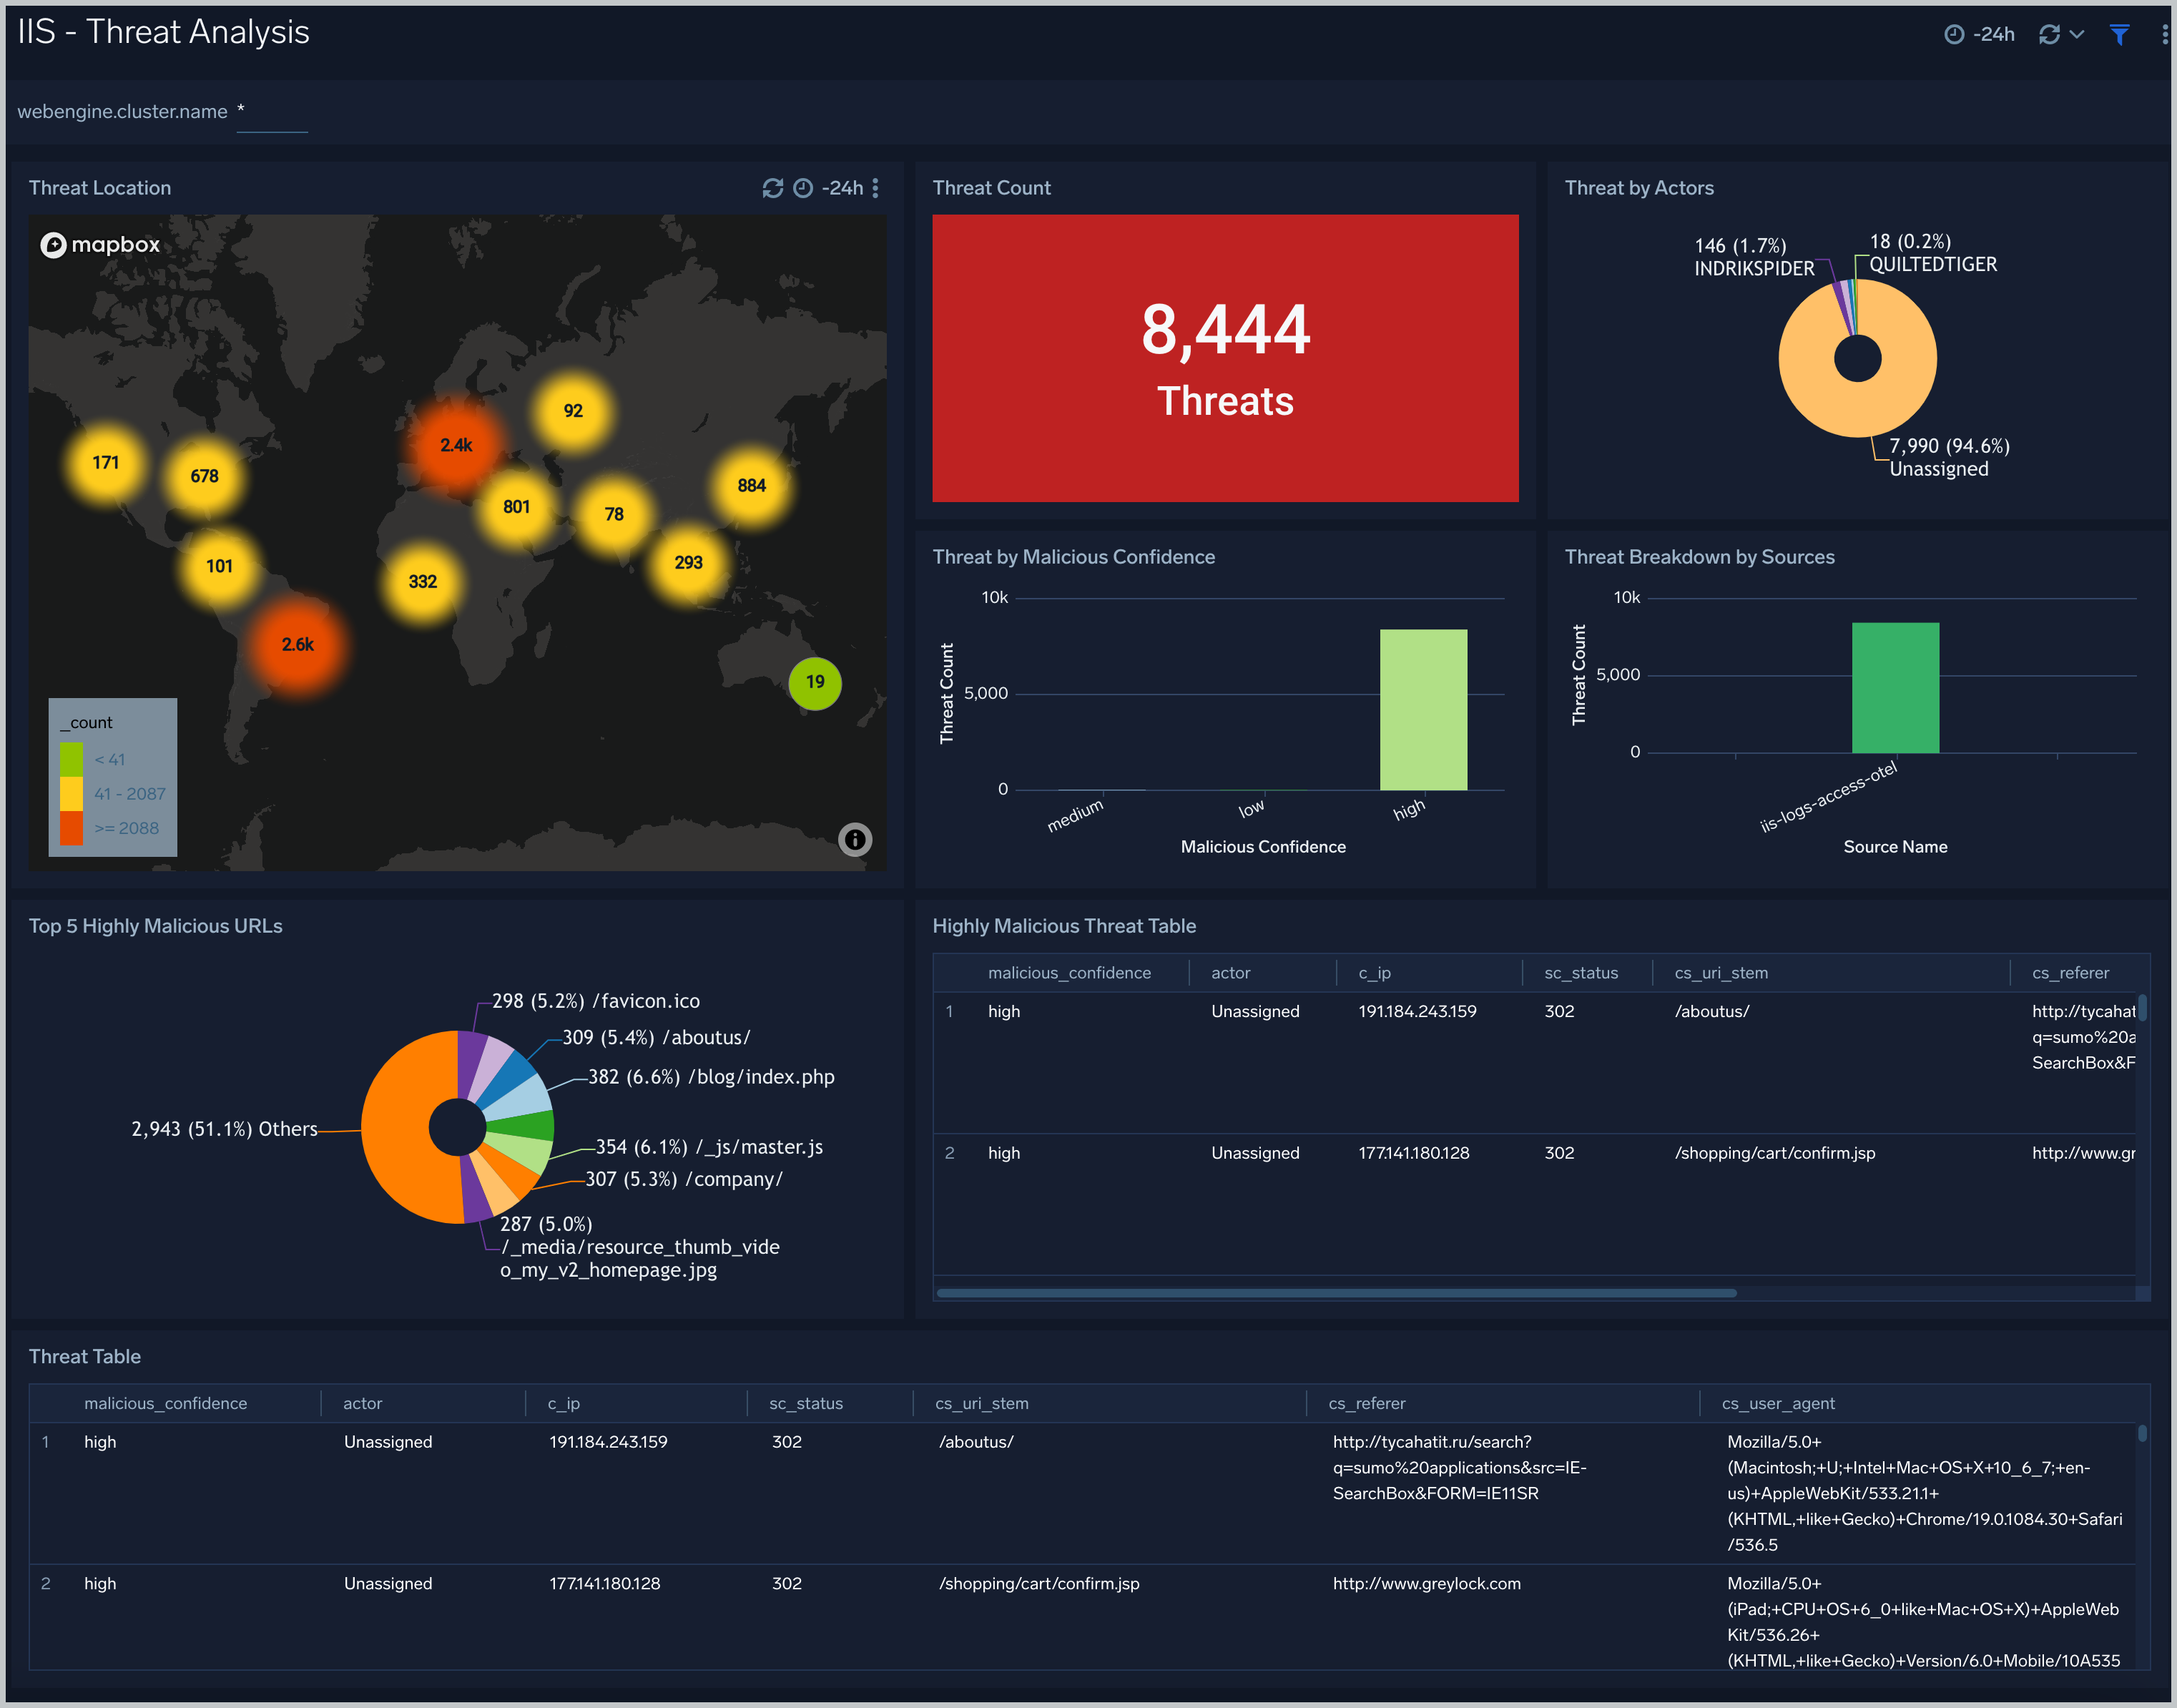
Threat Analysis
The IIS - Threat Analysis dashboard provides high-level views of threats throughout your IIS network. Dashboard panels display visual graphs and detailed information on Threats by Client IP, Threats by Referrer, and Threats by URL.
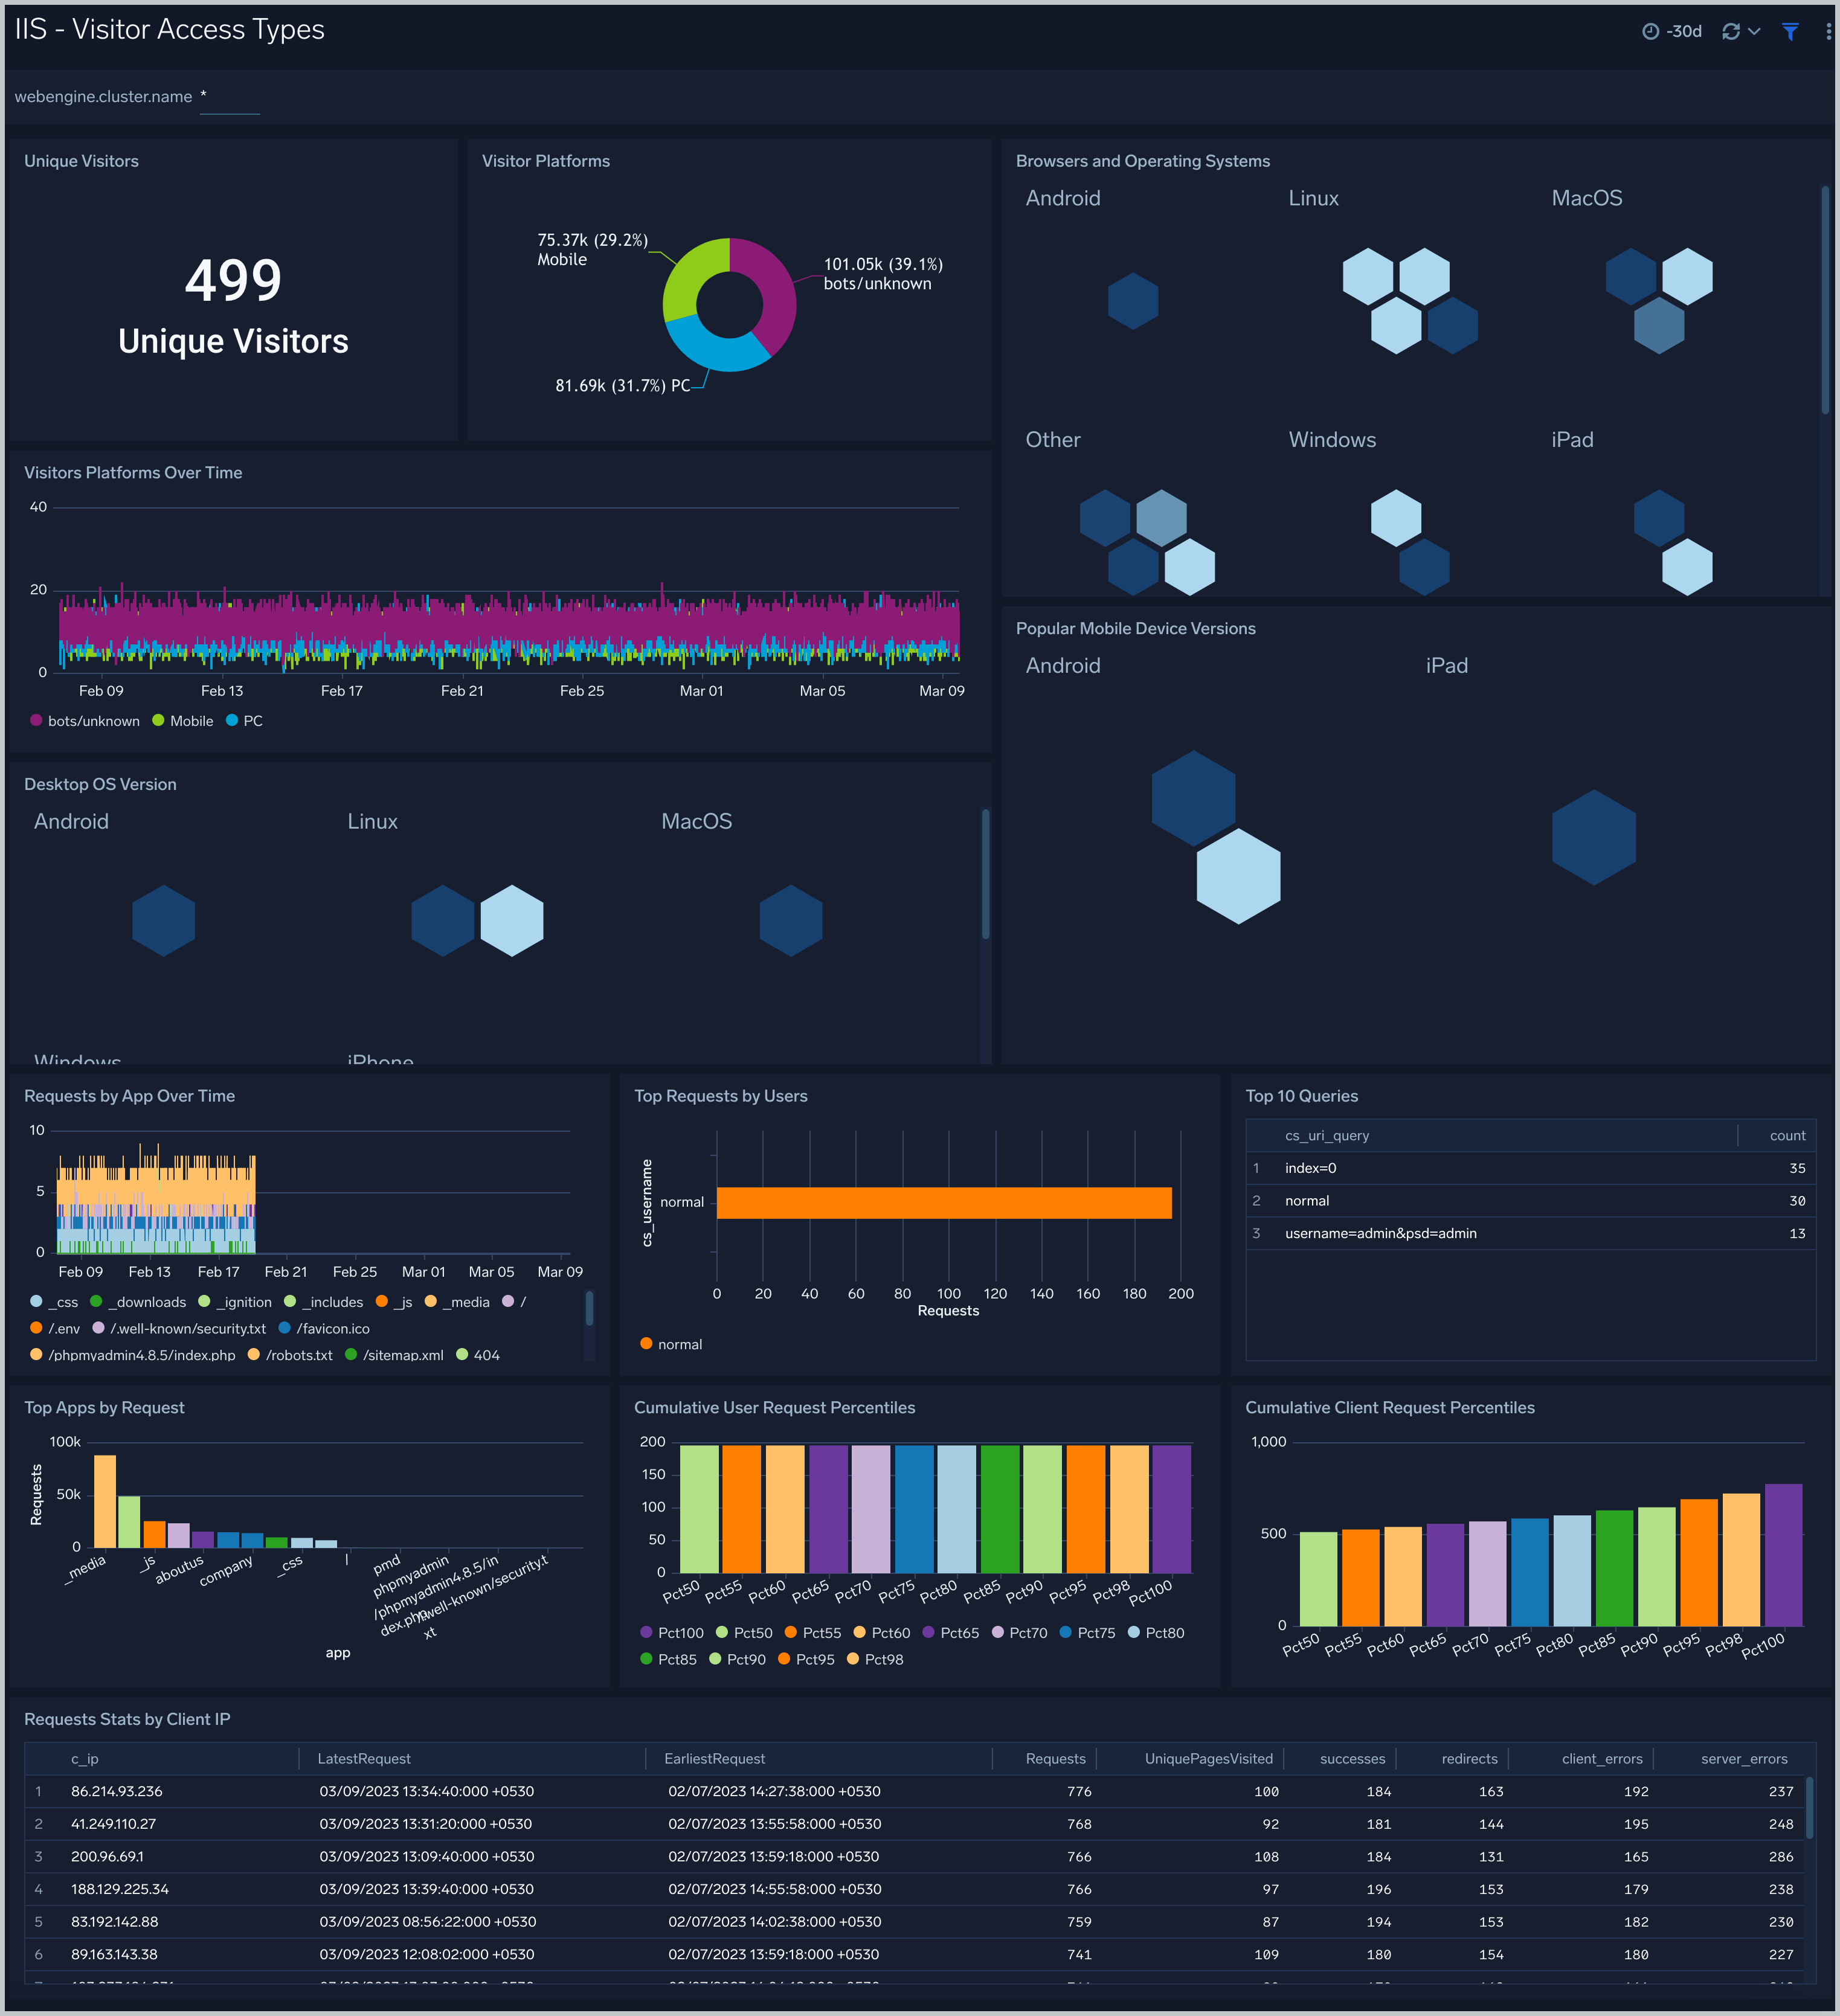
Visitor Access Types
The IIS - Visitor Access Types Dashboard provides insights into visitor platform types, browsers, and operating systems, as well as the most popular mobile devices, PC and Mac versions used.
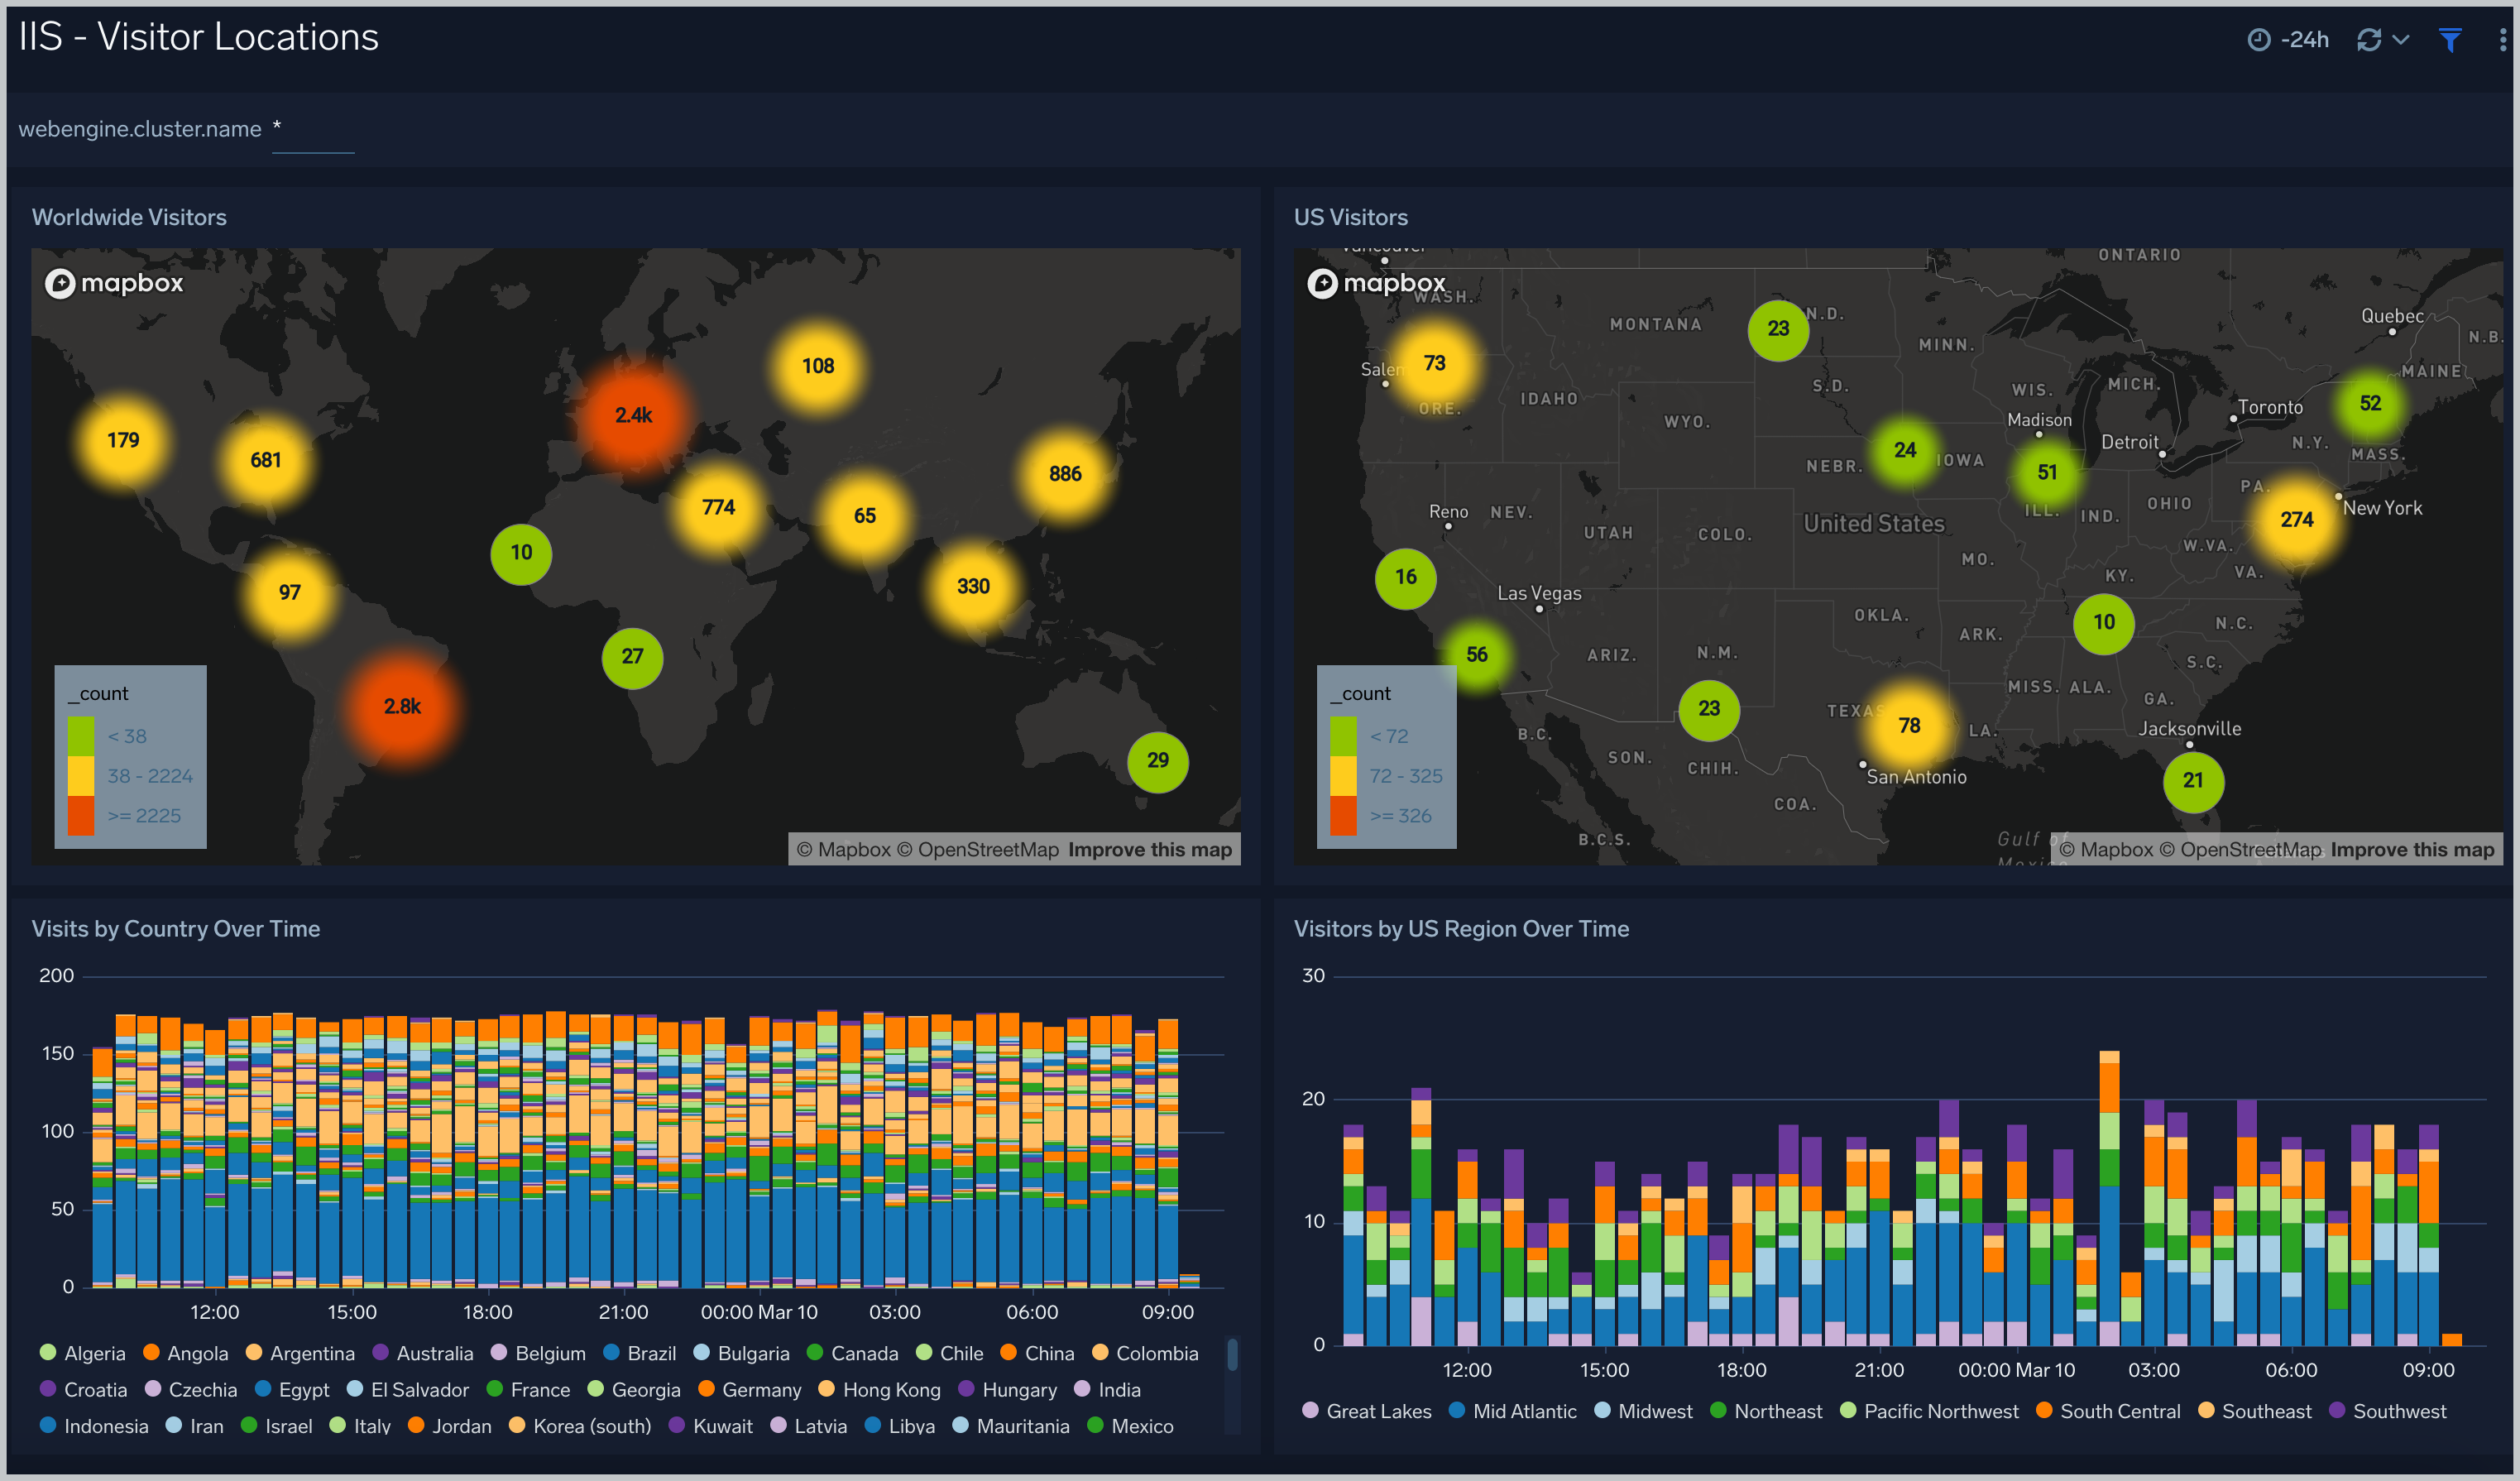
Visitor Locations
The IIS - Visitor Locations dashboard provides a high-level view of Nginx visitor geographic locations both worldwide and in the United States. Dashboard panels also show graphic trends for visits by country over time and visits by US region over time.
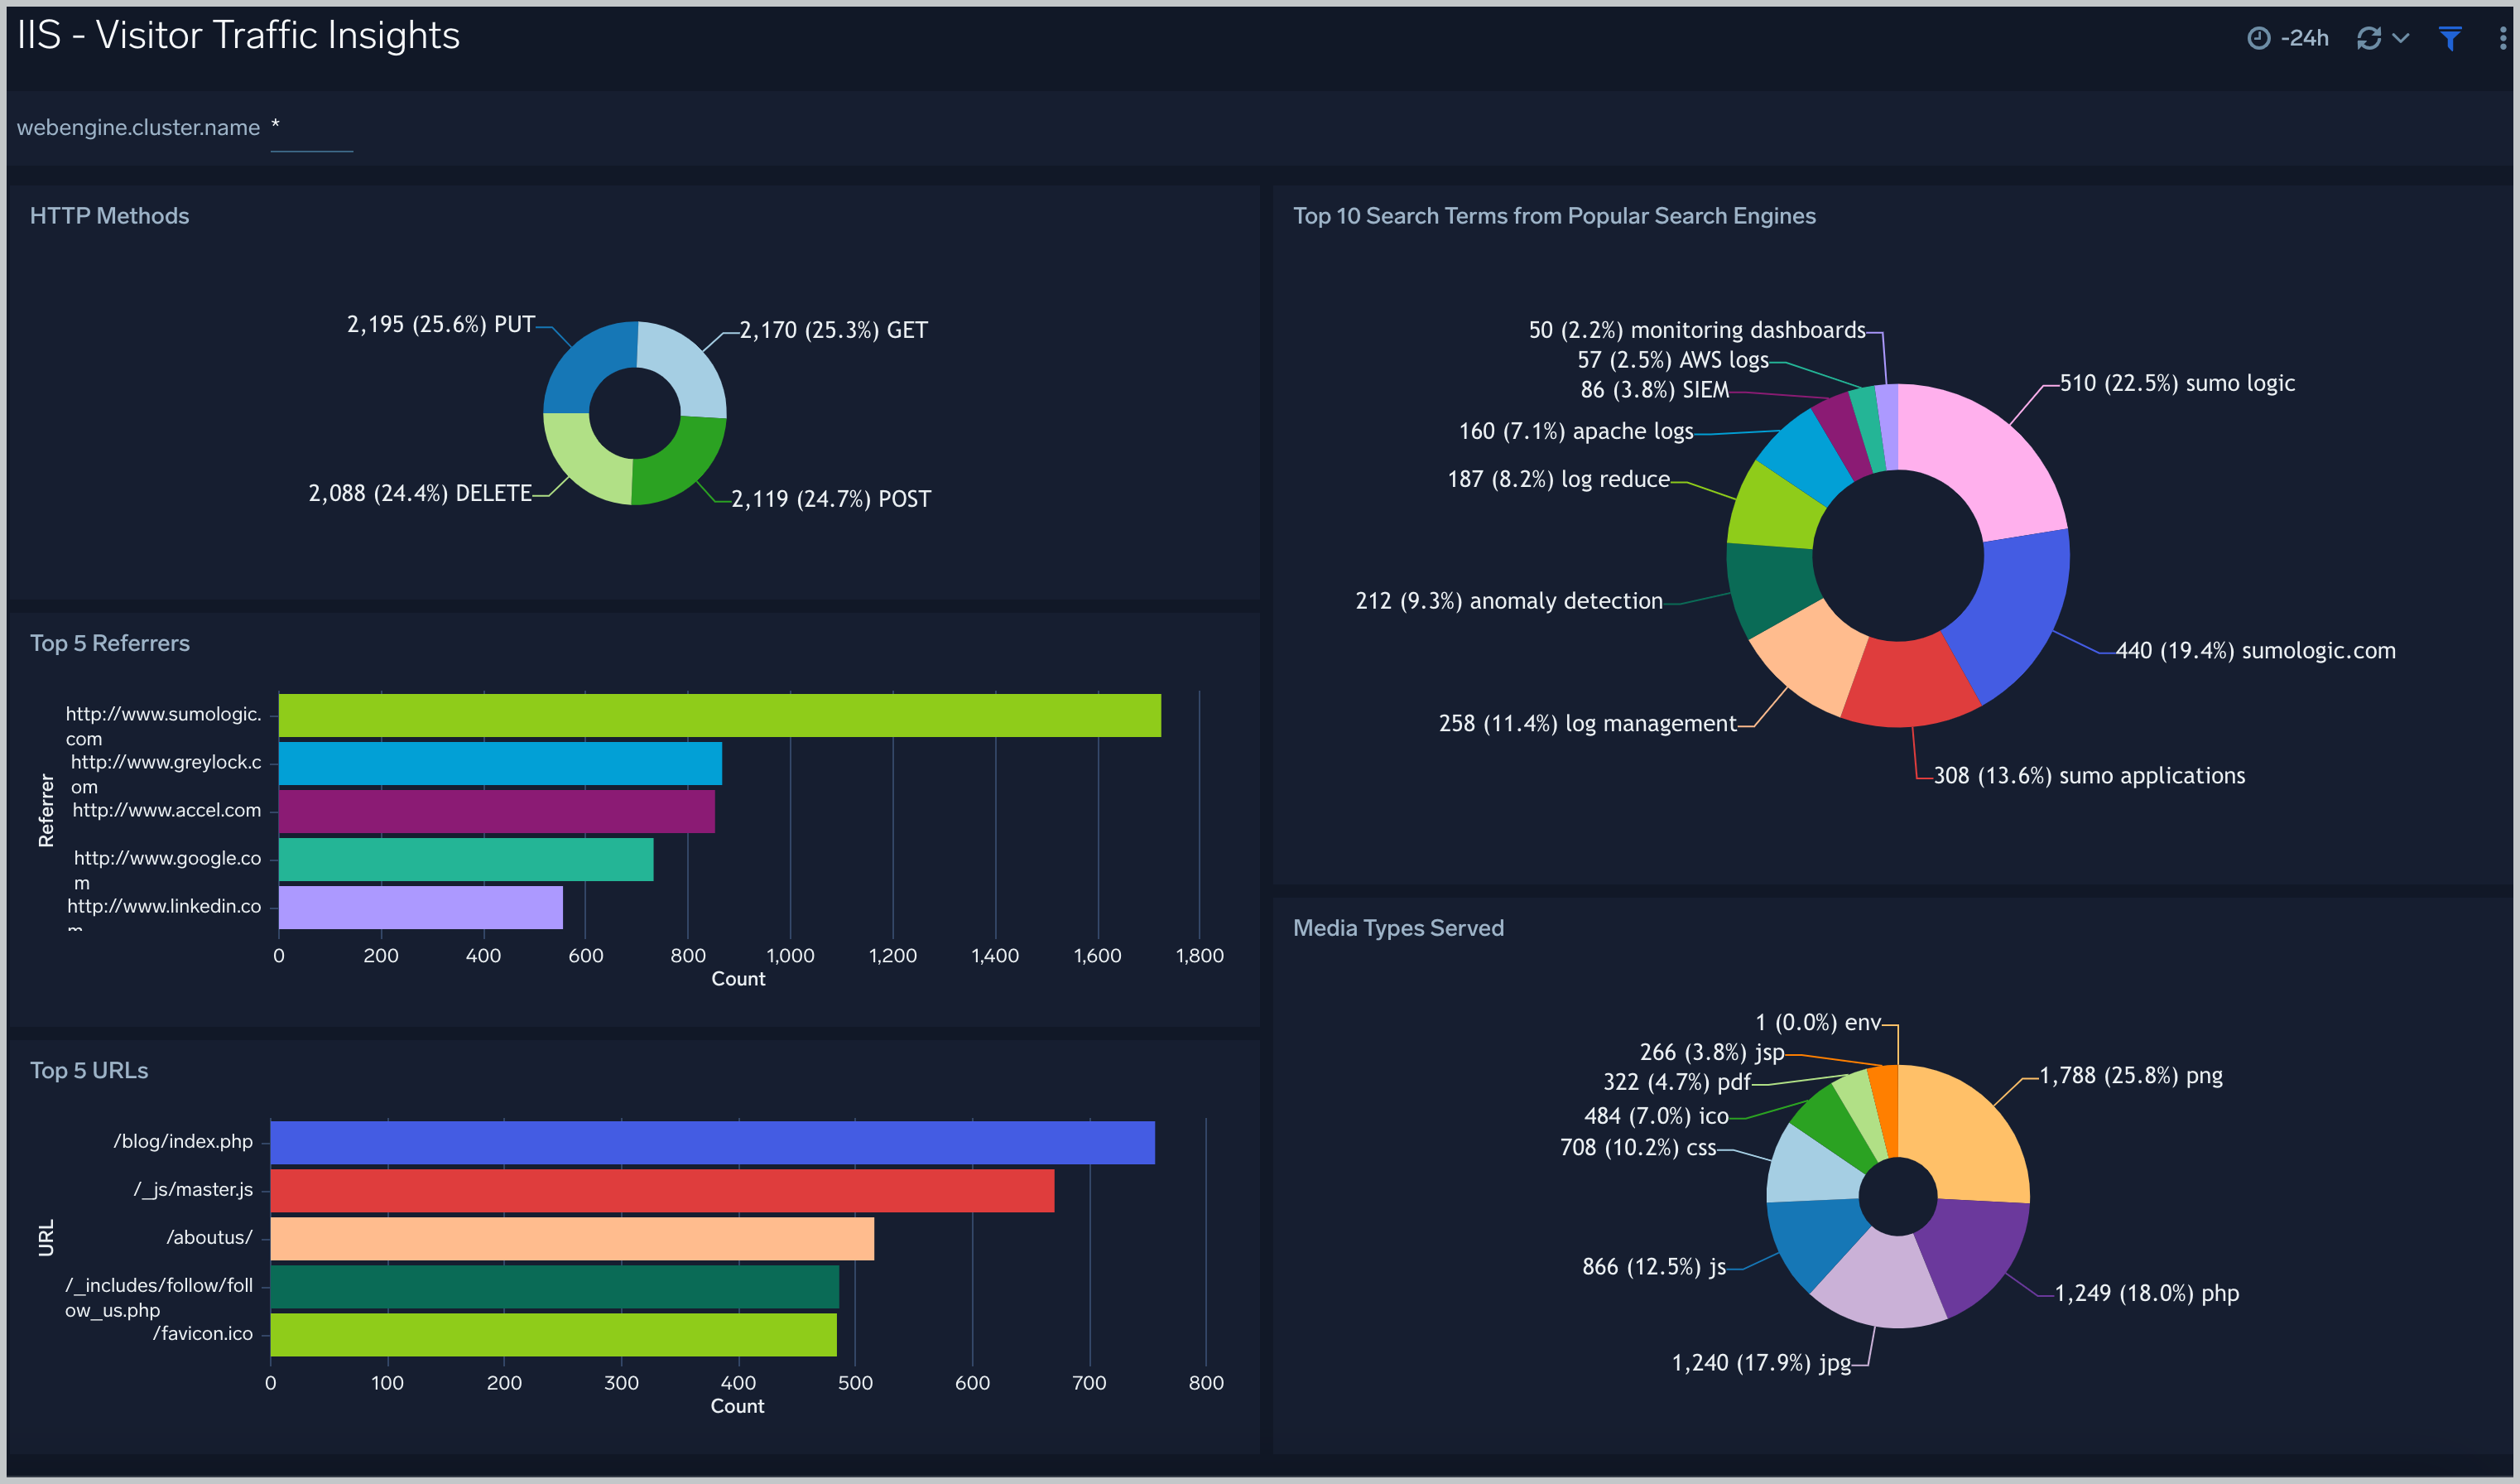
IIS - Visitor Traffic Insights
The IIS - Visitor Traffic Insight Dashboard provides detailed information on the top documents accessed, top referrers, top search terms from popular search engines, and the media types served.
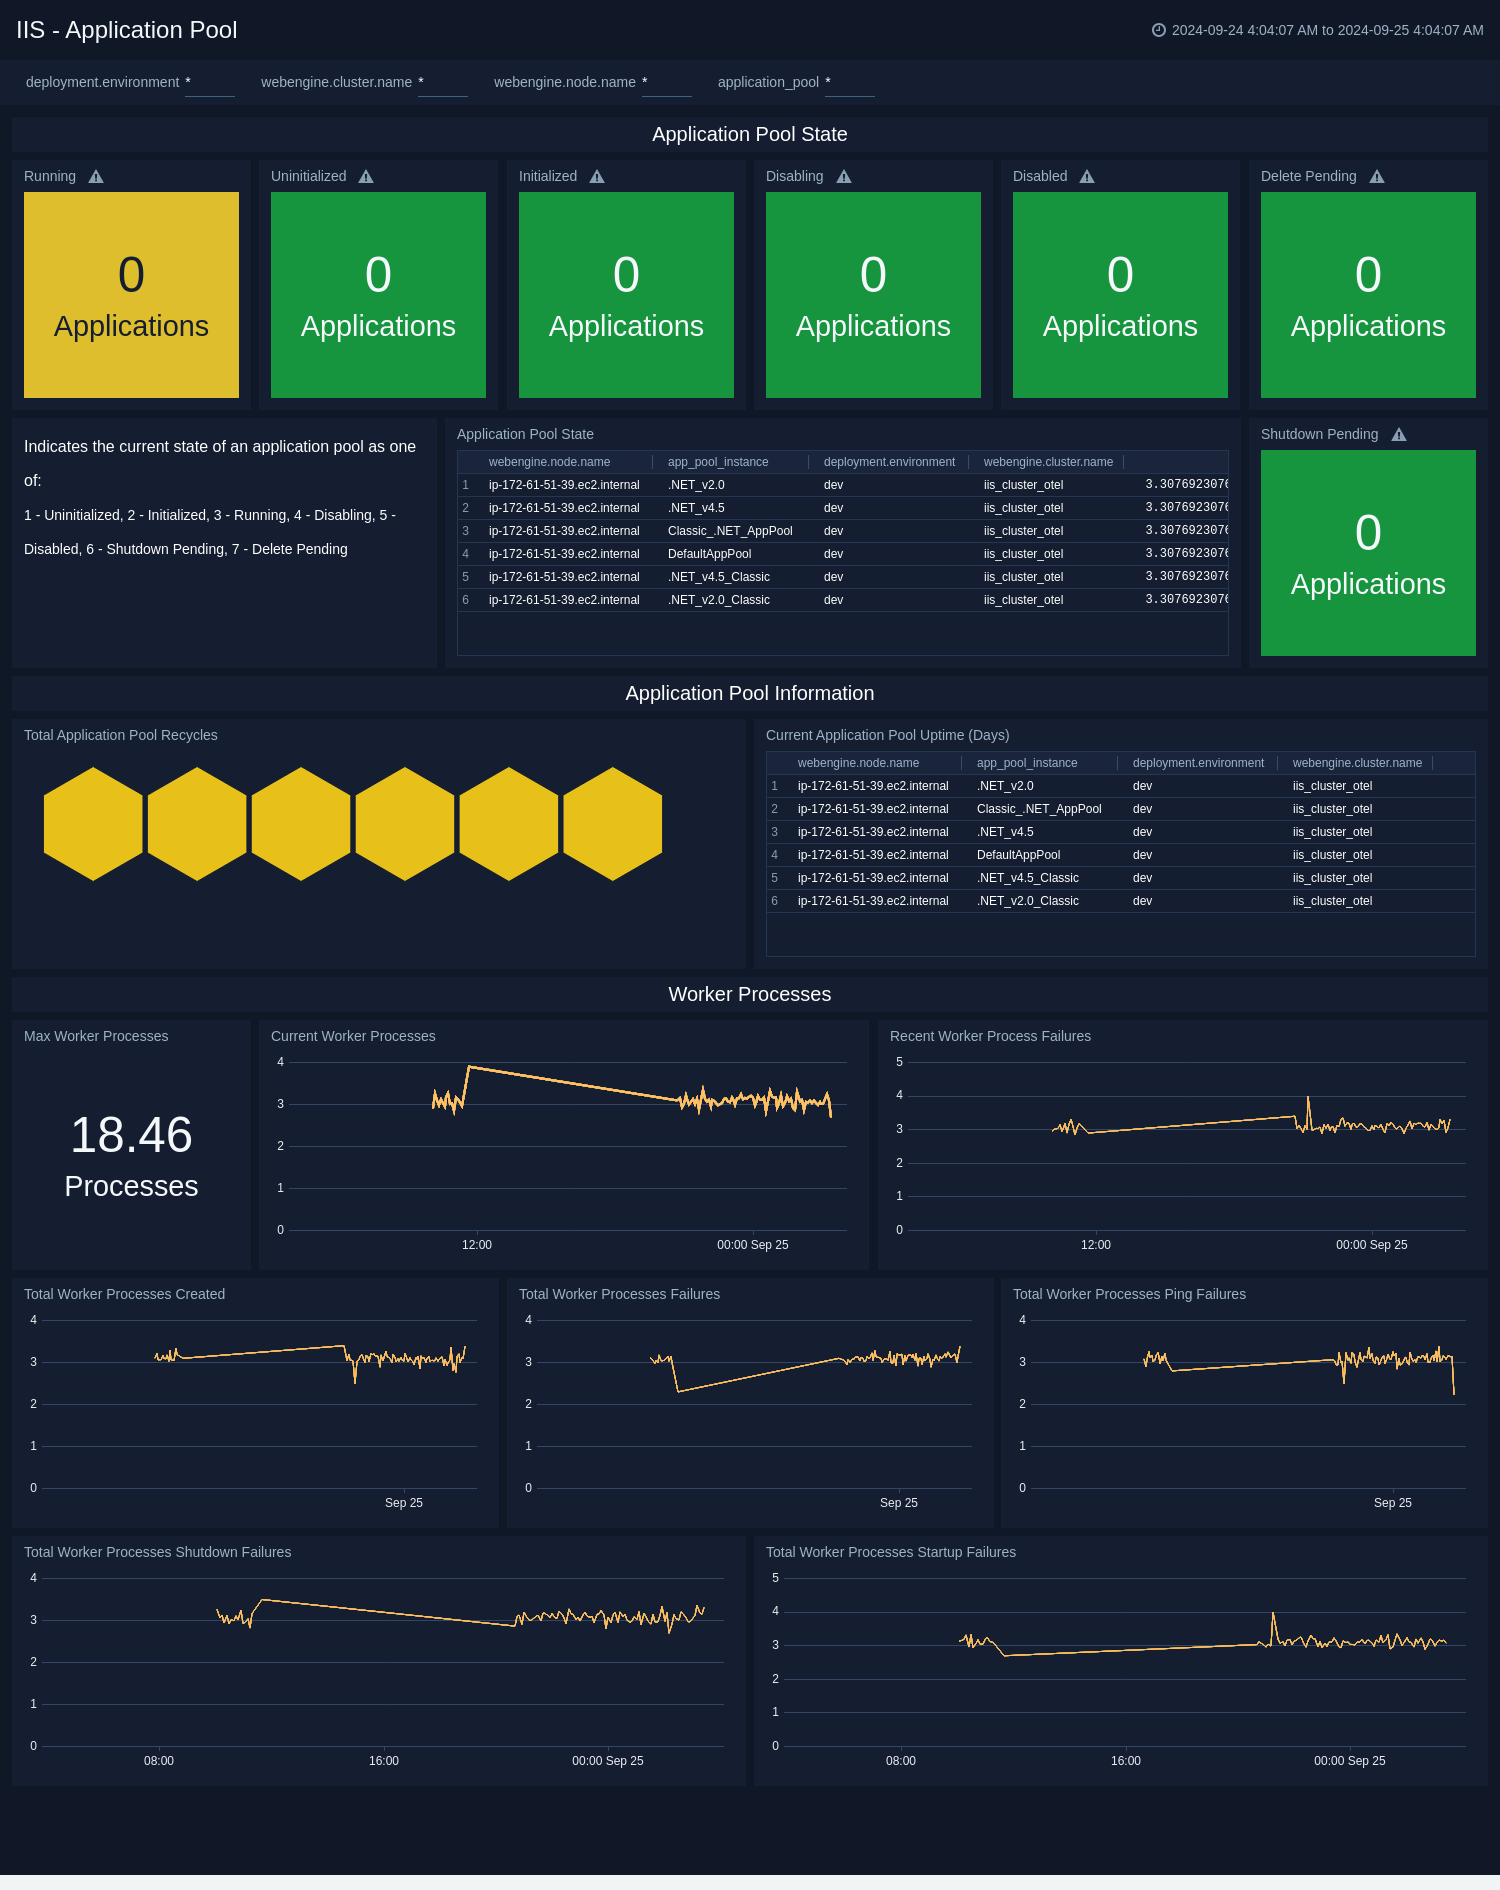
Application Pool
The IIS - Application Pool dashboard provides a high-level view of Application Pool State, Information and Worker Process Metrics.
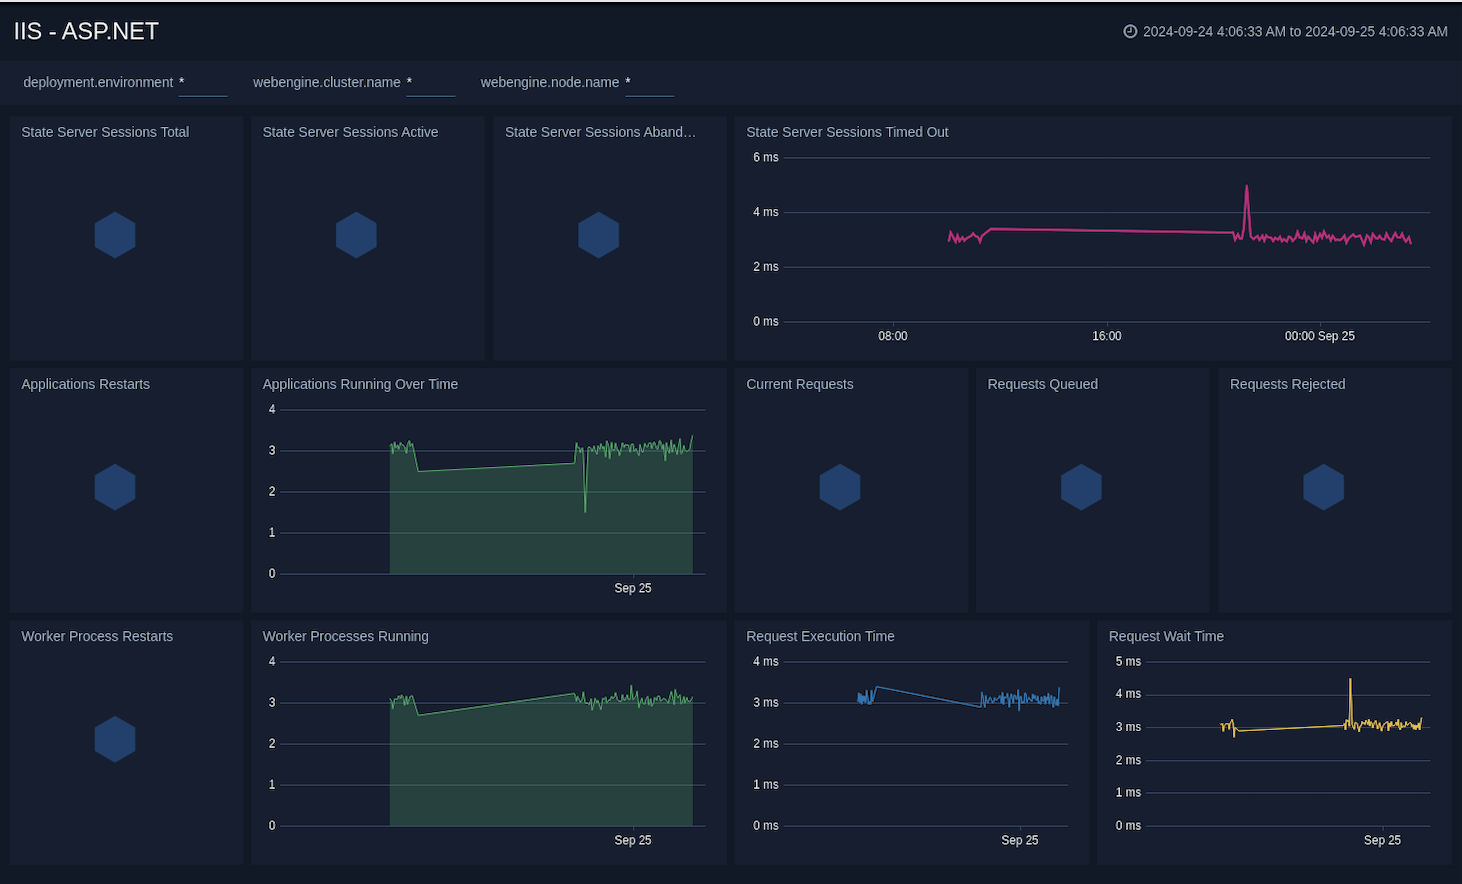
ASP.NET
The IIS - ASP.NET dashboard provides a high-level view of the ASP.NET global performance counters. This dashboard helps you to analyse the state server sessions, monitor applications performance, and understand the request execution and wait time.
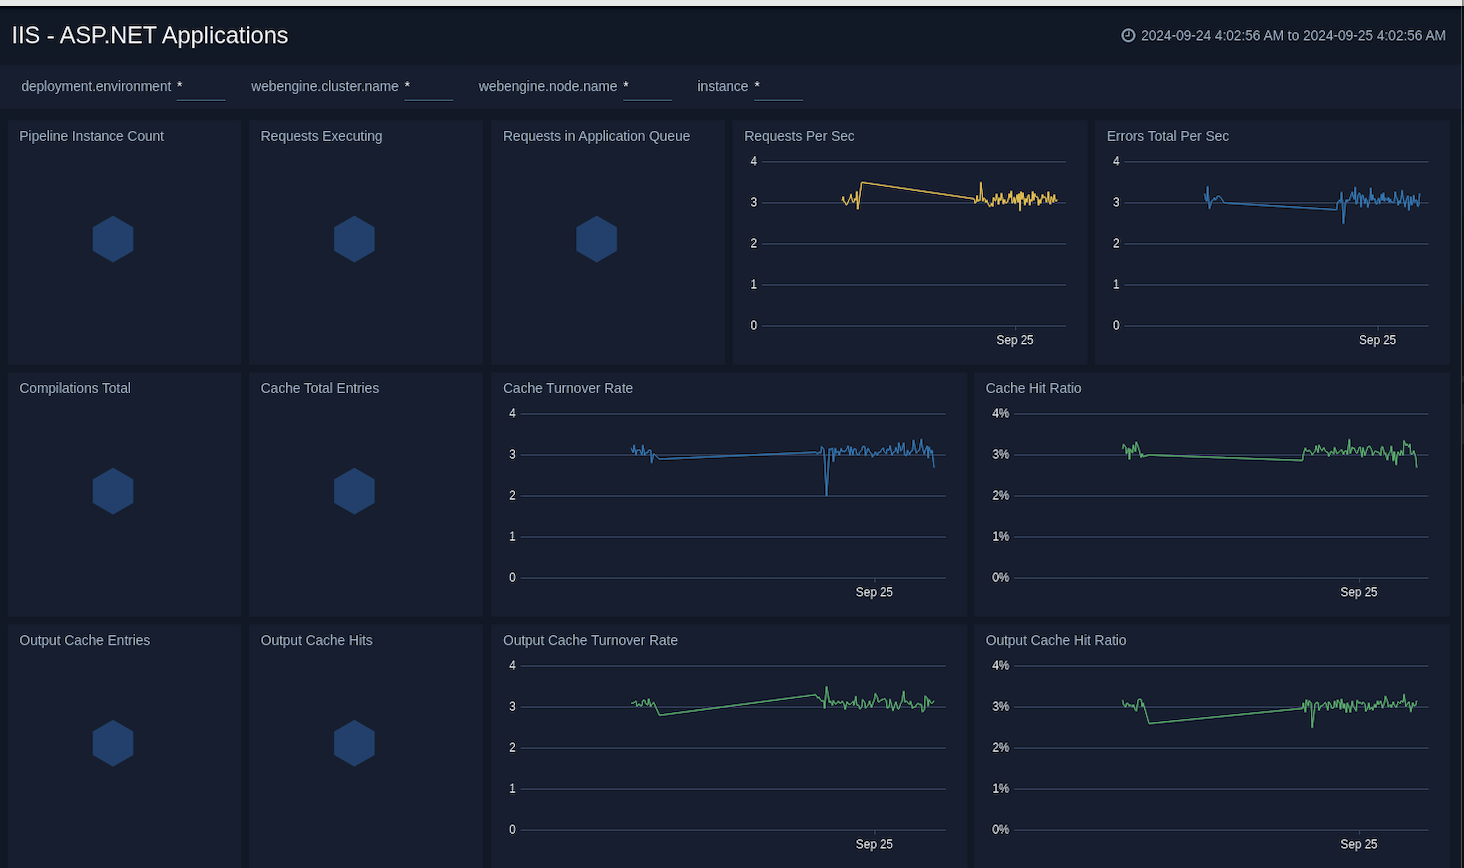
ASP.NET Applications
The IIS - ASP.NET Applications dashboard provides a high-level view of the ASP.NET application performance counters. This dashboard helps you to monitor compilations, errors, cache, requests executing, requests in application queue, pipeline instance count, and output cache.
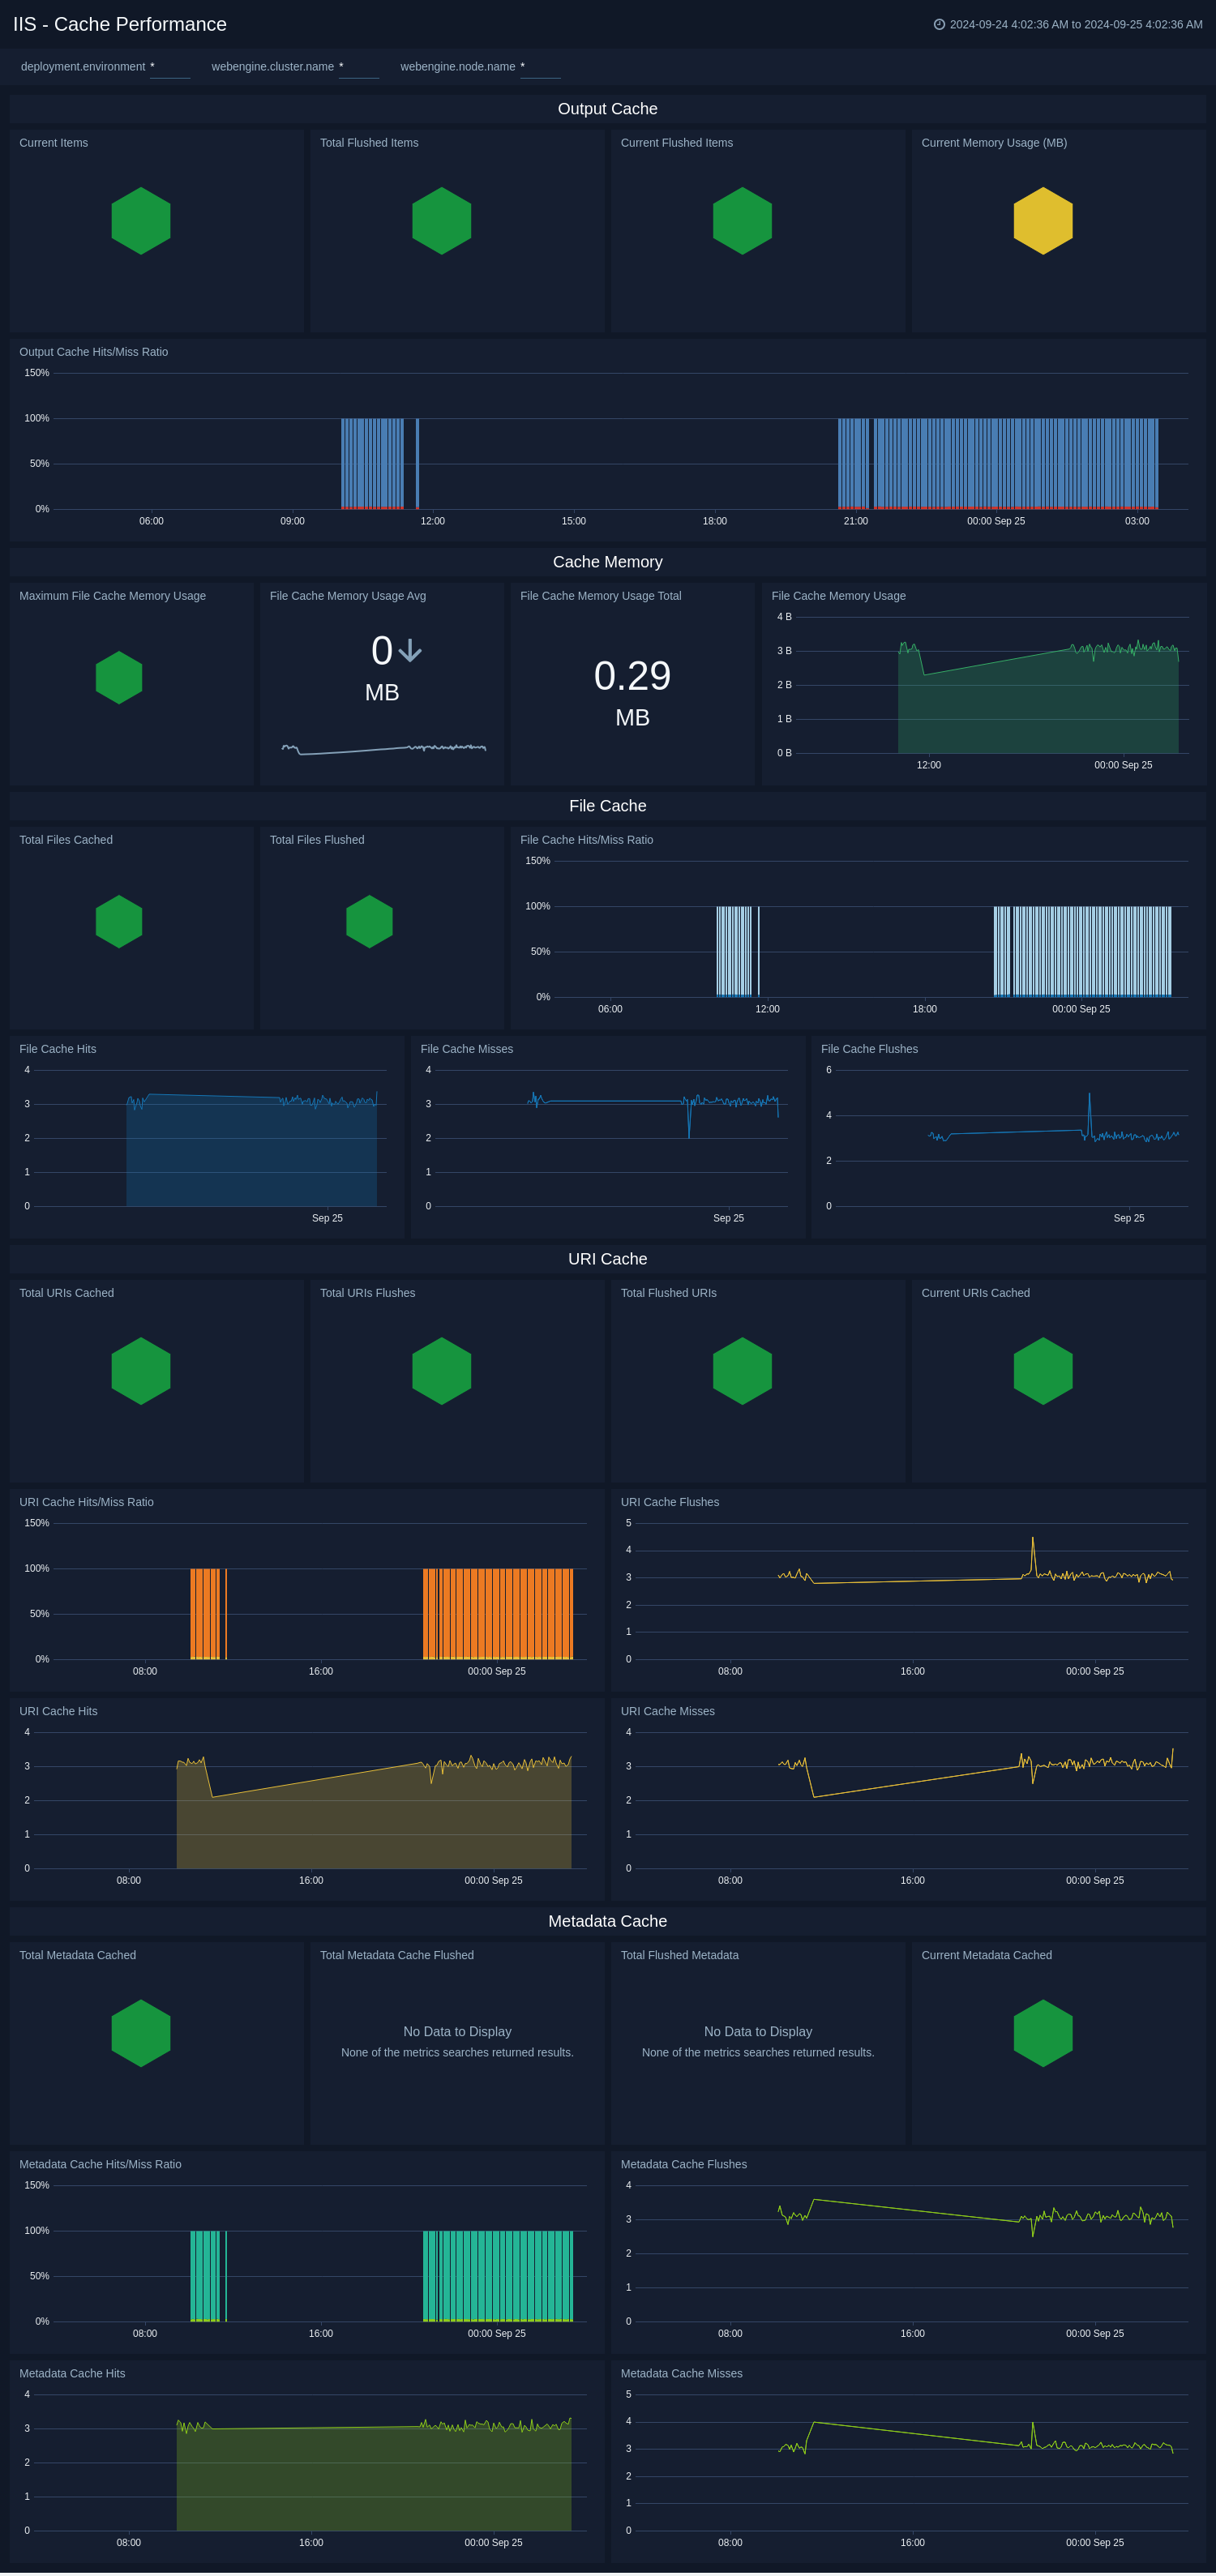
Cache Performance
The IIS - Cache Performance dashboard provides a high-level view of the the Web Service Cache Counters object includes cache counters specific to the World Wide Web Publishing Service. This dashboard helps you to monitor the output cache, cache memory, file cache, and URI cache.
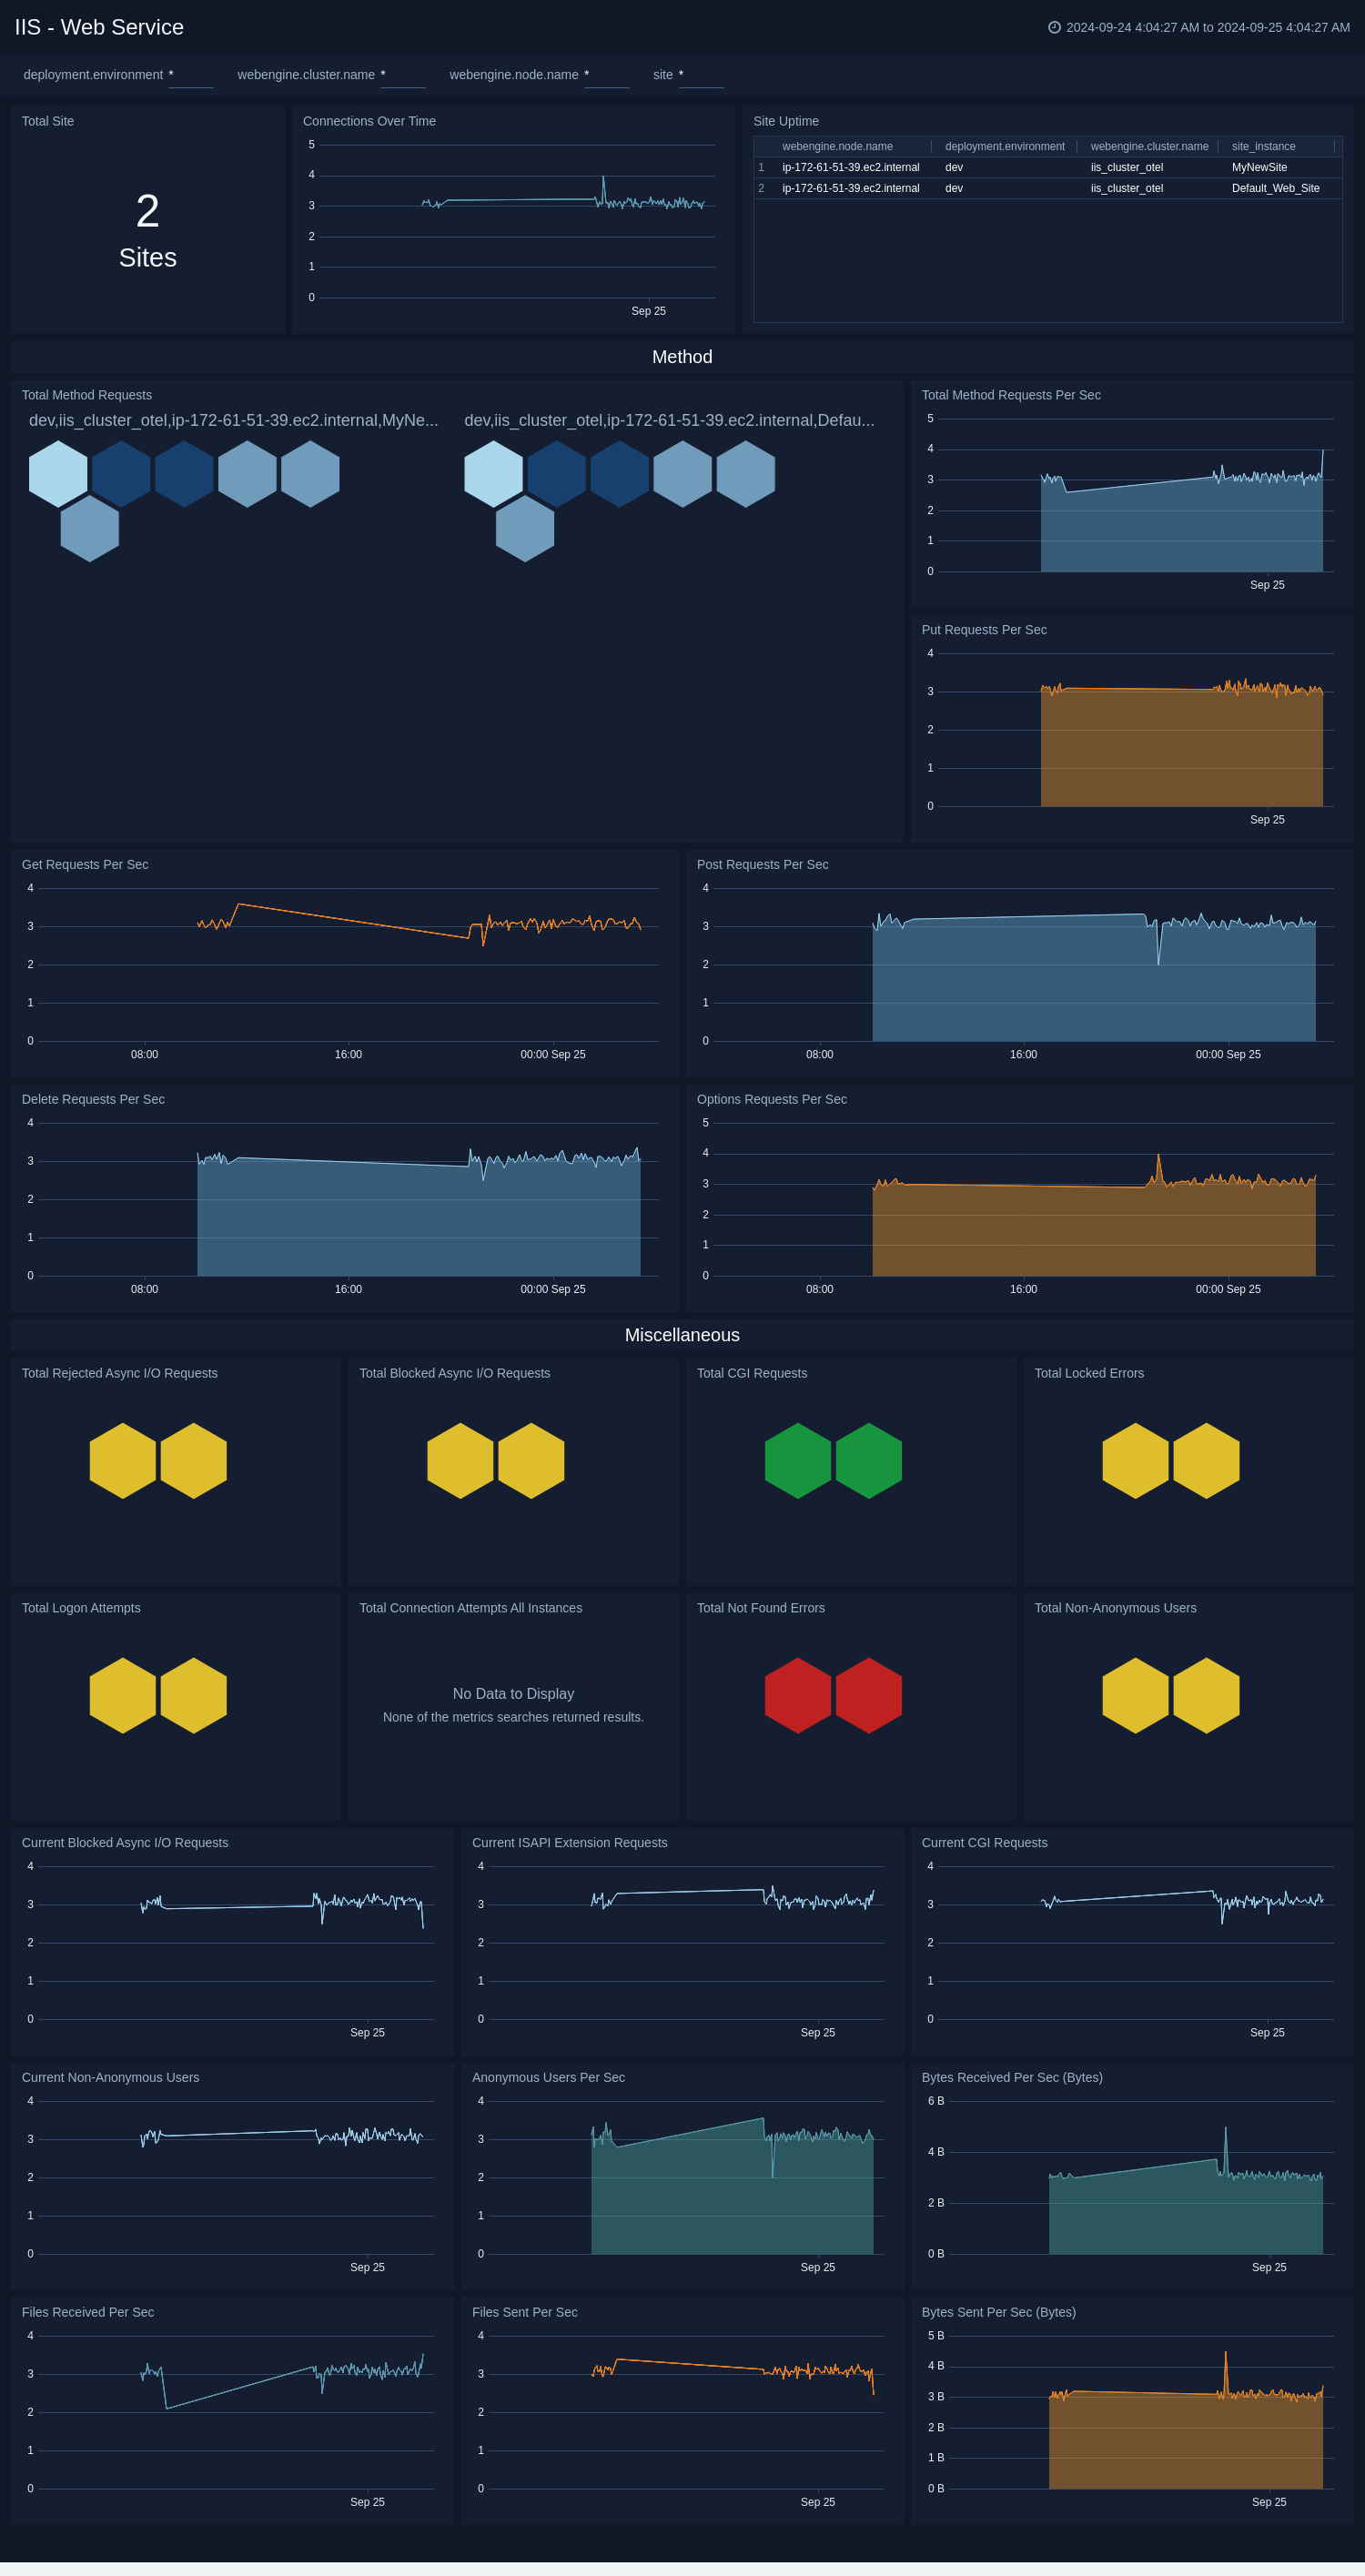
Web Service
The IIS - Web Service dashboard provides a high-level view of the Web Service object includes counters specific to the World Wide Web Publishing Service. This dashboard helps you to monitor the total site, connections, site uptime, method, and miscellaneous.
Create monitors for IIS app
From your App Catalog:
- From the Sumo Logic navigation, select App Catalog.
- In the Search Apps field, search for and then select your app.
- Make sure the app is installed.
- Navigate to What's Included tab and scroll down to the Monitors section.
- Click Create next to the pre-configured monitors. In the create monitors window, adjust the trigger conditions and notifications settings based on your requirements.
- Scroll down to Monitor Details.
- Under Location click on New Folder.
note
By default, monitor will be saved in the root folder. So to make the maintenance easier, create a new folder in the location of your choice.
- Enter Folder Name. Folder Description is optional.
tip
Using app version in the folder name will be helpful to determine the versioning for future updates.
- Click Create. Once the folder is created, click on Save.
IIS alerts
| Name | Description | Alert Condition | Recover Condition |
|---|---|---|---|
IIS - Access from Highly Malicious Sources | This alert is triggered when an IIS server is accessed from highly malicious IP addresses. | Count > 0 | Count <= 0 |
IIS - ASP.NET Application Errors | This alert is triggered when an error is detected in the ASP.NET applications running on an IIS server. | Count > 0 | Count <= 0 |
IIS - Blocked Async IO Requests | This alert is triggered when blocked async I/O requests are detected on an IIS server. | Count > 0 | Count <= 0 |
IIS - Error Events | This alert is triggered when an error is detected in the IIS logs. | Count > 0 | Count <= 0 |
IIS - High ASP.NET Current Requests | This alert is triggered when the current ASP.NET request count exceeds the given value (Default 500). | Count > 500 | Count <= 500 |
IIS - High Client (HTTP 4xx) Error Rate (Copy) | This alert is triggered when more than 5% of HTTP requests result in a 4xx response code. | Count > 0 | Count <= 0 |
IIS - High Current Connections | This alert is triggered when the current connections exceed the given value (Default 1000), indicating potential capacity issues. | Count > 1000 | Count <= 1000 |
IIS - High Server (HTTP 5xx) Error Rate | This alert is triggered when more than 5% of HTTP requests result in a 5xx response code. | Count > 0 | Count <= 0 |
IIS - No Worker Processes | This alert is triggered when the worker process count drops to zero, indicating potential application pool issues. | Count < 1 | Count >= 1 |
IIS - Slow Response Time | This alert is triggered when the response time for a given IIS server exceeds one second. | Count > 0 | Count <= 0 |