Squid Proxy - OpenTelemetry Collector
The Squid Proxy app is a logs app that helps you monitor activity in Squid Proxy. The preconfigured dashboards provide insight into served and denied requests; HTTP response codes; URLs experiencing redirects, client errors, and server errors; and quality of service data that helps you understand your users' experience.
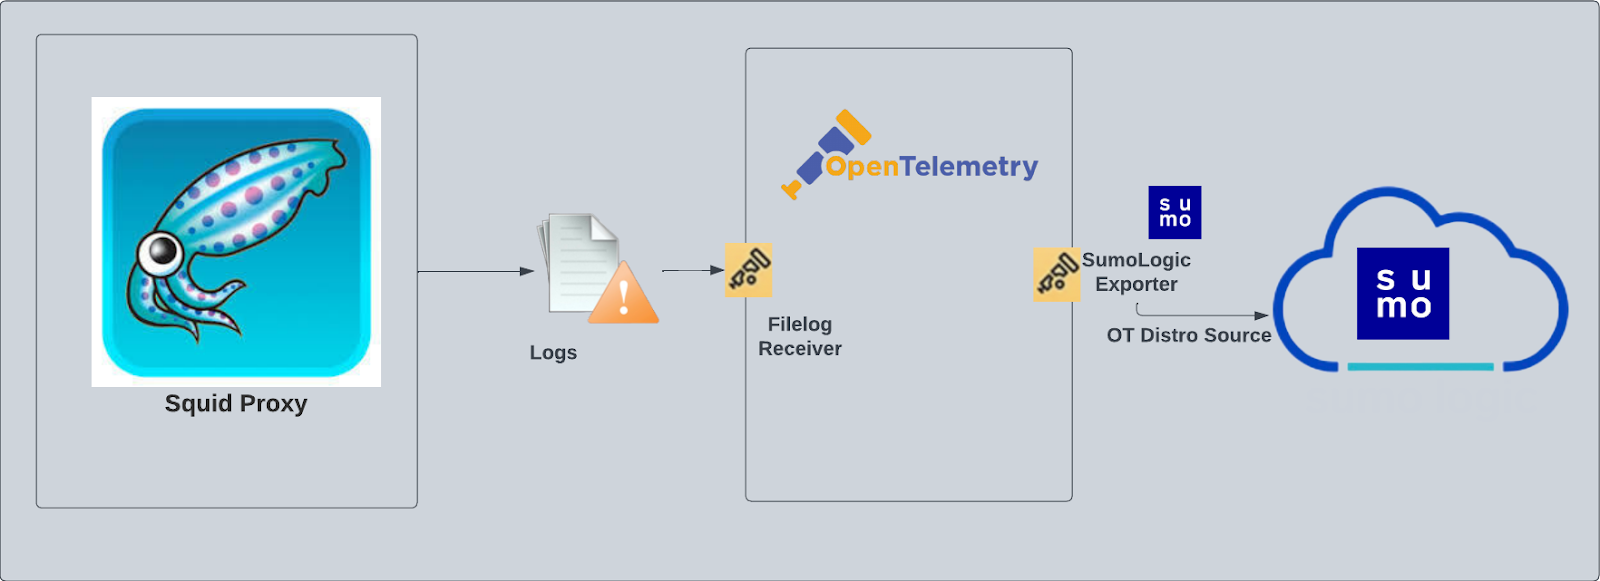
Squid logs are sent to Sumo Logic through OpenTtelemetry filelog receiver.
Fields creation in Sumo Logic for Squid
Following are the Fields which will be created as part of Squid App install if not already present:
webengine.cluster.name. User configured. Enter a name to identify this Squid cluster. This cluster name will be shown in the Sumo Logic dashboards.webengine.system. Has a fixed value of squidproxy.sumo.datasource. Has a fixed value of squidproxy.
Prerequisites
By default, the squid proxy will write the access log to the log directory that was configured during installation. For example, on Linux, the default log directory is /var/log/squid/access.log. If the access log is disabled, you must enable the access log by following these instructions.
For Linux systems with ACL Support, the otelcol install process should have created the ACL grants necessary for the otelcol system user to access default log locations. You can verify the active ACL grants using the getfacl command. Install the ACL in your Linux environment, if not installed.
The required ACL may not be supported for some rare cases, for example, Linux OS Distro, which is officially not supported by Sumo Logic. In this case, you can run the following command to explicitly grant the permissions.
sudo setfacl -R -m d:u:otelcol-sumo:r-x,d:g:otelcol-sumo:r-x,u:otelcol-sumo:r-x,g:otelcol-sumo:r-x <PATH_TO_LOG_FILE>
Run the above command for all the log files in the directory that need to be ingested, which are not residing in the default location.
If Linux ACL Support is not available, traditional Unix-styled user and group permission must be modified. It should be sufficient to add the otelcol system user to the specific group that has access to the log files.
For Windows systems, log files which are collected should be accessible by the SYSTEM group. Use the following set of PowerShell commands if the SYSTEM group does not have access.
$NewAcl = Get-Acl -Path "<PATH_TO_LOG_FILE>"
# Set properties
$identity = "NT AUTHORITY\SYSTEM"
$fileSystemRights = "ReadAndExecute"
$type = "Allow"
# Create new rule
$fileSystemAccessRuleArgumentList = $identity, $fileSystemRights, $type
$fileSystemAccessRule = New-Object -TypeName System.Security.AccessControl.FileSystemAccessRule -ArgumentList $fileSystemAccessRuleArgumentList
# Apply new rule
$NewAcl.SetAccessRule($fileSystemAccessRule)
Set-Acl -Path "<PATH_TO_LOG_FILE>" -AclObject $NewAcl
Collection configuration and app installation
As part of data collection setup and app installation, you can select the App from App Catalog and click on Install App. Follow the steps below.
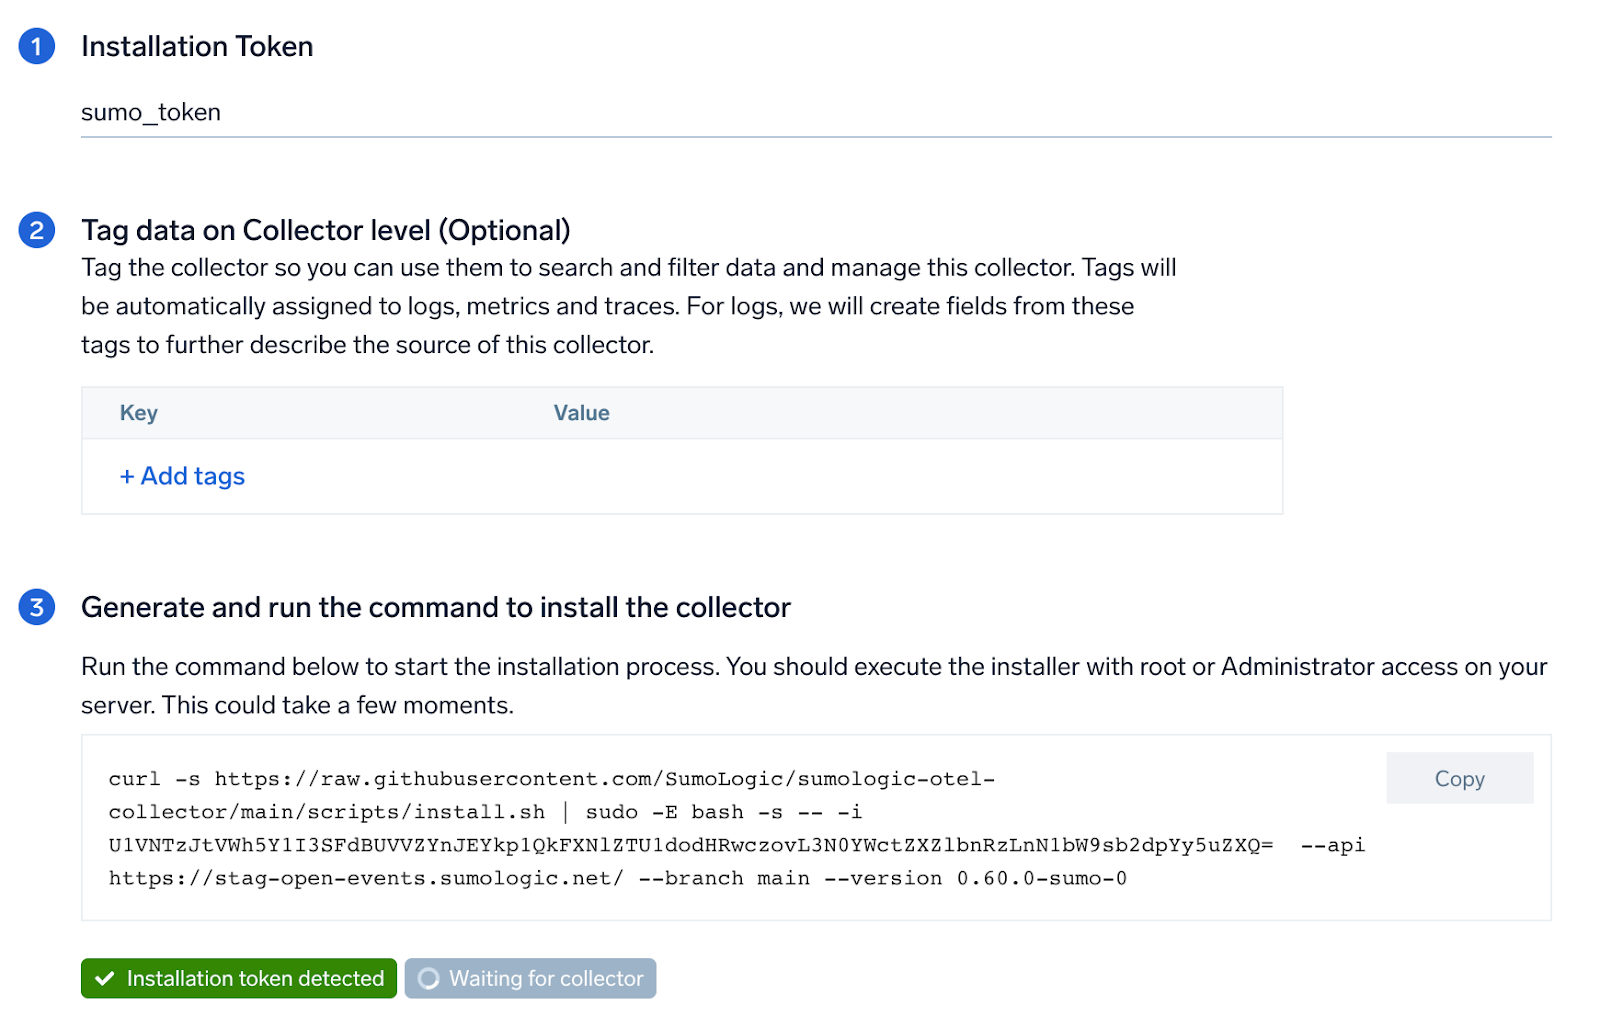
Step 1: Set up Collector
If you want to use an existing OpenTelemetry Collector, you can skip this step by selecting the Use an existing Collector option.
To create a new Collector:
- Select the Add a new Collector option.
- Select the platform where you want to install the Sumo Logic OpenTelemetry Collector.
This will generate a command that you can execute in the machine environment you need to monitor. Once executed, it will install the Sumo Logic OpenTelemetry Collector.
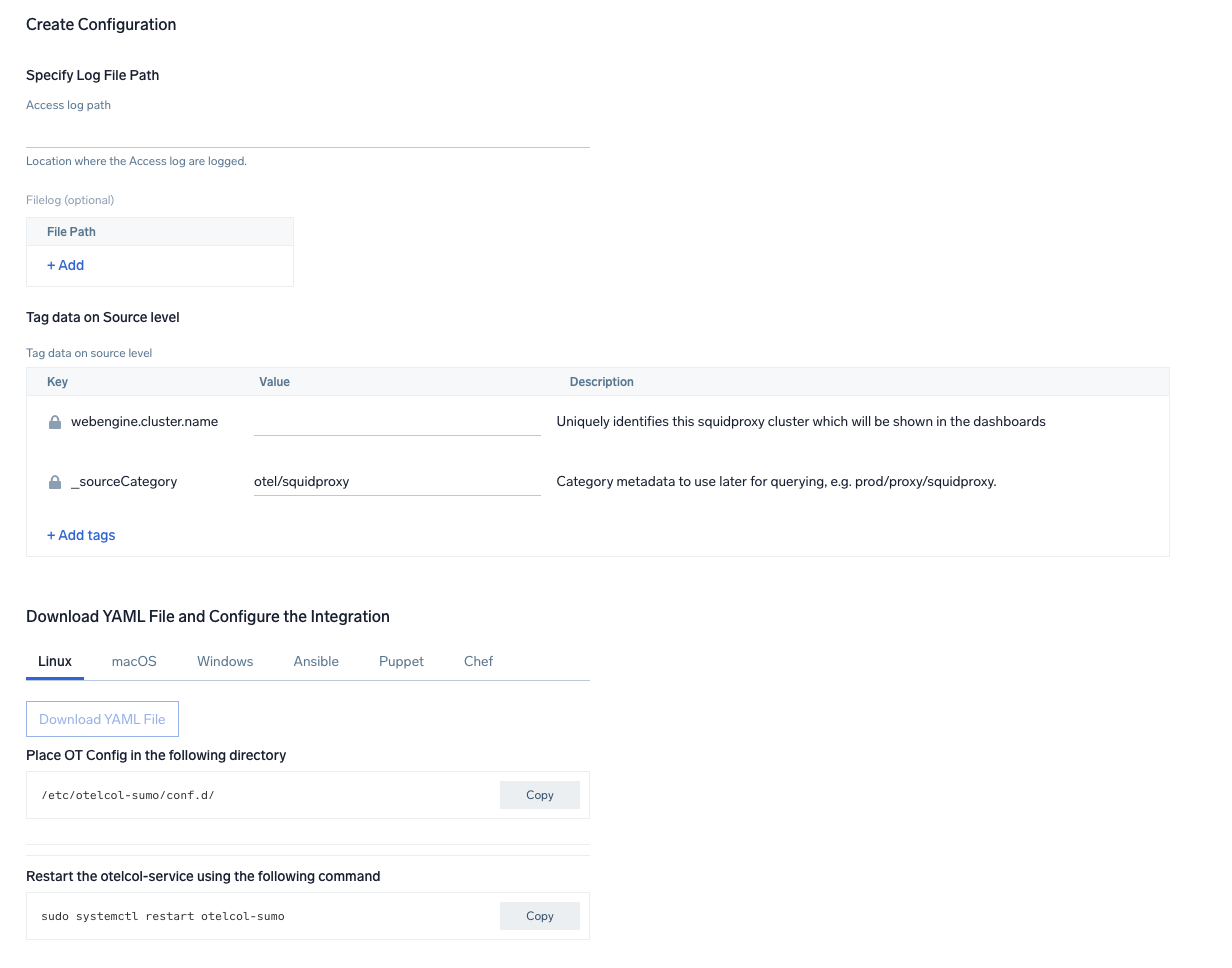
Step 2: Configure integration
OpenTelemetry works with a configuration yaml file which has all the details with respect to the data which needs to be collected. For example, it specifies the location of a log file that is read and sent to the Sumo Logic platform..
In this step, you will configure the yaml required for Squid Collection. The path of the log file configured to capture Squid logs is needed to be given here.
The files are typically located in /var/log/squid/access.log. Refer to the Prerequisites section for more details.
You can add any custom fields which you want to tag along with the data ingested in Sumo. Click on the Download YAML File button to get the yaml file.
Step 3: Send logs to Sumo Logic
Once you have downloaded the YAML file as described in the previous step, follow the below steps based on your platform.
- Linux
- Windows
- macOS
- Chef
- Ansible
- Puppet
- Copy the yaml at
/etc/otelcol-sumo/conf.d/folder in the Squid instance which needs to be monitored. - Restart the otelcol-sumo process using the below command:
sudo systemctl restart otelcol-sumo
- Copy the yaml file to
C:\ProgramData\Sumo Logic\OpenTelemetry Collector\config\conf.dfolder in the machine which needs to be monitored. - Restart the collector using:
Restart-Service -Name OtelcolSumo
- Copy the yaml at
/etc/otelcol-sumo/conf.d/folder in the Squid instance which needs to be monitored. - Restart the otelcol-sumo process using the below command:
otelcol-sumo --config /etc/otelcol-sumo/sumologic.yaml --conf "glob:/etc/otelcol-sumo/conf.d/*.yaml"
- Copy the yaml file into your Chef cookbook files directory
files/<downloaded_yaml_file>. - Use a Chef file resource in a recipe to manage it.
cookbook_file '/etc/otelcol-sumo/conf.d/<downloaded_yaml_file>' do mode 0644 notifies :restart, 'service[otelcol-sumo]', :delayed end - Add the recipe to your collector setup to start collecting the data. Every team typically has their established way of applying the Chef recipe. The resulting Chef recipe should look something like:
cookbook_file '/etc/otelcol-sumo/conf.d/<downloaded_yaml_file>' do
mode 0644
notifies :restart, 'service[otelcol-sumo]', :delayed
end
- Place the file into your Ansible playbook files directory.
- Run the Ansible playbook.
ansible-playbook -i inventory install_sumologic_otel_collector.yaml
-e '{"installation_token": "<YOUR_TOKEN>", "collector_tags": {<YOUR_TAGS>}, "src_config_path": "files/conf.d"}'
- Place the file into your Puppet module files directory
modules/install_otel_collector/files/<downloaded_yaml>. - Use a Puppet file resource to manage it.
file { '/etc/otelcol-sumo/conf.d/<downloaded_yaml_file>':
    ensure => present,
    source => 'puppet:///modules/install_otel_collector/<downloaded_yaml_file>',
    mode => '0644',
    notify => Service[otelcol-sumo],
} - Apply the Puppet manifest. Every team typically has their established way of applying the Puppet manifest. The resulting Puppet manifest should look something like:
node 'default' {
    class { 'install_otel_collector'
      installation_token => '<YOUR_TOKEN>',
      collector_tags => { <YOUR_TAGS> },
    }

    service { 'otelcol-sumo':
      provider => 'systemd',
      ensure => running,
      enable => true,
      require => Class['install_otel_collector'],
    }

    file { '/etc/otelcol-sumo/conf.d/<downloaded_yaml_file>':
      ensure => present,
      source => 'puppet:///modules/install_otel_collector/<downloaded_yaml_file>',
      mode => '0644',
      notify => Service[otelcol-sumo],
    }
  }
After successfully executing the above command, Sumo Logic will start receiving data from your host machine.
Click Next. This will install the app (dashboards and monitors) to your Sumo Logic Org.
Dashboard panels will start to fill automatically. It's important to note that each panel fills with data matching the time range query and received since the panel was created. Results won't immediately be available, but within 20 minutes, you'll see full graphs and maps.
Sample log messages in Non-Kubernetes environments
1674483805.439 44 192.168.100.40 TCP_REFRESH_MODIFIED/301 514 GET http://openstack.org/ - HIER_DIRECT/192.168.100.40 text/html
Sample queries
This sample Query is from the Squid Proxy - HTTP Response Analysis > URLs Experiencing Redirections panel.
%"sumo.datasource"=squidproxy %"webengine.cluster.name"=*  host.name=* %"webengine.system"=squidproxy
| json "log" as message nodrop
| if (isEMpty(message), _raw, message) as message
| parse regex field = message "(?<time>[\d.]+)\s+(?<elapsed>[\d]+)\s+(?<remotehost>[^\s]+)\s+(?<action>[^/]+)/(?<status_code>[\d]+)\s+(?<bytes>[\d]+)\s+(?<method>[^\s]+)\s+(?<url>[^\s]+)\s(?<rfc931>[^\s]+)\s+(?<peerstatus>[^/]+)/(?<peerhost>[^\s]+)\s+(?<type>[^\s|$]+?)(?:\s+|$)" nodrop | parse field = message "Connection: *\\r\\n" as connection_status nodrop | parse field = message "Host: *\\r\\n" as host nodrop | parse field = message "User-Agent: *\\r\\n" as user_agent nodrop | parse field = message "TE: *\\r\\n" as te nodrop
| where status_code matches "3*"
| count as eventCount by url, status_Code
| sort by status_code, eventCount, url
Viewing Squid dashboards
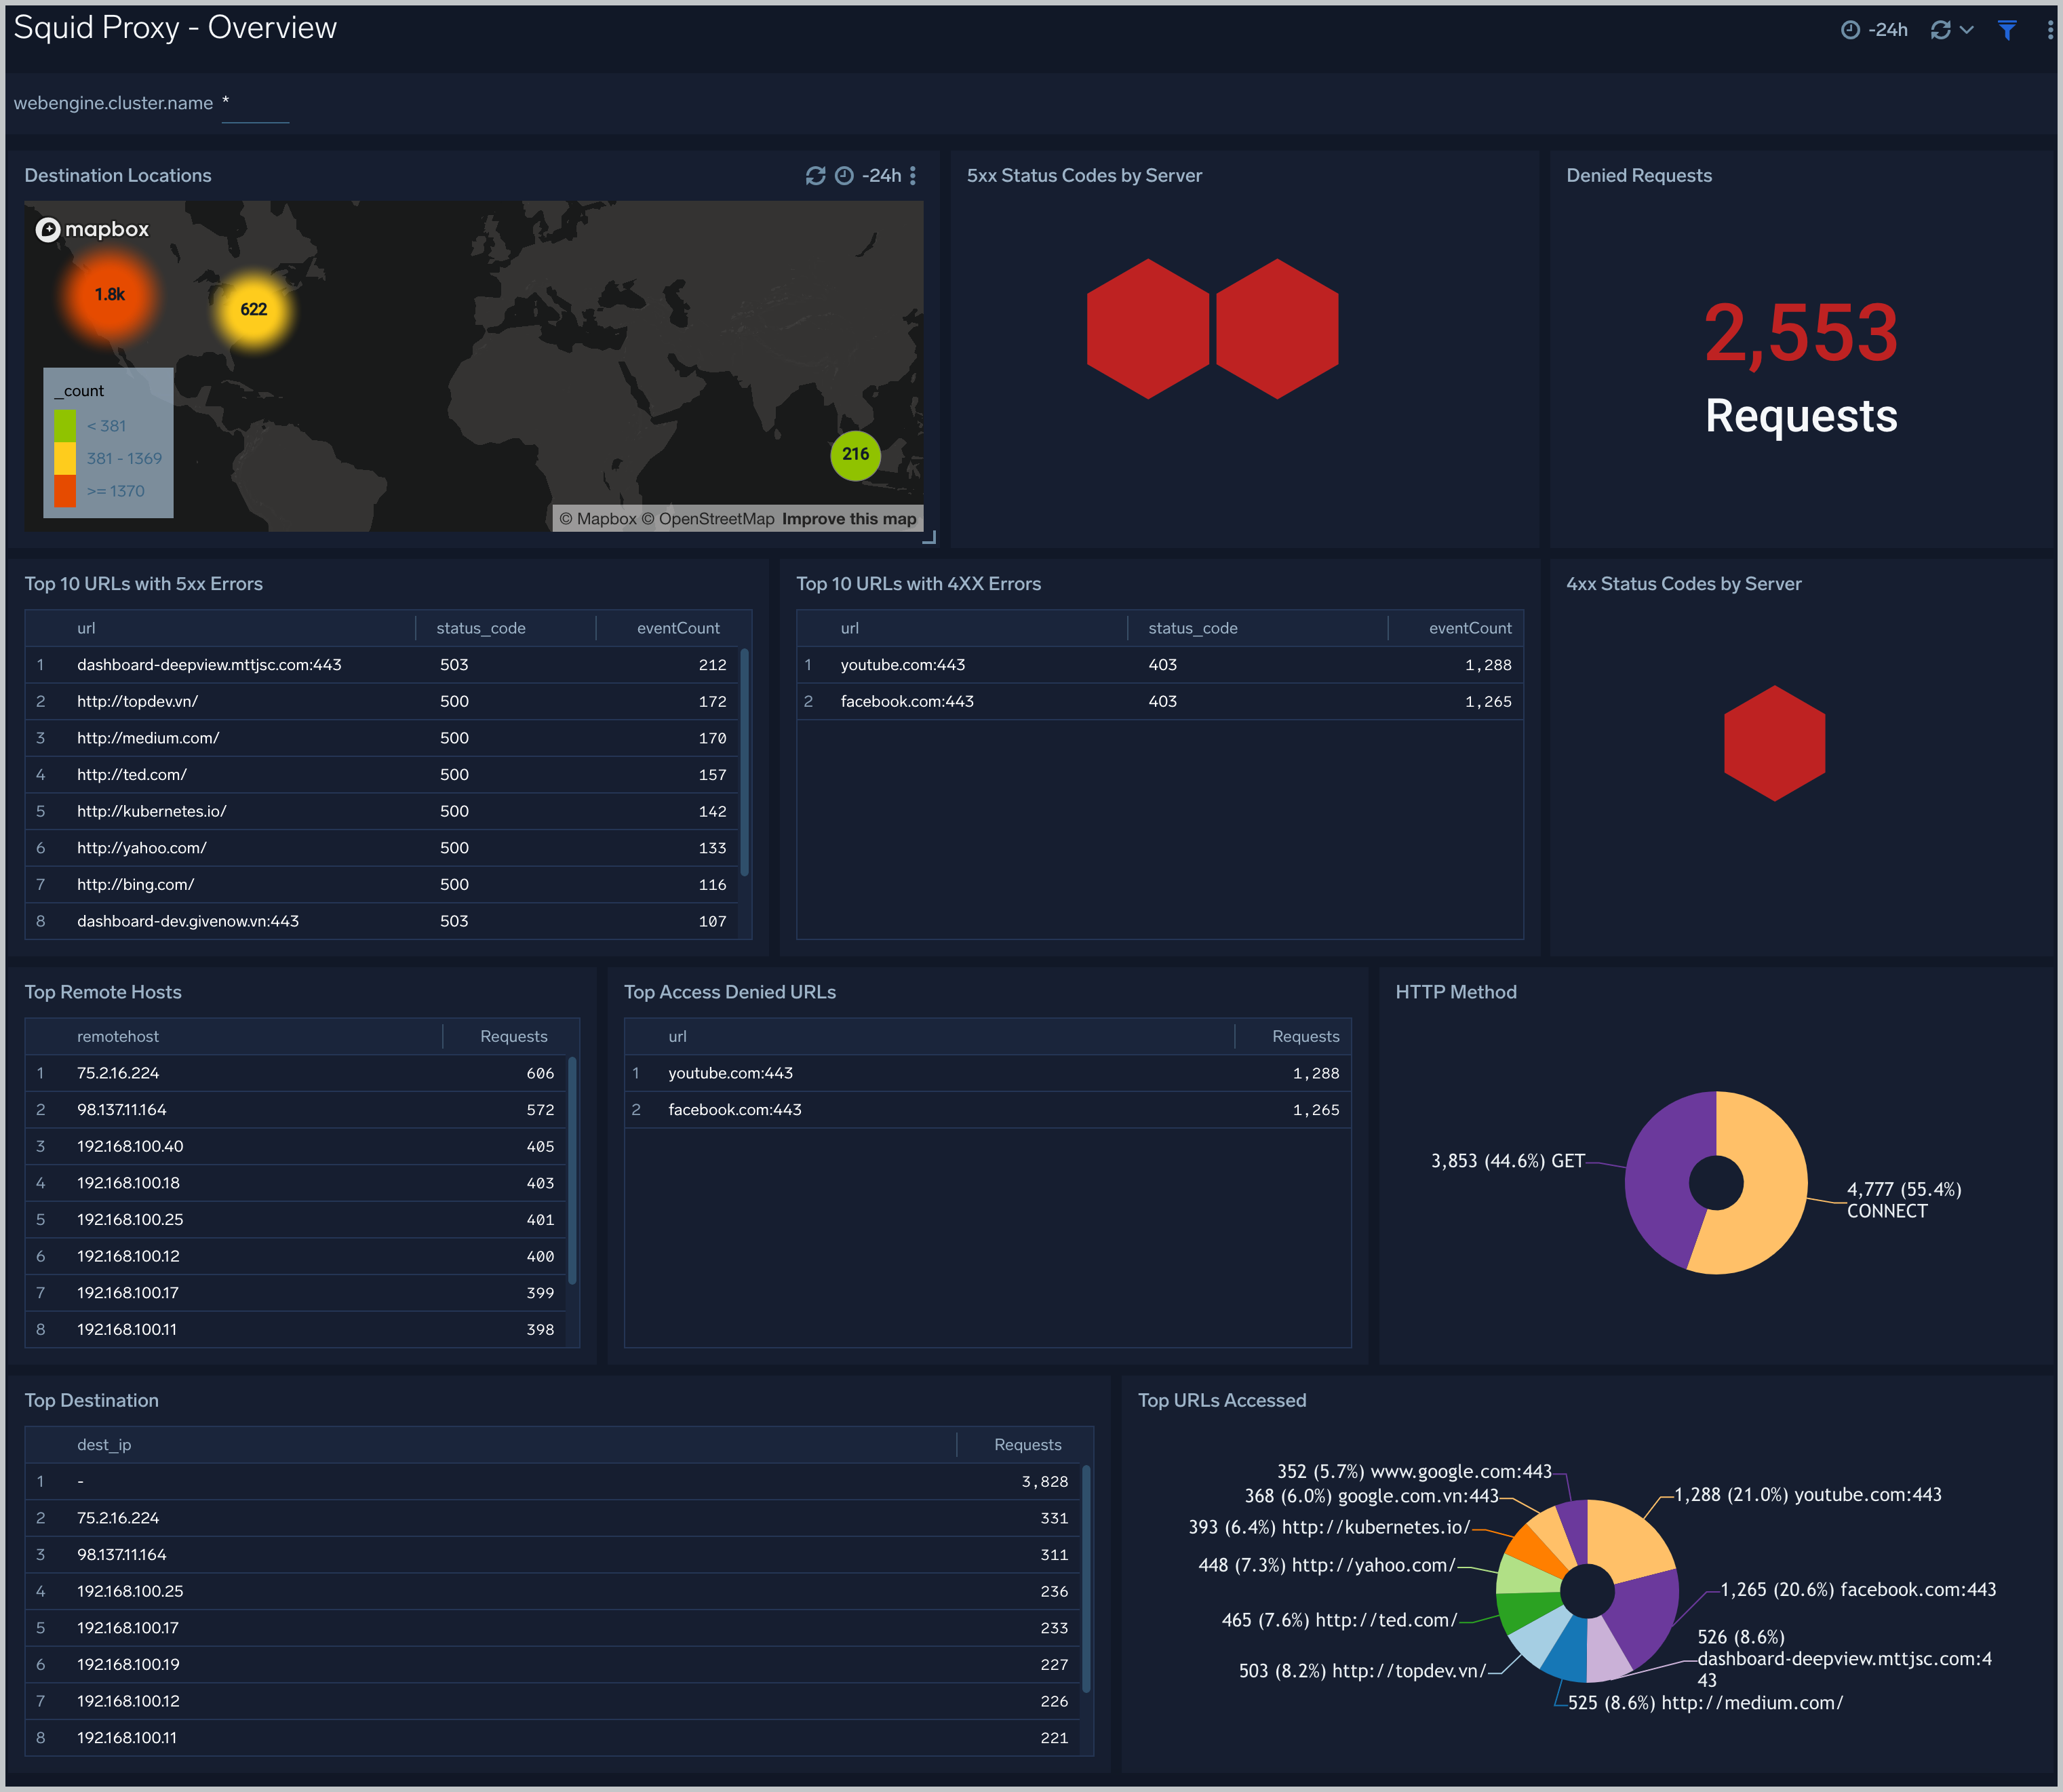
Overview
The Squid Proxy - Overview Dashboard provides an at-a-glance view of the activity and health of the SquidProxy clusters and servers by destination locations, error and denied requests, URLs accessed.
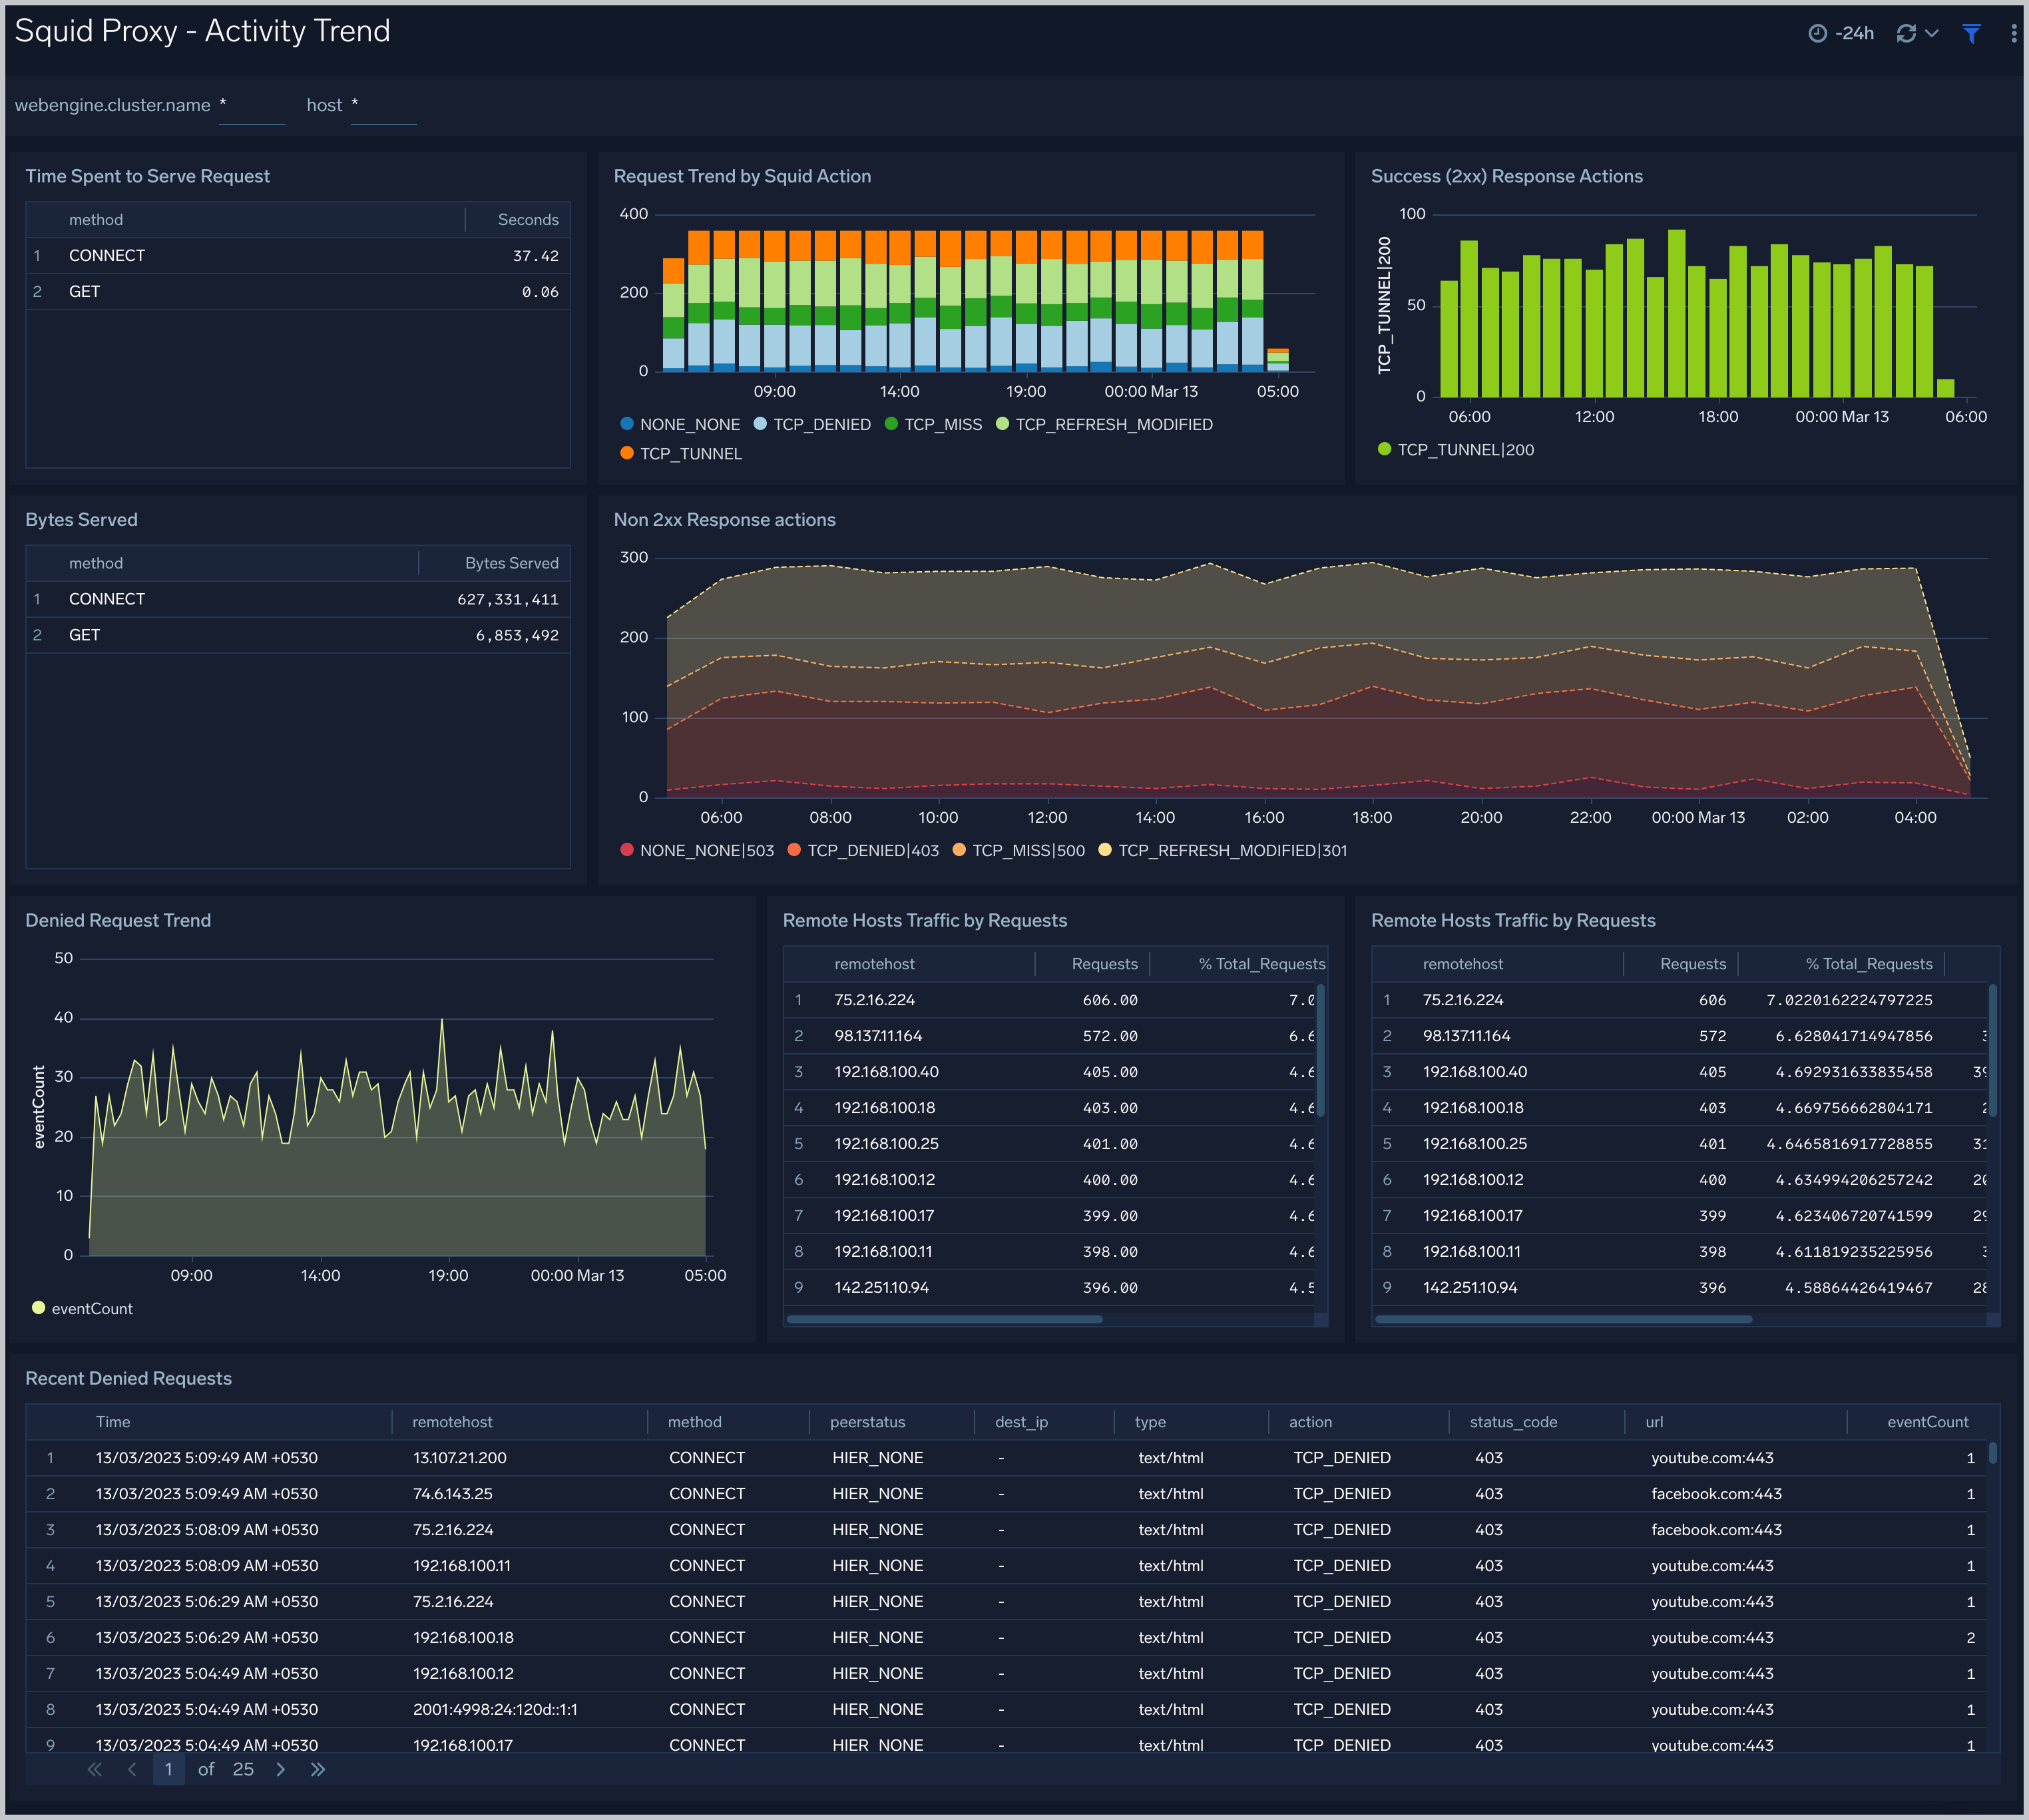
Activity Trend
the Squid Proxy - Activity Trend dashboard provides trends around denied request trend, action trend, time spent to serve, success and non-success response, remote hosts.
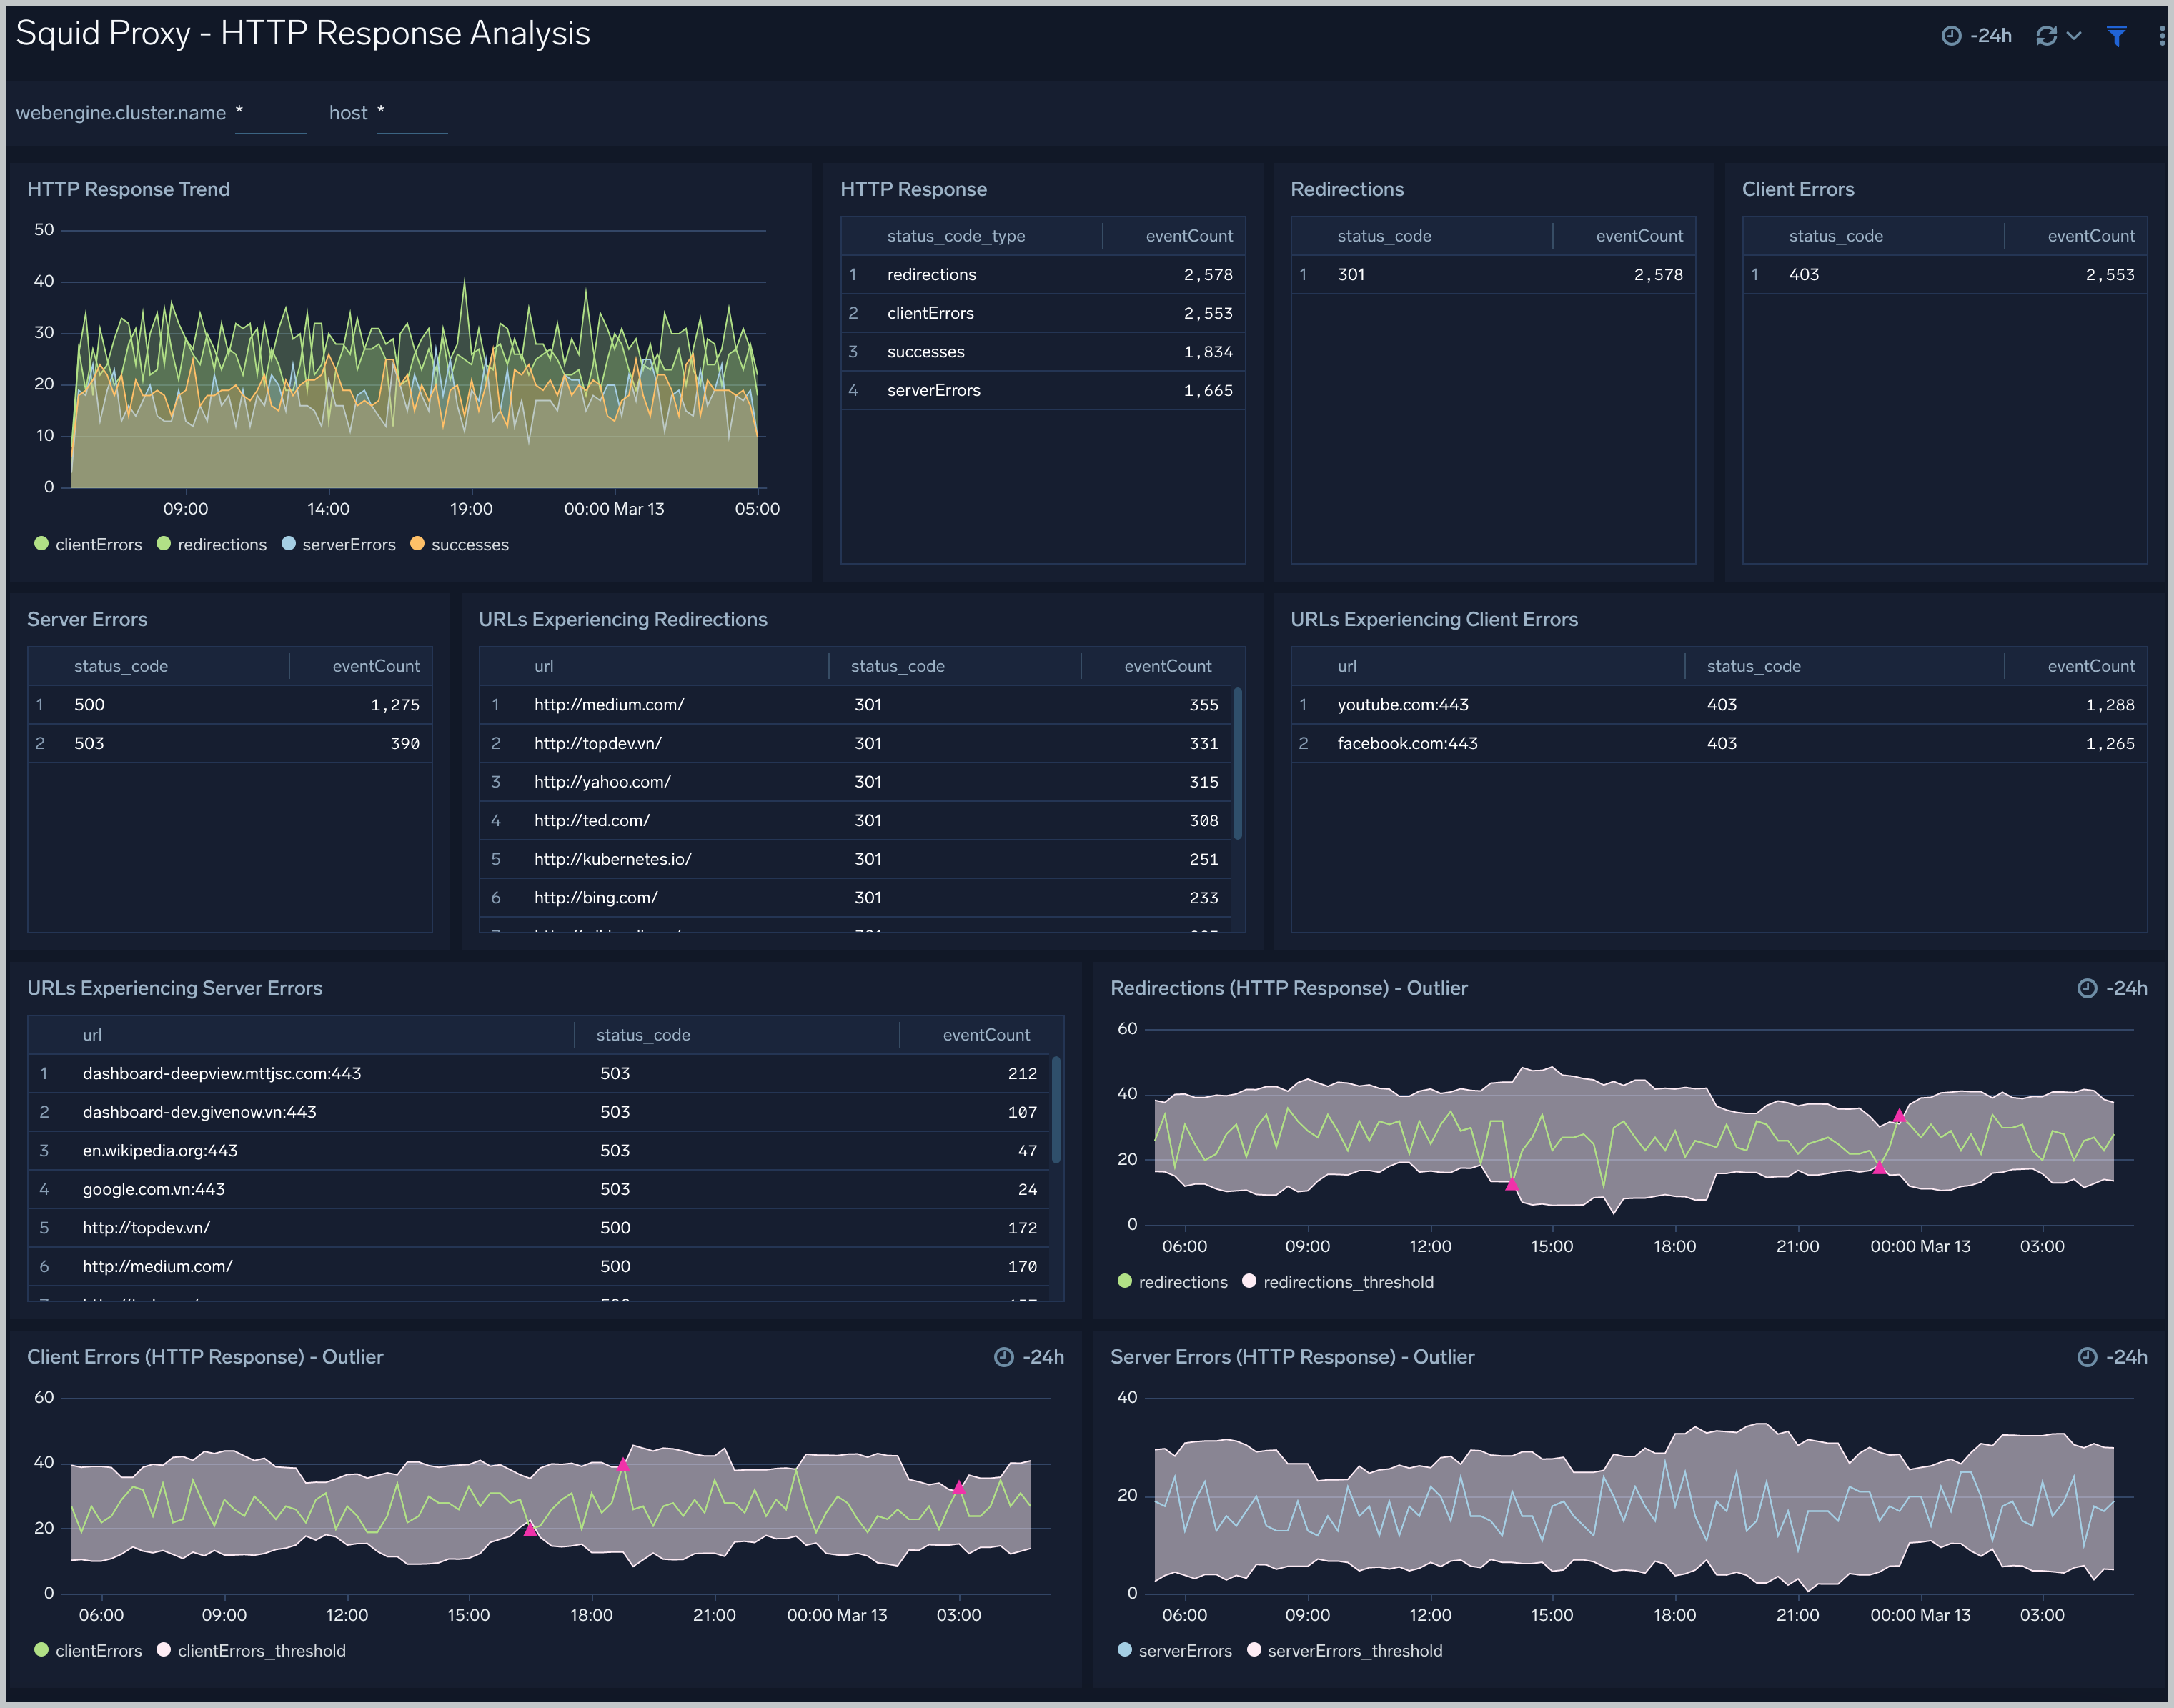
HTTP Response Analysis
The The Squid Proxy - HTTP Response Analysis dashboard provides insights into HTTP response, HTTP code, the number of client errors, server errors, redirections outlier, URLs experiencing server errors.
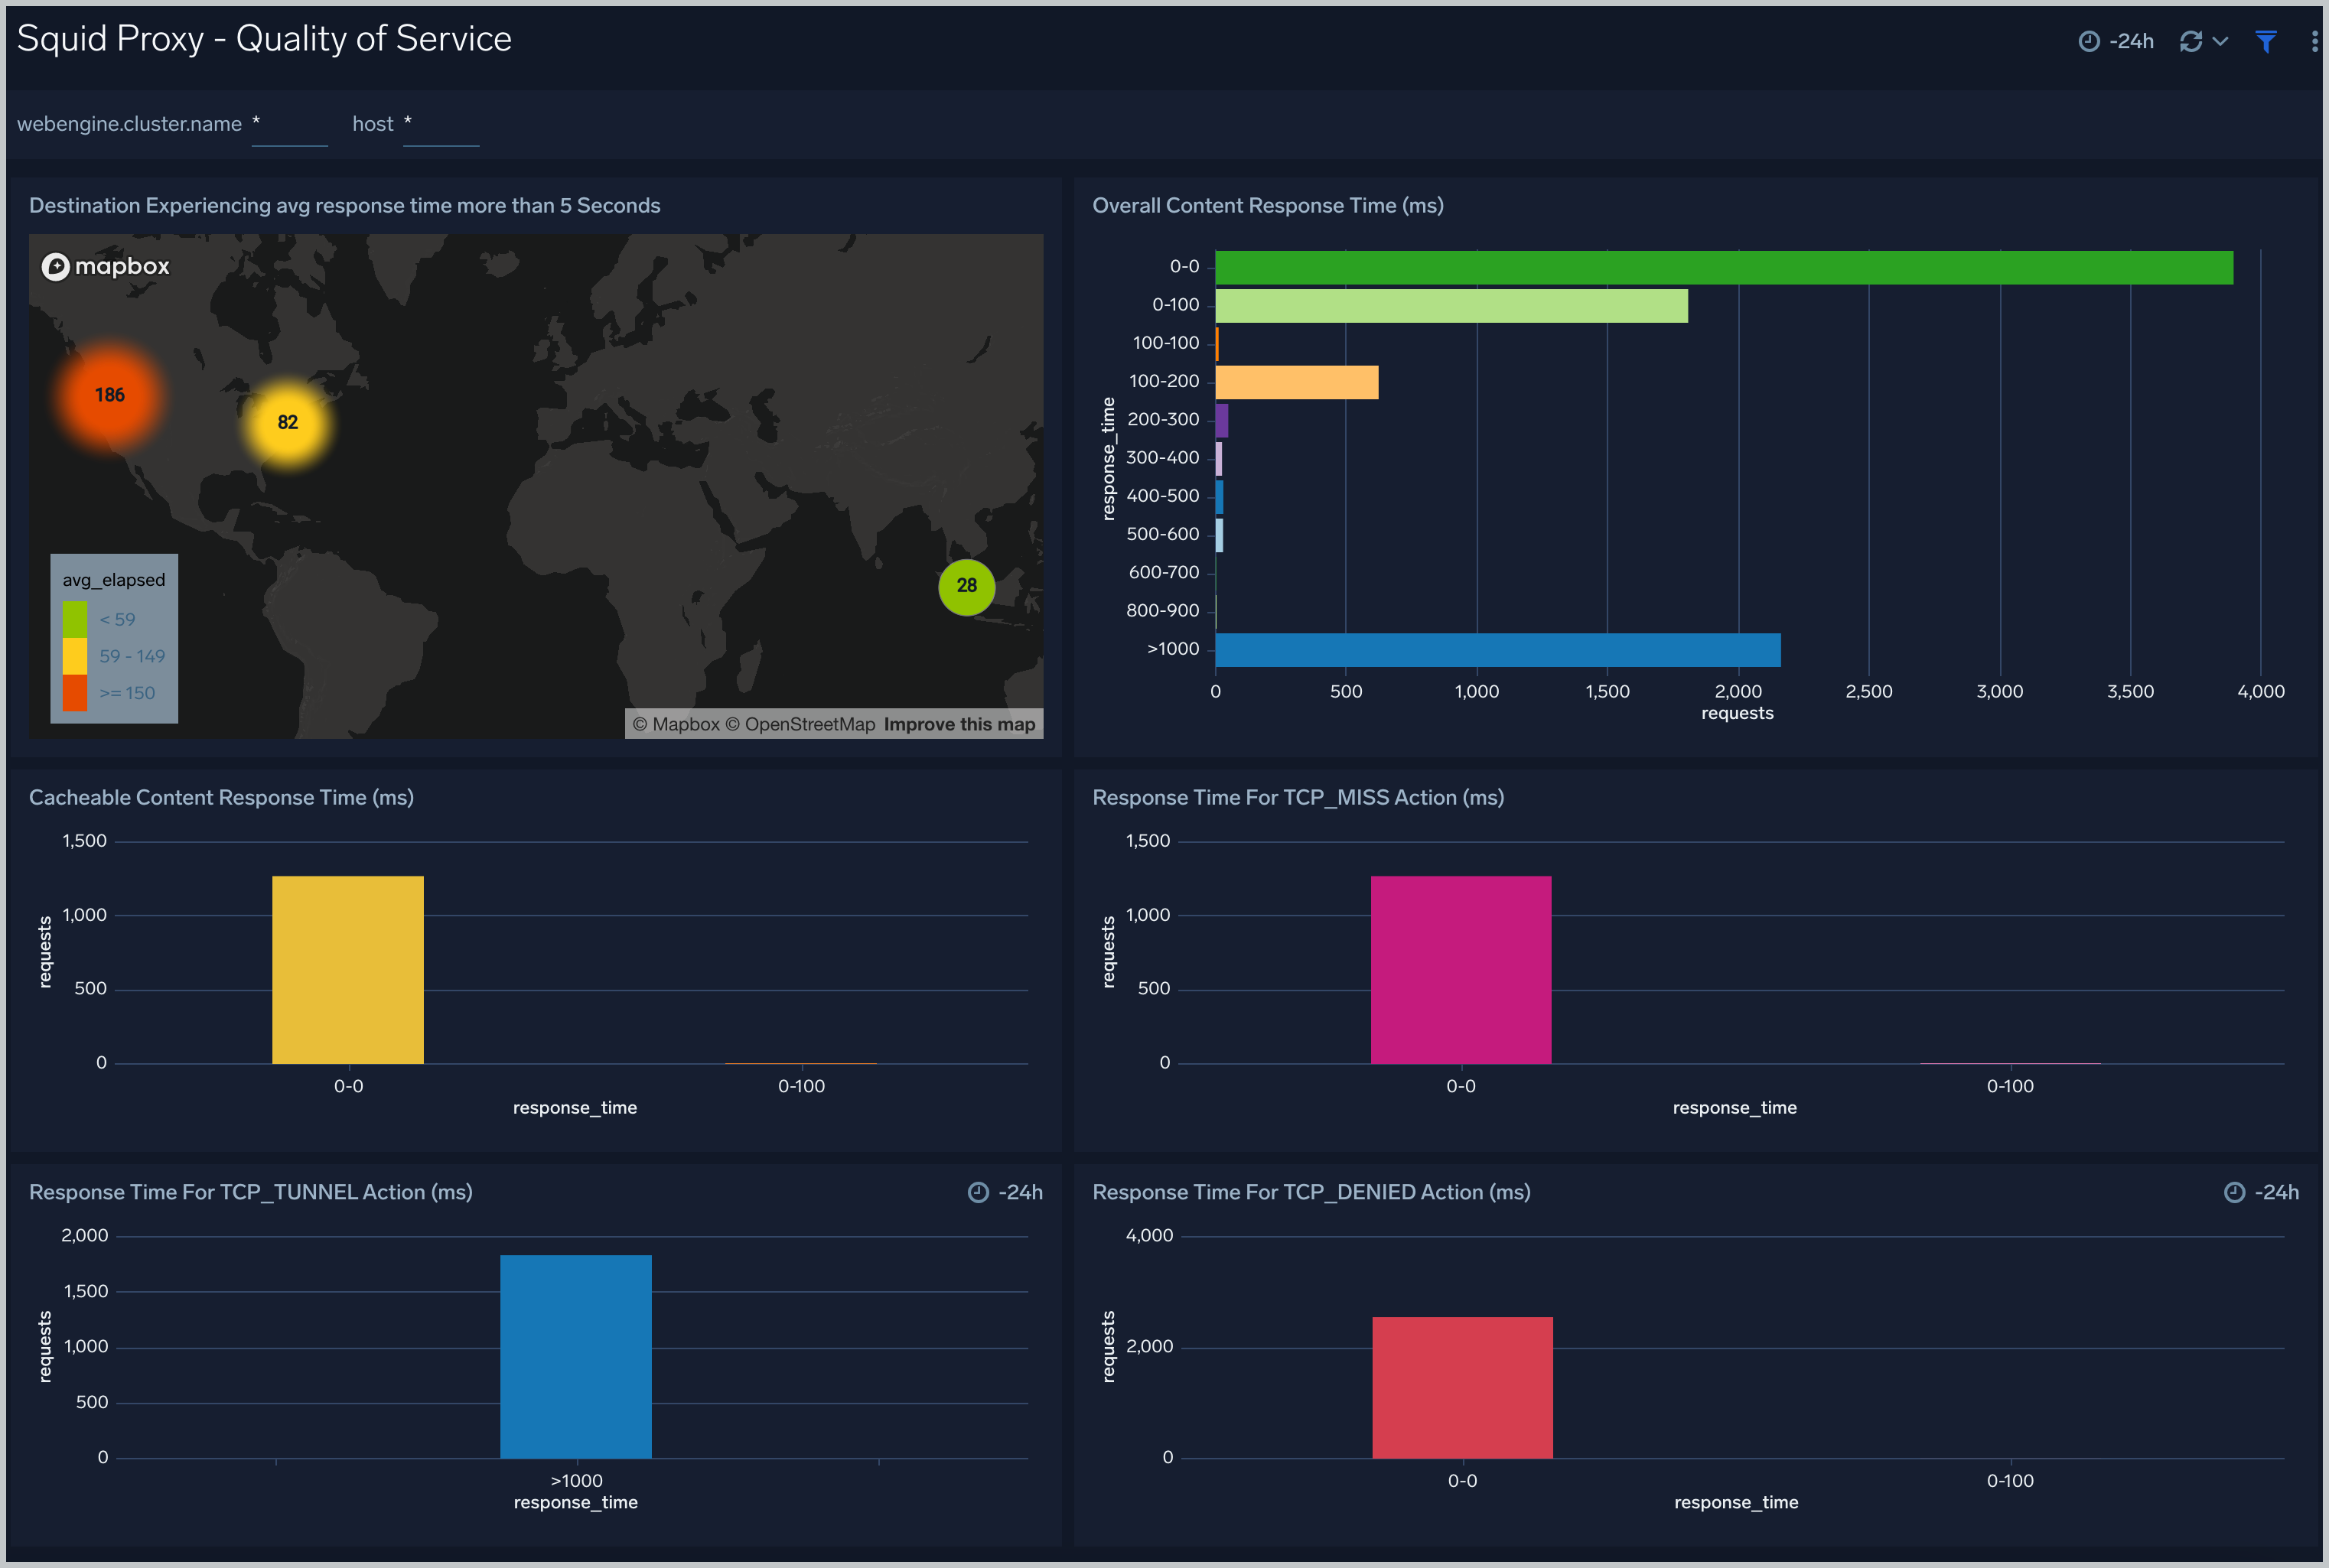
Quality of Service
The Squid Proxy - Quality of Service dashboard provides insights into latency, the response time of requests according to HTTP action, and the response time according to location.
Create monitors for SquidProxy app
From your App Catalog:
- From the Sumo Logic navigation, select App Catalog.
- In the Search Apps field, search for and then select your app.
- Make sure the app is installed.
- Navigate to What's Included tab and scroll down to the Monitors section.
- Click Create next to the pre-configured monitors. In the create monitors window, adjust the trigger conditions and notifications settings based on your requirements.
- Scroll down to Monitor Details.
- Under Location click on New Folder.
note
By default, monitor will be saved in the root folder. So to make the maintenance easier, create a new folder in the location of your choice.
- Enter Folder Name. Folder Description is optional.
tip
Using app version in the folder name will be helpful to determine the versioning for future updates.
- Click Create. Once the folder is created, click on Save.
SquidProxy alerts
| Name | Description | Alert Condition | Recover Condition |
|---|---|---|---|
Squid Proxy - High Client (HTTP 4xx) Error Rate | This alert is triggered when there are too many HTTP requests (>5%) with a response status of 4xx. | Count > 0 | Count <= 0 |
Squid Proxy - High Denied Request | This alert is triggered when there are too many HTTP denied requests (>5%). | Count > 0 | Count <= 0 |
Squid Proxy - High Response Time | This alert is triggered when requests are taking too long to process. | Count > 20 | Count <= 20 |
Squid Proxy - High Server (HTTP 5xx) Error Rate | This alert is triggered when there are too many HTTP requests (>5%) with a response status of 5xx. | Count > 0 | Count <= 0 |