Varnish - OpenTelemetry Collector

The Sumo Logic app for Varnish provides dashboards that help you analyze logs generated by Varnish servers. This app allows you to identify traffic sources, improve application and website workflows, and understand how customers use your product.
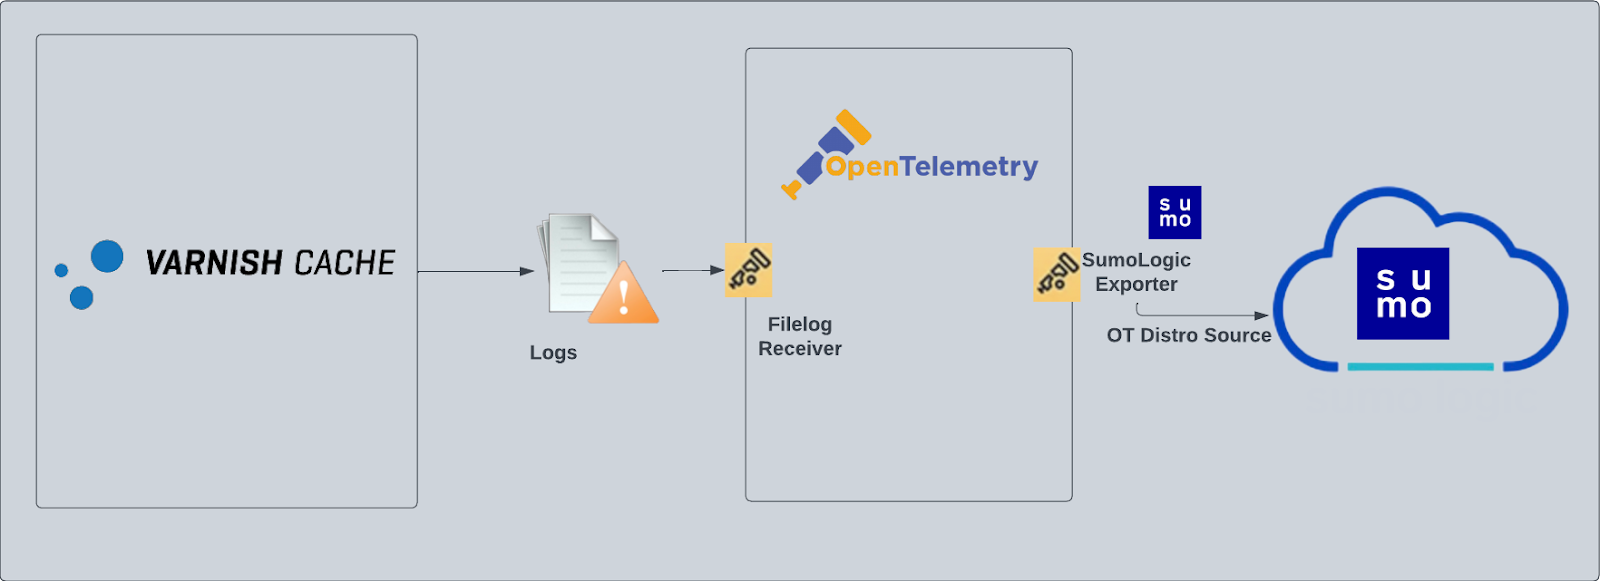
Varnish logs are sent to Sumo Logic through OpenTelemetry filelog receiver.
Fields creation in Sumo Logic for Varnish
webengine.cluster.name. User configured. Enter a name to identify this Varnish cluster. This cluster name will be shown in the Sumo Logic dashboards.webengine.system. Has a fixed value of varnish.sumo.datasource. Has a fixed value of varnish.
Prerequisites
- Configure logging in Varnish. Varnish supports logging via local text log files. For details visit this page. For the dashboards to work properly, set the Varnish log format as explained here:
%h %l %u %t \"%r\" %s %b \"%{Referer}i\" \"%{User-agent}i\" - Configure Varnish to log to a local file. By default, any installation of varnishd will not write any request logs to disk. Instead, Varnish has an in-memory log, and supplies tools to tap into this log and write to disk. To configure logging to a local file, follow the steps here. By default, Varnish logs are stored in
/var/log/varnish/varnishncsa.log. For customized options, visit this page.
For Linux systems with ACL Support, the otelcol install process should have created the ACL grants necessary for the otelcol system user to access default log locations. You can verify the active ACL grants using the getfacl command. Install the ACL in your Linux environment, if not installed.
The required ACL may not be supported for some rare cases, for example, Linux OS Distro, which is officially not supported by Sumo Logic. In this case, you can run the following command to explicitly grant the permissions.
sudo setfacl -R -m d:u:otelcol-sumo:r-x,d:g:otelcol-sumo:r-x,u:otelcol-sumo:r-x,g:otelcol-sumo:r-x <PATH_TO_LOG_FILE>
Run the above command for all the log files in the directory that need to be ingested, which are not residing in the default location.
If Linux ACL Support is not available, traditional Unix-styled user and group permission must be modified. It should be sufficient to add the otelcol system user to the specific group that has access to the log files.
Collection configuration and app installation
As part of data collection setup and app installation, you can select the App from App Catalog and click on Install App. Follow the steps below.
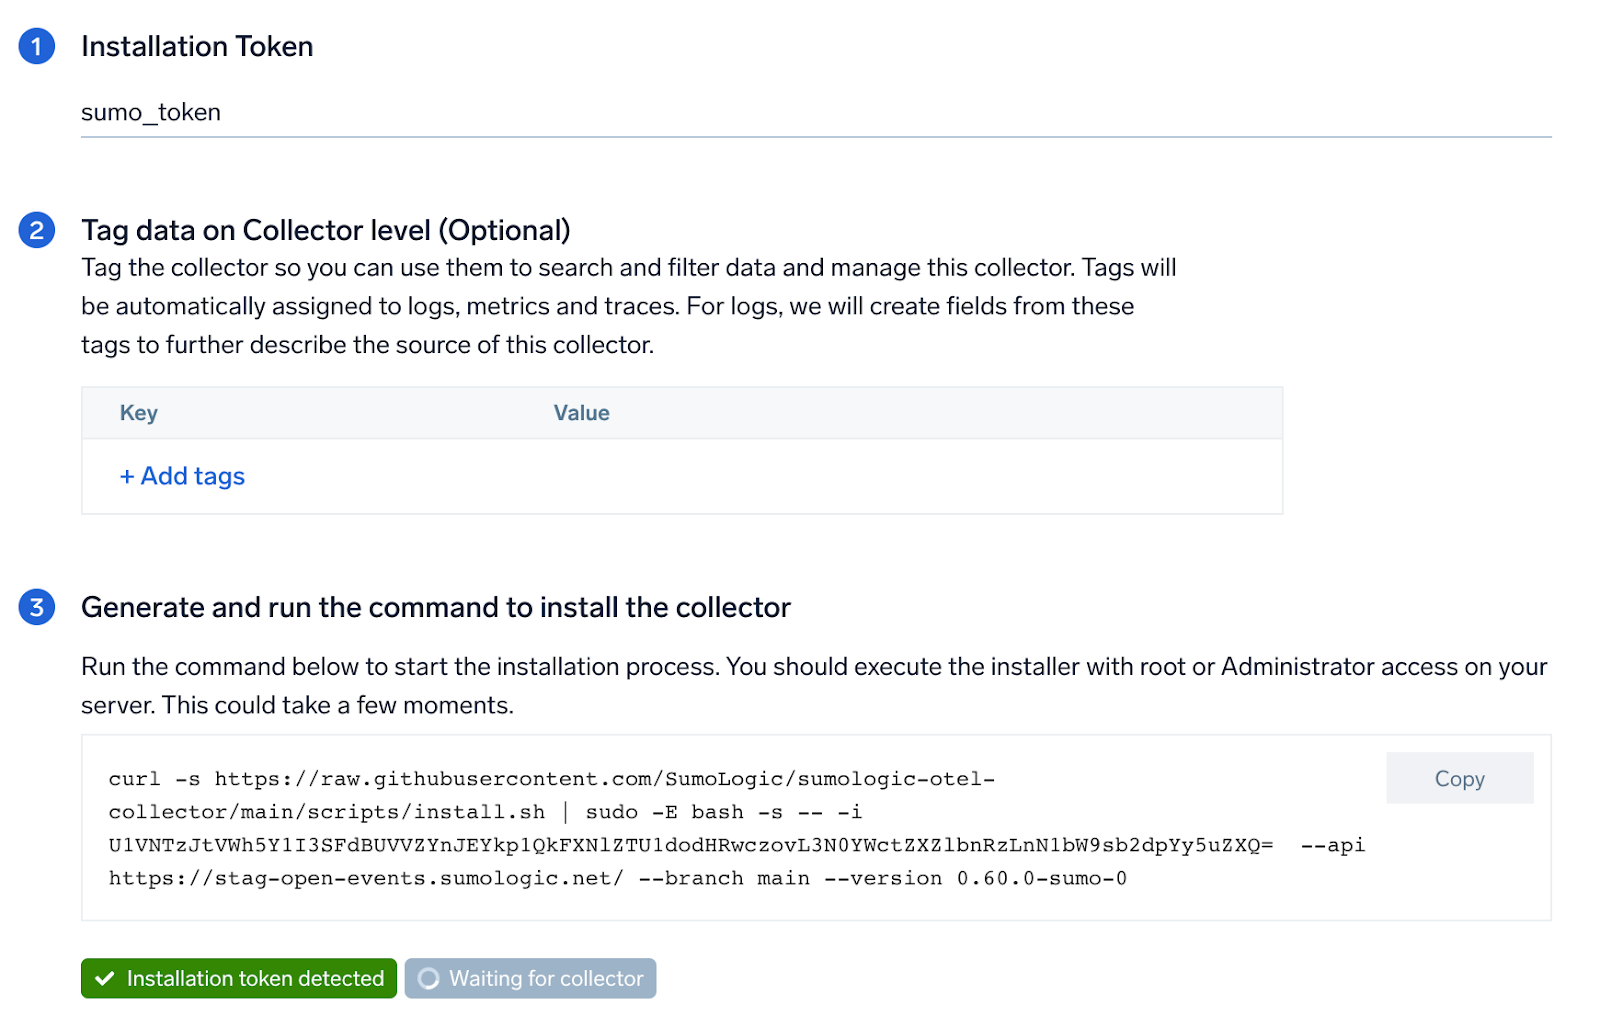
Step 1: Set up Collector
If you want to use an existing OpenTelemetry Collector, you can skip this step by selecting the Use an existing Collector option.
To create a new Collector:
- Select the Add a new Collector option.
- Select the platform where you want to install the Sumo Logic OpenTelemetry Collector.
This will generate a command that you can execute in the machine environment you need to monitor. Once executed, it will install the Sumo Logic OpenTelemetry Collector.
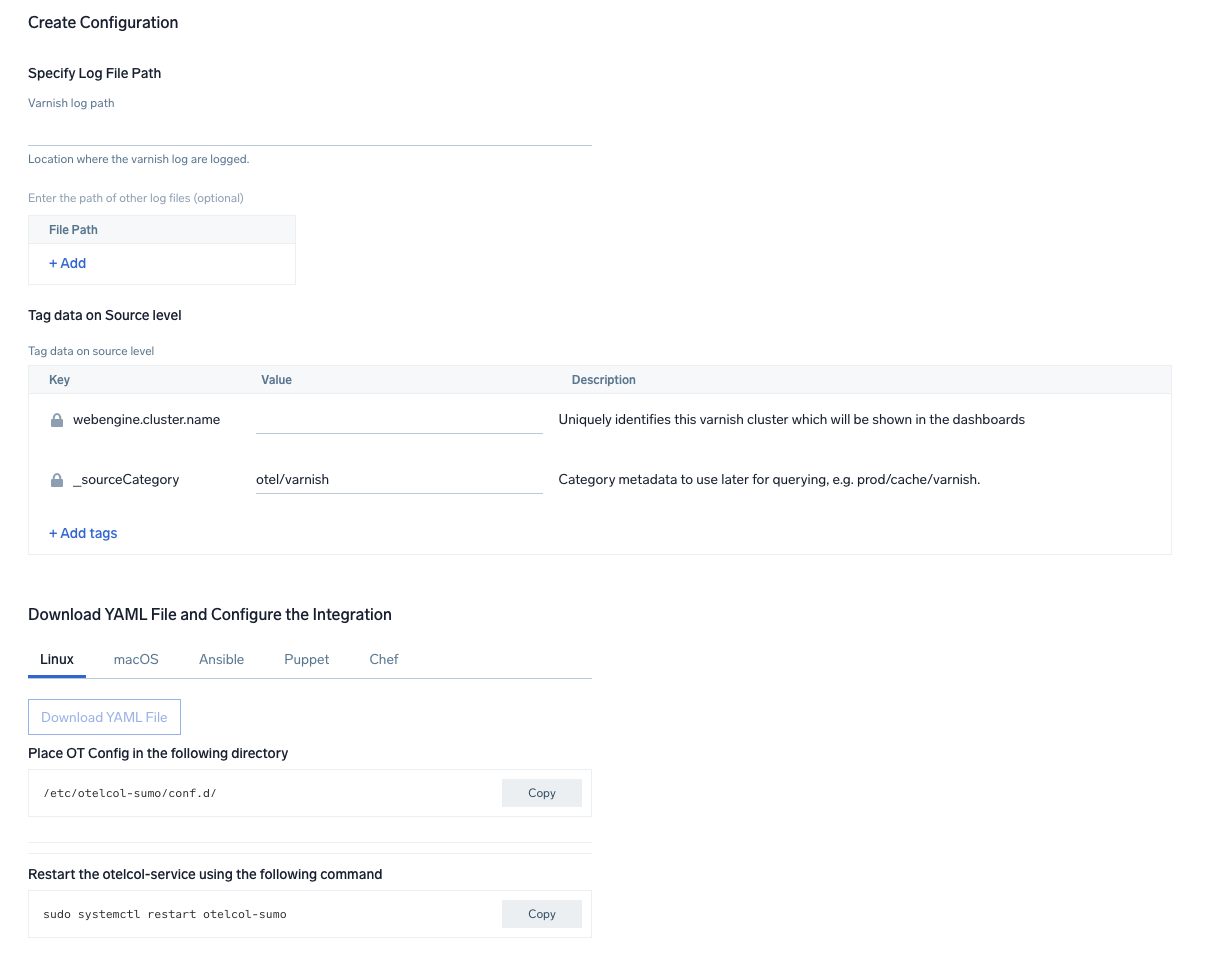
Step 2: Configure integration
OpenTelemetry works with a configuration yaml file which has all the details with respect to the data which needs to be collected. For example, it specifies the location of a log file that is read and sent to the Sumo Logic platform.
In this step, you will configure the yaml required for Varnish Collection. You'll need to provide the path of the log file configured to capture Varnish logs.
The files are located in /var/log/varnish/varnishncsa.log by default. For more details, refer the the Prerequisites section of this page. You can add any custom fields which you want to tag along with the data ingested in Sumo. Click on the Download YAML File button to get the yaml file.
Step 3: Send logs to Sumo Logic
Once you have downloaded the YAML file as described in the previous step, follow the below steps based on your platform.
- Linux
- macOS
- Chef
- Ansible
- Puppet
- Copy the yaml at
/etc/otelcol-sumo/conf.d/folder in the Varnish instance which needs to be monitored. - Restart the otelcol-sumo process using the below command
sudo systemctl restart otelcol-sumo
- Copy the yaml at
/etc/otelcol-sumo/conf.d/folder in the Varnish instance which needs to be monitored. - Restart the otelcol-sumo process using the below command.
otelcol-sumo --config /etc/otelcol-sumo/sumologic.yaml --conf "glob:/etc/otelcol-sumo/conf.d/*.yaml"
- Copy the yaml file into your Chef cookbook files directory
files/<downloaded_yaml_file>. - Use a Chef file resource in a recipe to manage it.
cookbook_file '/etc/otelcol-sumo/conf.d/<downloaded_yaml_file>' do mode 0644 notifies :restart, 'service[otelcol-sumo]', :delayed end - Add the recipe to your collector setup to start collecting the data. Every team typically has their established way of applying the Chef recipe. The resulting Chef recipe should look something like:
cookbook_file '/etc/otelcol-sumo/conf.d/<downloaded_yaml_file>' do
mode 0644
notifies :restart, 'service[otelcol-sumo]', :delayed
end
- Place the file into your Ansible playbook files directory.
- Run the Ansible playbook.
ansible-playbook -i inventory install_sumologic_otel_collector.yaml
-e '{"installation_token": "<YOUR_TOKEN>", "collector_tags": {<YOUR_TAGS>}, "src_config_path": "files/conf.d"}'
- Place the file into your Puppet module files directory
modules/install_otel_collector/files/<downloaded_yaml>. - Use a Puppet file resource to manage it.
file { '/etc/otelcol-sumo/conf.d/<downloaded_yaml_file>':
    ensure => present,
    source => 'puppet:///modules/install_otel_collector/<downloaded_yaml_file>',
    mode => '0644',
    notify => Service[otelcol-sumo],
} - Apply the Puppet manifest. Every team typically has their established way of applying the Puppet manifest. The resulting Puppet manifest should look something like:
node 'default' {
    class { 'install_otel_collector'
      installation_token => '<YOUR_TOKEN>',
      collector_tags => { <YOUR_TAGS> },
    }

    service { 'otelcol-sumo':
      provider => 'systemd',
      ensure => running,
      enable => true,
      require => Class['install_otel_collector'],
    }

    file { '/etc/otelcol-sumo/conf.d/<downloaded_yaml_file>':
      ensure => present,
      source => 'puppet:///modules/install_otel_collector/<downloaded_yaml_file>',
      mode => '0644',
      notify => Service[otelcol-sumo],
    }
  }
After successfully executing the above command, Sumo Logic will start receiving data from your host machine.
Click Next. This will install the app (dashboards and monitors) to your Sumo Logic Org.
Dashboard panels will start to fill automatically. It's important to note that each panel fills with data matching the time range query and received since the panel was created. Results won't immediately be available, but within 20 minutes, you'll see full graphs and maps.
Sample log messages in Non-Kubernetes environments
175.120.107.250 - - [24/Jan/2023:14:37:44 +0530] "POST /_media/resource_thumb_video_my_v2_homepage.jpg HTTP/1.1" 404 99737883 "http://yahoo.com/5.0 (iPad; CPU OS 6_0 like Mac OS X) AppleWebKit/536.26 (KHTML, like Gecko) Version/6.0 Mobile/10A5355d Safari/8536.25"
Sample queries
This sample query is from the Varnish Overview - Traffic Volume dashboard > MB Served Over Time panel.
%"sumo.datasource"=varnish %"webengine.system"=varnish %"webengine.cluster.name"=* | json "log" as _rawlog nodrop
| if (isEmpty(_rawlog), _raw, _rawlog) as _raw
| parse regex "(?<client_ip>\d{1,3}\.\d{1,3}\.\d{1,3}\.\d{1,3})\s+(?<logname>\S+)\s+(?<user>[\S]+)\s+\[" nodrop
| parse regex "(?<remote_ip>\d{1,3}\.\d{1,3}\.\d{1,3}\.\d{1,3})\s+(?<local_ip>\d{1,3}\.\d{1,3}\.\d{1,3}\.\d{1,3})\s+(?<logname>\S+)\s+(?<user>[\S]+)\s+\[" nodrop
| parse regex "\s+\[(?<date>[^\]]+)\]\s+\"(?<method>\w+)\s+(?<uri>\S+)\s+(?<protocol>\S+)\"\s+(?<status_code>\d+)\s+(?<size>[\d-]+)" nodrop
| parse regex "\"(?<referrer>http[s]{0,1}:[^\"\?]+?)(?:\"|\?)"
| where size != "-"
| timeslice 5m
|  (size/(1024*1024)) as Megabytes
|  count as hits, sum(Megabytes) as Megabytes by _timeslice
| sort _timeslice asc
Viewing Varnish dashboards
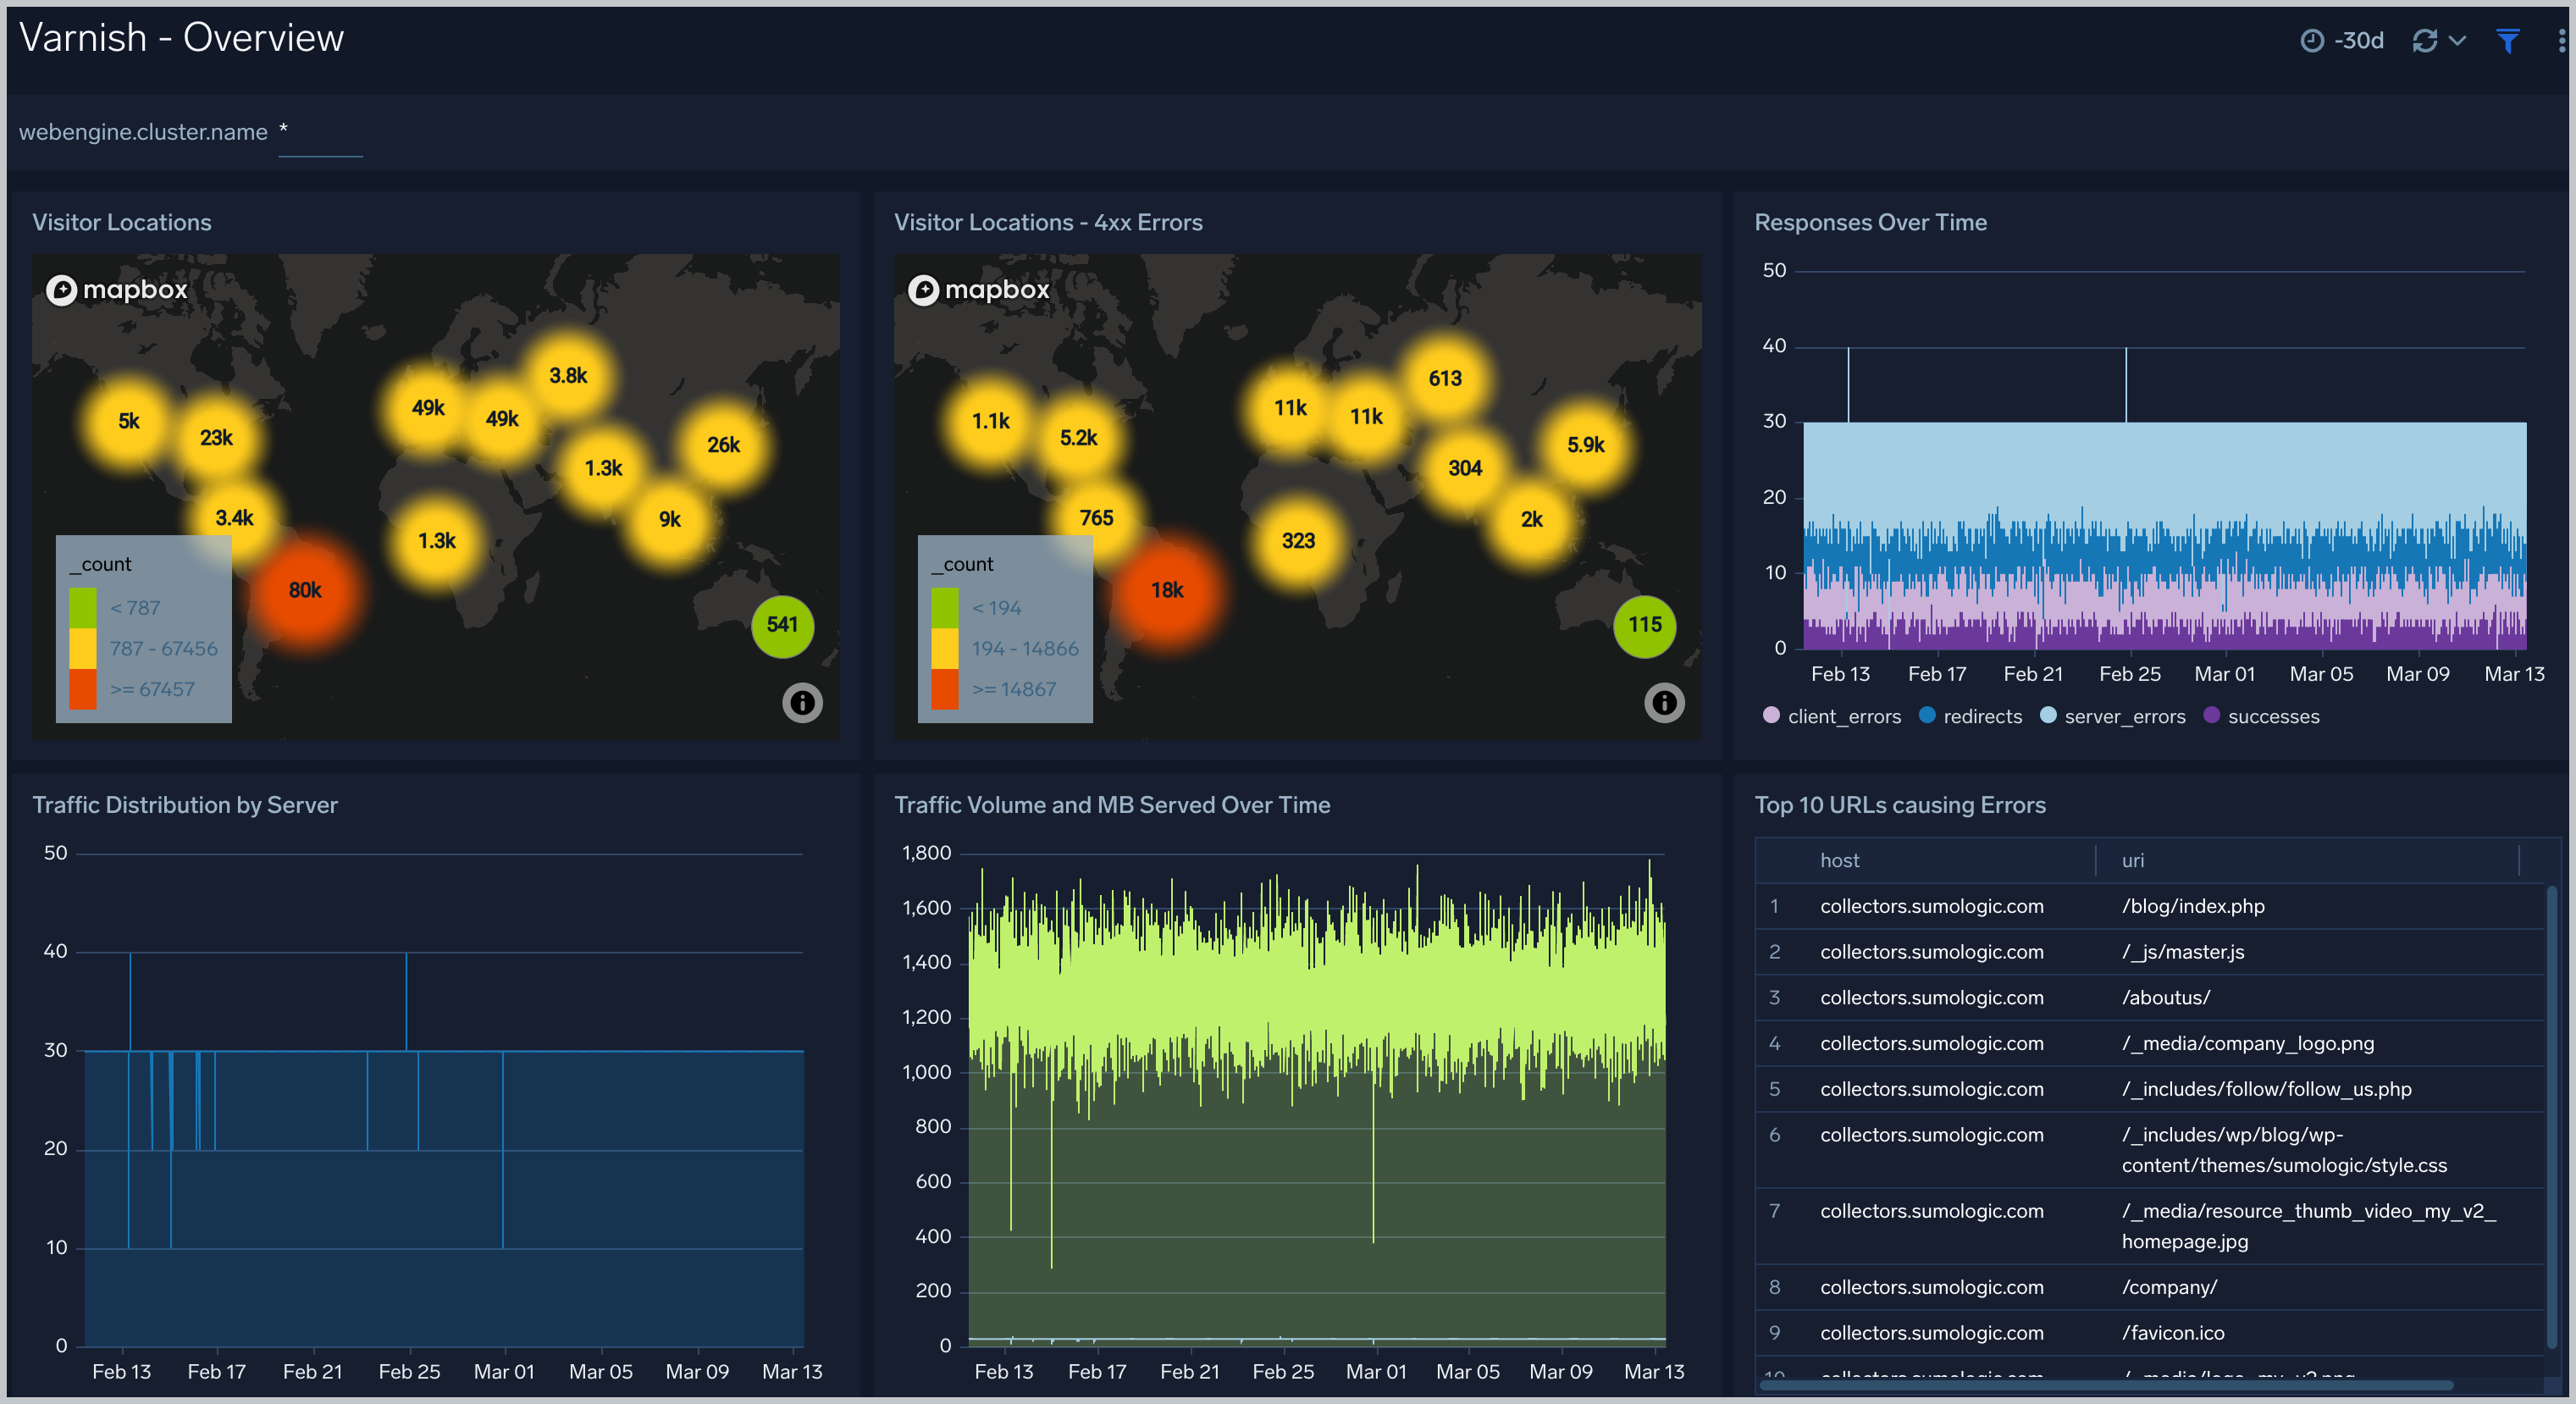
Overview
The Varnish - Overview dashboard provides a high-level view of the activity and health of Varnish servers on your network. Dashboard panels display visual graphs and detailed information on visitor geographic locations, traffic volume and distribution, responses over time, as well as time comparisons for visitor locations and uptime, cache hit, requests, and VLC.
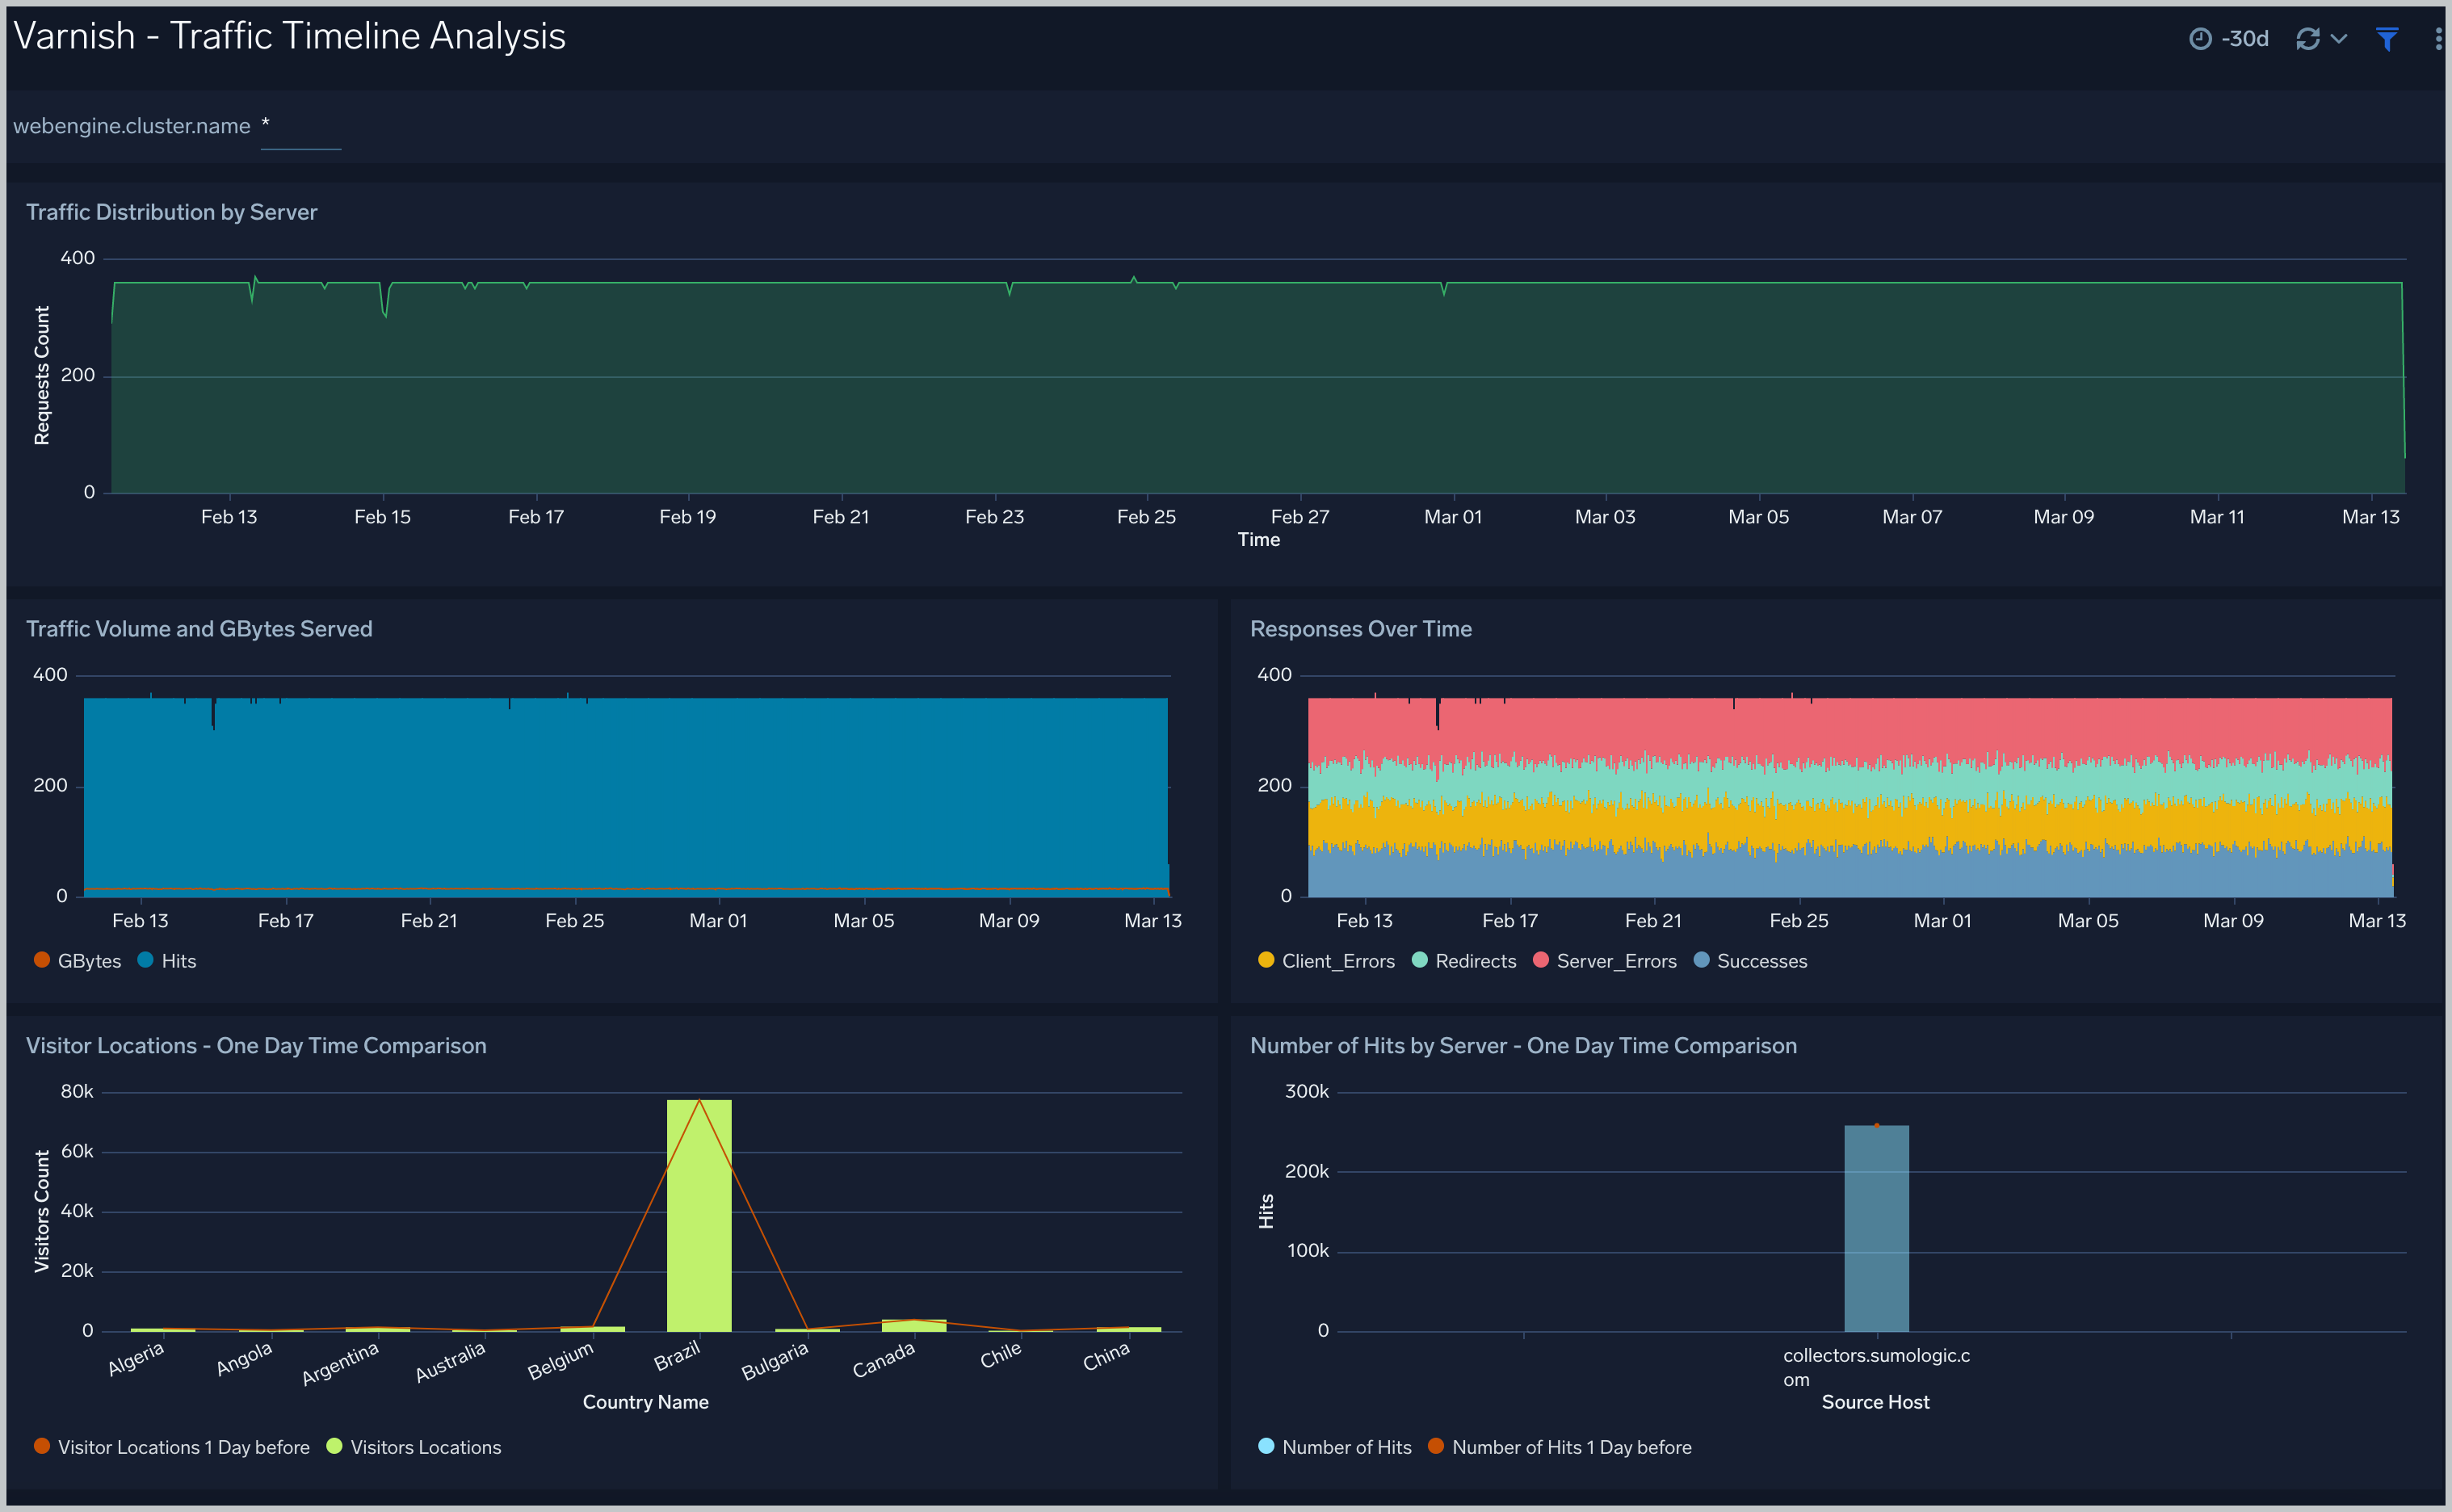
Traffic Timeline Analysis
The Varnish - Logs Timeline Analysis dashboard provides a high-level view of the activity and health of Varnish servers on your network. Dashboard panels display visual graphs and detailed information on traffic volume and distribution, responses over time, as well as time comparisons for visitor locations and server hits.
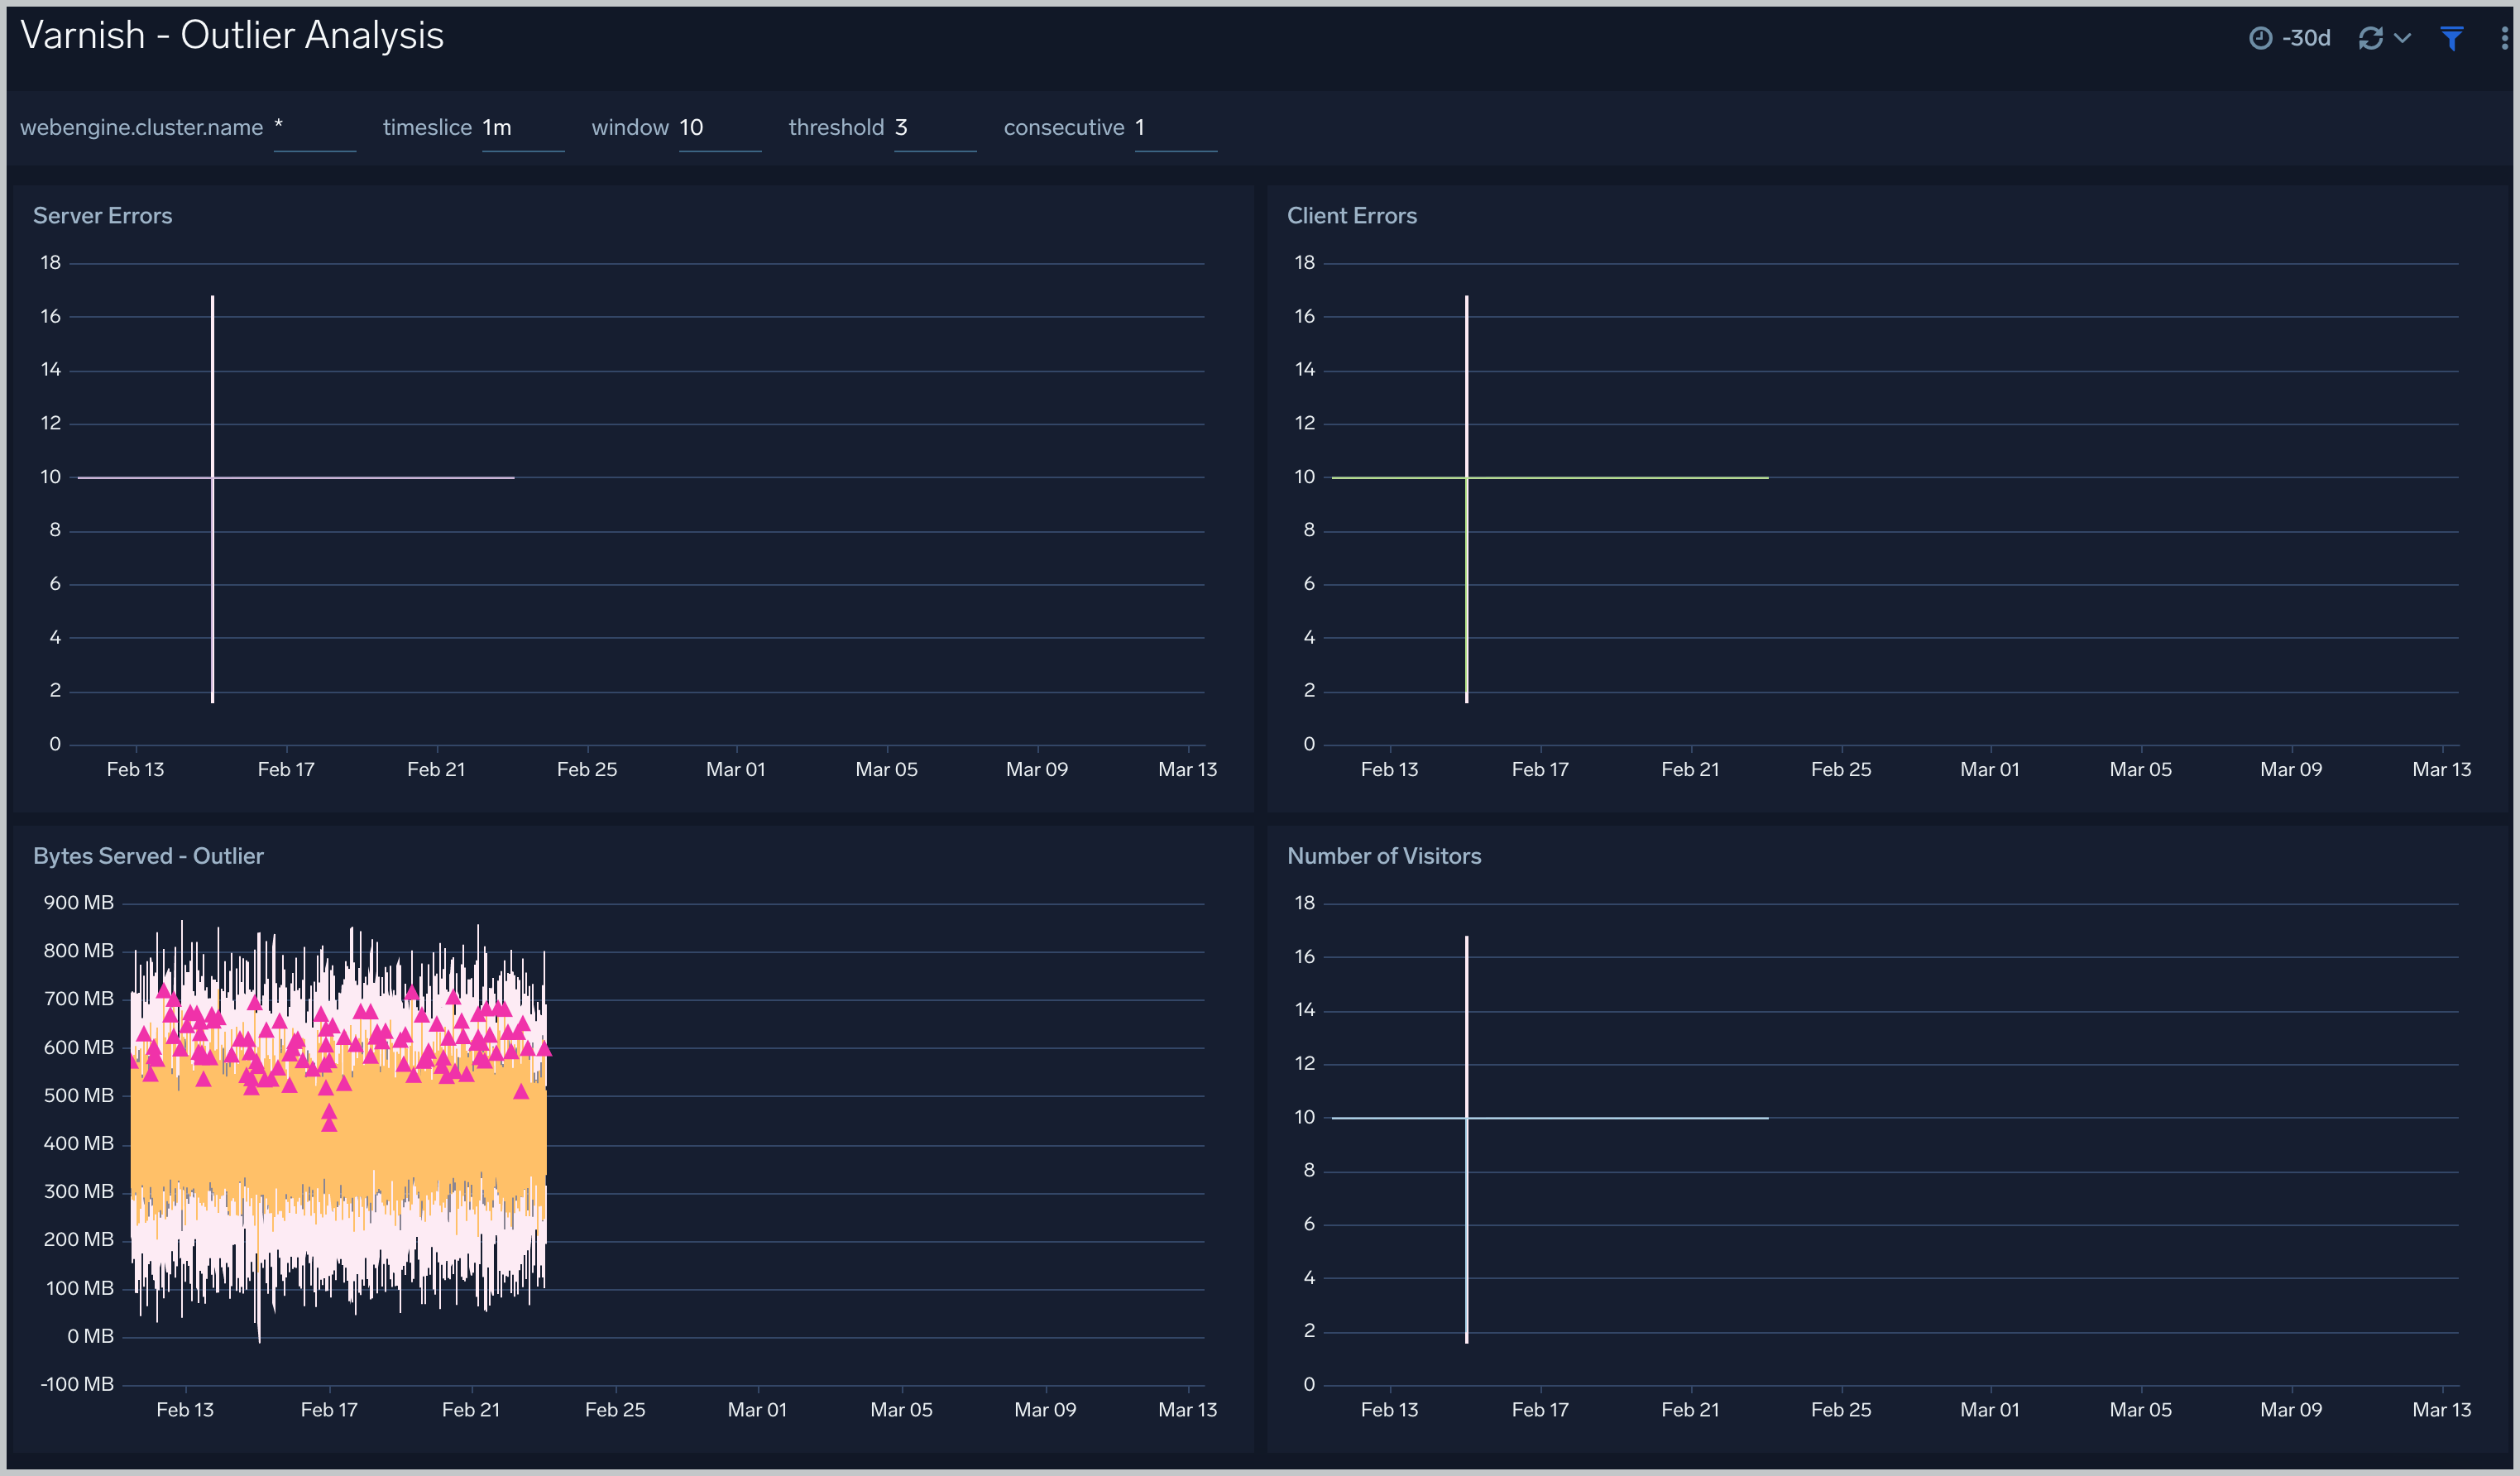
Outlier Analysis
The Varnish - Outlier Analysis dashboard provides a high-level view of Varnish server outlier metrics for bytes served, number of visitors, and server errors. You can select the time interval over which outliers are aggregated, then hover the cursor over the graph to display detailed information for that point in time.
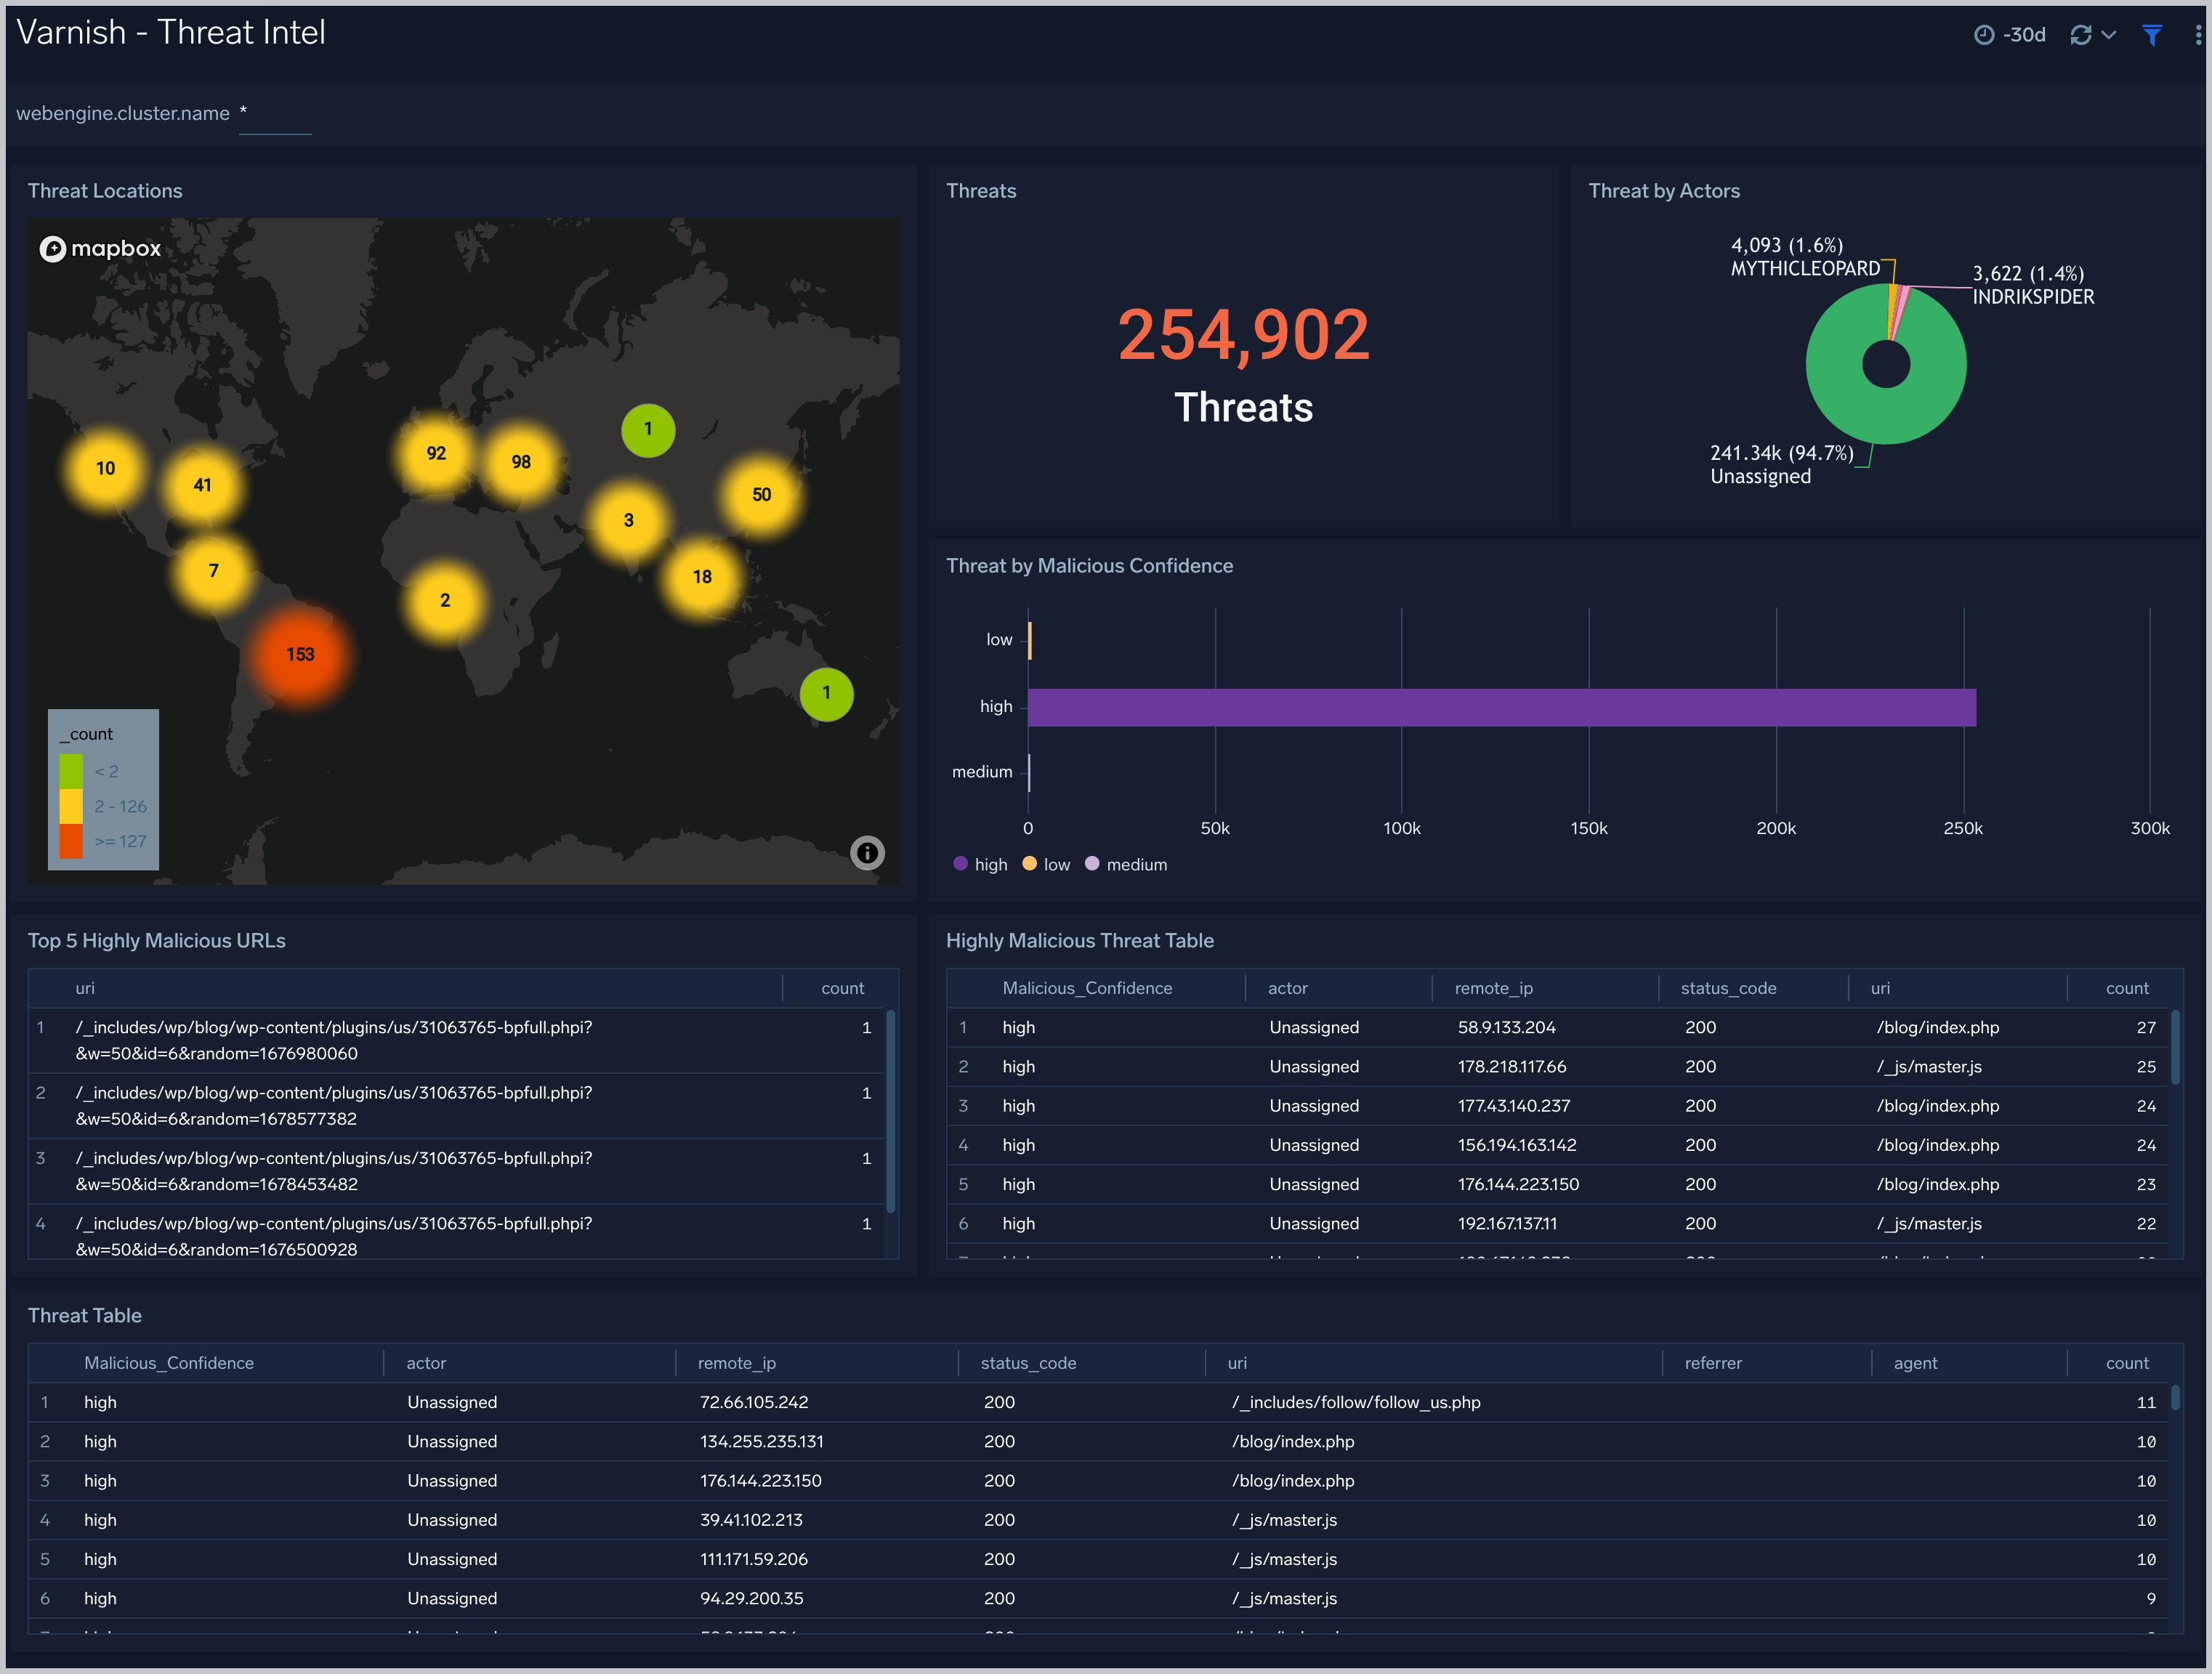
Threat Intel
The Varnish - Threat Intel dashboard provides an at-a-glance view of threats to Varnish servers on your network. Dashboard panels display threat count over a selected time period, geographic locations where threats occurred, source breakdown, actors responsible for threats, severity, and a correlation of IP addresses, method, and status code of threats.
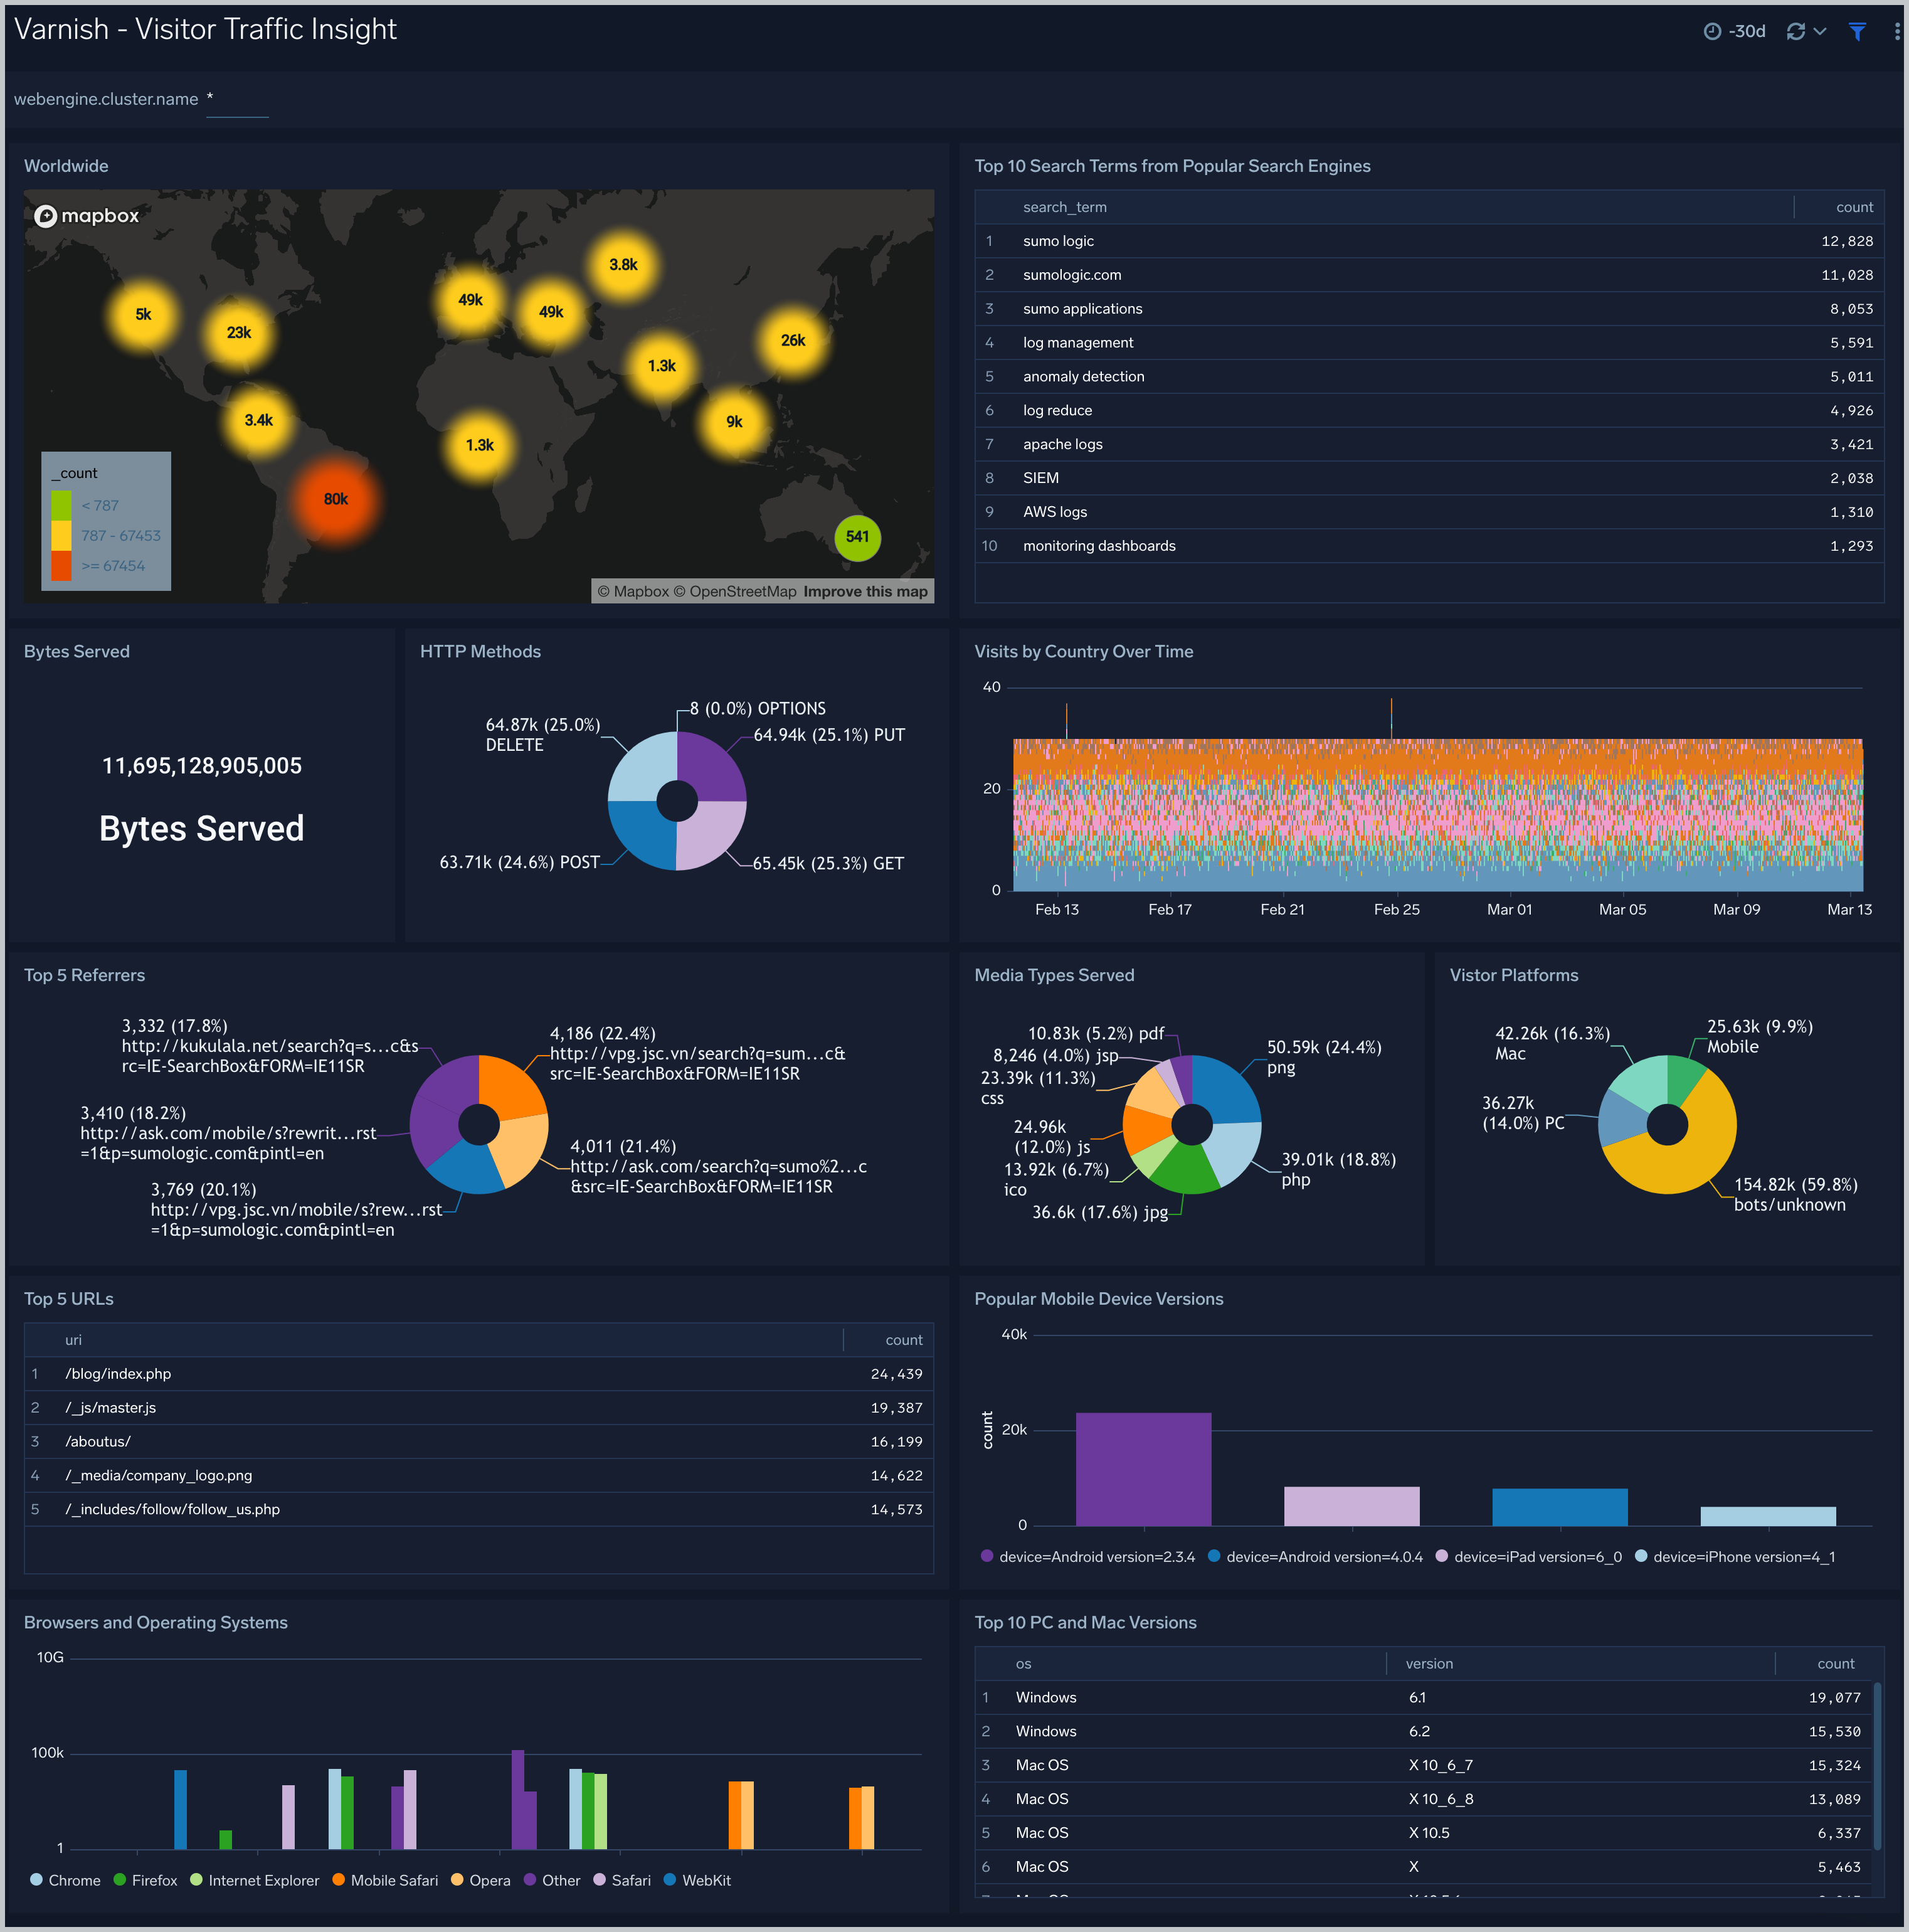
Visitor Traffic Insight
The Varnish - Visitor Traffic Insight dashboard provides detailed information on the top documents accessed, top referrers, top search terms from popular search engines, and the media types served.
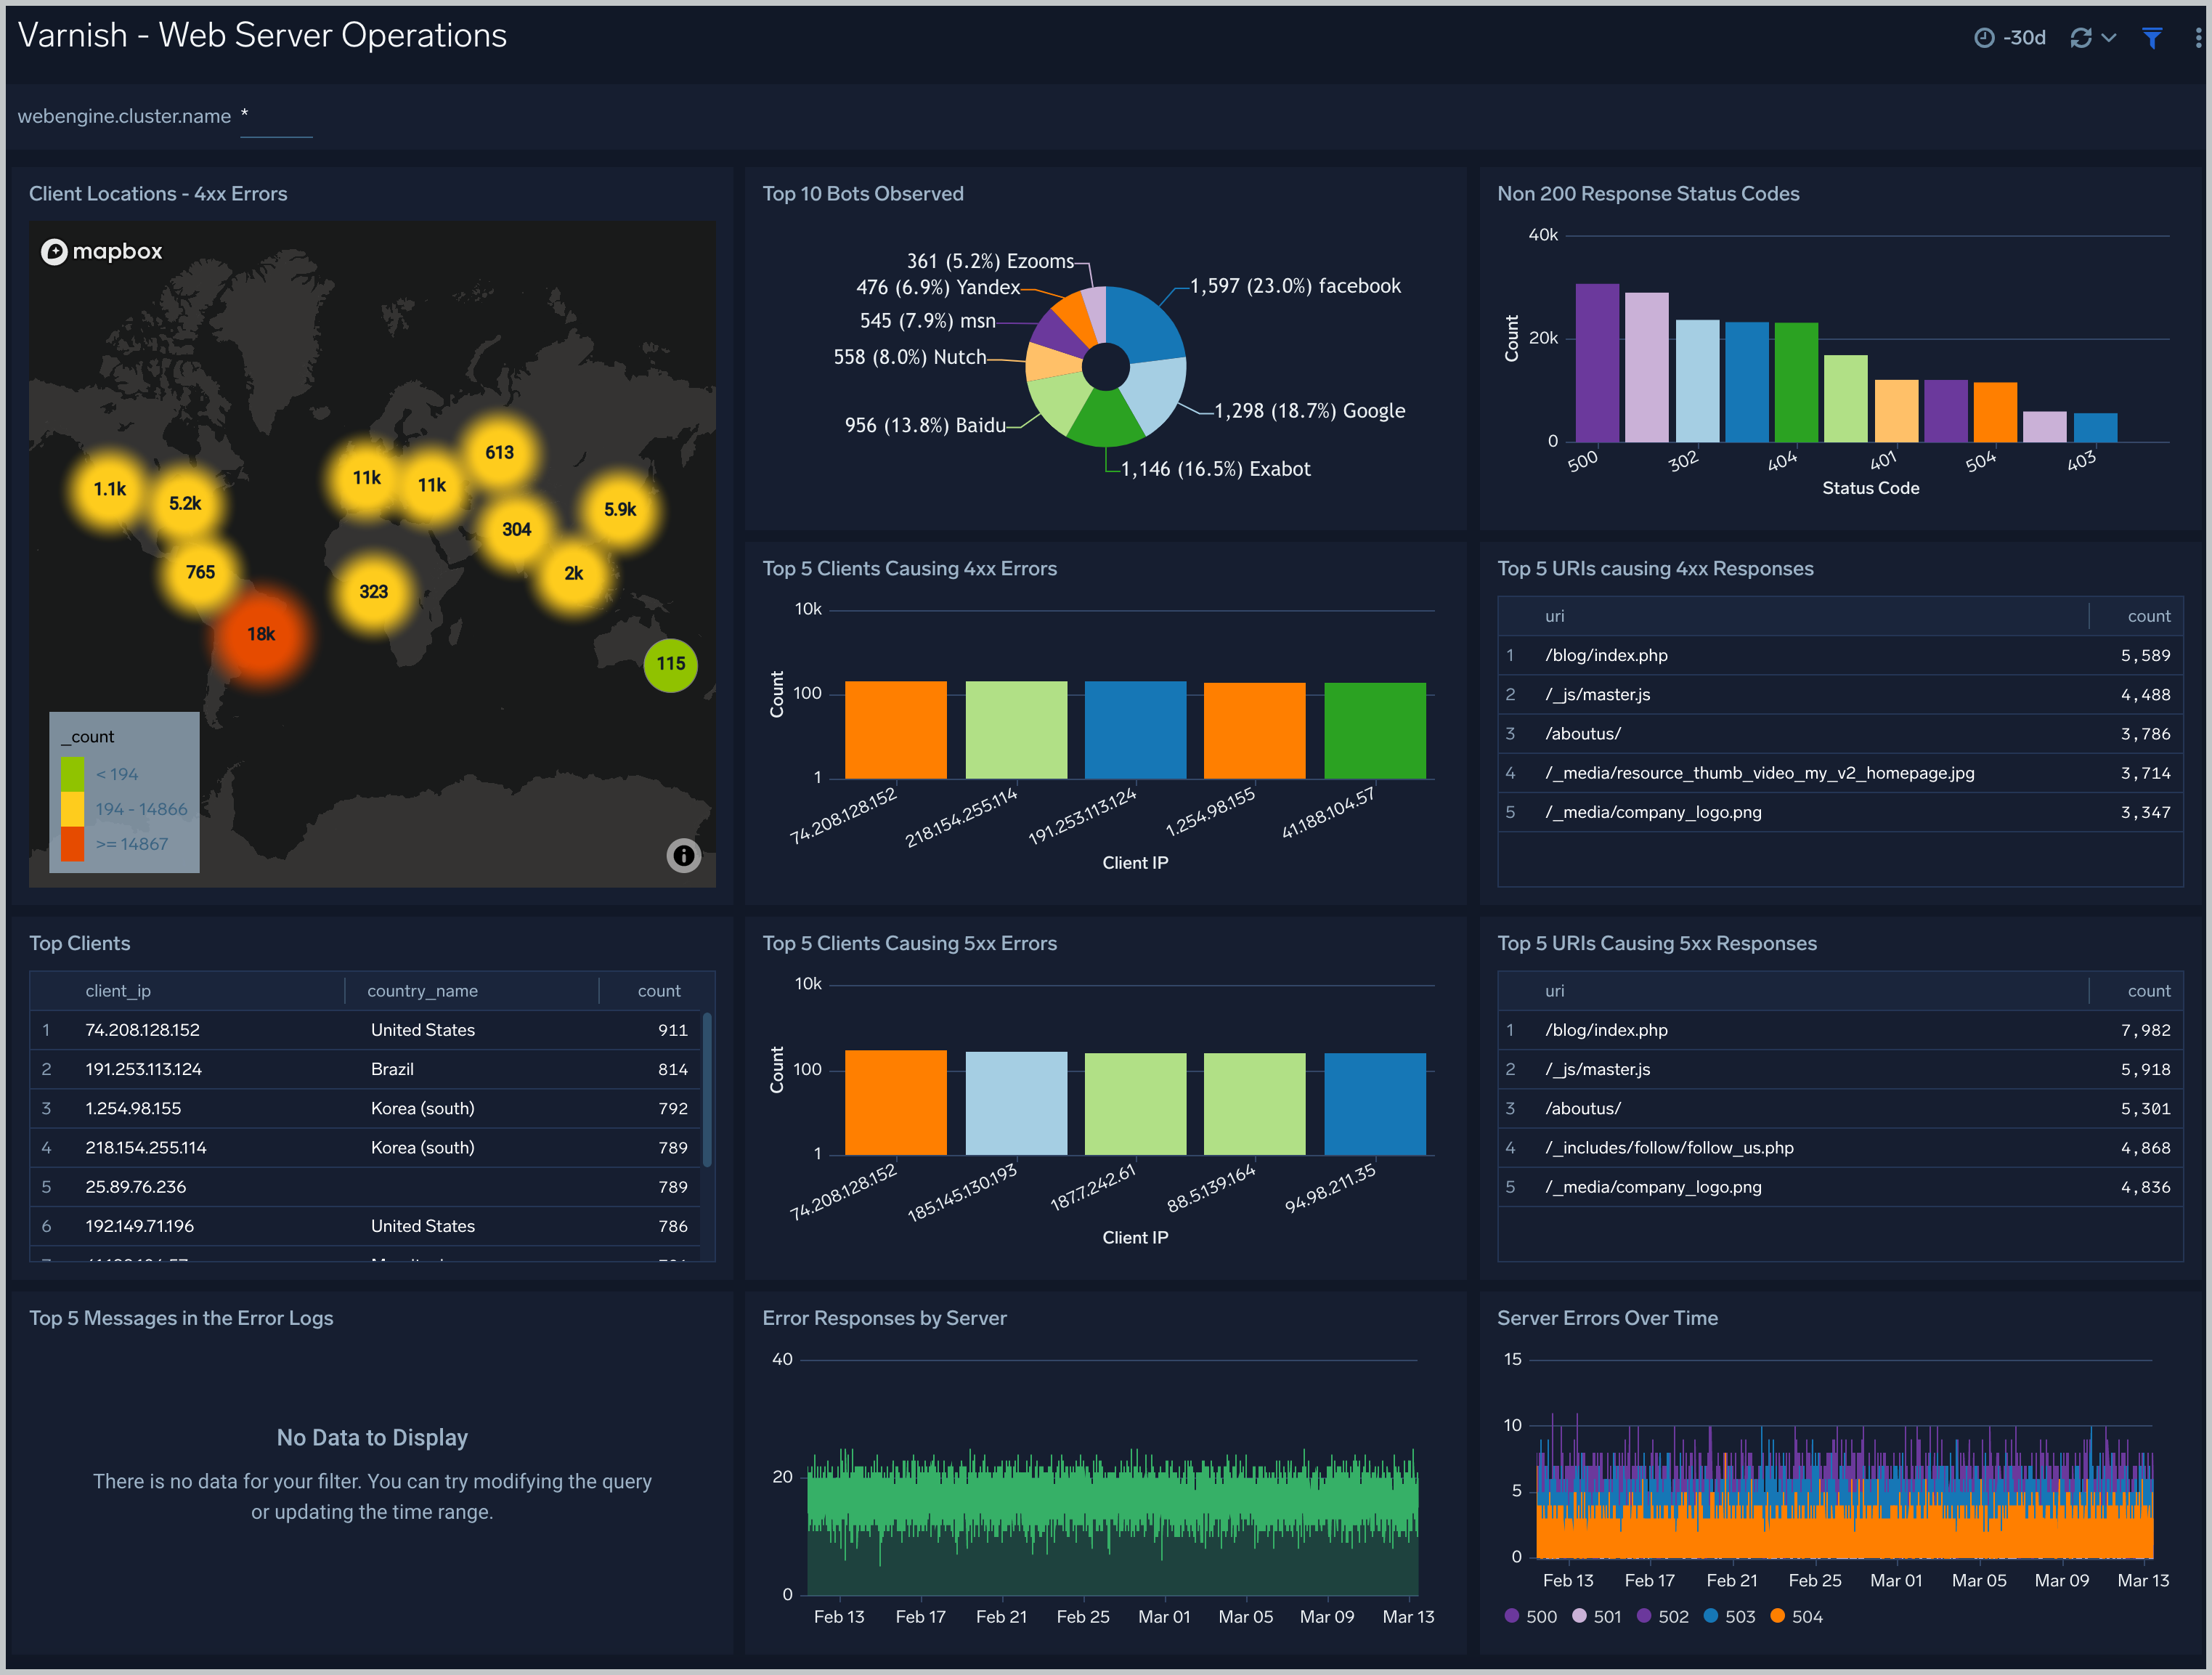
Web Server Operations
The Varnish - Web Server Operations dashboard provides a high-level view combined with detailed information on the top ten bots, geographic locations and data for clients with high error rates, server errors over time, and non 200 response code status codes. Dashboard panels also show information on server error logs, error log levels, error responses by server, and the top URIs responsible for 404 responses.
Create monitors for Varnish app
From your App Catalog:
- From the Sumo Logic navigation, select App Catalog.
- In the Search Apps field, search for and then select your app.
- Make sure the app is installed.
- Navigate to What's Included tab and scroll down to the Monitors section.
- Click Create next to the pre-configured monitors. In the create monitors window, adjust the trigger conditions and notifications settings based on your requirements.
- Scroll down to Monitor Details.
- Under Location click on New Folder.
note
By default, monitor will be saved in the root folder. So to make the maintenance easier, create a new folder in the location of your choice.
- Enter Folder Name. Folder Description is optional.
tip
Using app version in the folder name will be helpful to determine the versioning for future updates.
- Click Create. Once the folder is created, click on Save.
Varnish alerts
| Name | Description | Alert Condition | Recover Condition |
|---|---|---|---|
Varnish - Access from Highly Malicious Sources | This alert is triggered when Varnish is accessed from highly malicious IP addresses. | Count > 0 | Count <= 0 |
Varnish - High 4XX Error Rate | This alert is triggered when there are too many HTTP requests (>5%) with a response status of 4xx. | Count > 5 | Count <= 5 |
Varnish - High 5XX Error Rate | This alert is triggered when there are too many HTTP requests (>5%) with a response status of 5xx. | Count > 5 | Count <= 5 |