Mailgun
The Mailgun app for Sumo Logic enables you to seamlessly monitor email system performance and user interactions through two comprehensive dashboards. The provided dashboard empowers you to analyze and optimize email delivery by monitoring event trends, identifying errors, understanding client behaviour, and tracking event geolocation data, ensuring efficient email management and an enhanced user experience. Meanwhile, the dashboard also offers a holistic view of email delivery, allowing you to track issues, complaint patterns, and geographic trends in events and complaints, facilitating effective email management and optimization.
Mailgun is an email delivery service for sending, receiving, and tracking emails. You can use a webhook in the Mailgun platform to forward inbound and outbound email events to the Sumo Logic HTTP endpoint. Using these logs, you can monitor the entire email communication lifecycle, events such as accepted, rejected, delivered, and failed messages, as well as recipient interactions like opened, clicked, unsubscribed, and complained events in Sumo Logic. For more details, refer to the Mailgun Documentation.
Event types
The Sumo Logic integration for Mailgun ingests email events into Sumo Logic through an outgoing webhook available in Mailgun. For more information on supported events that are ingested through the Mailgun webhook, see the Mailgun Documentation.
Sample log messages
{
  "signature": {
    "token": "b30b54697f3c4c8f8e810ee1e6012cc25b93a0b006aedd9ea5",
    "timestamp": 1698262699,
    "signature": ""
  },
  "event-data": {
    "id": "Ase7i2zsRYeDXztHGENqRA",
    "timestamp": 1698262699.873676,
    "log-level": "info",
    "event": "clicked",
    "message": {
      "headers": {
        "message-id": "16982626991826.18666.16540@sandbox6dc4471342a54f23b39d0b8be5621130.mailgun.org"
      }
    },
    "recipient": "win7mailer411@mxil.com",
    "recipient-domain": "example.com",
    "ip": "72.66.105.242",
    "geolocation": {
      "country": "US",
      "region": "CA",
      "city": "San Francisco"
    },
    "client-info": {
      "client-os": "Linux",
      "device-type": "desktop",
      "client-name": "Chrome",
      "client-type": "browser",
      "user-agent": "Mozilla/5.0 (X11; Linux x86_64) AppleWebKit/537.31 (KHTML, like Gecko) Chrome/26.0.1410.43 Safari/537.31"
    },
    "campaigns": [

    ],
    "tags": [
      "my_tag_1",
      "my_tag_2"
    ],
    "user-variables": {
      "my_var_1": "Mailgun Variable #1",
      "my-var-2": "awesome"
    }
  }
}
Sample queries
_sourceCategory="webhook/mailgun"
| json "event-data.id", "event-data.event", "event-data.log-level" as id, event, loglevel nodrop
| where event matches "{{event}}" and loglevel matches "{{logLevel}}"
| count
Setup
This section has instructions for collecting logs for the Sumo Logic Mailgun webhook collection.
Source configuration
Follow the below steps to configure the Hosted Collector to receive Mailgun events:
- In the Sumo Logic portal, create a new Hosted Collector or use an existing one. Then add an HTTP Logs and Metrics Source.
- Configure Source Category in the HTTP source - for example,
webhook/mailgun- for the Mailgun integration. - Copy and save the endpoint URL of the source.
Vendor configuration
Configure the webhook integration in Mailgun to send events to the Sumo Logic HTTP source. Once configured, it will be triggered each time any email events occur within your Mailgun account.
Follow the below steps to configure the Mailgun webhook.
- Sign in to the Mailgun account.
- Under Sending section move to the Webhooks option.
- Click Add Webhook. The webhook form appears.
- Enter webhook form data as follows:
- Event Types. Select the event types for which you want to send notifications to Sumo Logic.
- URL. Enter the Sumo Logic HTTP endpoint URL (source address) created above.
- Click Create Webhook.
- Verify Mailgun events are getting ingested in Sumo Logic by executing the following query on Sumo Logic's Log Search panel.
`_sourceCategory=webhook/mailgun`
- For detailed information about webhook creation, refer to the Mailgun Documentation.
- For support, contact Mailgun.
Installing the Mailgun app
To install the app, do the following:
Next-Gen App: To install or update the app, you must be an account administrator or a user with Manage Apps, Manage Monitors, Manage Fields, Manage Metric Rules, and Manage Collectors capabilities depending upon the different content types part of the app.
- Select App Catalog.
- In the 🔎 Search Apps field, run a search for your desired app, then select it.
- Click Install App.
note
Sometimes this button says Add Integration.
- Click Next in the Setup Data section.
- In the Configure section of your respective app, complete the following fields.
- Field Name. If you already have collectors and sources set up, select the configured metadata field name (eg _sourcecategory) or specify other custom metadata (eg: _collector) along with its metadata Field Value.
- Click Next. You will be redirected to the Preview & Done section.
Post-installation
Once your app is installed, it will appear in your Installed Apps folder, and dashboard panels will start to fill automatically.
Each panel slowly fills with data matching the time range query received since the panel was created. Results will not immediately be available but will be updated with full graphs and charts over time.
Viewing Mailgun dashboards
All dashboards have a set of filters that you can apply to the entire dashboard. Use these filters to drill down and examine the data to a granular level.
- You can change the time range for a dashboard or panel by selecting a predefined interval from a drop-down list, choosing a recently used time range, or specifying custom dates and times. Learn more.
- You can use template variables to drill down and examine the data on a granular level. For more information, see Filtering Dashboards with Template Variables.
- Most Next-Gen apps allow you to provide the scope at the installation time and are comprised of a key (
_sourceCategoryby default) and a default value for this key. Based on your input, the app dashboards will be parameterized with a dashboard variable, allowing you to change the dataset queried by all panels. This eliminates the need to create multiple copies of the same dashboard with different queries.
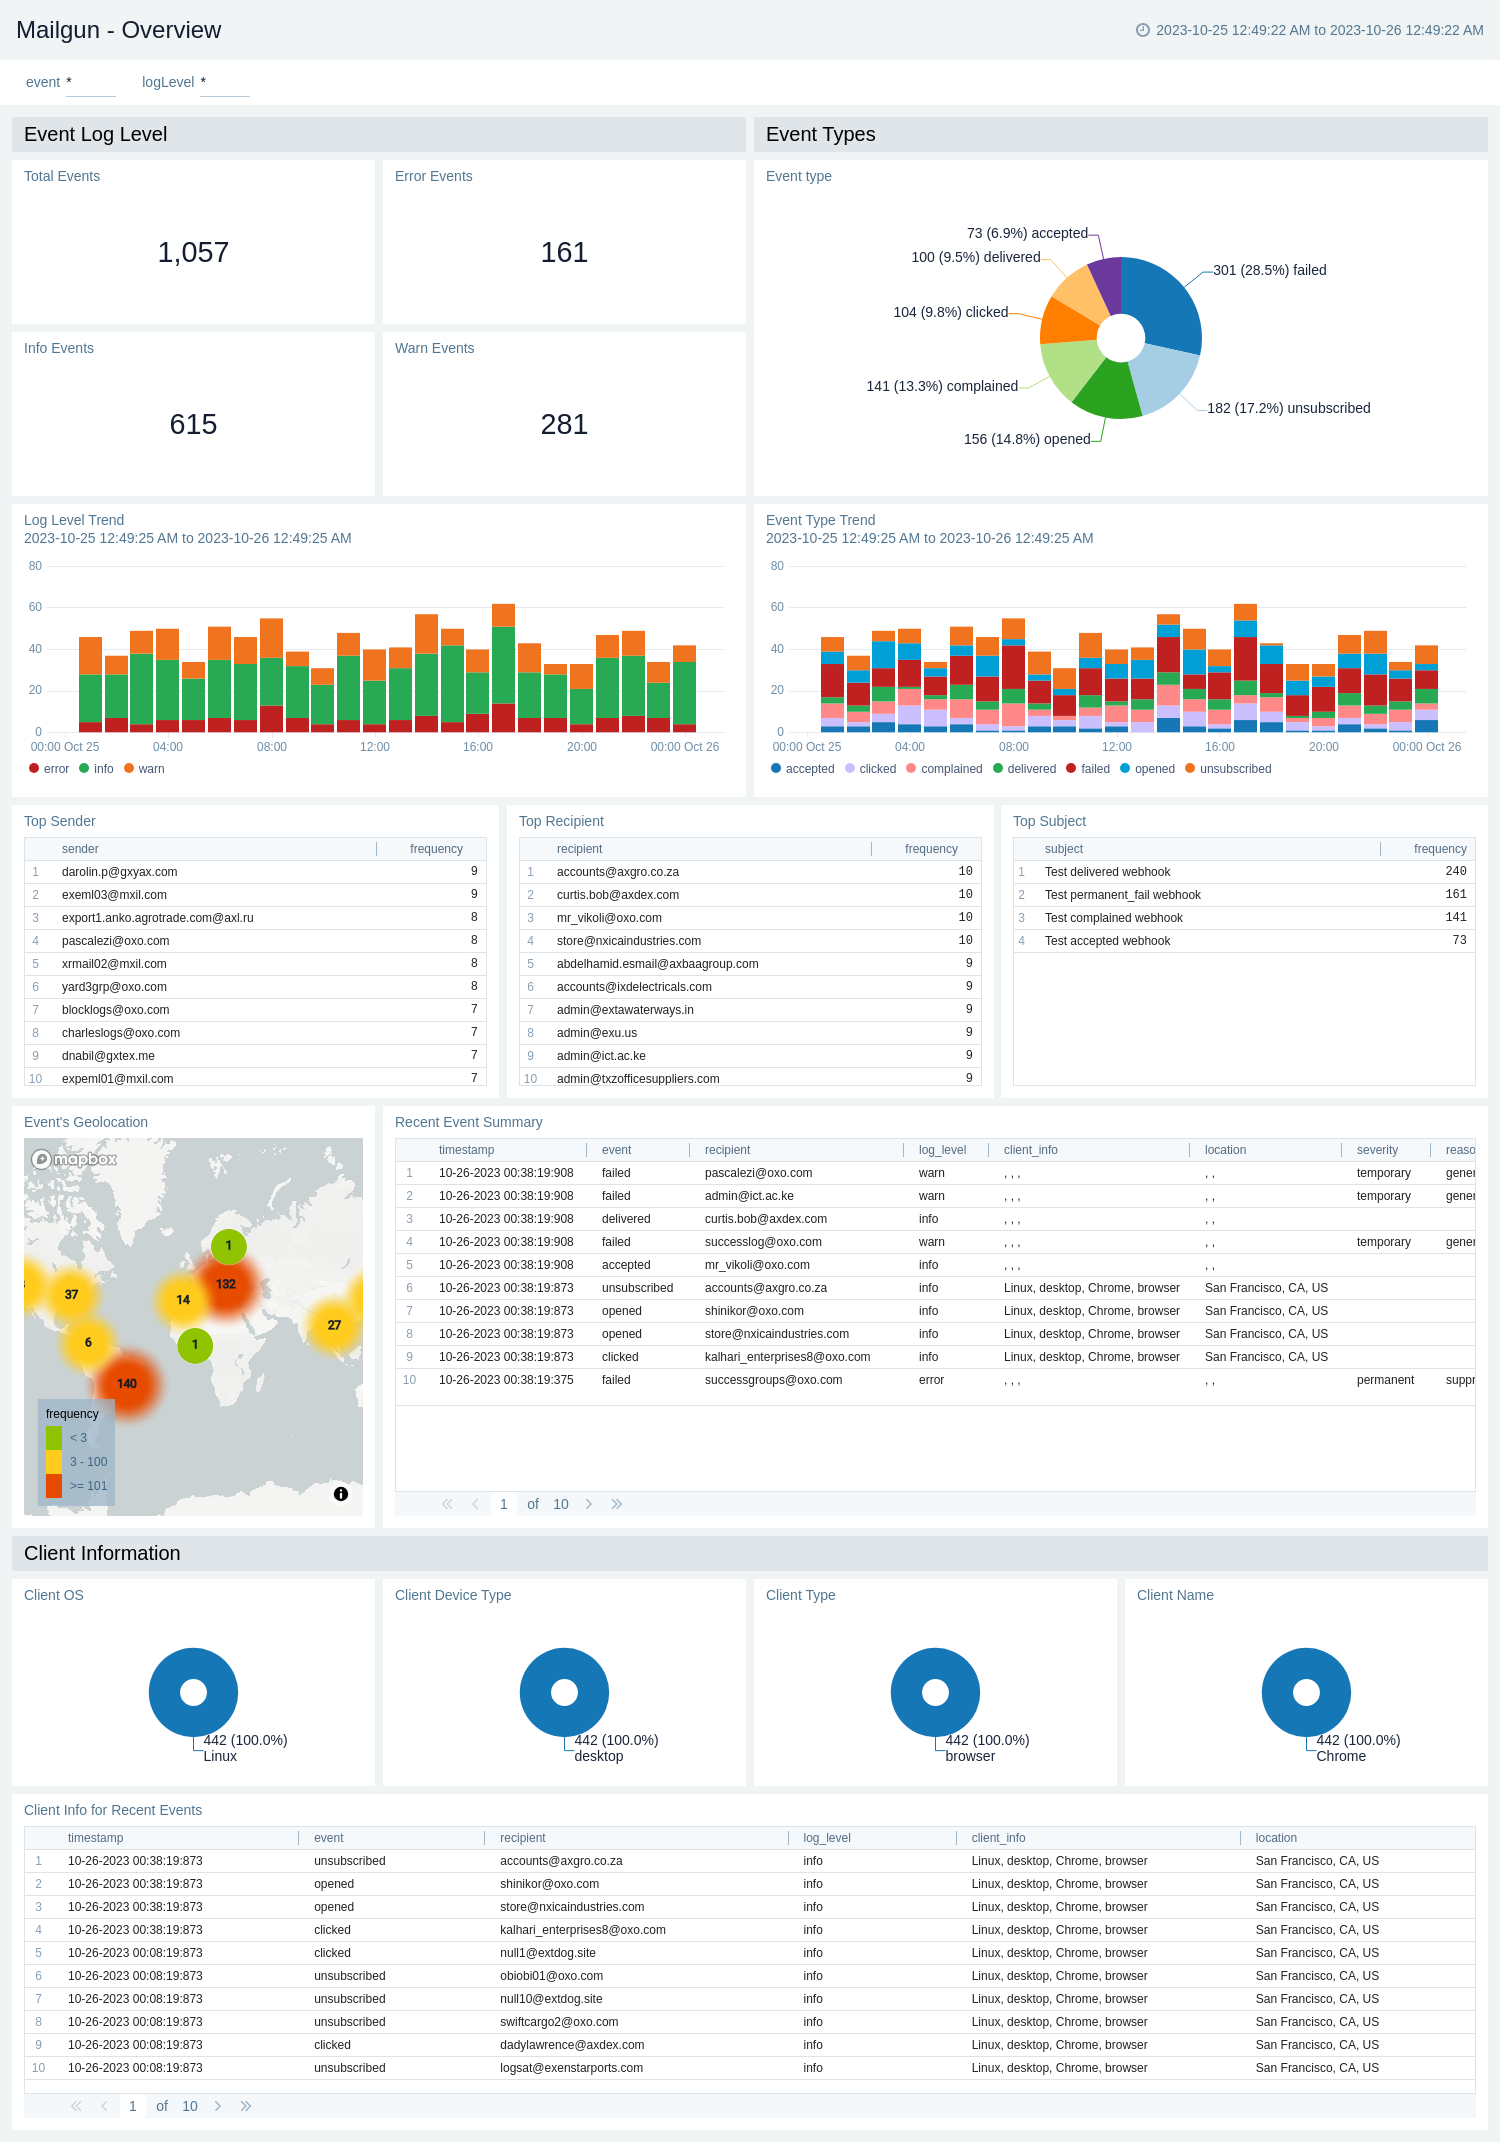
Overview
The Mailgun - Overview dashboard offers a comprehensive overview of email system performance and user interactions, featuring panels that include Log Level, Total Events, Total Error Events, Log Level Trends, Event Type, Event Trends, Top Sender, Top Recipient, Top Subject, Client OS, Client Device Type, Client Type, Client Name, Event Geolocation, and Recent Event Summary. This dashboard empowers Mailgun users to analyze and optimize email delivery by monitoring event trends, identifying errors, understanding client behavior, and tracking event geolocation data, ensuring efficient email management and enhanced user experience.
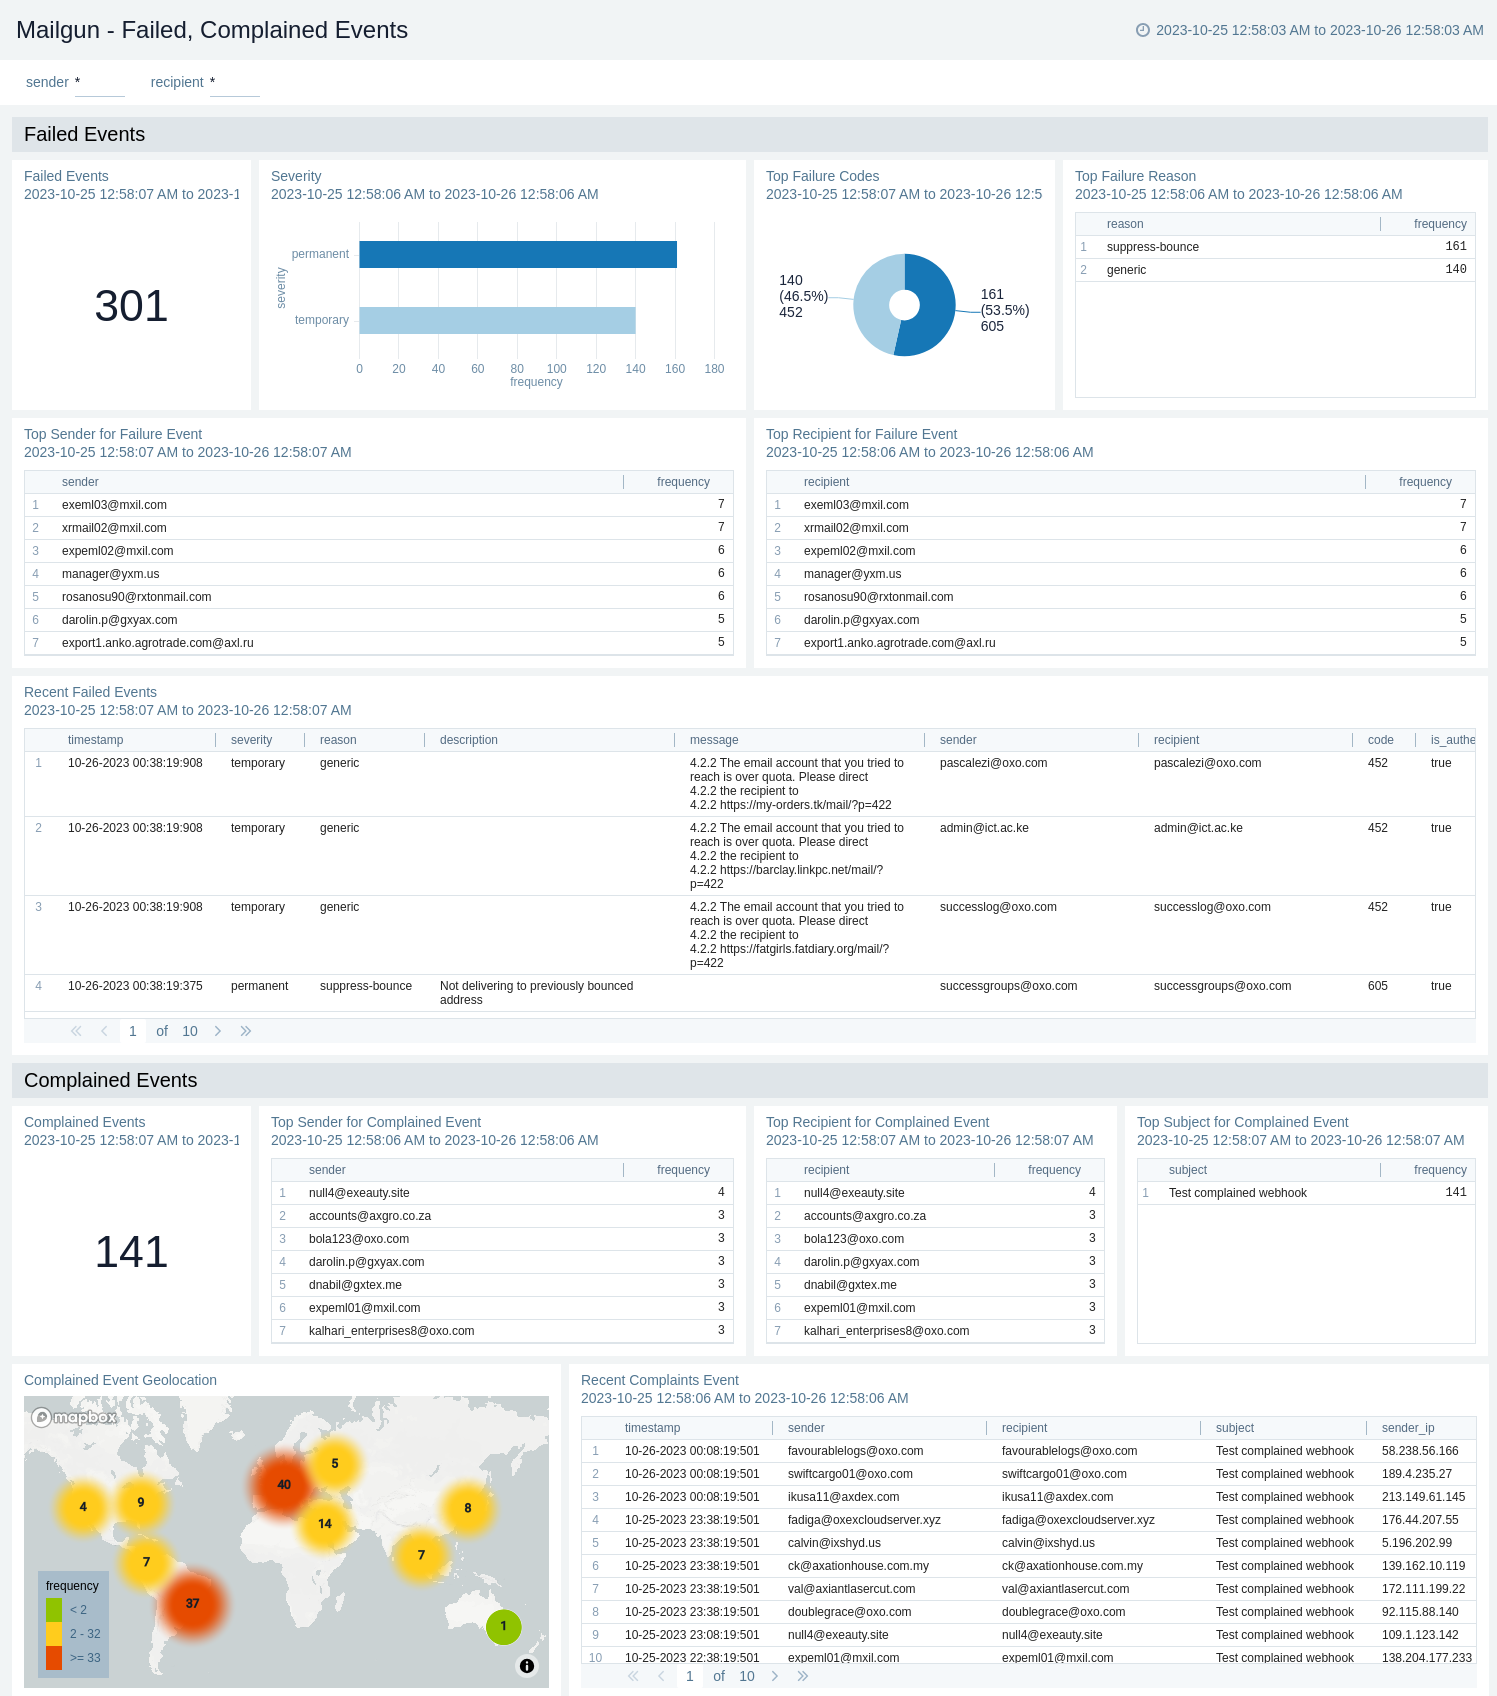
Failed, Complained Events
The Mailgun - Failed, Complained Events dashboard offers a holistic view of email system performance and user interactions, featuring panels like Failed Events, Severity, Top Failure Codes, Top Failure Reasons, Top Sender and Recipient for Failure Events, Recent Failed Events, Complained Events, Top Sender and Recipient for Complained Events, Top Subject for Complained Events, Event Geolocation, and Recent Complained Events. This dashboard equips Mailgun users to closely monitor email delivery, assess issues, understand complaint patterns, and track geographic trends in events and complaints, facilitating effective email management and optimization.
Upgrade/Downgrade the iLeMailgunrt app (Optional)
To update the app, do the following:
Next-Gen App: To install or update the app, you must be an account administrator or a user with Manage Apps, Manage Monitors, Manage Fields, Manage Metric Rules, and Manage Collectors capabilities depending upon the different content types part of the app.
- Select App Catalog.
- In the Search Apps field, search for and then select your app.
Optionally, you can identify apps that can be upgraded in the Upgrade available section. - To upgrade the app, select Upgrade from the Manage dropdown.
- If the upgrade does not have any configuration or property changes, you will be redirected to the Preview & Done section.
- If the upgrade has any configuration or property changes, you will be redirected to the Setup Data page.
- In the Configure section of your respective app, complete the following fields.
- Field Name. If you already have collectors and sources set up, select the configured metadata field name (eg _sourcecategory) or specify other custom metadata (eg: _collector) along with its metadata Field Value.
- Click Next. You will be redirected to the Preview & Done section.
Post-update
Your upgraded app will be installed in the Installed Apps folder and dashboard panels will start to fill automatically.
See our Release Notes changelog for new updates in the app.
To revert the app to a previous version, do the following:
- Select App Catalog.
- In the Search Apps field, search for and then select your app.
- To version down the app, select Revert to < previous version of your app > from the Manage dropdown.
Uninstalling the Mailgun app (Optional)
To uninstall the app, do the following:
- Select App Catalog.
- In the 🔎 Search Apps field, run a search for your desired app, then select it.
- Click Uninstall.