Health Events
Availability
| Account Type | Account Level |
|---|---|
| CloudFlex | Professional, Enterprise |
| Credits | Trial, Essentials, Enterprise Operations, Enterprise Security, Enterprise Suite |
Health events allow you to keep track of the health of your Collectors, Sources, and Ingest Budgets. You can use them to find and investigate common errors and warnings that are known to cause collection issues.
This framework includes the following:
- Health event logs indexed in the System Event Index.
- A health events table on the Alerts page.
- A health status column on the Collection page.
Health events are sent from Installed Collectors on version 19.308-2 and later.
Alerts
Alerts for specific health events are easy to create in the Health Events Table. The details pane of an event provides a Create Scheduled Search button to automatically generate the required query.
Health events
Health events are created when an issue is detected with a Collector or Source. Events are indexed and searchable in a separate partition named sumologic_system_events in the System Event Index. For details on what information is available in a health event, see the common parameters table.
Health events table
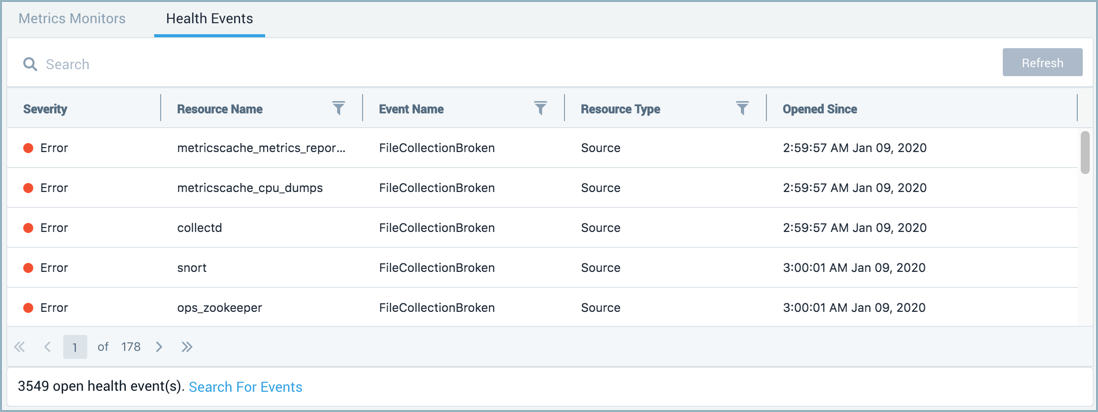
The health events table allows you to easily view and investigate problems getting your data to Sumo.
On the health events table, you can search, filter, and sort incidents by key aspects like severity, resource name, event name, resource type, and opened since date.
Classic UI. To access the health events table, in the main Sumo Logic menu select Manage Data > Monitoring > Health Events.
New UI. To access the health events table, in the top menu select Configuration, and then under Data Collection select Health Events. You can also click the Go To... menu at the top of the screen and select Health Events.

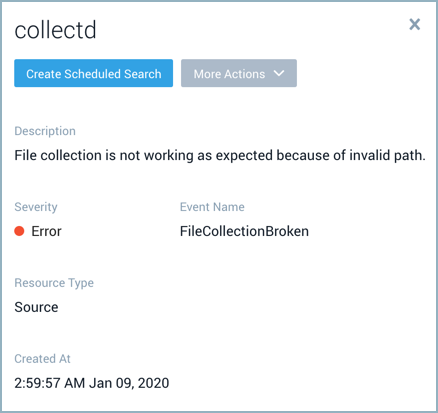
Click on a row to view the details of a health event.

Click the Create Scheduled Search button on the details pane to get alerts for specific health events. The unique identifier of the resource, such as the Source or Collector, is used in the query. See Schedule a Search for details.
Under the More Actions menu you can select:
- Event History to run a search against the sumologic_system_events partition to view all of the related event logs.
- View Object to view the Collector or Source in the Collection page related to the event.
Health events severity
Events are categorized by two severity levels, warning and error. The severity column has color-coded error and warning events so you can quickly determine the severity of a given issue.
A warning indicates the Collector or Source has a configuration issue or is operating in a degraded state.
An error indicates the Collector or Source is unable to collect data as expected.
Common parameters
Each health event log has common keys that categorize it to a product area and provide details of the event. The following table shows the common parameters in the order that they are found in health event logs.
| Parameter | Description | Data Type |
|---|---|---|
| status | Either Healthy or Unhealthy based on the event. | String |
| details | The details of the event include the type as trackerId, the name of the event, and a description. | JSON object of Strings |
| eventType | Health events have a value of Health-Change. | String |
| severityLevel | Either Error or Warning based on the event. | String |
| accountId | The unique identifier of the organization. | String |
| eventId | The unique identifier of the event. | String |
| eventName | The name of the event. | String |
| eventTime | The event timestamp in ISO 8601 format. | String |
| eventFormatVersion | The event log format version. | String |
| operator | Information on who did the operation. If it's missing, the Sumo service was the operator. | JSON object of Strings |
| subsystem | The product area of the event. | String |
| resourceIdentity | This includes any unique identifiers, names, and the type of the object associated with the event. | JSON object of Strings |
Health event log example
{
    "status": "UnHealthy",
    "details": {
        "trackerId": "FileCollectionBroken",
        "name": "Failed to find the file path",
        "description": "File collection is not working as expected because of invalid path."
    },
    "eventType": "Health-Change",
    "severityLevel": "Error",
    "accountId": "0000000000000131",
    "eventId": "39205436-7e16-4e2f-9f95-ef750e055d79",
    "eventName": "TrackerUnHealthy",
    "eventTime": "2020-01-20T16:10:27.085Z",
    "eventFormatVersion": "1.0",
    "subsystem": "Collection",
    "resourceIdentity": {
        "collectorId": "000000000641A117",
        "collectorName": "Sumo Logic",
        "id": "000000000679181F",
        "name": "ops_zookeeper",
        "type": "SourceResource"
    }
}
Search health events
To search all health events run a query against the internal partition named sumologic_system_events. For example,
_index=sumologic_system_events "Health-Change"
Create a scheduled search to get alerts for specific health events.
Metadata assignment
Creating a query that defines built-in metadata field values in the scope can help improve search performance and limit results to what you're investigating. Metadata fields are assigned to health event logs as follows:
| Metadata Field | Assignment Description |
|---|---|
| _sourceCategory | Value of the common parameter, subsystem. |
| _sourceName | Value of the common parameter, eventName. |
| _sourceHost | The remote IP address of the host that made the request. If not available the value will be no_sourceHost. |
Collection page
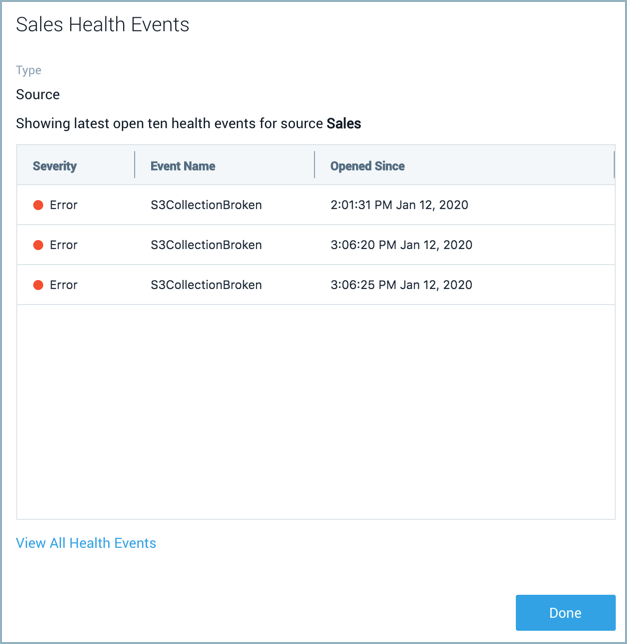
A Health column on the Collection page shows color-coded healthy, error, and warning states for Collectors and Sources so you can quickly determine the health of your Collectors and Sources.
The status column now shows the status of Sources manually paused by users.

-
Hover your mouse over a Collector or Source to view a tooltip that provides the number of health events detected on the Collector or Source.
-
Click on the Health status in a row to view a pop-up displaying a list of related events.
