Metric Aggregation Tips
When you run a metrics query that returns high cardinality results, the Metrics Search displays a tip for how to use an aggregation clause to produce more readable results. An aggregation tip is displayed for a query based on the cardinality of the query. It is presented when a query’s cardinality exceeds these thresholds:
| Tab / Chart type | Cardinality threshold |
| Chart tab with a Single Value panel type | 1 unique series |
| Chart tab with a Time Series or Categorical panel type | 10 unique series |
| Time Series tab | 50 unique time series |
Aggregation tips are available in the Metrics Search, and in metrics queries in Dashboards.
View aggregation tips
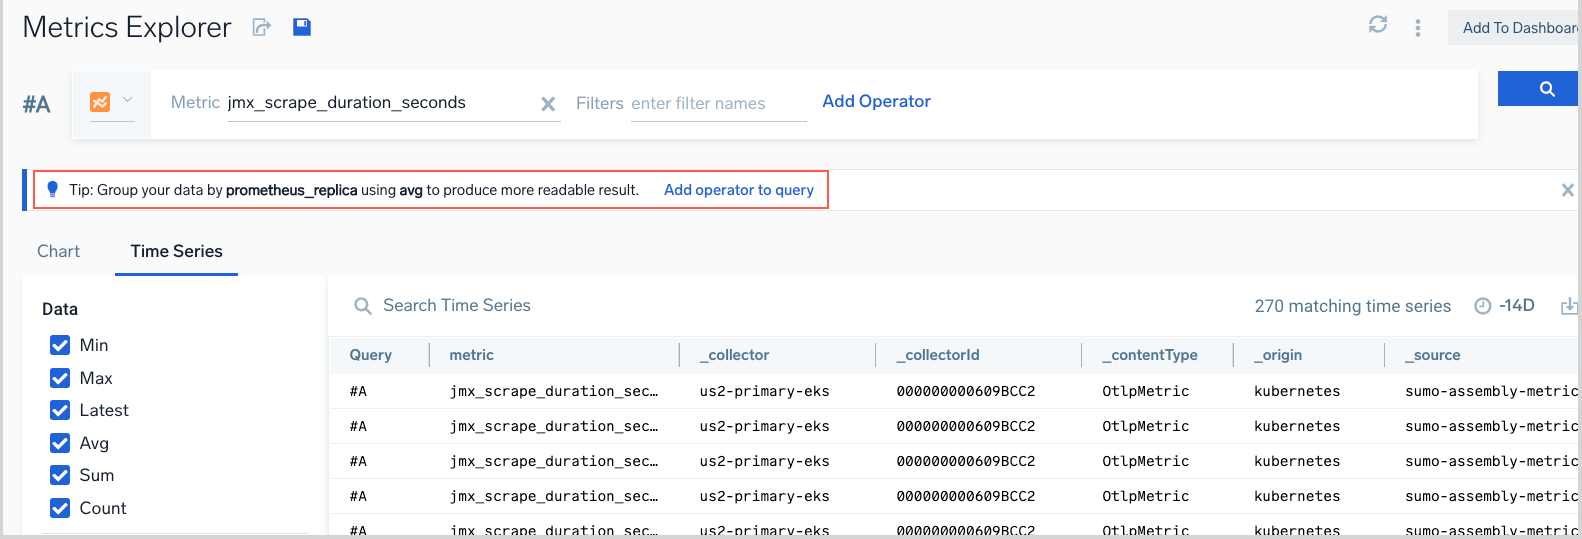
The screenshot below shows the Time Series tab for a query that returns 270 time series. Note the tip below the query suggests grouping the data by the prometheus_replica dimension using the avg operator. You can ignore the tip and close the tip by clicking the x to the right. Or you can click Add operator to query to add the recommended operator and dimension to your query.
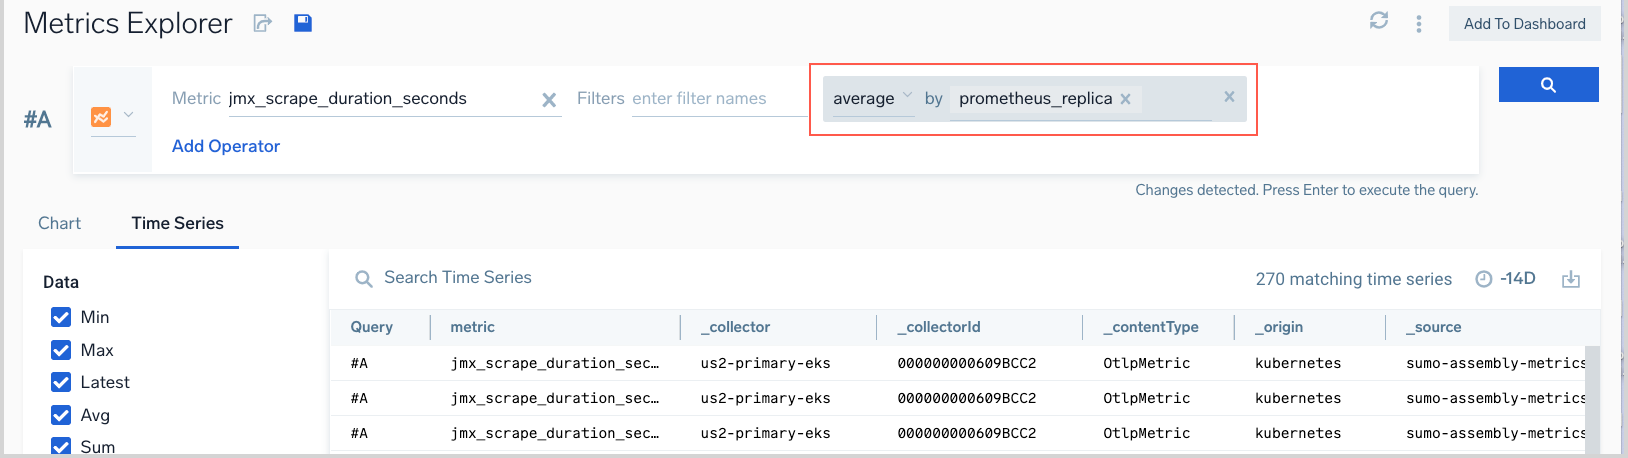
If you click Add operator to query, the aggregation clause is added to your query. We don’t run the query automatically—press Enter, or click the run icon to execute the query.
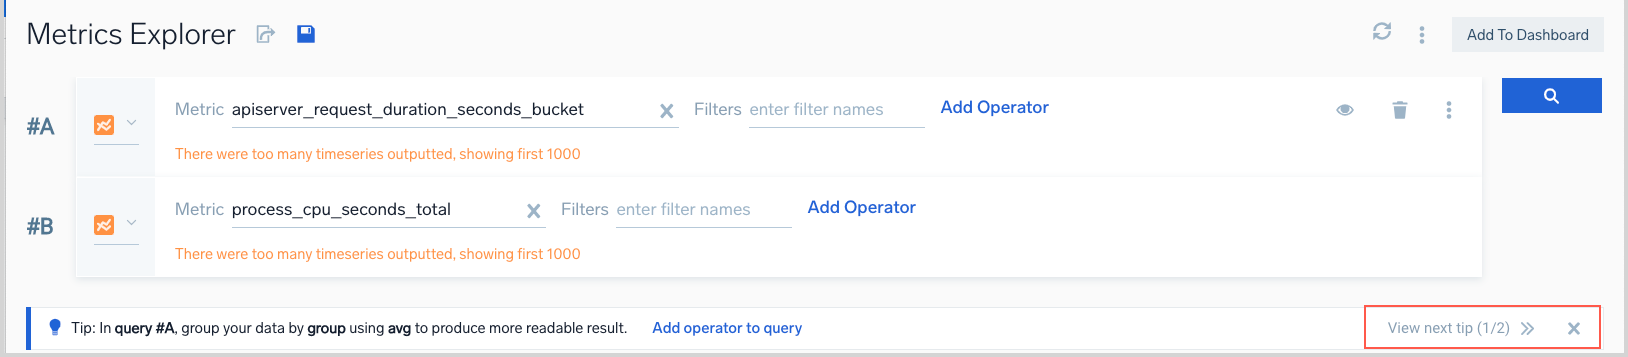
If you’re running multiple queries, a tip will be provided for each of the queries that exceeds a cardinality threshold.
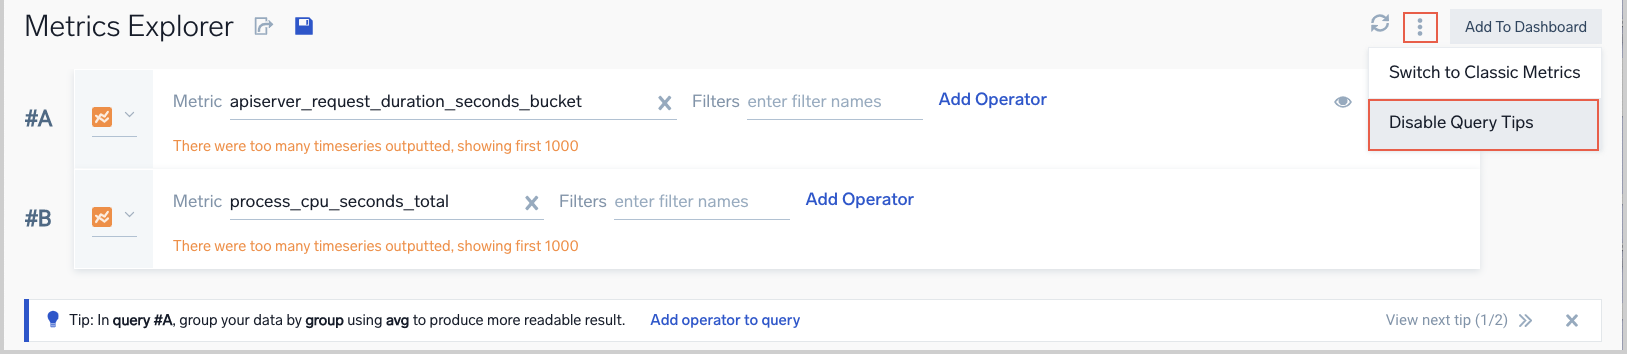
Disable tips
If you prefer not to see query tips, choose Disable Query Tips from the three-dot kebab menu in the Metrics Search.