About the Sumo Logic Observability Solution
Observability is the ability of the internal states of a system to be determined by its external outputs.
For our purposes, Observability is the ability to observe an application from the outside and understand what is happening inside the application and its services. Observability helps ensure that the application is running reliably: the system is up and running (available), performant, and secure.
This video explains Observability and how it's different from monitoring. It also explains how Sumo Logic's Observability Solution helps in all the stages of the incident remediation process to ensure the production apps are functioning reliably.
Why Observability?
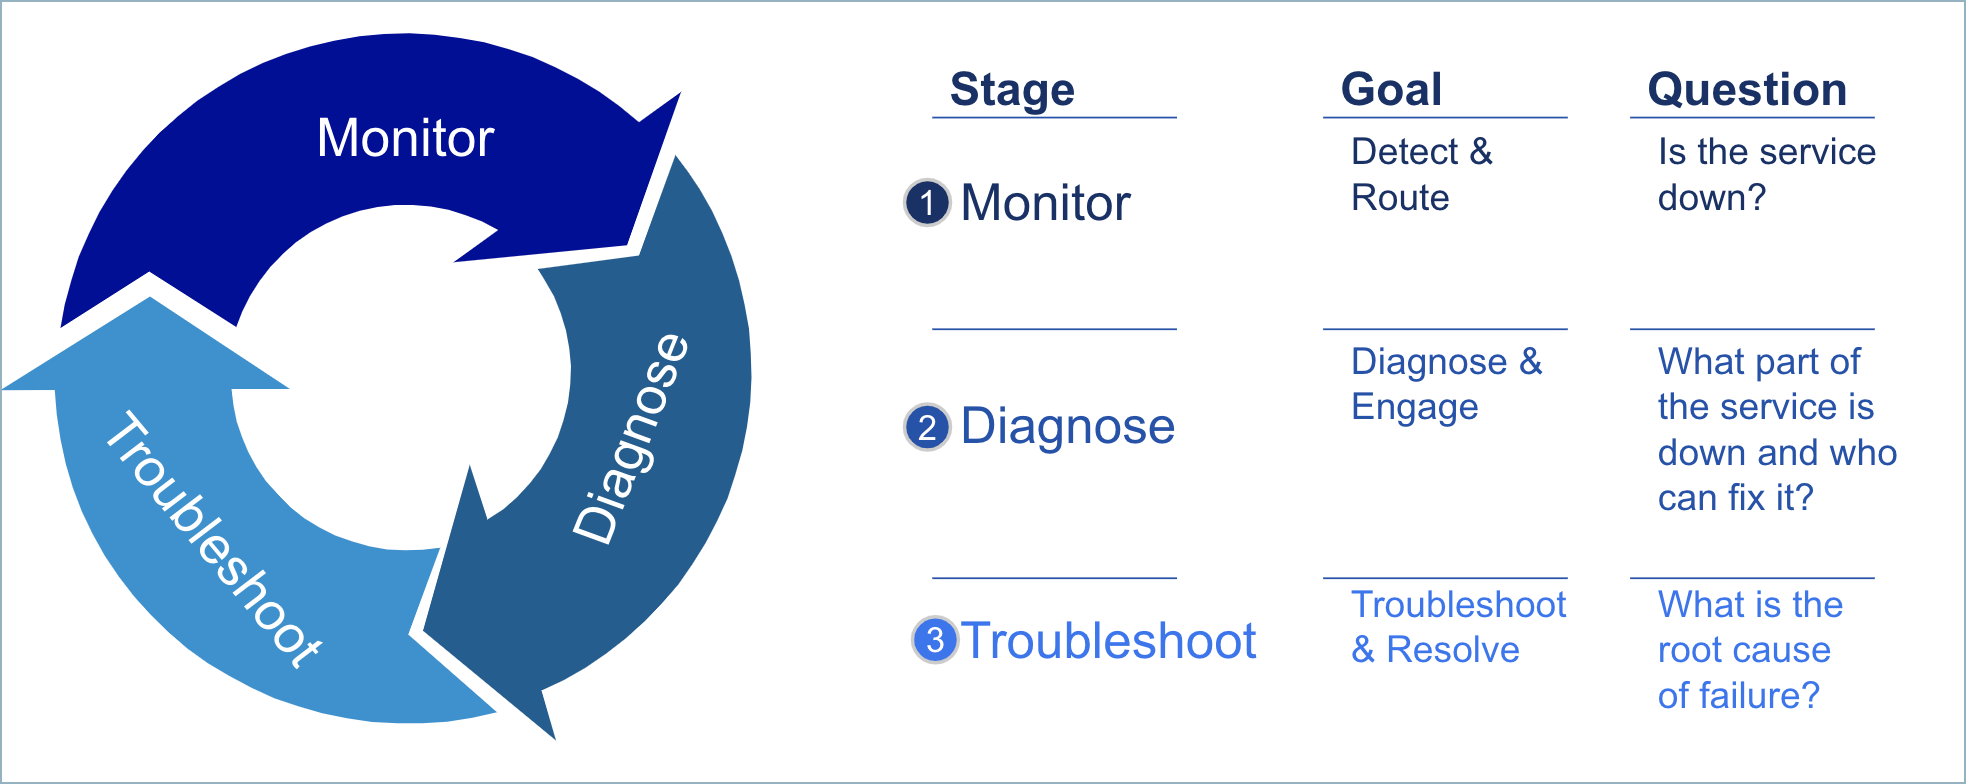
Modern applications are increasingly complex, as they leverage distributed technologies, cloud infrastructure, and container and orchestration tools. In addition, the connections between microservices, orchestrators, and underlying cloud resources is also growing in complexity. This complexity leads to situations where unforeseen events, unknown unknowns in terms of risk, are more prevalent and come with mysterious behaviors and failure modes. This can cause major issues in your overall incident remediation workflow, which can be broken down into three steps.
-
Monitor critical indicators of reliability such as errors or latency. Sometimes these unknown unknown types errors do not directly impact the metrics that you are tracking, which makes monitoring the issues more difficult.
-
Diagnose or isolate services or resources that might be the immediate cause of reliability issues. These unknown unknowns could impact systems in obscure ways. For example, the culprit service’s metrics might look alright, but a downstream service that consumes this service might have abnormal metrics, which could lead an SRE down the wrong path. There is no tribal knowledge that can help guide the SRE in the right direction.
-
Troubleshoot and uncover root cause(s) to guide recovery and ensure on-going application reliability. As in the case of the diagnosis step, the unknown unknowns might make it difficult to find the root cause.
Monitoring, diagnosing, and troubleshooting such issues is harder because there are no existing runbooks that can help resolve issues quickly. This problem is compounded by the fact that modern applications also emit astonishing amounts of machine data across the stack.
All this complexity, along with data deluge and unknown behaviors, can make it impossible to recover systems quickly if you don’t have a way to make sense of all of the information. This is why organizations need an Observability Solution.
Understanding the Observability Solution
The Observability Solution offers a unified platform for logs, metrics, traces, and metadata at the following layers:
- Application
- Microservices
- Cloud
- Orchestrator
- Container
The solution understands how the different datasets and services are connected, and stitches those relationships into an entity workflow that makes it more intuitive for users to get a holistic view of their service. The workflow also enables easier and faster monitoring, diagnosing, and troubleshooting.
The solution also offers features and capabilities that support each step of the troubleshooting process.
- Monitor your systems effectively with new and improved alerting and dashboarding capabilities. The Observability Solution includes rich pre-built content that you can leverage to quickly start monitoring specific services.
- Diagnose issues quickly using features like the Entity Explorer, trace analytics, and the Metrics Explorer.
- Troubleshoot issues and find root causes through behavior insights and log search.