About Sumo Logic AWS Observability
AWS provides over 150 discrete services including compute, network, storage, database, tooling, management, security, developer tools, and analytics to name a few.
Despite all of these services being a part of AWS, troubleshooting across different services can be problematic when you use separate AWS accounts to manage costs and give teams independent administrative control. Different AWS accounts often have different settings across Availability Zones or Regions, which makes it difficult to get a clear picture of overall application health.
The Sumo Logic AWS Observability solution analyze data across key AWS services and accounts, establish activity baselines, and determine causes for application incidents and high deviation events.
Watch the following micro lesson to learn about our AWS Observability solution.
AWS Observability Solution
The AWS Observability Solution can be deployed across multiple accounts and AWS Regions to:
- Minimize the time it takes to get operational insights across your AWS infrastructure.
- Identify elements that are subject to specific operational issues across your AWS infrastructure.
- Minimize the time it takes to assign operational to the correct business units and functional teams in your AWS infrastructure.
The unified platform collects and provides logs, metrics, traces, and metadata for the Application, Microservices, Cloud, Orchestrator, and Container layers. The solution understands how the different datasets and services are connected, and stitches those relationships into an entity workflow that makes it more intuitive for users to get a holistic view of their service.
System architecture and monitoring
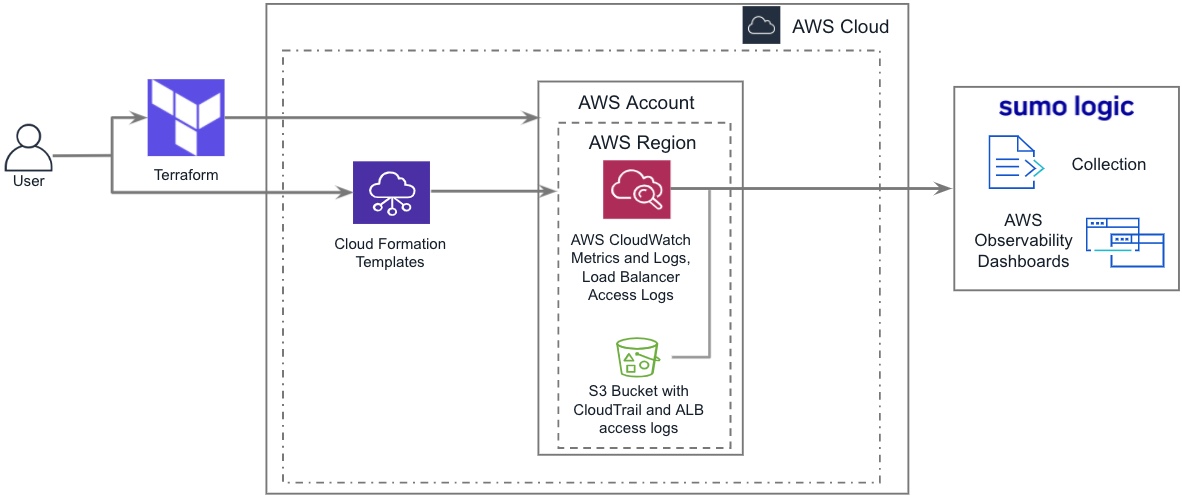
Sumo Logic provides an AWS CloudFormation templates (CFN) and Terraform scripts that automate the setup and installation of the AWS Observability Solution for your AWS accounts and regions.
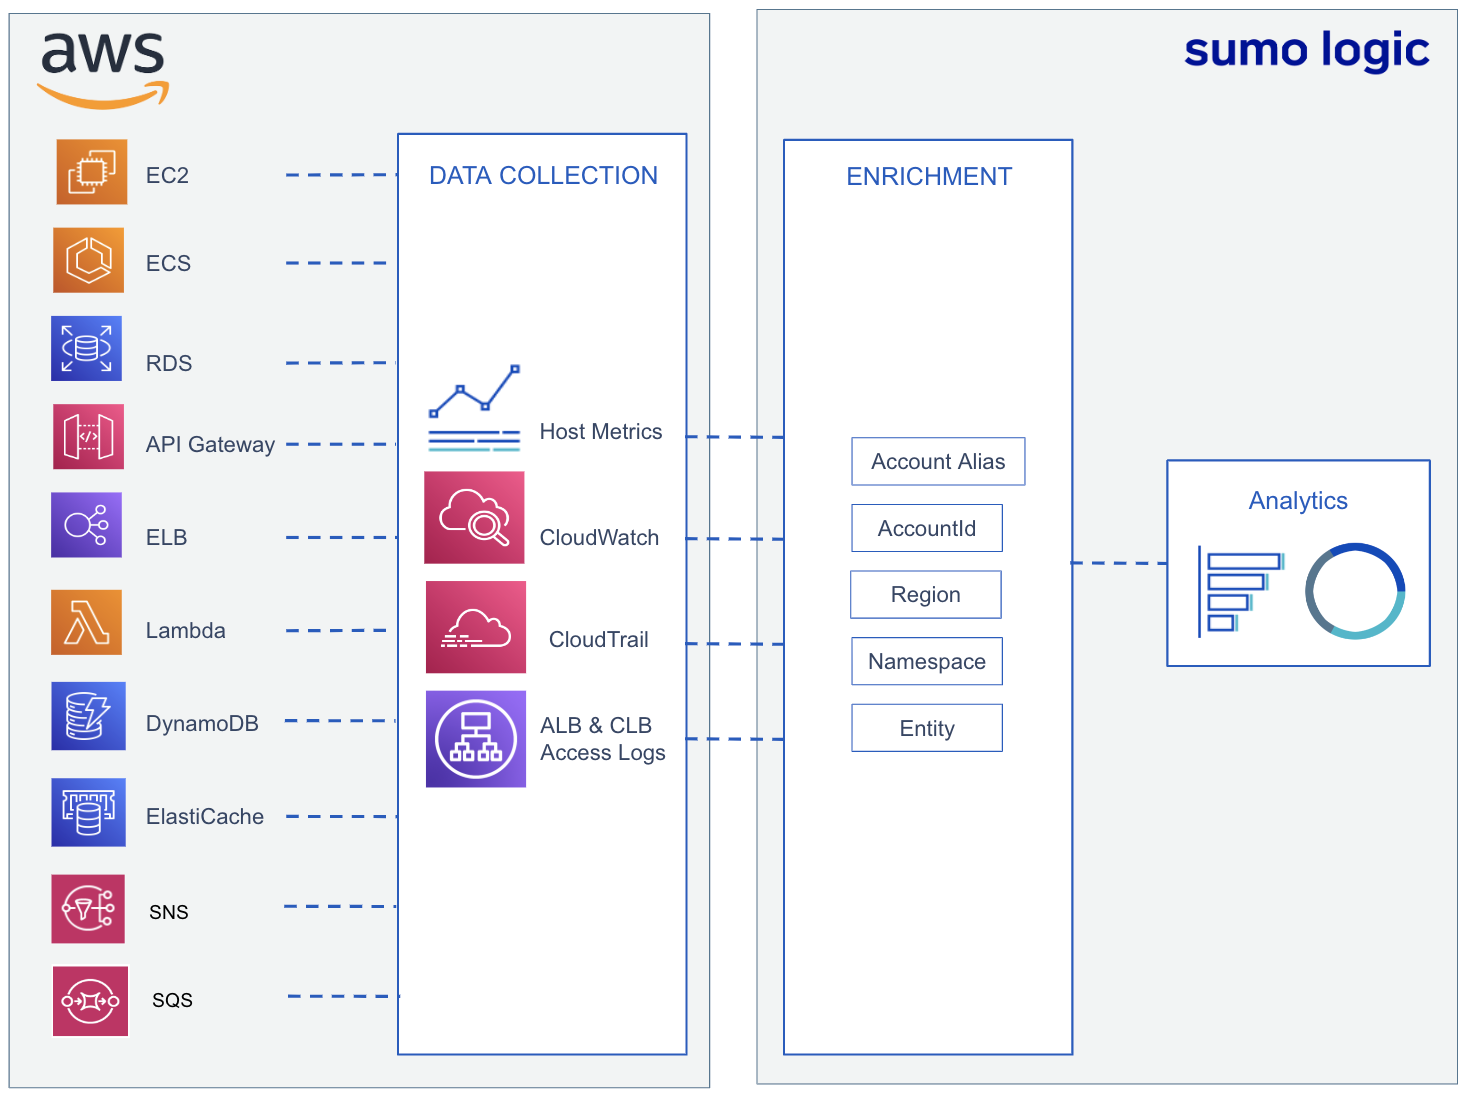
- Sumo Logic AWS Observability supports the following AWS services: EC2, ECS, Amazon RDS, Amazon ElastiCache, Amazon API Gateway, AWS Lambda, Amazon DynamoDB, Classic ELB, Application ELB, Network ELB, Amazon SNS, and Amazon SQS.
After you have prepared and deployed the solution, you can add and configure additional AWS services as your infrastructure grows.
Data collection and dashboards
Sumo Logic collects logs, metrics, and events including AWS EC2 Host Metrics, CloudWatch logs and metrics, and CloudTrail logs. The collected data streams are enriched with the following metadata:
- Account. This is an alias for your AWS account—for example, production, development, or stage—that you supply when you install the solution.
- Namespace. This is the name of the AWS service and is automatically added by either the Host Metrics Source or the AWS Metadata (Tag) Source installed by the template, for example, aws/apigateway, aws/applicationelb, aws/ dynamodb, aws/lambda, aws/rds, and so on.
- Region. This is the AWS region, for example, us-east-1, us-west-2, and so on.
- Entity. This represents either the AWS resource name or id depending on the AWS service being monitored.
This new metadata can also be used in ad hoc logs and metrics searches.
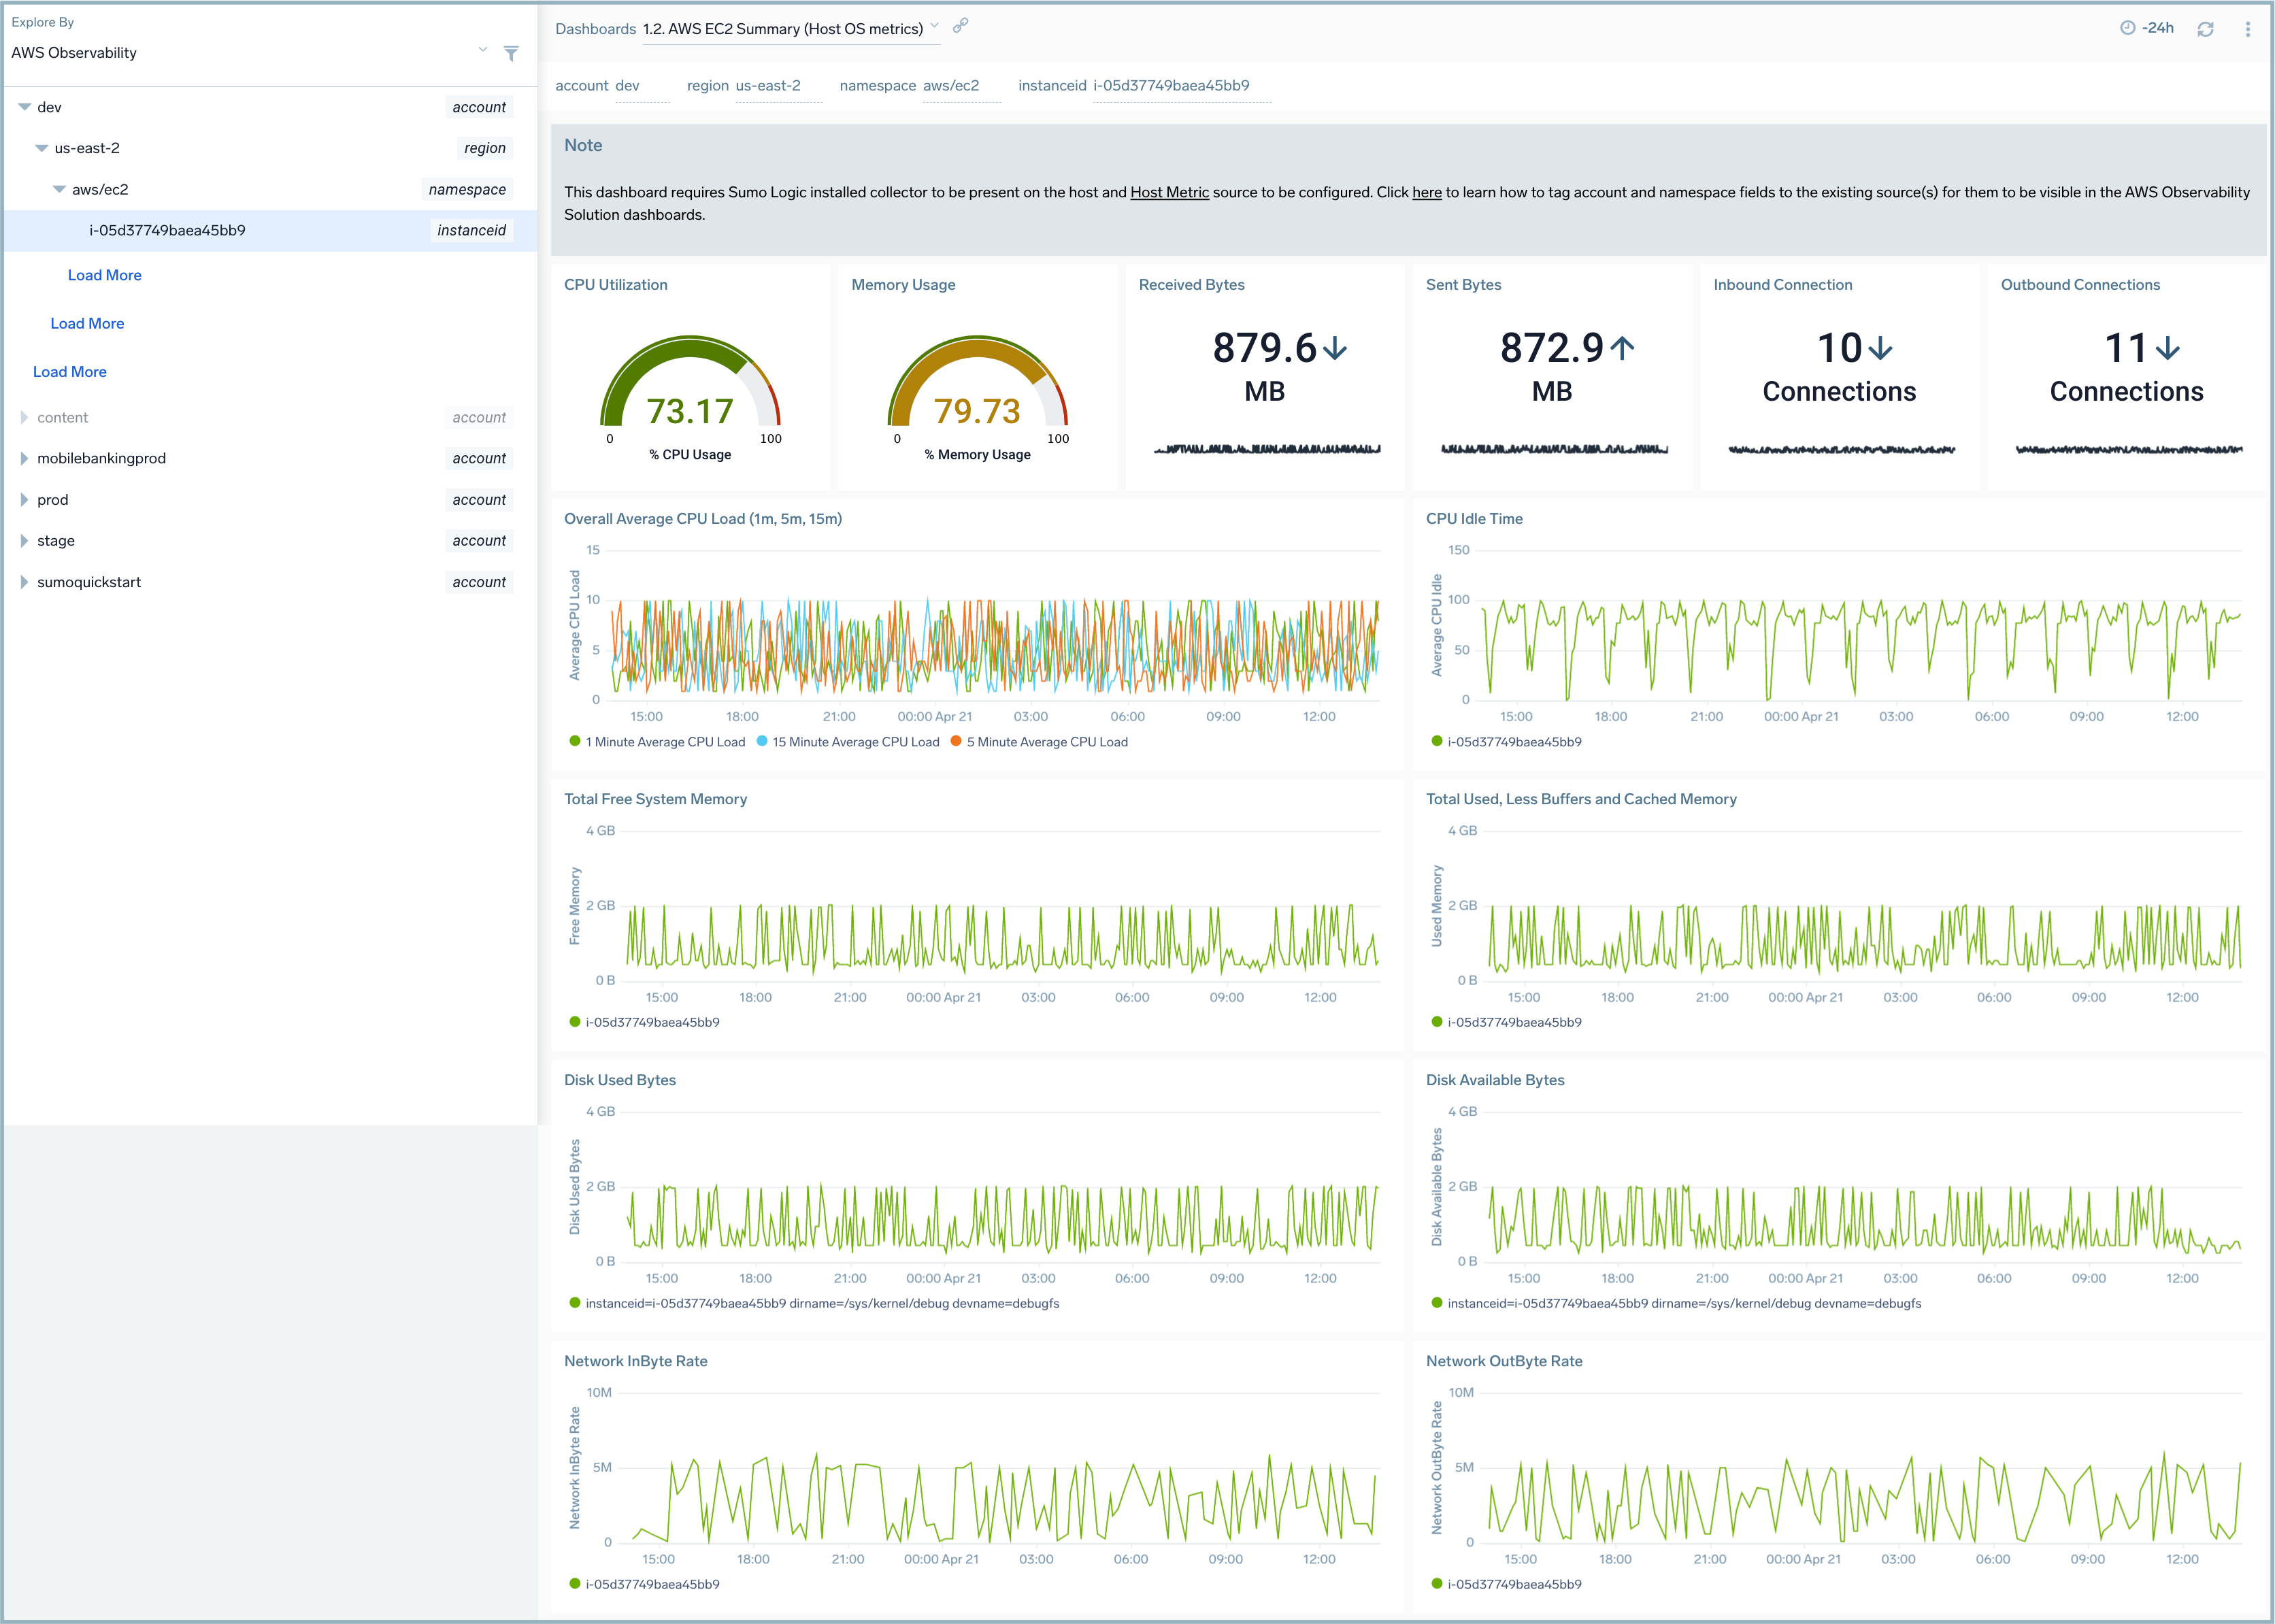
You can navigate from overview dashboards of the infrastructure and drill down into account, AWS Region, service, or entity views. The intuitive navigation enables you to quickly resolve issues, minimize downtime, and improve system availability. See View AWS Observability Solution Dashboards for details.
Work with AWS account hierarchies
Amazon Web Services (AWS) are available to you through your AWS accounts that you can then use for billing and various aspects of your cloud infrastructure. AWS recommends that you use multiple AWS accounts to manage costs across business units and functional teams. In this way, you can provide different levels of administrative control over various AWS resources.
In an AWS account, you can choose resources hosted in multiple locations worldwide. These locations are composed of AWS Regions and Availability Zones. Each AWS Region is a separate geographic area (for example, us-west-2 is in Oregon, USA) and has multiple, isolated locations known as Availability Zones. You can provision specified resources (such as databases and load balancers) across multiple Availability Zones, to ensure high availability and failover support.
Sumo Logic Apps for AWS Observability
The AWS Observability Solution provides an intuitive dashboard framework that mirrors industry-standard AWS hierarchies using a suite of Sumo Logic apps that provide insights into AWS operational and security services across an entire AWS infrastructure.
The following Sumo Logic AWS Observability Solution apps provide the ability to quickly isolate and solve problems with their specialized pre-configured dashboards:
- AWS Observability API Gateway. The Amazon API Gateway service allows you to create RESTful APIs and WebSocket APIs for real-time two-way communication applications in containerized and serverless environments, as well as web applications.
Sumo Logic's AWS Observability API Gateway dashboards provide insights into Amazon API Gateway tasks while accepting and processing concurrent API calls throughout your infrastructure, including traffic management, CORS support, authorization, access control, throttling, monitoring, and API version management. - AWS Observability Application Load Balancer. The AWS Application Load Balancer service functions at the application layer. It receives requests, evaluates the listener rules in priority order to determine which rule to apply, and then selects a target from the target group.
Sumo Logic's AWS Elastic Load Balancing app is a unified logs and metrics app that gives you visibility into the health of your AWS Application Load Balancer and target groups. This app's preconfigured dashboards provide insights into latency, request and host status, threat intel, and HTTP backend codes by availability zone and target group. - AWS Observability Host Metrics (EC2). The Sumo Logic app for AWS Observability Host Metrics (EC2) collects local host metrics and displays them using predefined search queries and dashboards for your Amazon Elastic Compute Cloud (Amazon EC2) service. This app's preconfigured dashboards provide insights into local host metrics for CPU, Disk, Memory, Network, and TCP.
- AWS Observability EC2. The Sumo Logic app for AWS EC2 allows you to collect your EC2 instance metrics (CloudWatch) and display them using predefined dashboards. This app's preconfigured dashboards provide insight into the analysis of EC2 instance metrics for CPU, Disk, Network, EBS, and Health Status Check. Also, it provides detailed insights into all CloudTrail audit events associated with EC2 instances and specifically helps identify changes, errors, and user activities.
- AWS Observability Lambda. The AWS Lambda service allows you to run code without the burden of provisioning or managing servers.
Sumo Logic's AWS Observability Lambda is a unified log and metrics app for monitoring operation and performance trends in the AWS Lambda function in your account. The AWS app uses AWS Lambda Logs and Metrics from CloudWatch, as well as CloudTrail AWS Lambda Data Events. Preconfigured dashboards provide insights into executions, such as memory and duration usage by function versions or aliases, as well as performance metrics such as errors, throttles, invocations, and concurrent executions. - AWS Observability DynamoDB. The Amazon DynamoDB service is a fast and flexible NoSQL database service that provides consistent, single-digit millisecond latency at any scale.
Sumo Logic's AWS Observability DynamoDB is a unified logs and metrics app that provides operational insights into your Amazon DynamoDB solution. The app provides preconfigured dashboards that allow you to monitor key metrics, and to view throttle events, errors, and latency, so you can plan the capacity of your Amazon DynamoDB. - AWS Observability RDS. The Amazon Relational Database Service (RDS) allows you to easily set up, operate, and scale a relational database in your cloud infrastructure.
Sumo Logic's AWS Observability RDS provides visibility into your Amazon Relational Database Service (RDS) metrics collected from the CloudWatch metrics. Preconfigured dashboards allow you to monitor your Amazon RDS system's overview, CPU, memory, storage, network transmit and receive throughput, read and write operations, database connection count, disk queue depth, and more. - Amazon ECS Dashboards. The Amazon Elastic Container Service is a scalable, container management service that is used to manage containers in a cluster. With dashboards for Amazon ECS, you can monitor capacity and resource utilization of ECS components as well as quickly identify changes made to your clusters to help with troubleshooting.
- Amazon ElastiCache. The Amazon ElastiCache allows you to set up, run, and scale popular open-source compatible in-memory data stores in the cloud.
The Amazon ElastiCache dashboards provide visibility into key event and performance analytics that enable proactive diagnosis and response to system and environment issues. Use the preconfigured dashboards for at-a-glance analysis of event status trends, locations, successes and failures, as well as system health and performance metrics. The dashboards also have additional performance insights for Redis clusters. - AWS Network Load Balancer. The AWS Network Load Balancer service is distributed in OSI Layer 4 (that is, network) traffic (for example, TCP, UDP, TLS) and can handle over a million requests per second.
The AWS Network Load Balancer dashboards provide insights to ensure that your network load-balancers are operating as expected, backend hosts are healthy and to quickly identify errors. - Global Intelligence for AWS CloudTrail DevOps. Helps you accelerate root cause analysis for incidents by providing error rate and configuration insights benchmarked from Sumo Logic’s AWS customers for nine AWS services: EC2, Lambda, Auto Scaling, S3, ELB, RDS, DynamoDB, ElastiCache, and Redshift. Benchmark dashboards are integrated with AWS Observability solution at the account and region level.
- AWS Observability Classic Load Balancer. The AWS Observability Classic Load Balancer is a unified logs and metrics app that provides visibility into the health of your AWS Classic Load Balancer. The preconfigured dashboards provide insights into latency, request and host status, threat intel, and HTTP backend codes by Availability Zones.
- Amazon SNS. The Amazon SNS app provides insight into the operations and utilization of your Amazon SNS service. The preconfigured dashboards help you monitor the key metrics by application, platform, region, and topic name, view the SNS events for activities, and help you plan the capacity of your SNS service.
- Amazon SQS. The Amazon SQS app provides insight into the operations and utilization of your Amazon SQS service. The preconfigured dashboards help you monitor the key metrics, view the SQS events for queue activities, and help you plan the capacity of your SQS service utilization.