View AWS Observability Solution Dashboards
Availability
This feature is available in the following account plans.
| Solution Component | CloudFlex | Credits |
|---|---|---|
| AWS Observability Dashboards | Trial, Professional, and Enterprise | Trial, Essentials, Enterprise Operations, Enterprise Security, Enterprise Suite, Enterprise Suite - Flex |
This page shows you how to intuitively navigate through your AWS environment and monitoring dashboards to view resource analytics in the AWS Observability Solution app dashboards. As you investigate resources, data appears in the window on the right. Metric and log data are viewable on the same dashboard in one seamless view.
You can also easily navigate to all features and functions of the AWS Observability solution in one place. Refer to the AWS Observability Hub page to learn more about the centralized page to access the AWS Observability solution.
Working with the AWS Observability View
The AWS Observability Solution comprises an intuitive dashboard framework that mirrors industry-standard AWS hierarchies. You can quickly navigate across multiple AWS accounts and view resources hosted in multiple locations worldwide. These locations are composed of AWS Regions and Availability Zones.
Navigate AWS Observability View
Monitoring dashboards provide an intuitive visual representation of your environment.
To to AWS Observibility tab in the home page or do the following:
- Classic UI. Go to the Home screen and select Explore. Then click the Explore By arrow and select AWS Observability from the dropdown menu.
New UI. In the main Sumo Logic menu, select Observability, and then under Infrastructure Monitoring, select AWS Observability. You can also click the Go To... menu at the top of the screen and select AWS Observability. - In the navigation panel, make a selection for the hierarchy to view. The contents of your selection appear below.
Navigate the AWS Observability Hierarchy
Once you open the AWS Observability View, you can peruse the accounts and related services in your AWS environment.
To investigate services in your AWS environment, do the following:
-
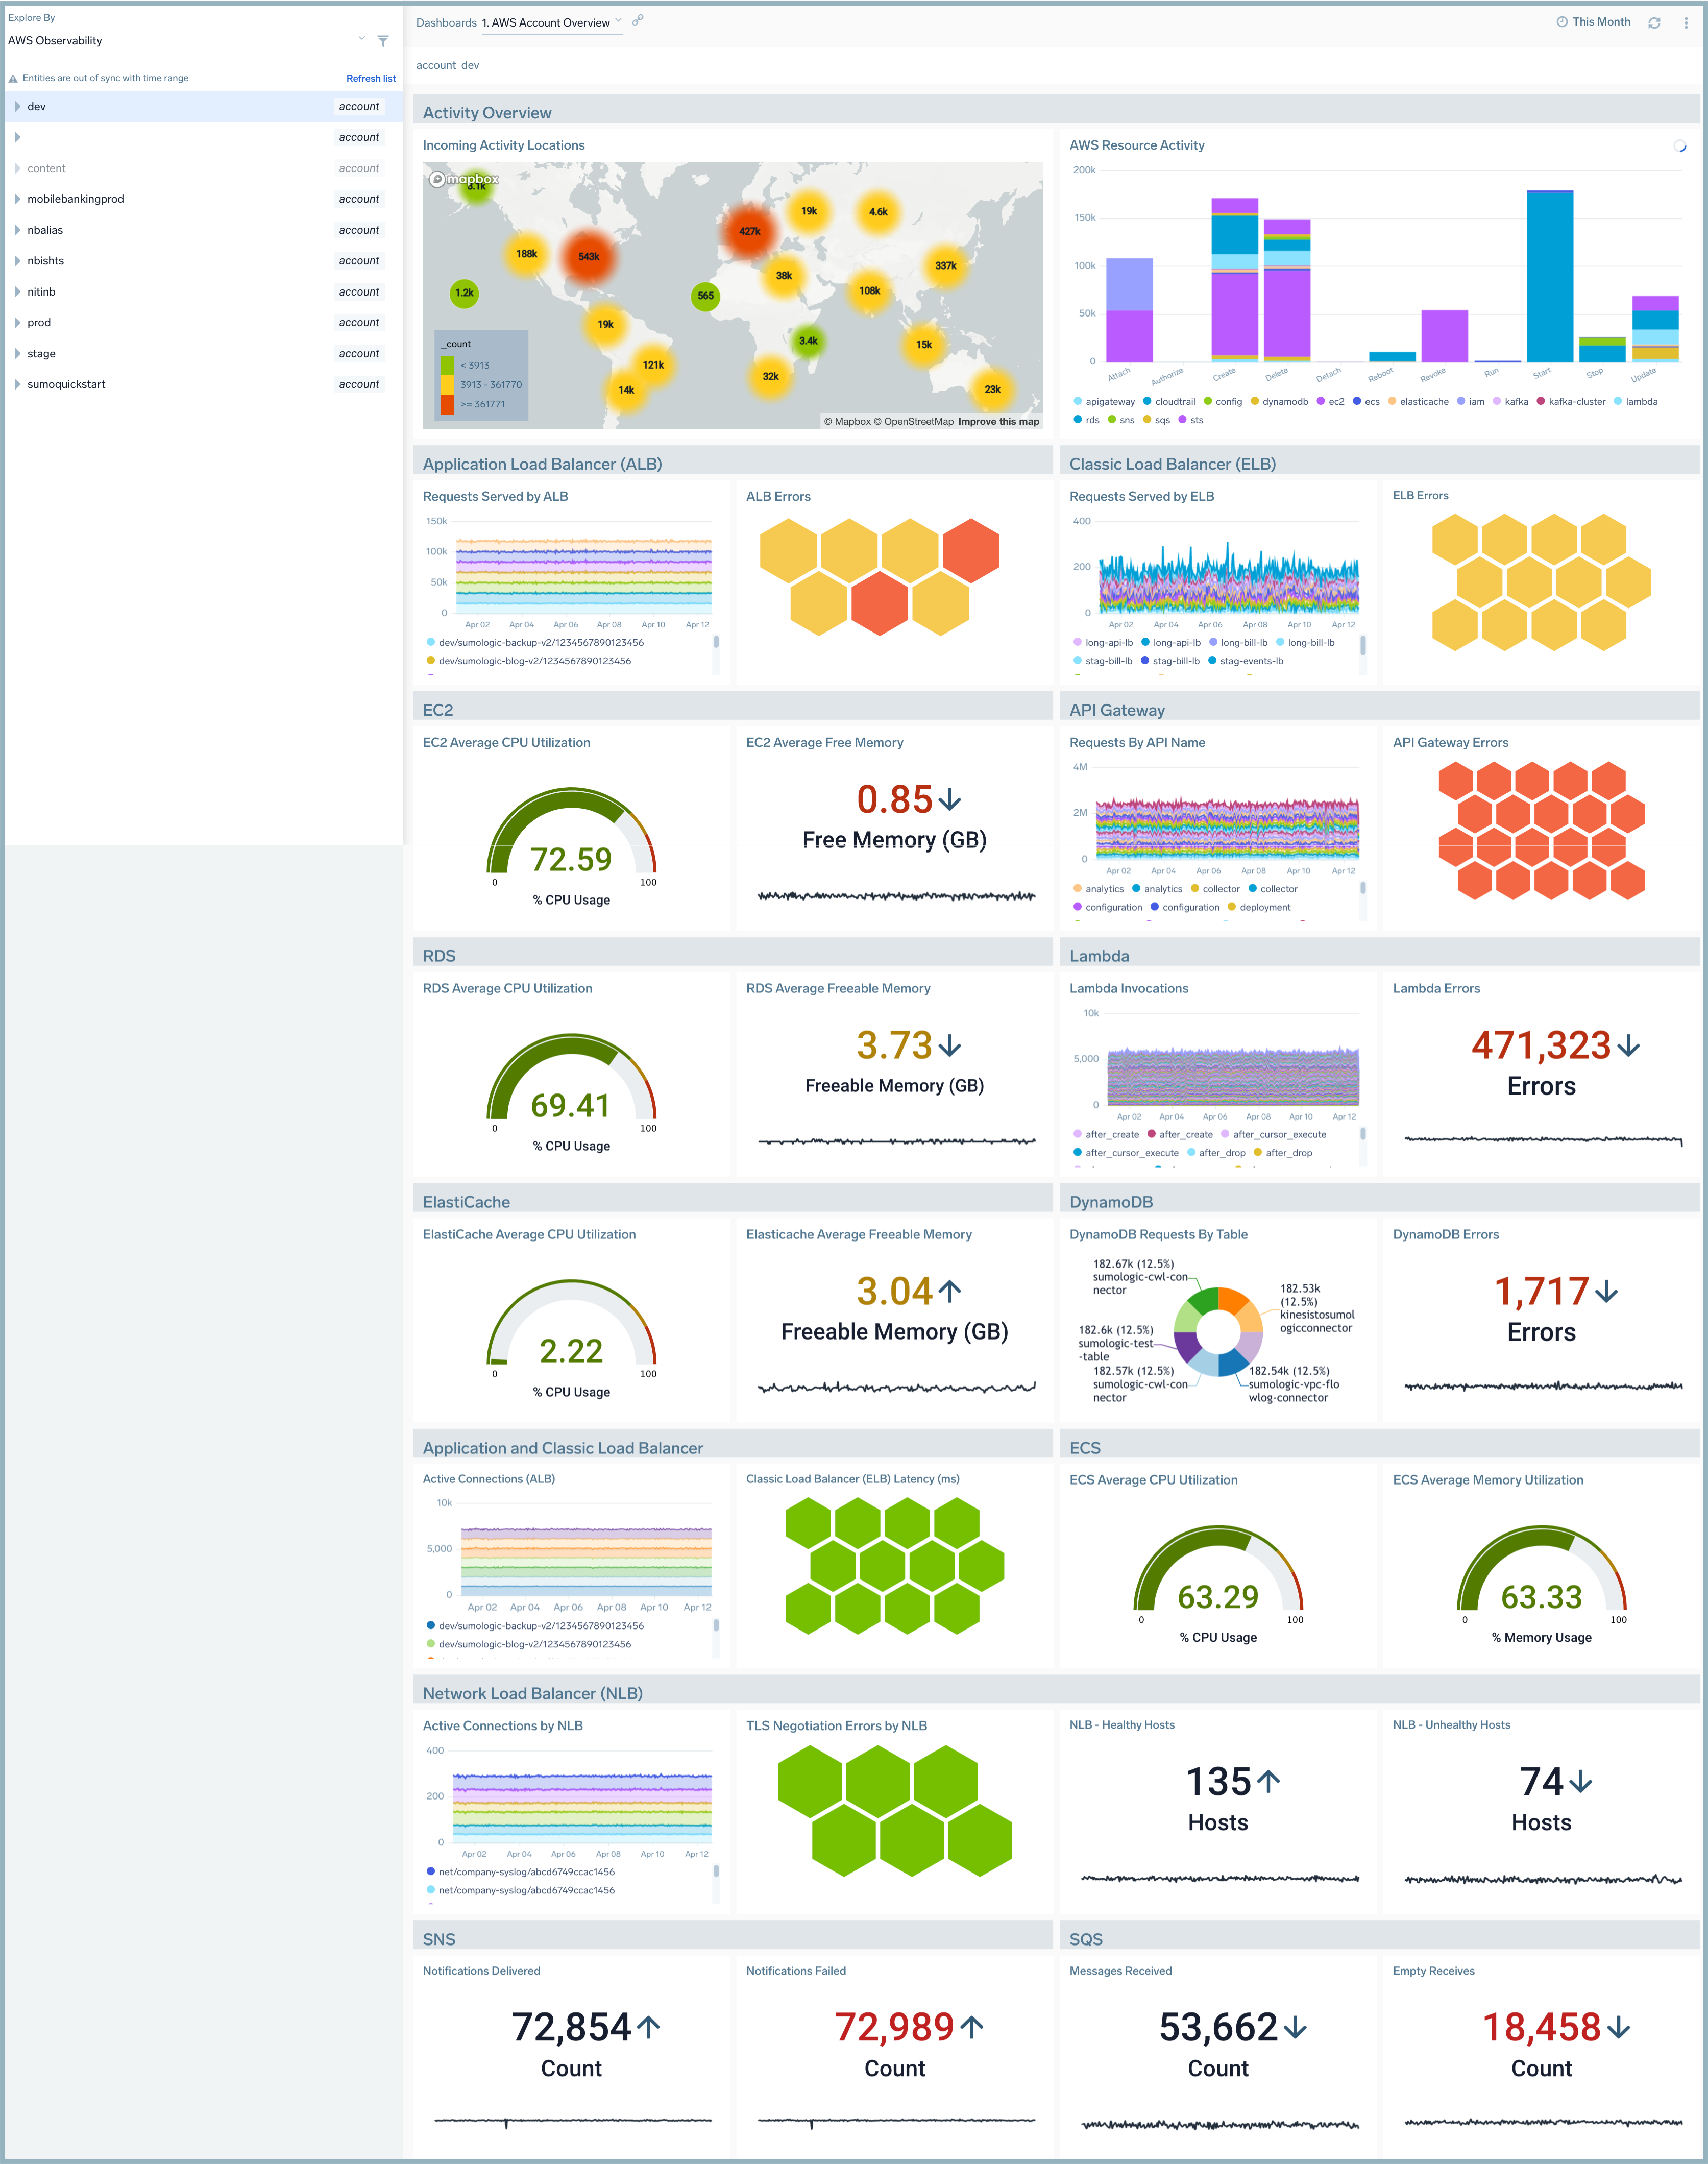
In the AWS Observability view, select an account to view a list of its regions.
The AWS Account Overview dashboard appears in the window on the right. The dashboard provides insights into the activities in the selected AWS account and gives you an at-a-glance view of the health and status of the AWS services in that account.
-
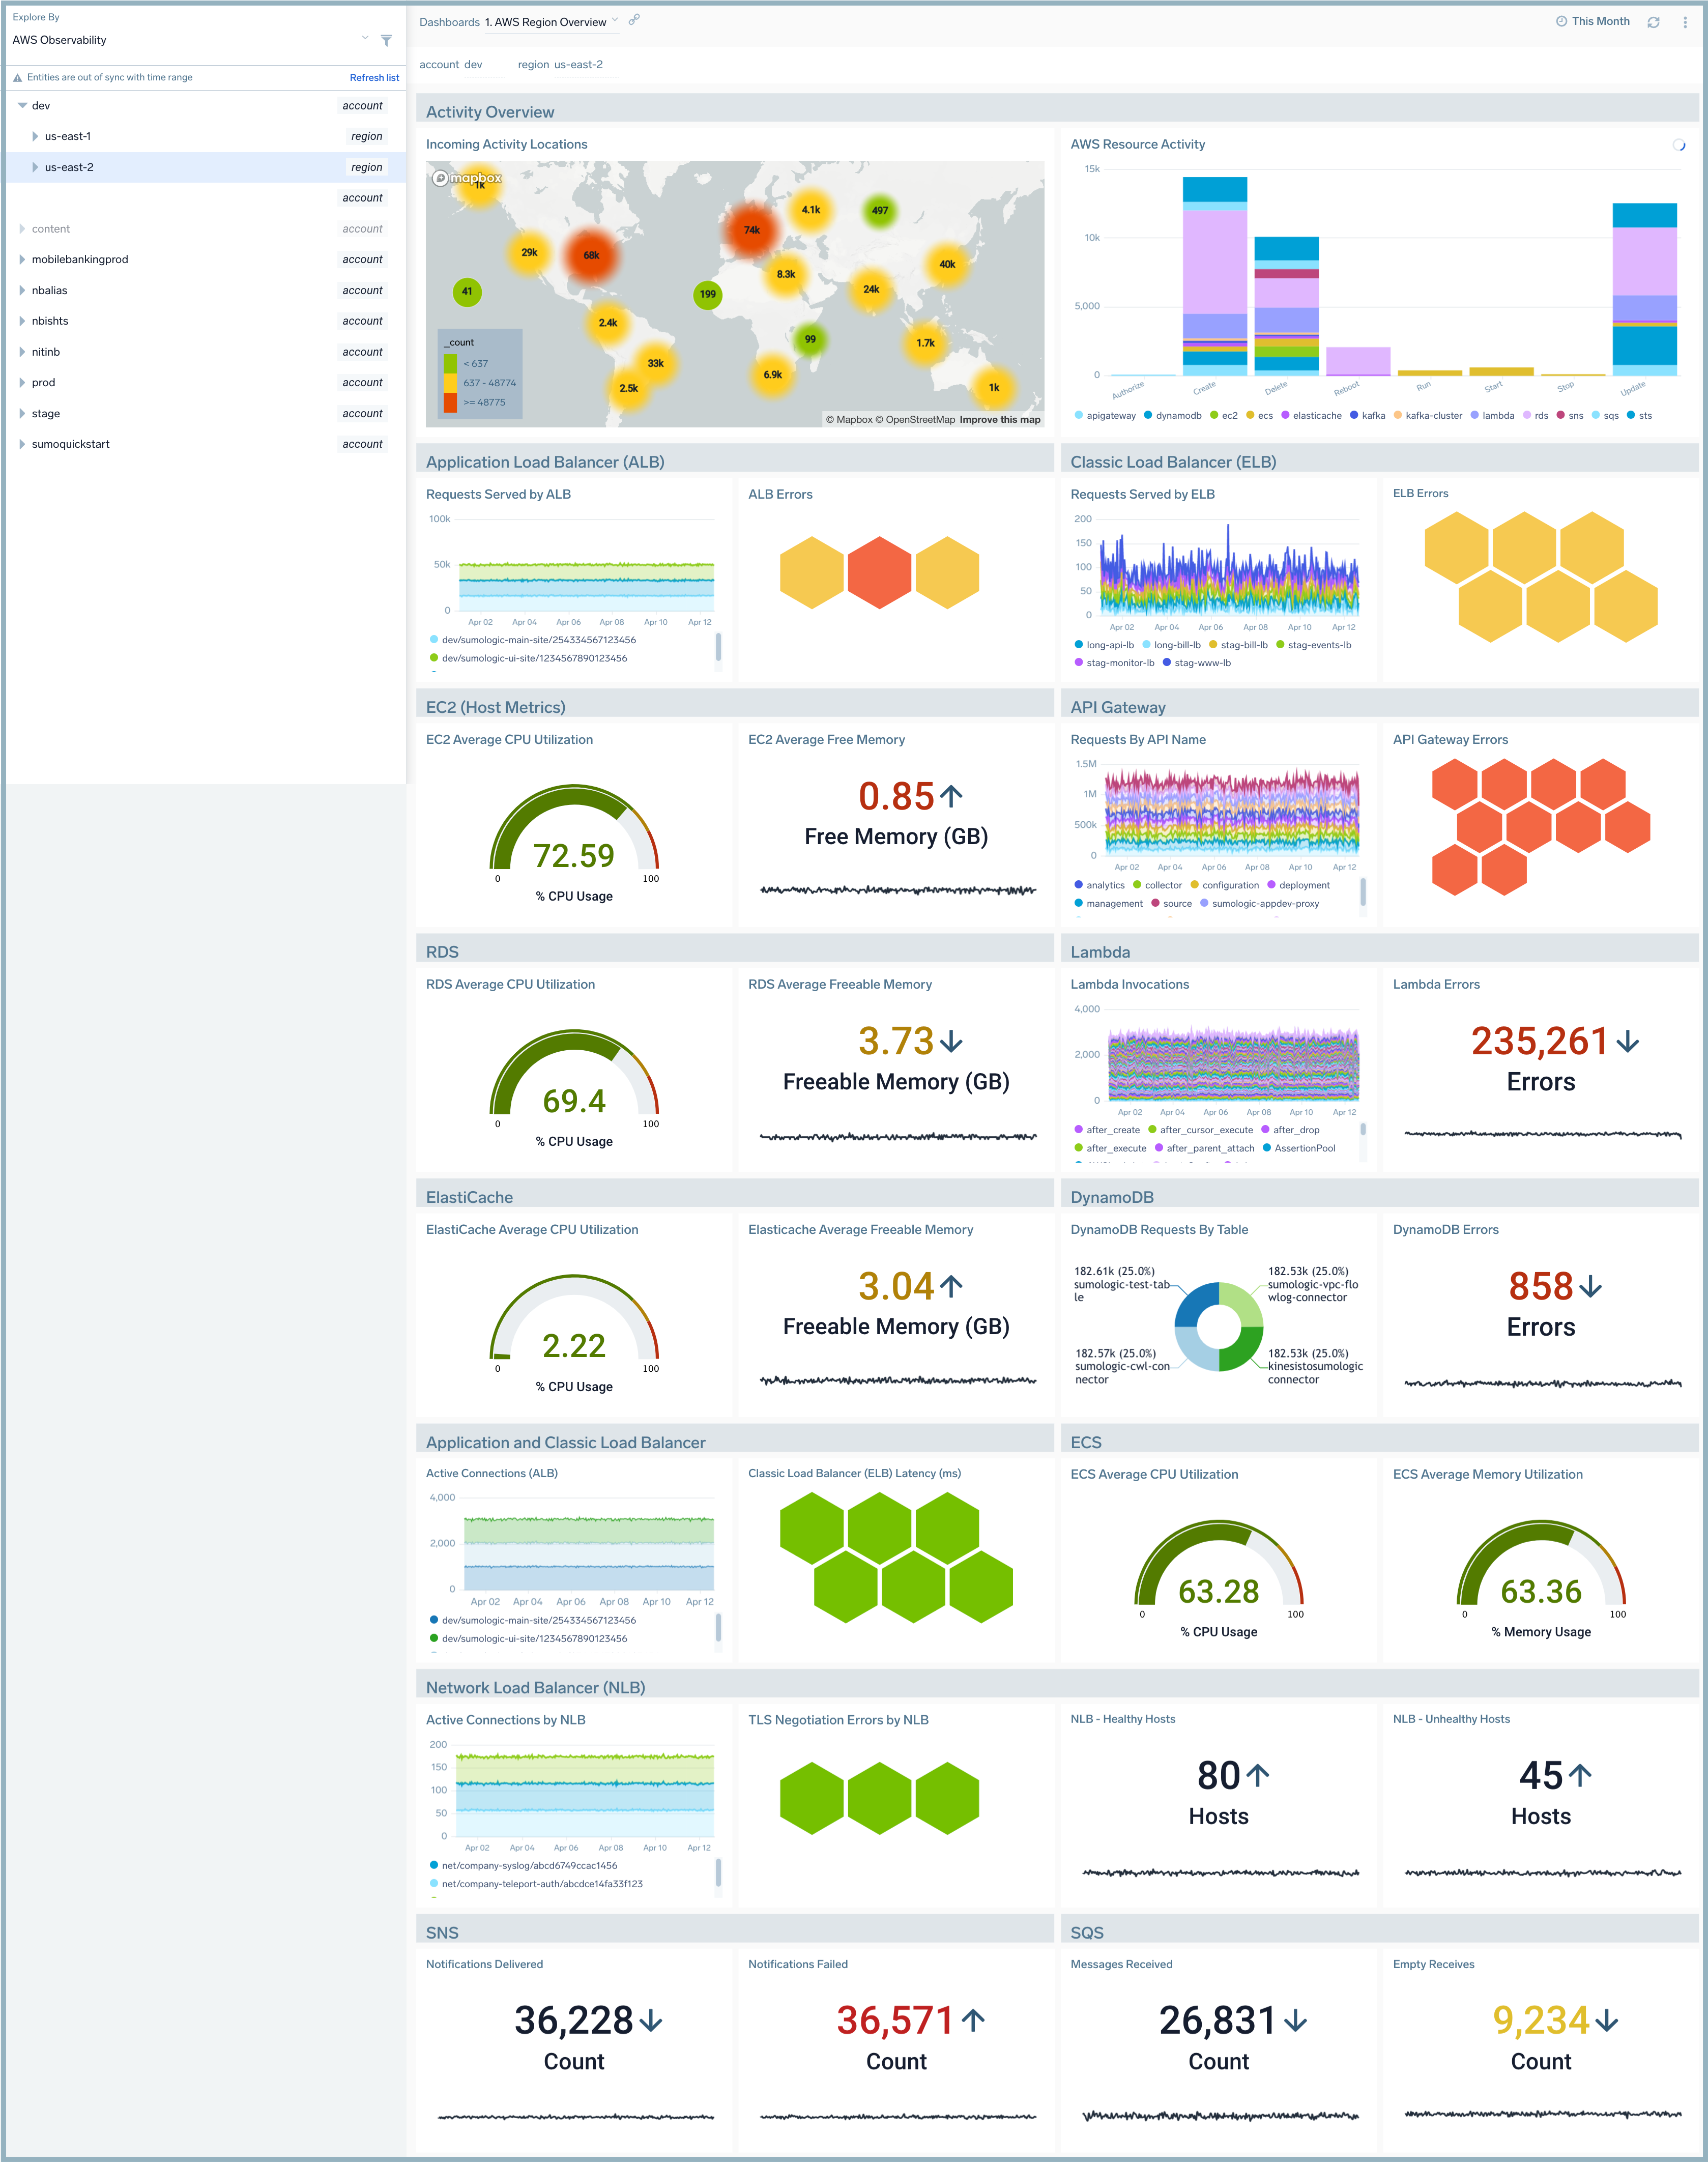
Similarly, from the expanded account, select a region.
The AWS Region Overview dashboard appears in the window on the right. The dashboard provides insights into the AWS account activities in that AWS region and gives you an at-a-glance view of the health and status of the AWS services in that account-region combination.
-
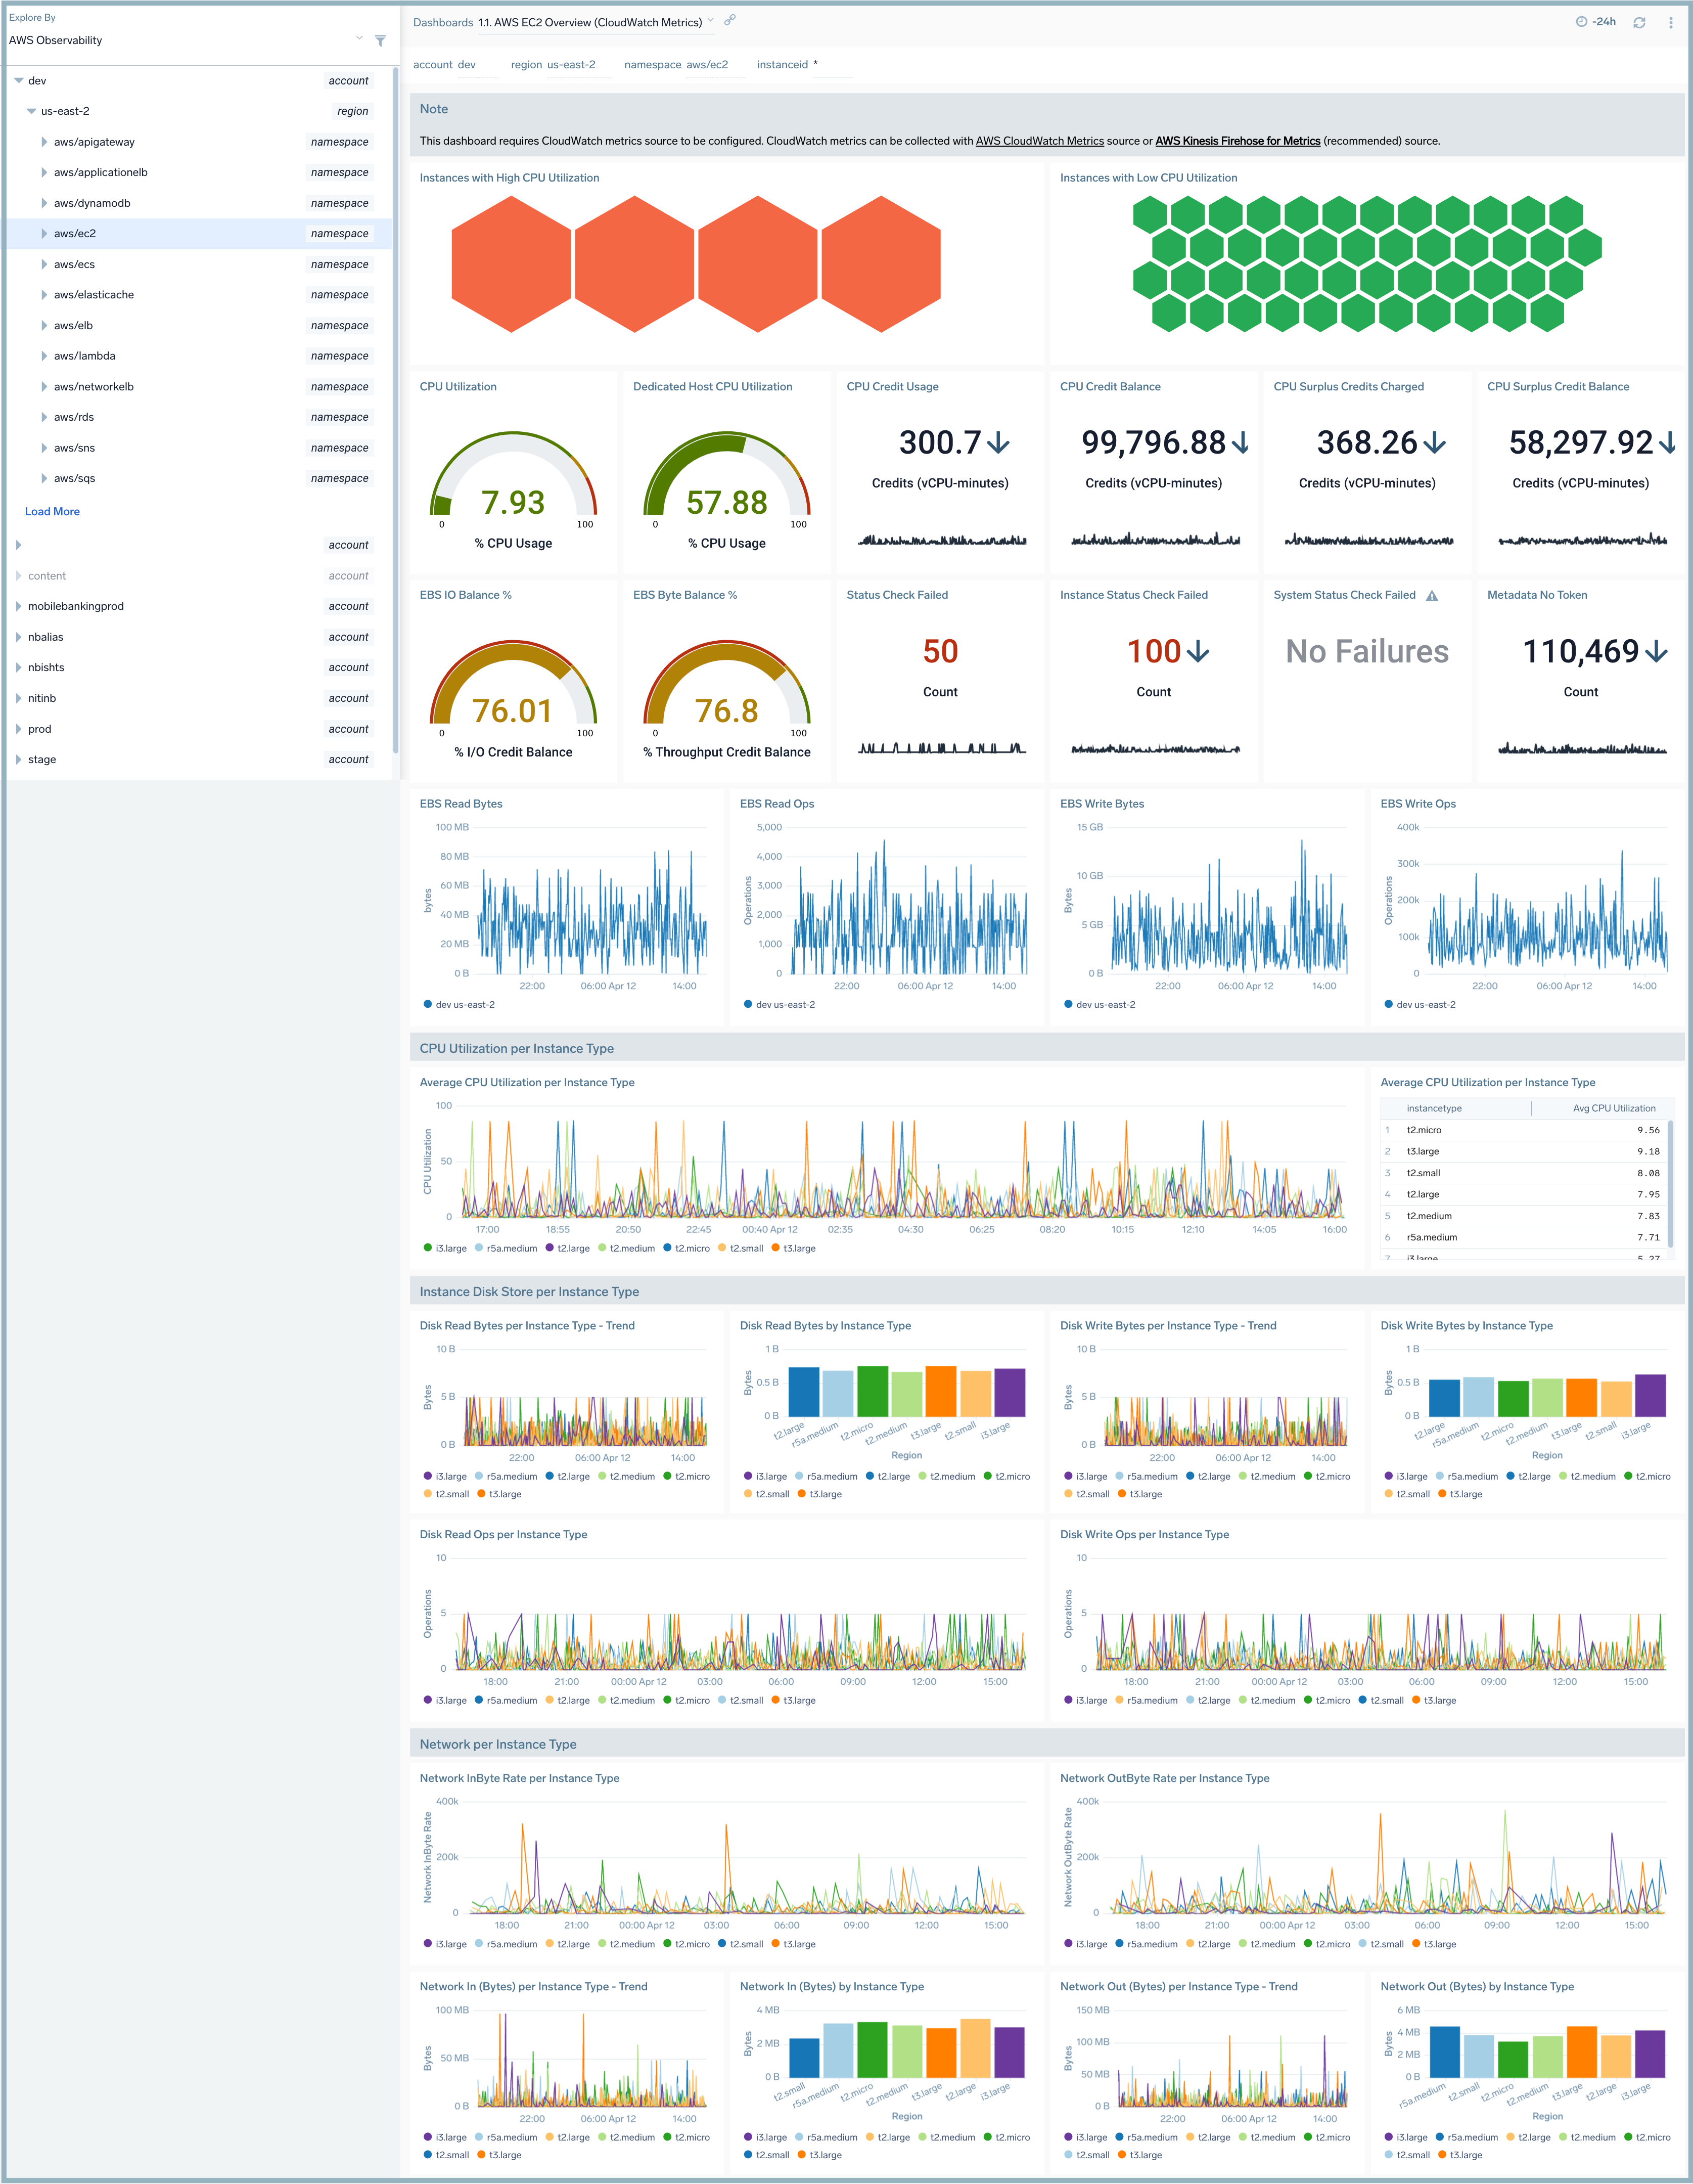
From the expanded account and region combination, select a namespace or AWS service. The dashboard for the selected namespace appears in the window on the right. In our example, we selected the AWS EC2 Metrics namespace in the us-east-1 region of the prod account.
Drill down for root cause analysis
From each level in the hierarchy, you can drill-down to individual entities by opening any logs or metrics dashboard panel. To do so:
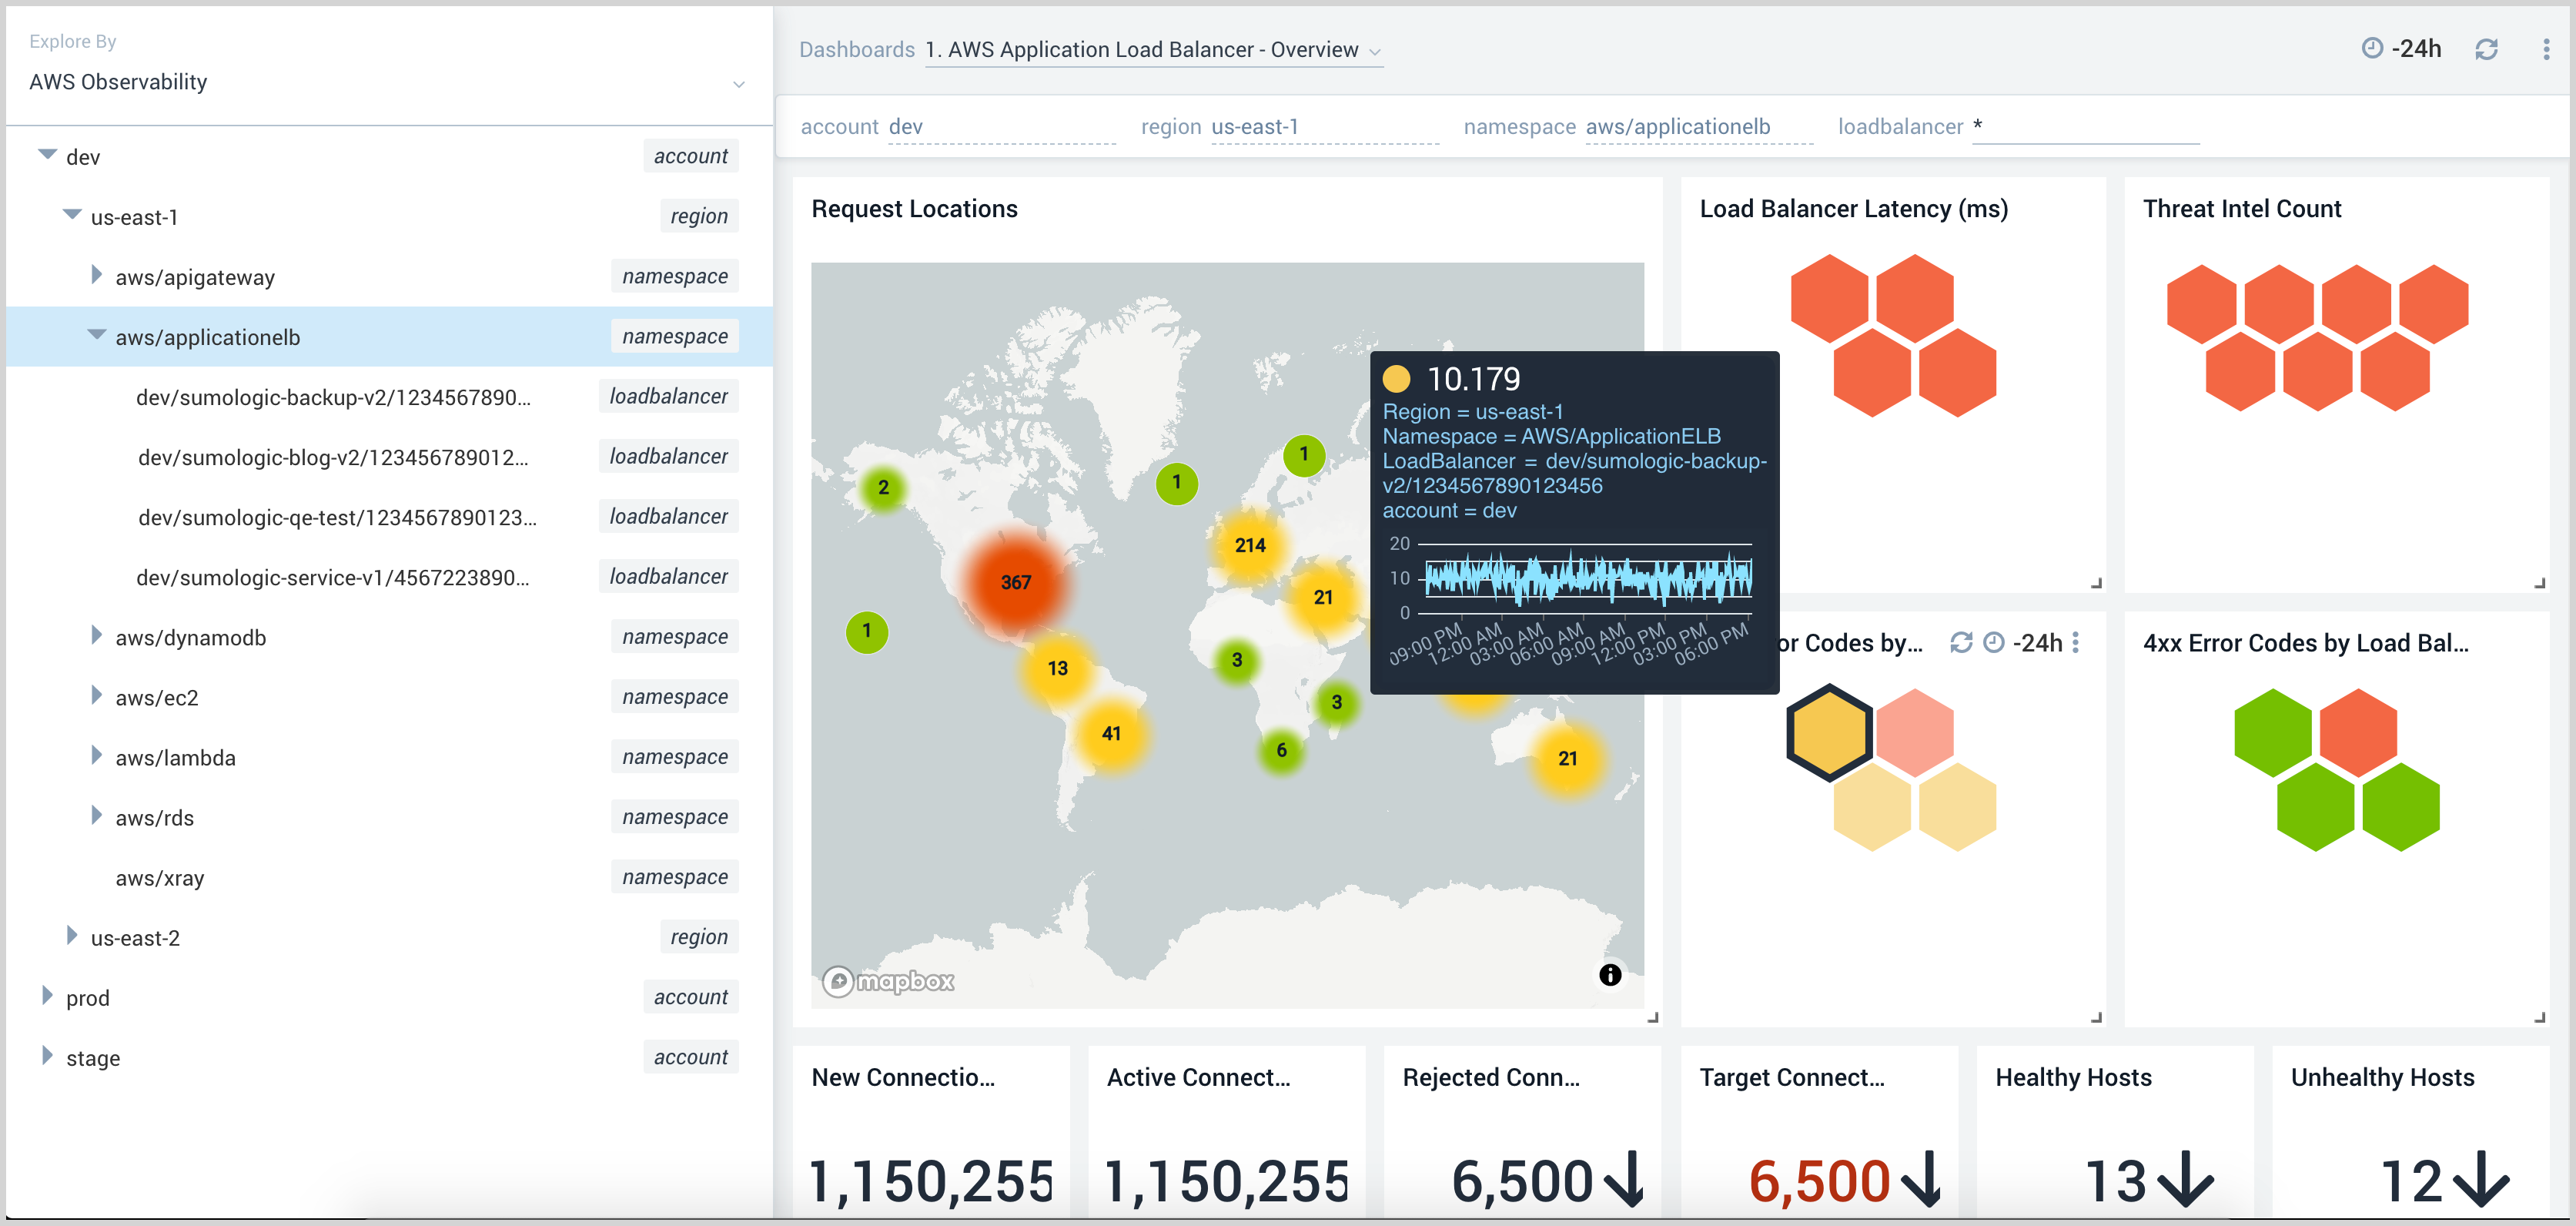
Select the graph data point you are interested in. In the following screenshot, we selected 5xx Error Codes by Load Balancer in the honeycomb graph. A list of related content links for our failed pod appears in a panel on the right.
For details, see Drill down to discover root causes.
Viewing AWS Observability Solution Dashboards
All of the apps are installed in a folder named Sumo Logic AWS Observability Apps that is located in your personal folder.
To add a new dashboard to your hierarchy, refer to the instructions in the Add new Service documentation.
To view the app dashboards:
- Navigate to your Sumo Logic personal folder.
- Click an app folder to list the dashboard pages.
- Click a page link to view the dashboard in the window on the right.
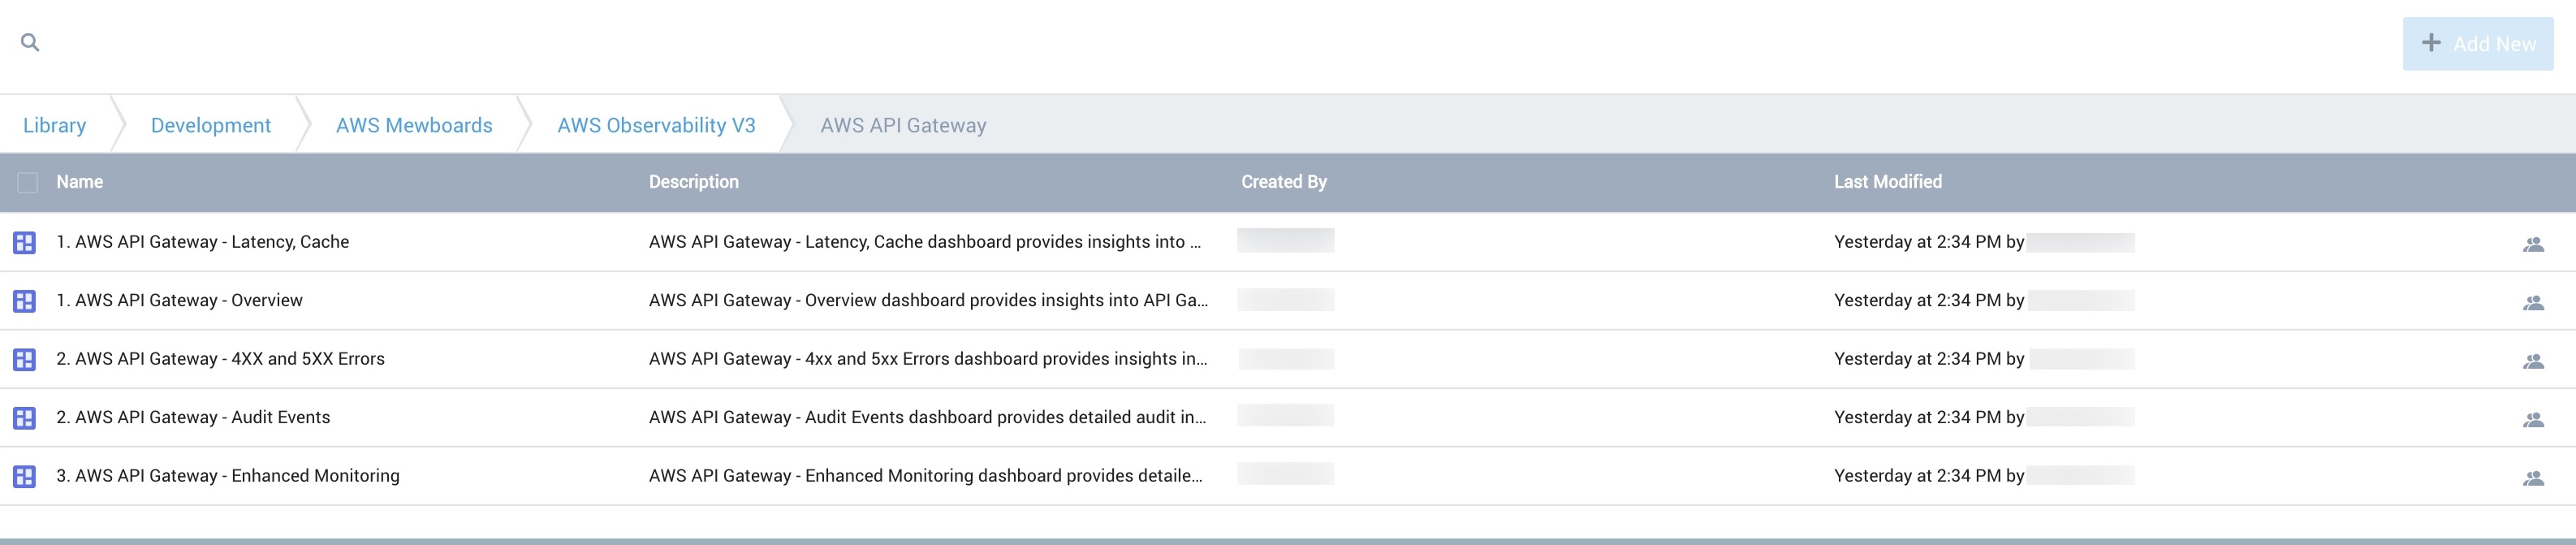
Click a link for information on the individual app dashboards:
- AWS API Gateway Dashboards
- AWS Application Load Balancer Dashboards
- AWS DynamoDB Dashboards
- AWS EC2 Host Metrics Dashboards
- AWS EC2 Metrics Dashboards
- AWS Lambda Dashboards
- Amazon RDS Dashboards
- Amazon ElastiCache Dashboards
- Amazon ECS Dashboards
- AWS Network ELB Dashboards
- Global Intelligence for AWS CloudTrail DevOps
- AWS Classic Load Balancer Dashboards
- Amazon SNS Dashboards
- Amazon SQS Dashboards