AWS Observability FAQs
This section provides frequently asked questions and information about the AWS Observability Solution to monitor and troubleshoot your AWS cloud infrastructure.
What is Observability?
Observability is the ability of the internal states of a system to be determined by its external outputs. For our purposes, Observability is the ability to observe an application from the outside and understand what is happening inside the application and its services. It helps ensure that the application is running reliably: the system is up and running (available), performant, and secure.
Modern applications are increasingly complex, as they leverage distributed technologies, cloud infrastructure, and container and orchestration tools. In addition, the connections between microservices, orchestrators, and underlying cloud resources is also growing in complexity. This complexity leads to situations where unforeseen events, unknown unknowns in terms of risk, are more prevalent and come with mysterious behaviors and failure modes. This can cause major issues in your overall incident remediation workflow, which can be broken down into three steps.
See About the Observability Solution to learn more.
What is AWS Observability?
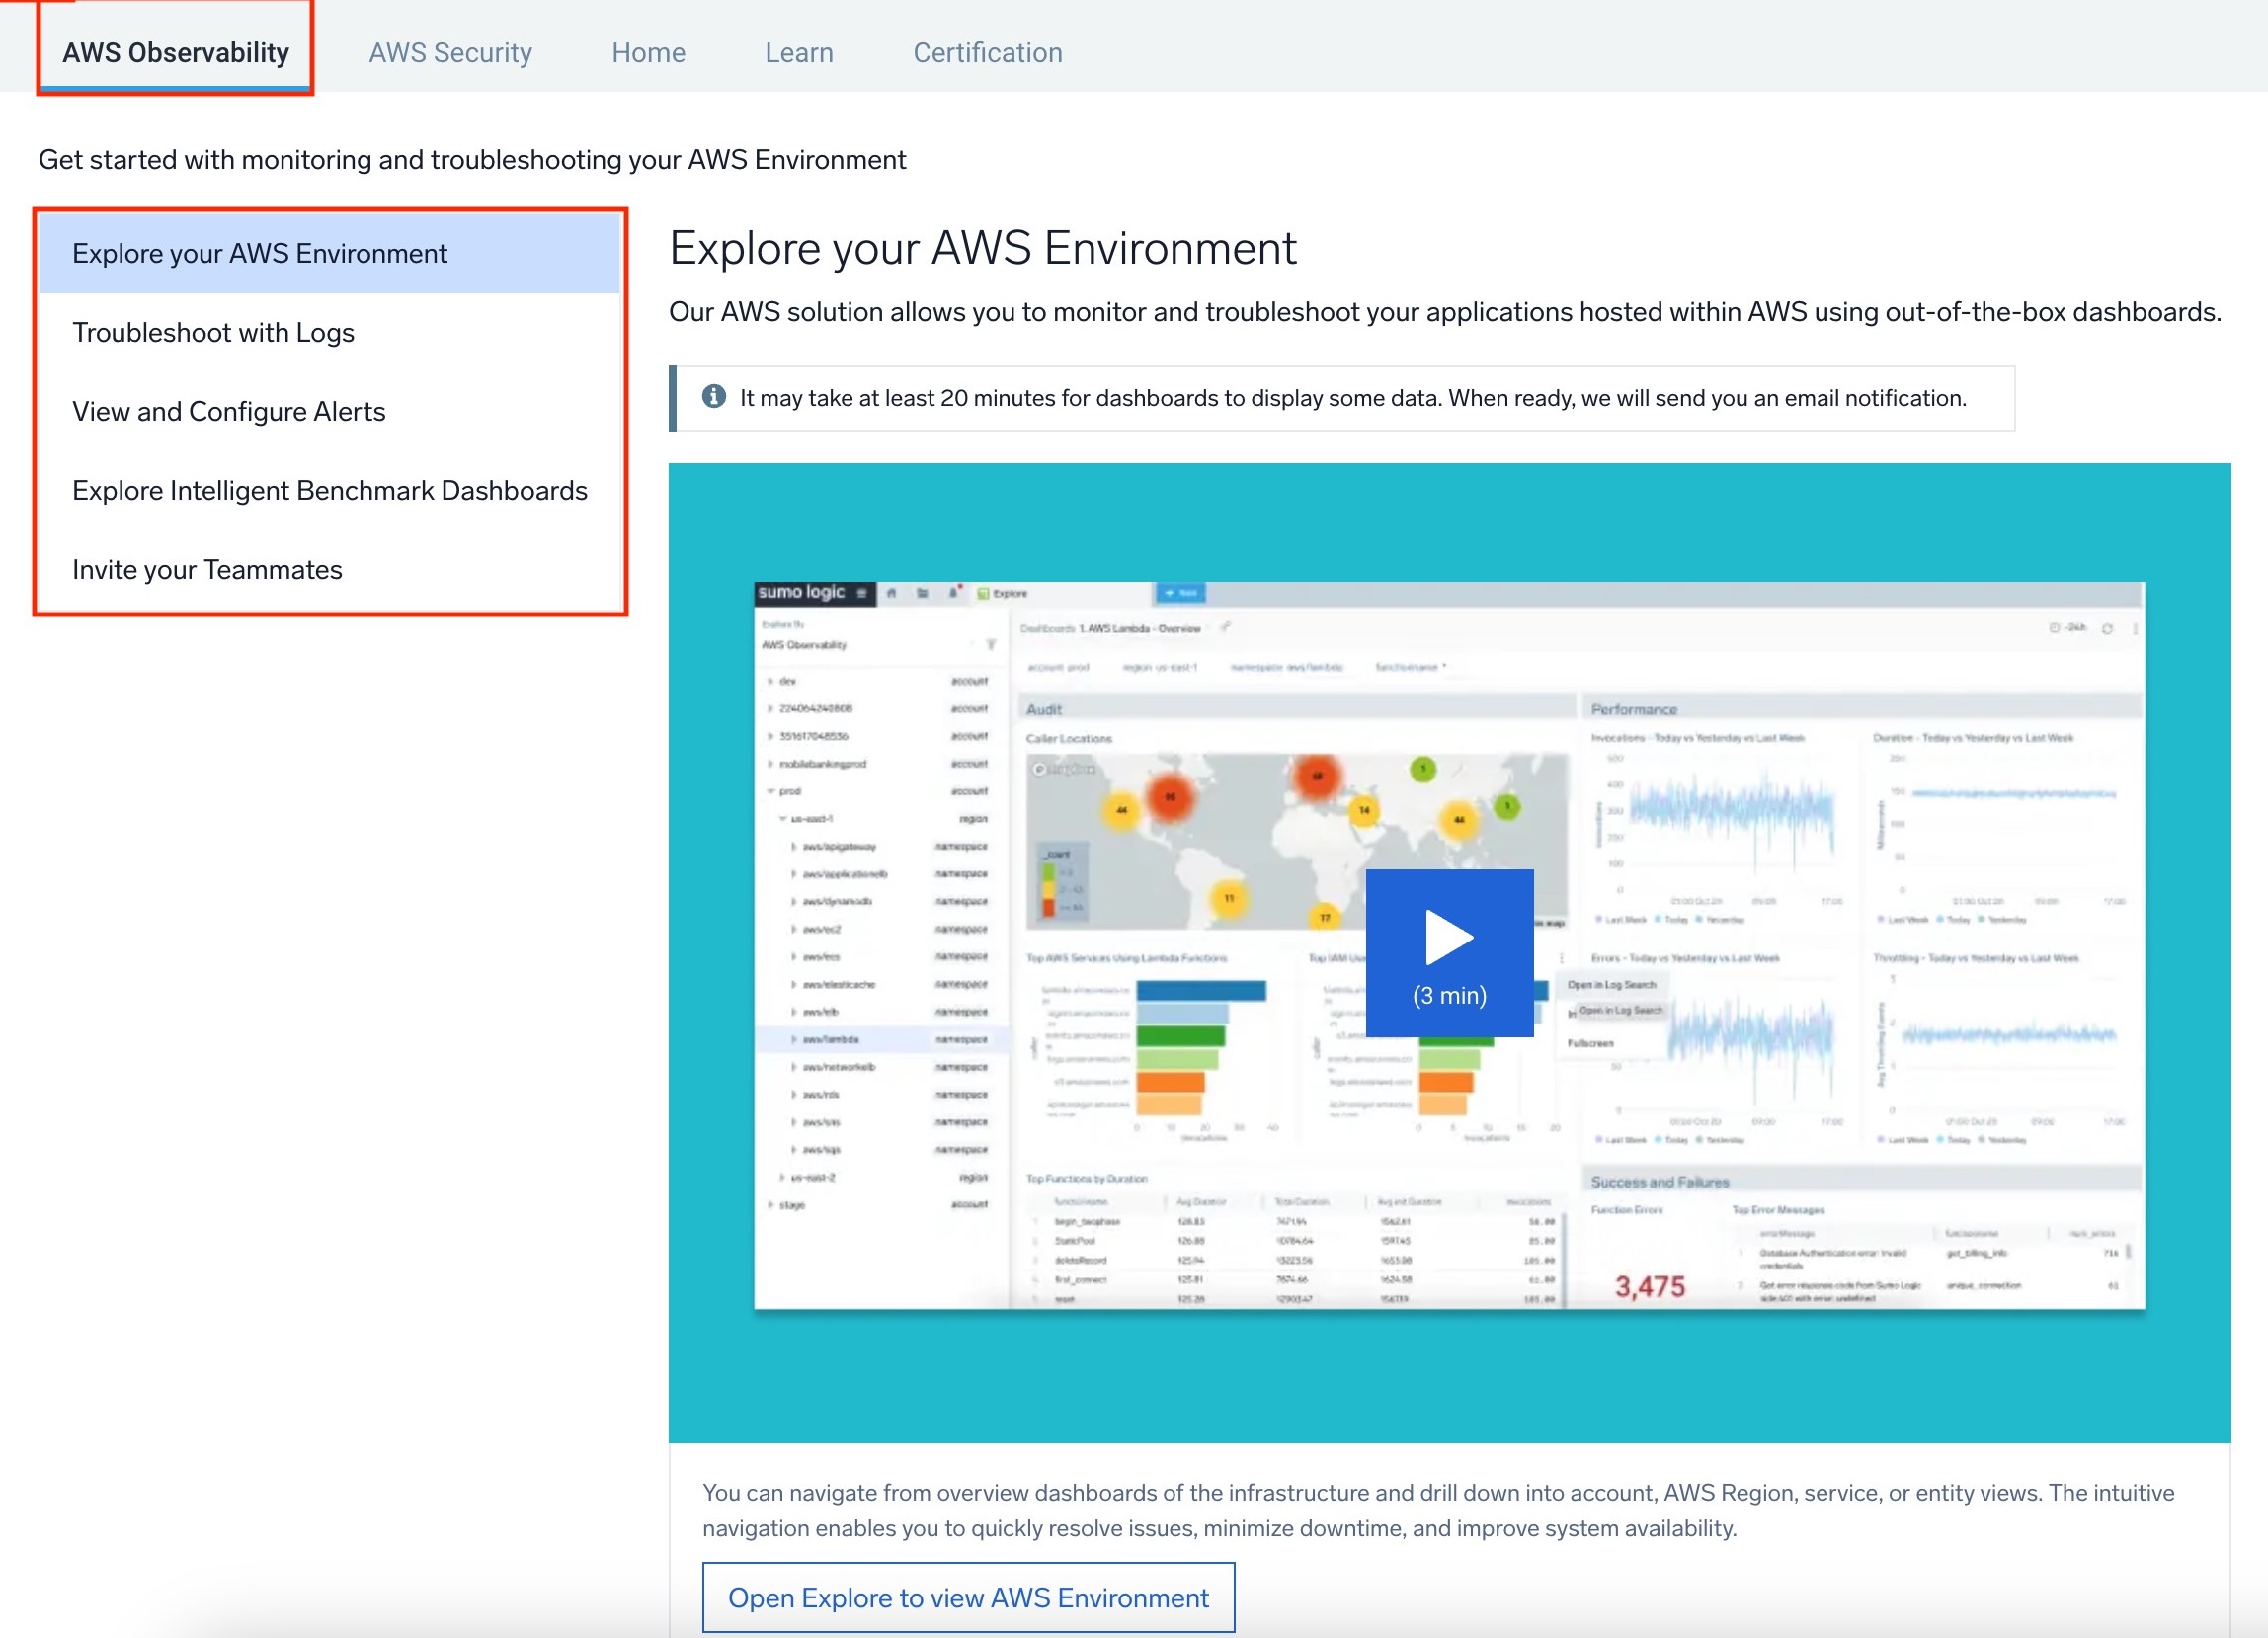
Our AWS Observability solution enables you to view your entire AWS environment in a single pane of glass, while seamlessly surfacing anomalous events of interest correlated with application incidents.
- AWS Observability Solution - Sumo Logic’s AWS Observability solution pulls in data across key AWS services and accounts to give a unified view of AWS environments. Easily navigate from overview dashboards into account, region, availability zone, or service specific views. Intuitive navigation ensures teams can quickly resolve issues, minimize downtime, and improve system availability. See About AWS Observability.
See AWS Observability Apps for detailed information on all supported apps including Application, Classic, and Network Load Balancer, DynamoDB, EC2, RDS, API Gateway, ECS, ElastiCache, Lambda, SNS, and SQS.
What AWS services are supported?
Sumo Logic AWS Observability supports the following AWS services: EC2, ECS, RDS, ElastiCache, API Gateway, Lambda, DynamoDB, Application ELB, Classic ELB, Amazon SNS, Amazon SQS, and Network ELB.
What is AWS Observability centralized/hub page?
The hub is designed to provide easy navigation to all features and functions of the AWS Observability solution in one place. From the hub, you can navigate to the dashboards, monitors (for alerting), and pre-baked log searches for troubleshooting that come with the AWS Observability solution.
You can access the hub by clicking on the Home button and selecting the AWS Observability tab from the top menu bar.
The hub has the following pages:
Explore your AWS Environment. Provides you access to dashboards that help you monitor your AWS environment. Troubleshoot with Logs. Provides log searches to help you get started troubleshooting issues within your AWS environment. View and Configure Alerts. Provides you access to monitors that will alert you about issues within your AWS environment. Explore Intelligent Benchmark Dashboards. Provides you access to our global benchmark dashboards to help you compare your AWS environment with Sumo benchmarks and identify issues. Invite your teammates. Allows you to quickly add other users to your Sumo Logic account.
Can we monitor other AWS services?
AWS Observability provides a view across AWS accounts, regions, namespaces, and entities to present an intuitive navigation flow. You can add additional services to the AWS hierarchy as dashboards based on logs and metrics data to the AWS Observability view, expanding as you add new services.
Adding a service requires:
- The AWS Observability solution must be installed for at least one supported service.
- Collect metrics for your service using a Sumo Logic AWS CloudWatch metrics source for an AWS account currently monitored by the AWS Observability solution. We recommend creating a new AWS CloudWatch metrics source for the service you want to monitor as opposed to using an existing source for performance reasons.
- Create at least one Sumo Logic dashboard based on CloudWatch metrics and log data to monitor the operations of the AWS Service.
See Add a New AWS Service to the AWS Observability View Hierarchy to add a new service to the AWS Observability hierarchy.
Does AWS Observability require logs and metrics?
For full functionality of the out-of-the-box dashboards, the solution requires CloudWatch logs and metrics, EC2 Host Metrics (via installed collectors), and CloudTrail logs. You may be sending real-time data from AWS, primarily used for logs. These features expand monitoring to provide advanced analytics for large-scale AWS operations from the same dataset.
Who can use the new features?
Any Sumo Logic customer can leverage Sumo Logic AWS Observability solution features.
Setup and Deployment
See the following frequently asked questions (FAQs), and see Deploy AWS Observability for requirements and instructions.
How do you set up AWS services for monitoring?
You set up your AWS services using a AWS CloudFormation template (CFN) that is run in your AWS account. When run, resources are generated in Sumo Logic to collect logs and metrics. See Before You Deploy for prerequisites, requirements, and instructions to use the CFN.
Can I deploy with CloudFormation?
Yes, you can deploy with CloudFormation template. See Deploy with CloudFormation for information.
If you have already set up the solution with Terraform and want to move to CloudFormation, we recommend that you:
-
Start with an existing AWS account and region combination (preferably a non-production dev/test account), delete the AWS Observability Terraform stack associated with it, then on-board that account-region combination using CloudFormation template.
-
Once you confirm that the solution has been deployed successfully, you can then repeat the process for additional AWS accounts and regions.
Can I deploy with Terraform?
Yes, you can deploy using a Terraform script. See Deploy with Terraform for detailed instructions, options, and a GitHub repository of files to use in your deployment script.
If you have already set up the solution with CloudFormation in the past and want to move to Terraform, we recommend that you:
-
Start with an existing AWS account and region combination (preferably a non-production dev/test account), delete the AWS Observability CloudFormation stack associated with it, then on-board that account-region combination using Terraform scripts.
-
Once you confirm that the solution has been deployed successfully, you can then repeat the process for additional AWS accounts and region.
What resources are generated during set up?
See Resources in AWS Observability Solution for a complete list of resources the CloudFormation (CFN) template and Terraform Script creates at deployment, in AWS, and in Sumo Logic.
Why are Field Extraction Rules and Metrics Rules created as part of the installation scripts?
Field Extraction Rules (FER) and Metric rules are created by the CloudFormation template and Terraform Script to ensure that data is enriched with AWS account information (accountid, account alias, region, namespace and entity).
If you have existing AWS sources with FERs, and you choose to reference an existing source in the CloudFormation or Terraform installation, your FERs will not be changed in any way unless the names are the same. Multiple FERs can co-exist on the same source or metadata.
As of our current release, Fields and FERs will be imported into Terraform. You can also rename any existing FERs. The Terraform script will create new FERs and maintain the state in Terraform.
Renaming an existing FER has no effect on FER usage.
See AWS Observability Resources for the list of Field Extraction Rules in the resources.
How do you keep track of changes and make feature updates?
Sumo Logic provides updates to the AWS Observability solution through CloudFormation and Terraform. See the changelog to review all the changes and pointers to the CloudFormation templates associated with each version. AWS provides the ability to update a CloudFormation stack. To learn more about how to update your stack, see Update the AWS Observability Stack.
What are options to monitor EC2 Host Metrics?
There are two ways EC2 can be monitored. One way is to use the CloudWatch metrics for EC2 which are collected by default in the solution. Another way is to install Sumo Logic Collector for Host Metrics on EC2 instance. The list of metrics and their details from the two methods can be fetched using the embedded links. In addition to this, there are two Apps for EC2 which are provided out of the box with AWS Observability Solution :
- AWS EC2 - Uses CloudWatch Metrics for EC2 and CloudTrail events
- Host Metrics (EC2) - Uses metrics from Installed Collector.
The two types of metrics collected are not comparable thus can have different values for the same metrics.
Will new Lambdas or services get automatically added to the AWS Observability view?
New Lambda functions and new Application ELBs will automatically be added to the AWS Observability views if you have selected the auto-subscribe options during the CloudFormation stack deployment.
What type of tagging is used for AWS resources?
Resources are tagged in Sumo Logic. We do not tag resources in AWS.
Will existing EC2 tags automatically be ingested?
All tags are collected by the AWS Cloud Watch Metrics source. For EC2, metadata sources need to be added for that account and will be mapped to Host metrics. Custom EC2 tags will be available through the metadata source.
What output formats do you support for CloudWatch metrics streams?
Currently, we support OpenTelemetry 0.7.0 output format for CloudWatch metric streams.
Are instance metrics collected from CloudWatch metrics or as Host metrics?
EC2 dashboards are based on Host Metrics.
Host Metrics use a different format than CloudWatch. They can also refer to non-AWS in general, which is why Sumo Logic refers to them generically as Host Metrics.
Why are all entities or functions not available in Sumo Logic?
AWS Observability integrates with the AWS Observability view by populating metadata and only shows entities with metrics coming in. If you do not see expected entities, make sure configurations are correct to collect and receive metrics including the CloudWatch Namespace for CloudFormation Template. You can configure metadata through deployment configuration or manually.
For example, metrics for Lambda functions must be coming in for those entities to show in the AWS Observability view. If you do not see Lambda functions, verify the CloudFormation stack is correctly configured including the AWS/Lambda namespace to collect metrics. For information, see
Can load balancers be filtered as part of CloudFormation template setup?
At this time, you cannot filter load balancers, such as sending specific ALBs to the AWS Observability solution.