Amazon ElastiCache
Amazon ElastiCache allows you to set up, run, and scale popular open-source compatible in-memory data stores in the cloud.
The Amazon ElastiCache dashboards provide visibility into key event and performance analytics that enable proactive diagnosis and response to system and environment issues. Use the preconfigured dashboards for at-a-glance analysis of event status trends, locations, successes and failures, as well as system health and performance metrics. The dashboards also have additional performance insights for Redis clusters.
Log and metrics types
The Amazon ElastiCache app uses the following logs and metrics:
- Amazon ElastiCache Host Level metrics
- Amazon ElastiCache Redis metrics
- CloudTrail Amazon ElastiCache Data Event
Sample log messages
{
	"eventVersion":"1.05",
	"userIdentity":{
		"type":"IAMUser",
		"principalId":"AI1234567890QEWUABG5Q",
		"arn":"arn:aws:iam::951234567898:user/Ankit Go",
		"accountId":"951234567898",
		"accessKeyId":"ABCDEFGHIHFBOT4FDVK",
		"userName":"jschmo-sa",
		"sessionContext":{
			"attributes":{
				"mfaAuthenticated":"true",
				"creationDate":"2018-12-21T06:34:43Z"
			}
		},
		"invokedBy":"signin.amazonaws.com"
	},
	"eventTime":"2021-02-12 10:02:02.318+0000",
	"eventSource":"elasticache.amazonaws.com",
	"eventName":"ModifyReplicationGroupShardConfiguration",
	"awsRegion":"us-east-1",
	"sourceIPAddress":"72.242.40.178",
	"userAgent":"signin.amazonaws.com",
	"requestParameters":{
		"applyImmediately":true,
		"nodeGroupCount":3,
		"replicationGroupId":"nitin-redis-cluster1"
	},
	"responseElements":null,
	"requestID":"e7b3-0503-11e9-ac32-1b9dd4a2a030",
	"eventID":"554d-7d55-46fe-a0fa-de886d19c846",
	"eventType":"AwsApiCall",
	"recipientAccountId":"951234567898"
}
Sample queries
Cache Hit Rate:
account=dev region=us-east-1 namespace=aws/elasticache metric=CacheHitRate statistic=Average CacheClusterId=* CacheNodeId=* | avg by account, region, namespace, CacheClusterId, CacheNodeId
```

Top 10 ReplicationGroupId's:

```sql title="CloudTrail log-based"
account=dev region=us-east-1 namespace=aws/elasticache "\"eventSource\":\"elasticache.amazonaws.com\"" replicationGroupId
| json "userIdentity", "eventSource", "eventName", "awsRegion", "sourceIPAddress", "userAgent", "eventType", "recipientAccountId", "requestParameters", "responseElements", "requestID", "errorCode", "errorMessage" as userIdentity, event_source, event_name, region, src_ip, user_agent, event_type, recipient_account_id, requestParameters, responseElements, request_id, error_code, error_message nodrop
| where event_source = "elasticache.amazonaws.com"
| json field=userIdentity "type", "principalId", "arn", "userName", "accountId" nodrop
| json field=userIdentity "sessionContext.attributes.mfaAuthenticated" as mfaAuthenticated nodrop
| json field=requestParameters "replicationGroupId", "engine", "engineVersion" as req_replicationGroupId, req_engine, req_engineVersion nodrop
| json field=responseElements "replicationGroupId", "engine", "engineVersion", "status" as res_replicationGroupId, res_engine, res_engineVersion, res_status nodrop
| if (isEmpty(req_replicationGroupId), res_replicationGroupId, req_replicationGroupId) as replicationgroupid
| where !isEmpty(replicationgroupid)
| parse field=arn ":assumed-role/*" as user nodrop
| parse field=arn "arn:aws:iam::*:*" as accountId, user nodrop
| if (isEmpty(error_code), "Success", "Failure") as eventStatus
| if (isEmpty(userName), user, userName) as user
| if (isEmpty(req_engine), res_engine, req_engine) as engine
| if (isEmpty(req_engineVersion), res_engineVersion, req_engineVersion) as engine_version
| res_status as Status
| count as Count by replicationgroupid | sort by Count, replicationgroupid asc | limit 10
Amazon ElastiCache dashboards
All dashboards have a set of filters that you can apply to the entire dashboard. Use these filters to drill down and examine the data to a granular level.
- You can change the time range for a dashboard or panel by selecting a predefined interval from a drop-down list, choosing a recently used time range, or specifying custom dates and times. Learn more.
- If required, configure the refresh interval rate for a dashboard or panel by clicking the drop-down arrow next to the refresh icon.
- Click the funnel icon in the dashboard top menu bar to filter dashboard with Template Variables.

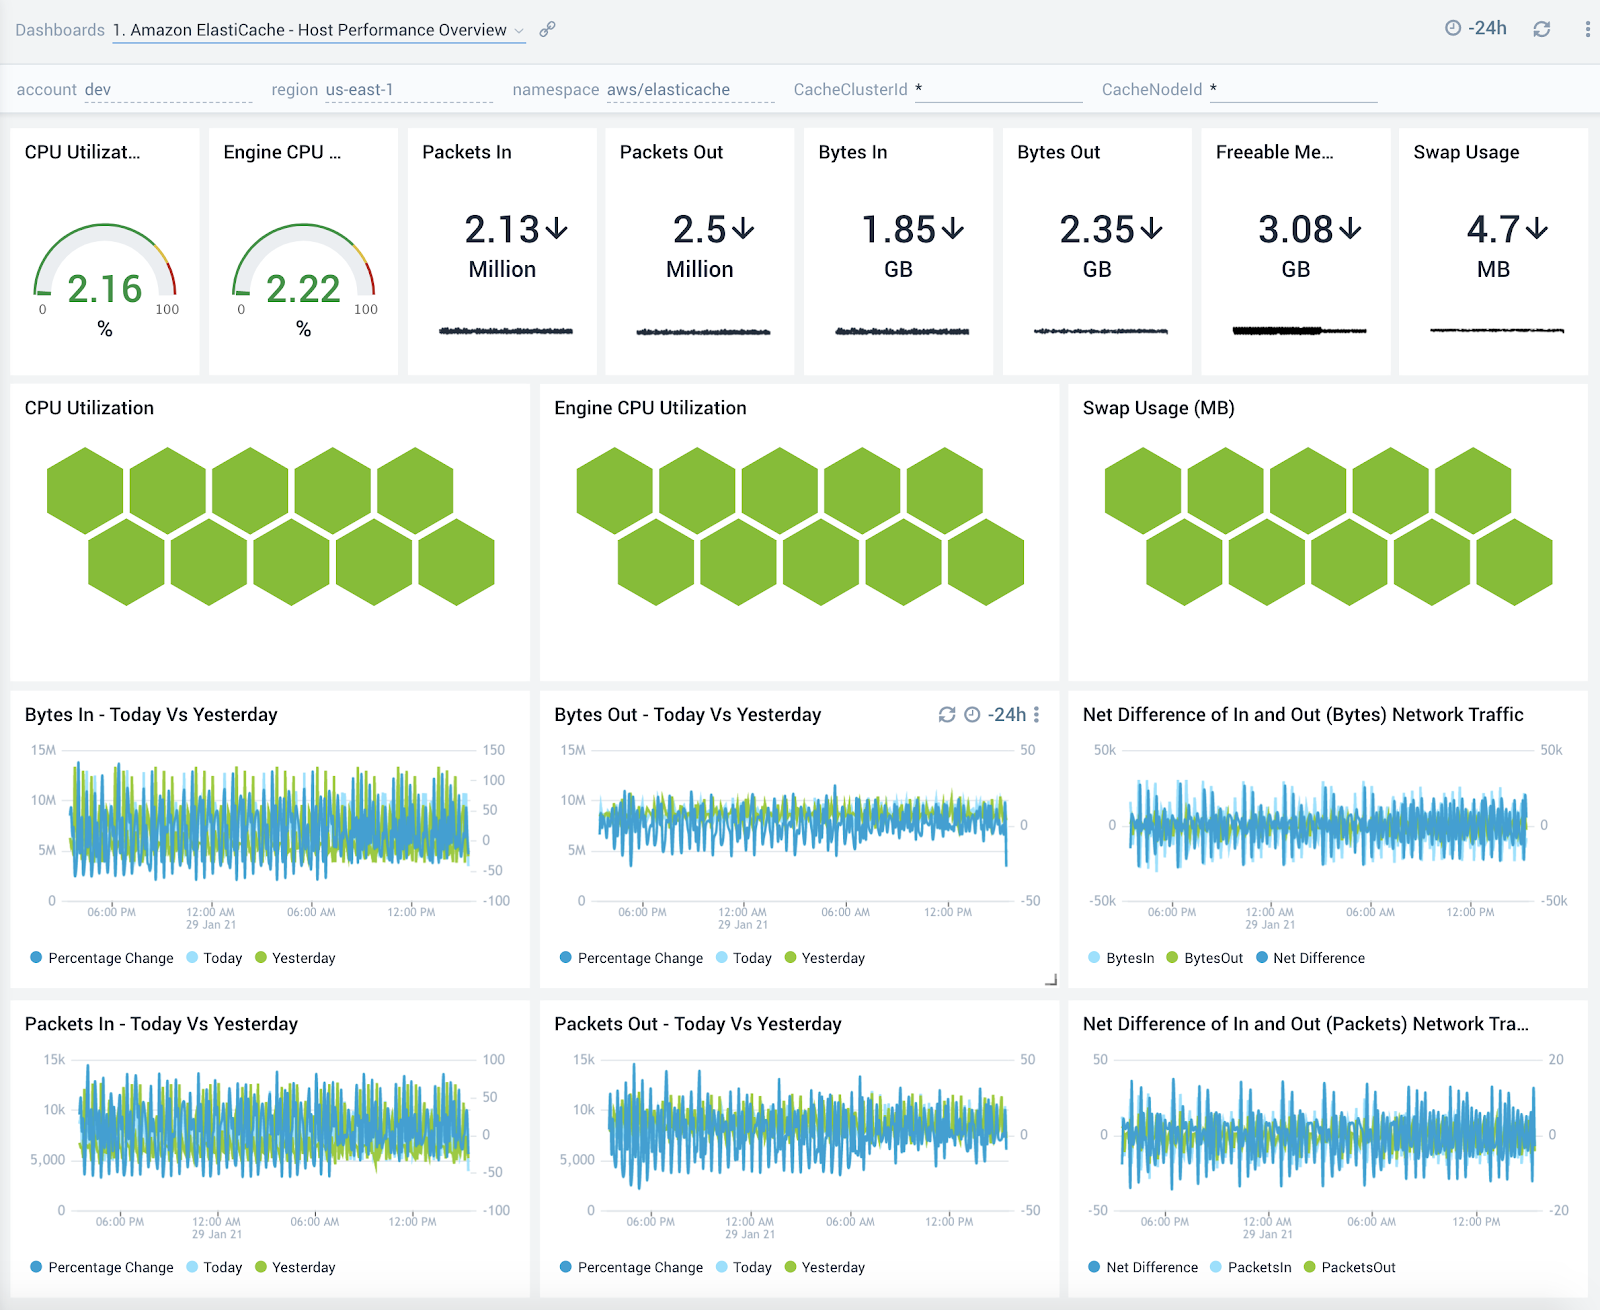
1. Amazon ElastiCache - Host Performance Overview
The Amazon ElastiCache - Host Performance Overview dashboard provides detailed insights into CPU, memory and network performance metrics of hosts running your ElastiCache clusters.
Use this dashboard to:
- Get an at-a-glance view of CPU, memory and swap resource utilization of hosts running your ElastiCache clusters.
- CPU, memory or swap space on host and swap usage.
- Monitor network traffic utilization and compare today’s trends of incoming and outgoing bytes and packets vs. yesterday
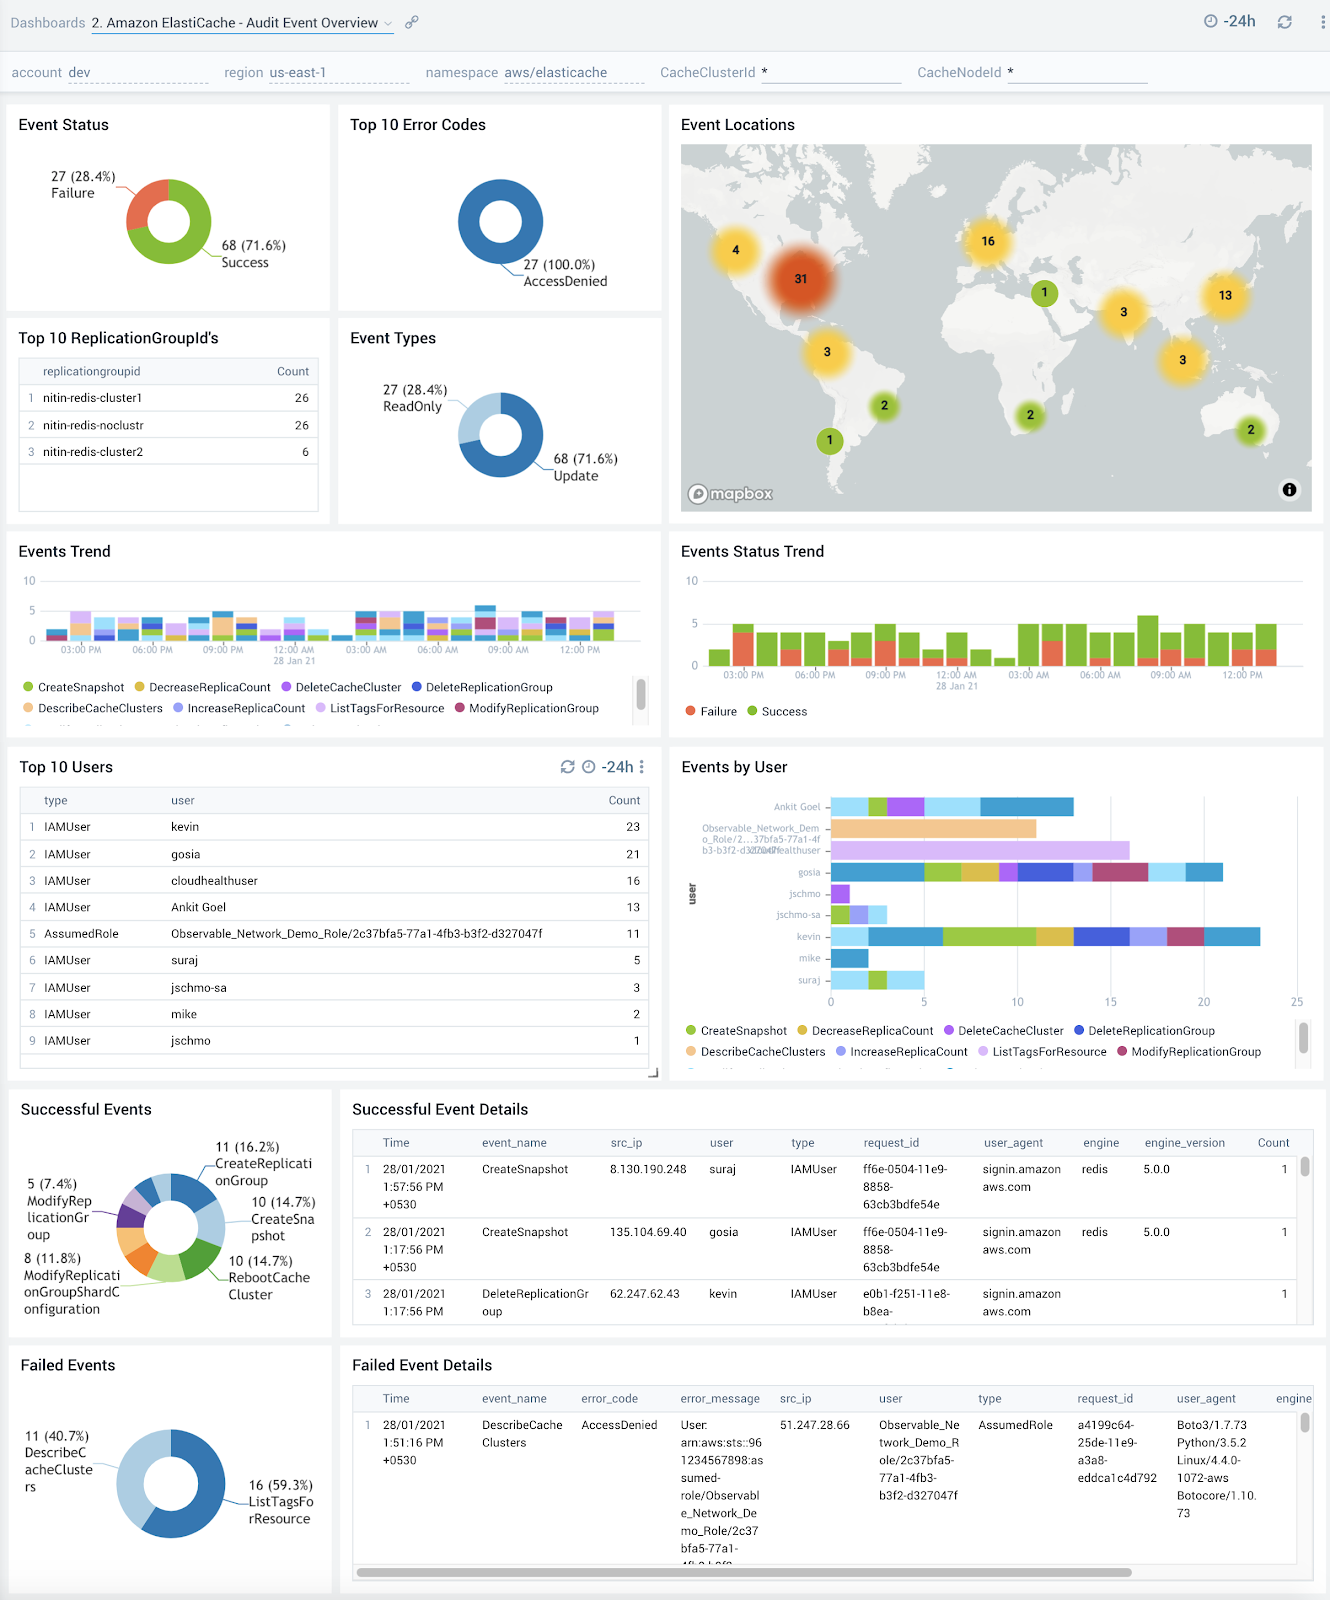
2. Amazon ElastiCache - Audit Event Overview
The Amazon ElastiCache - Audit Event Overview dashboard provides detailed insights into all events associated with ElastiCache clusters and specifically helps identify changes, errors, users and replication groups.
Use this dashboard to:
- Monitor all changes being made to ElastiCache clusters
- Monitor the location of incoming user activity , top users, and top replication groups to ensure they match with expectations
- Quickly identify top error codes to diagnose any outages
- Monitor trends around failed events to identify potential service disruptions that could warrant deeper investigation
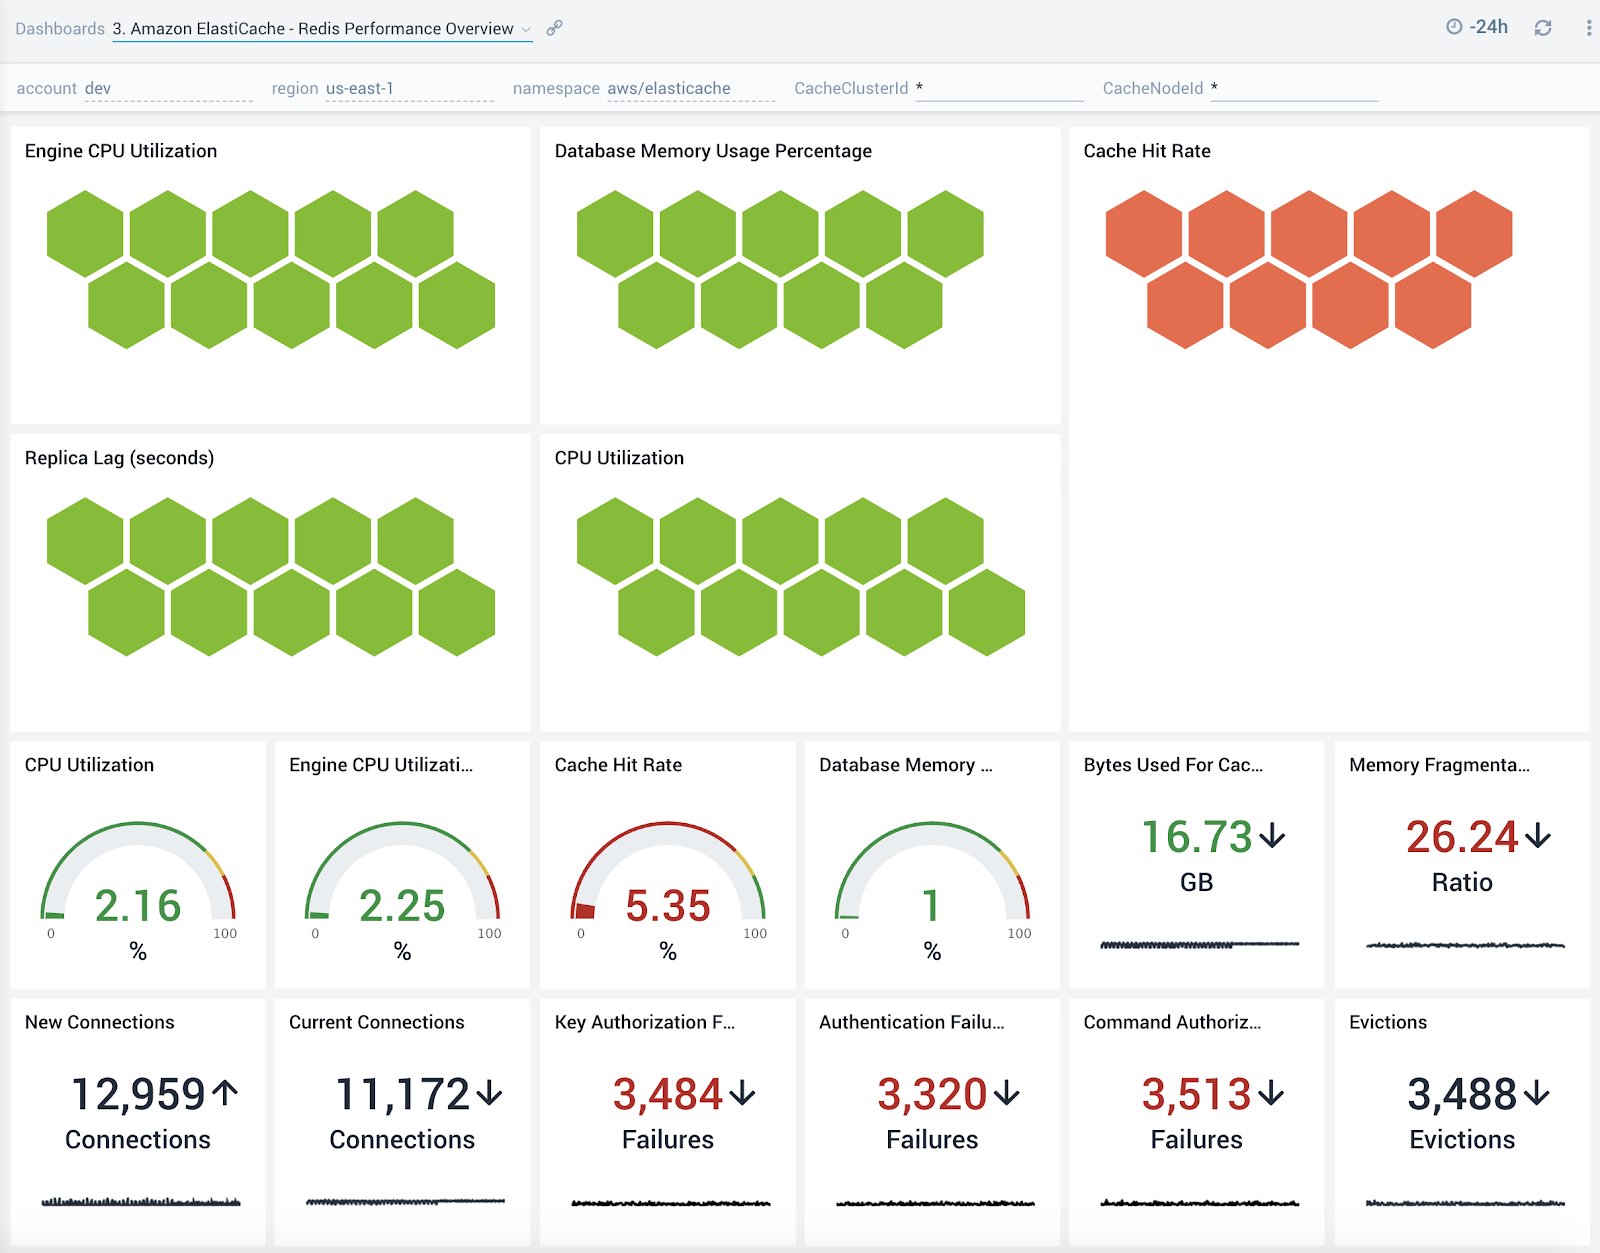
3. Amazon ElastiCache - Redis Performance Overview
The Amazon ElastiCache - Redis Performance Overview dashboard provides an overview into performance, evictions and authentication and authorization failures of ElastiCache Redis clusters.
Use this dashboard to:
- Quickly determine if your Redis database is performing as expected
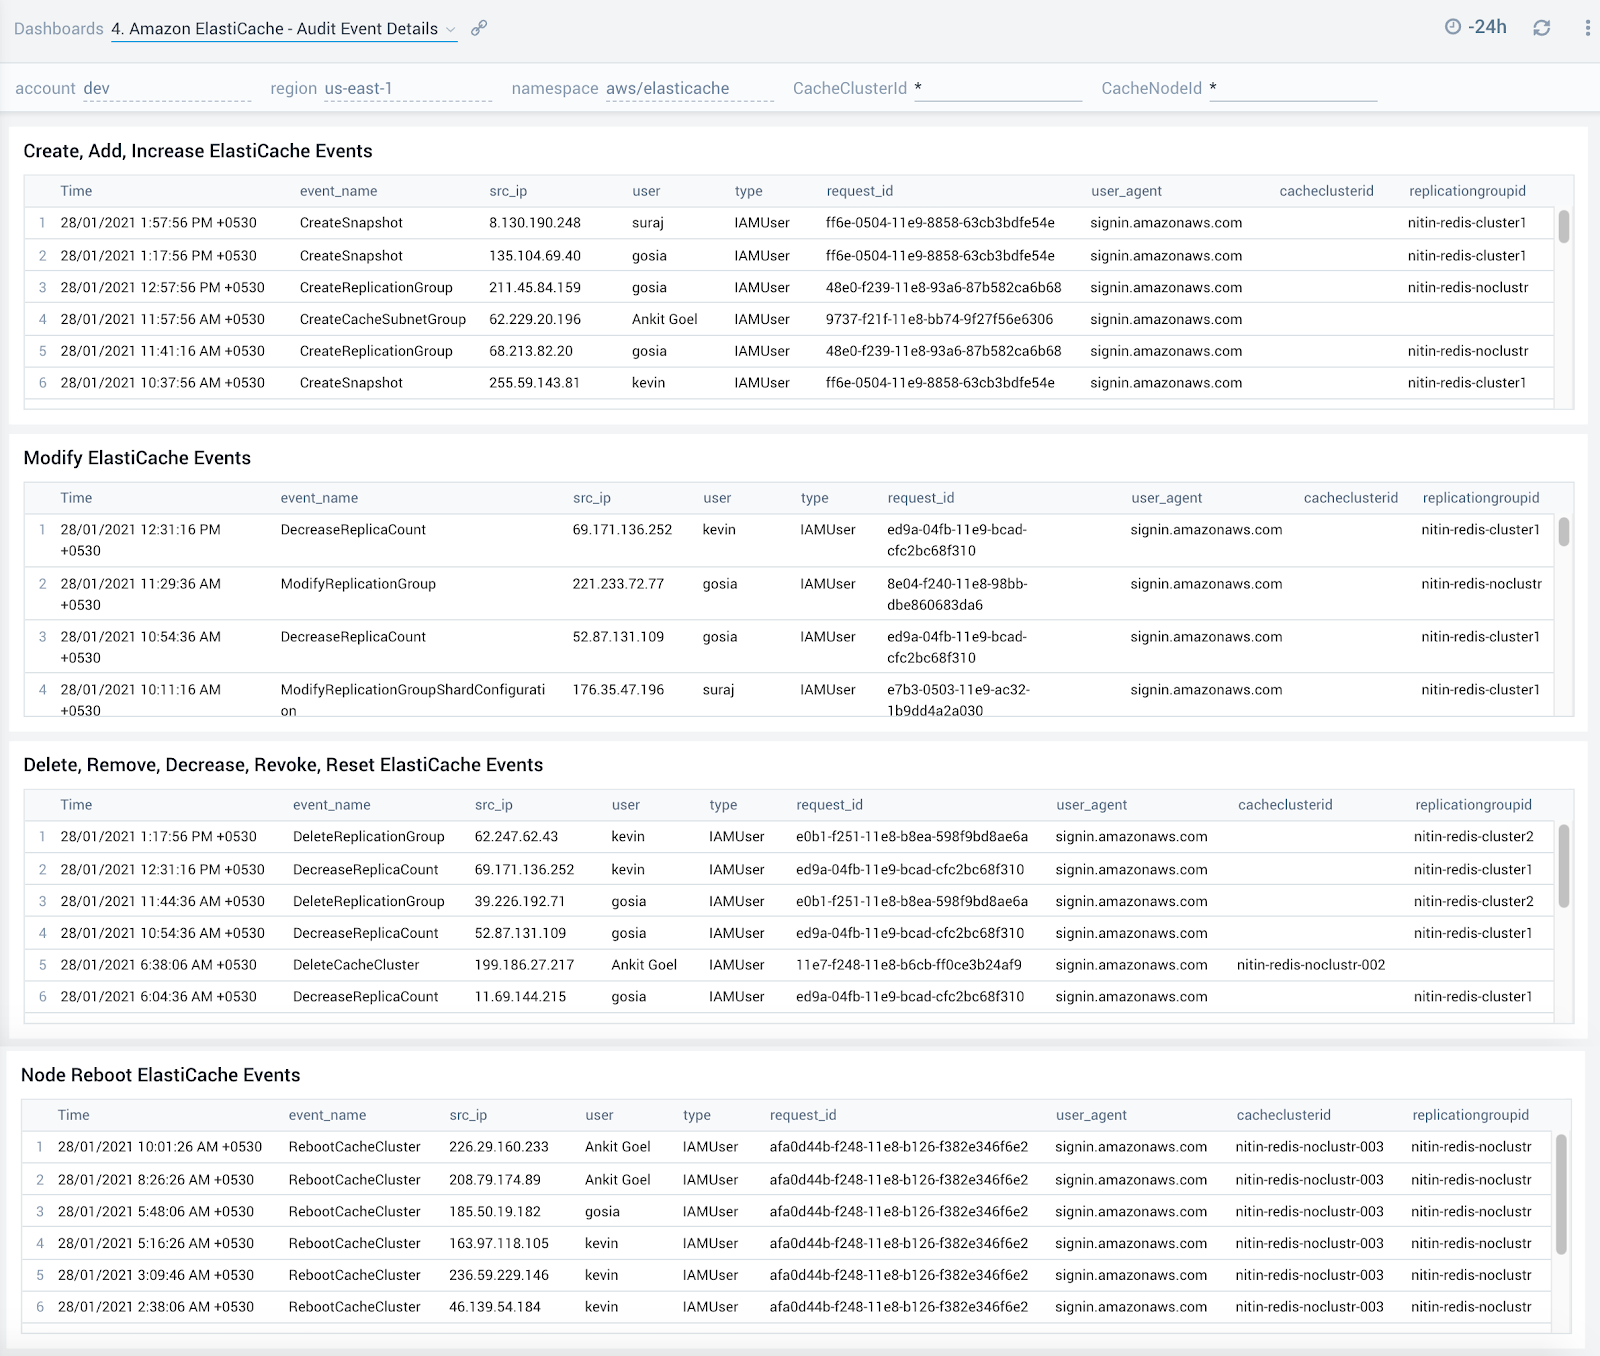
4. Amazon ElastiCache - Audit Event Details
The Amazon ElastiCache - Audit Event Details dashboard provides detailed insights into key operations made on your ElastiCache clusters.
Use this dashboard to:
- Quickly determine changes made to your ElastiCache clusters while troubleshooting production outages
- Determine if any nodes hosting your ElastiCache clusters were rebooted
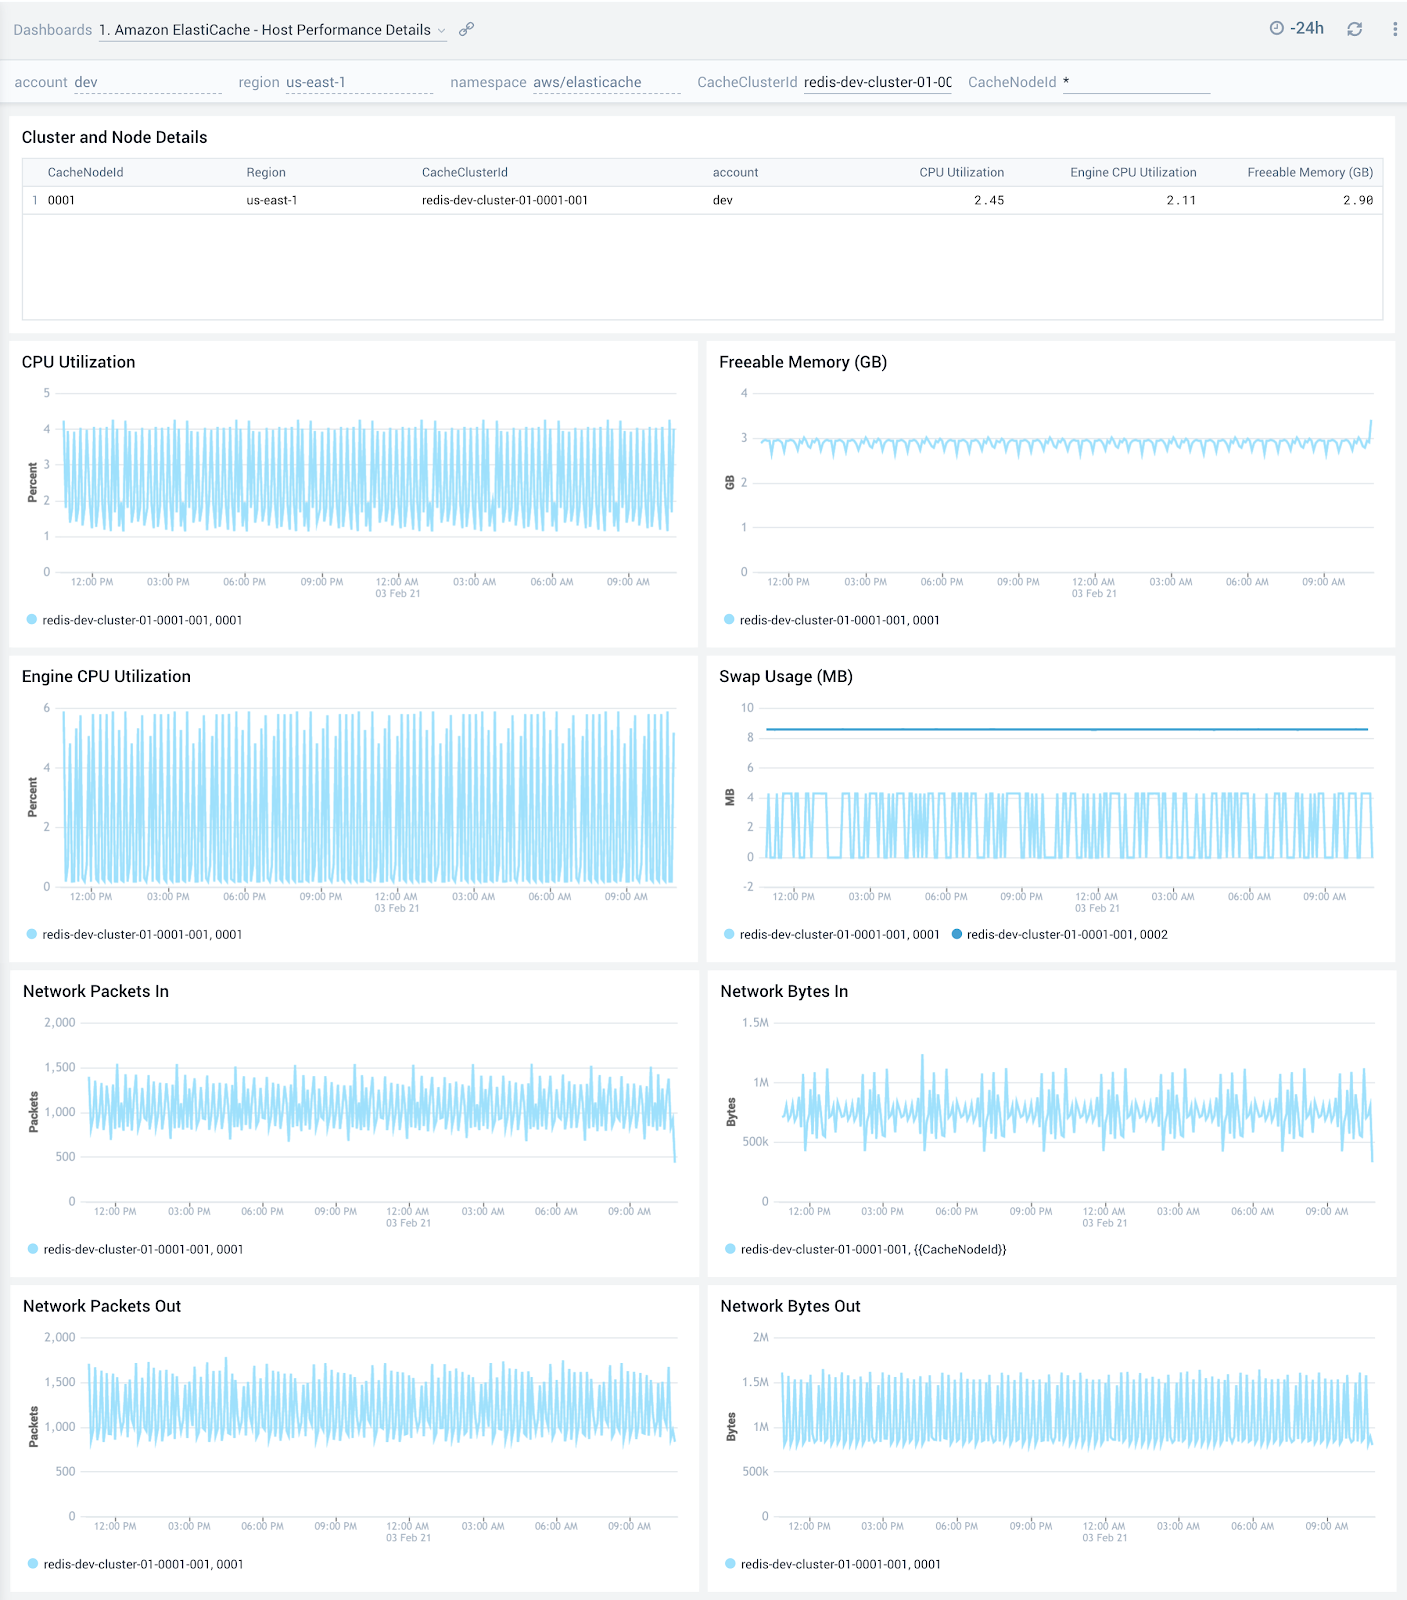
1. Amazon ElastiCache - Host Performance Details
The Amazon ElastiCache - Host Performance Details dashboard shows an overview of the resource utilization for a given ElastiCache cluster across its nodes and also showcases trends around CPU, memory, swap usage and network traffic.
Use this dashboard to:
- Get an at-a-glance view of the performance of all nodes within a given ElastiCache cluster
- Determine if CPU, memory, swap memory or network resources need to be scaled up or down for a given cluster or service based on utilization trends
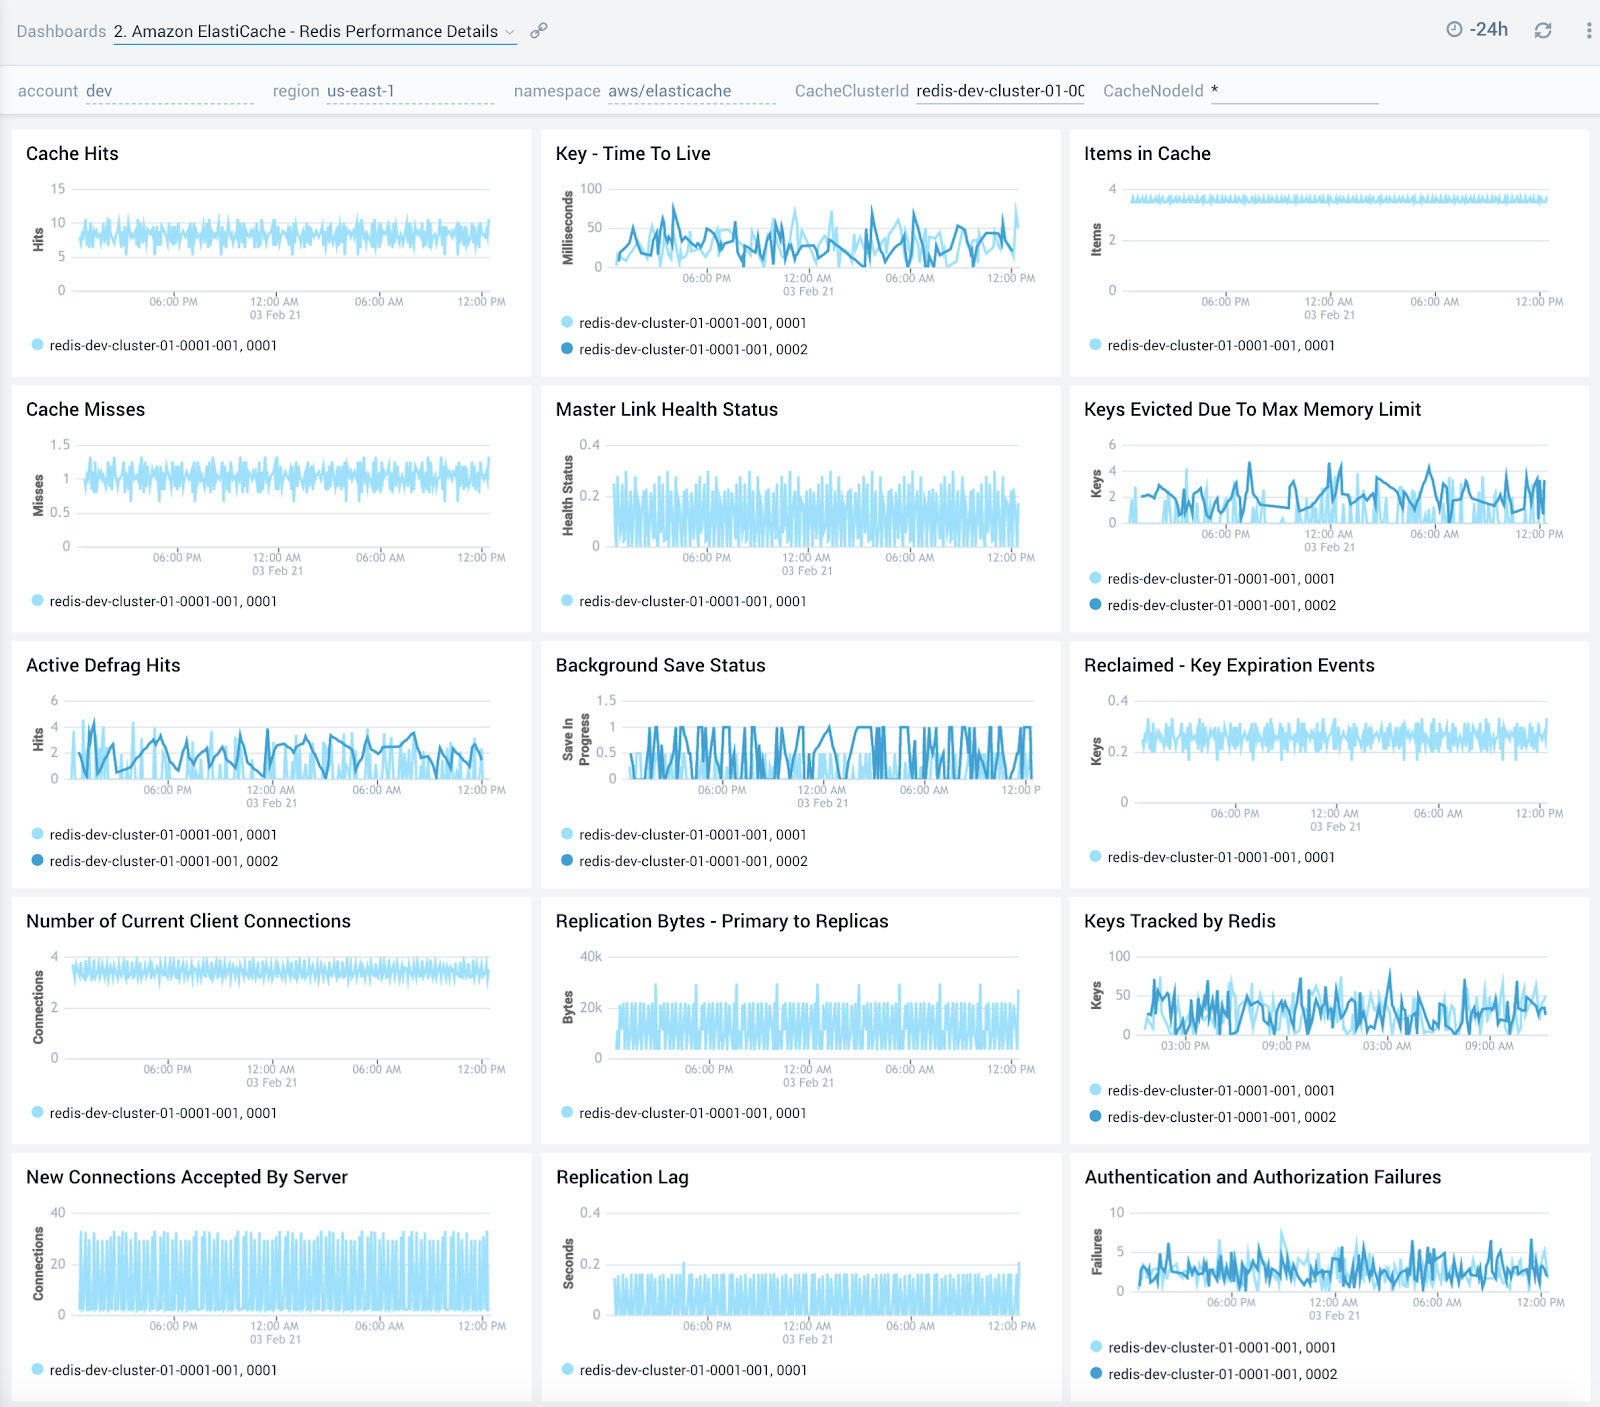
2. Amazon ElastiCache - Redis Performance Details
The Amazon ElastiCache - Redis Performance Details dashboard provides detailed insights into cache hits, keys, replication, connections and failures of Redis ElastiCache clusters.
Use this dashboard to:
- Monitor trends around cache hits and misses to determine if Redis clusters need to be tuned
- Review trends around defragmentation, replication lag and bytes replicated to determine optimizations
- Quickly determine any authentication and authorization failures and grant or revoke privileges accordingly
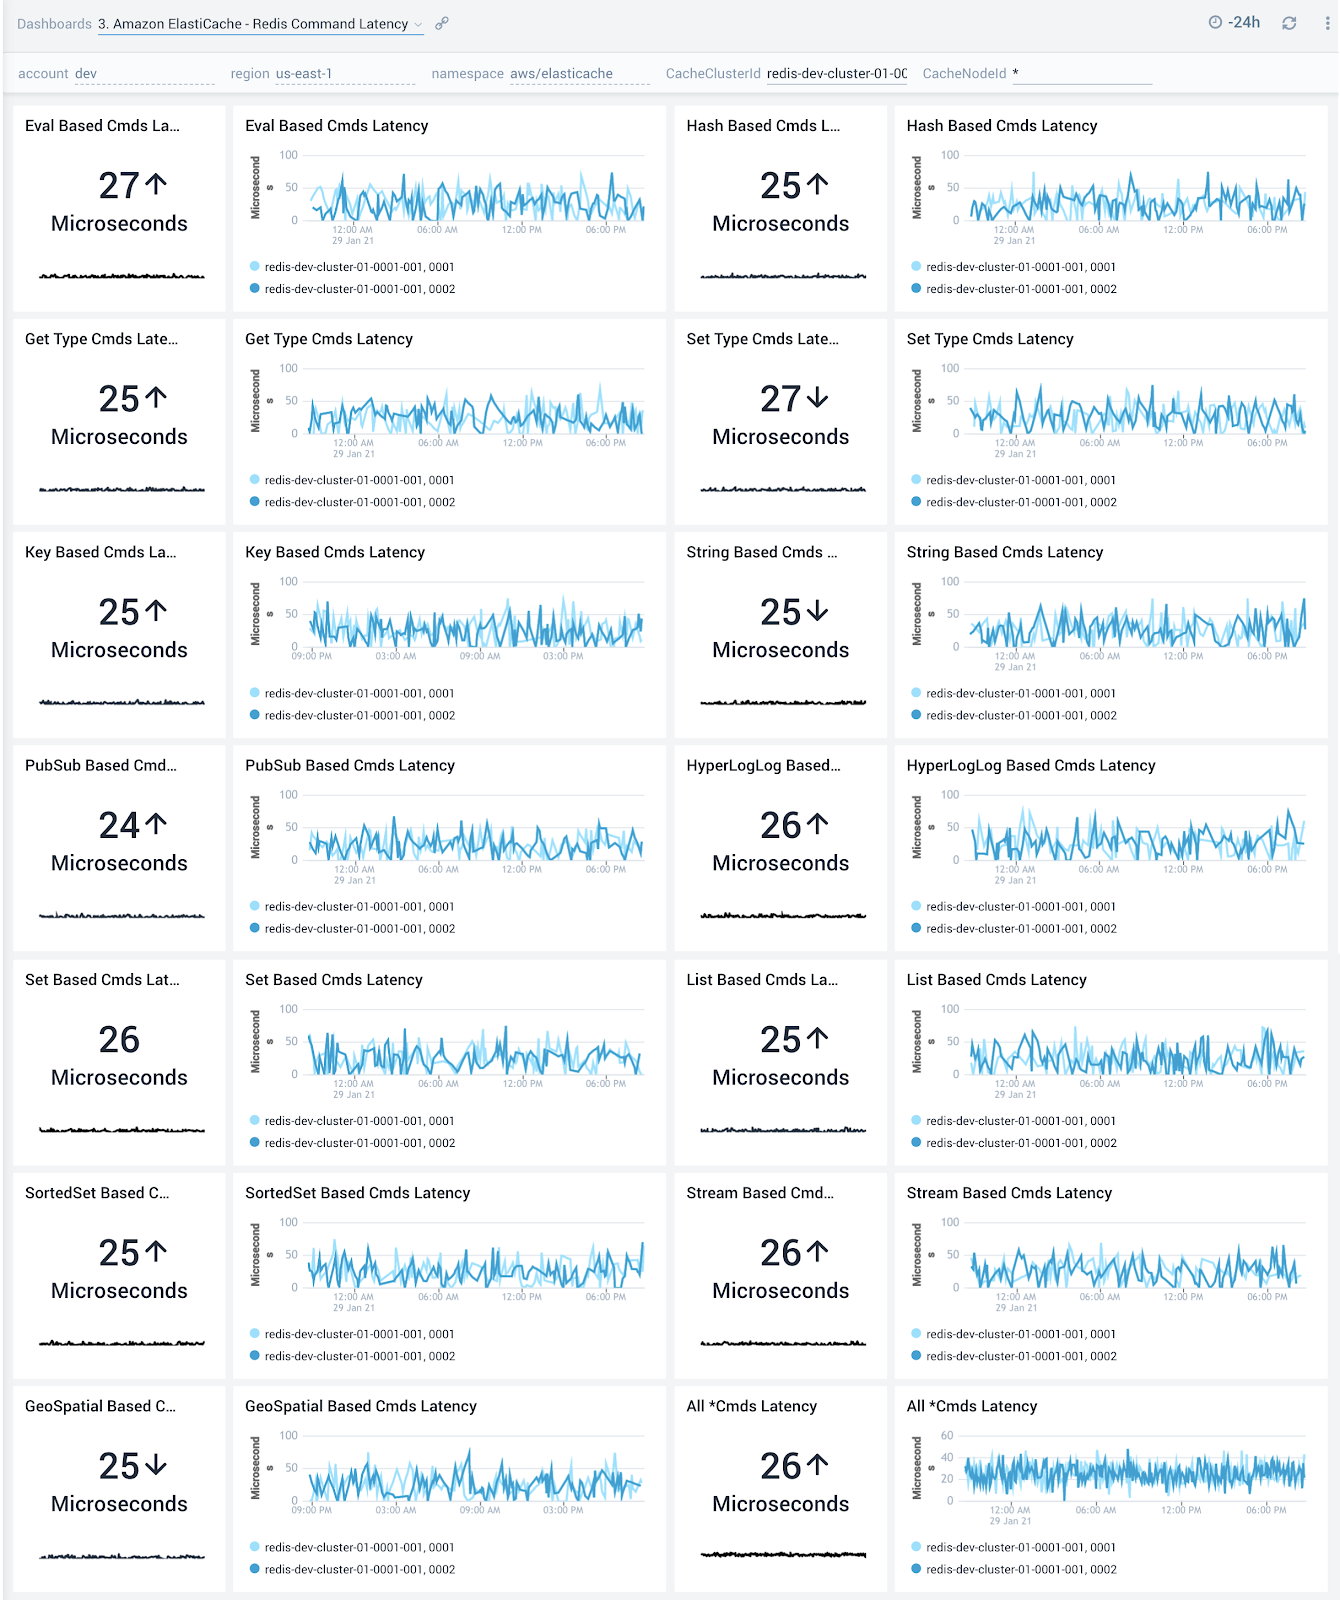
3. Amazon ElastiCache - Redis Command Latency
The Amazon ElastiCache - Redis Command Latency dashboard provides detailed insights into latency of various Redis commands.
Use this dashboard to:
- Optimize performance of your Redis clusters by monitoring latency observed across get/set operations. Latency can be high due to high CPU usage, swapping or removing cached items. Performance optimizations can therefore be made either via resource allocation or by optimizing on caching.
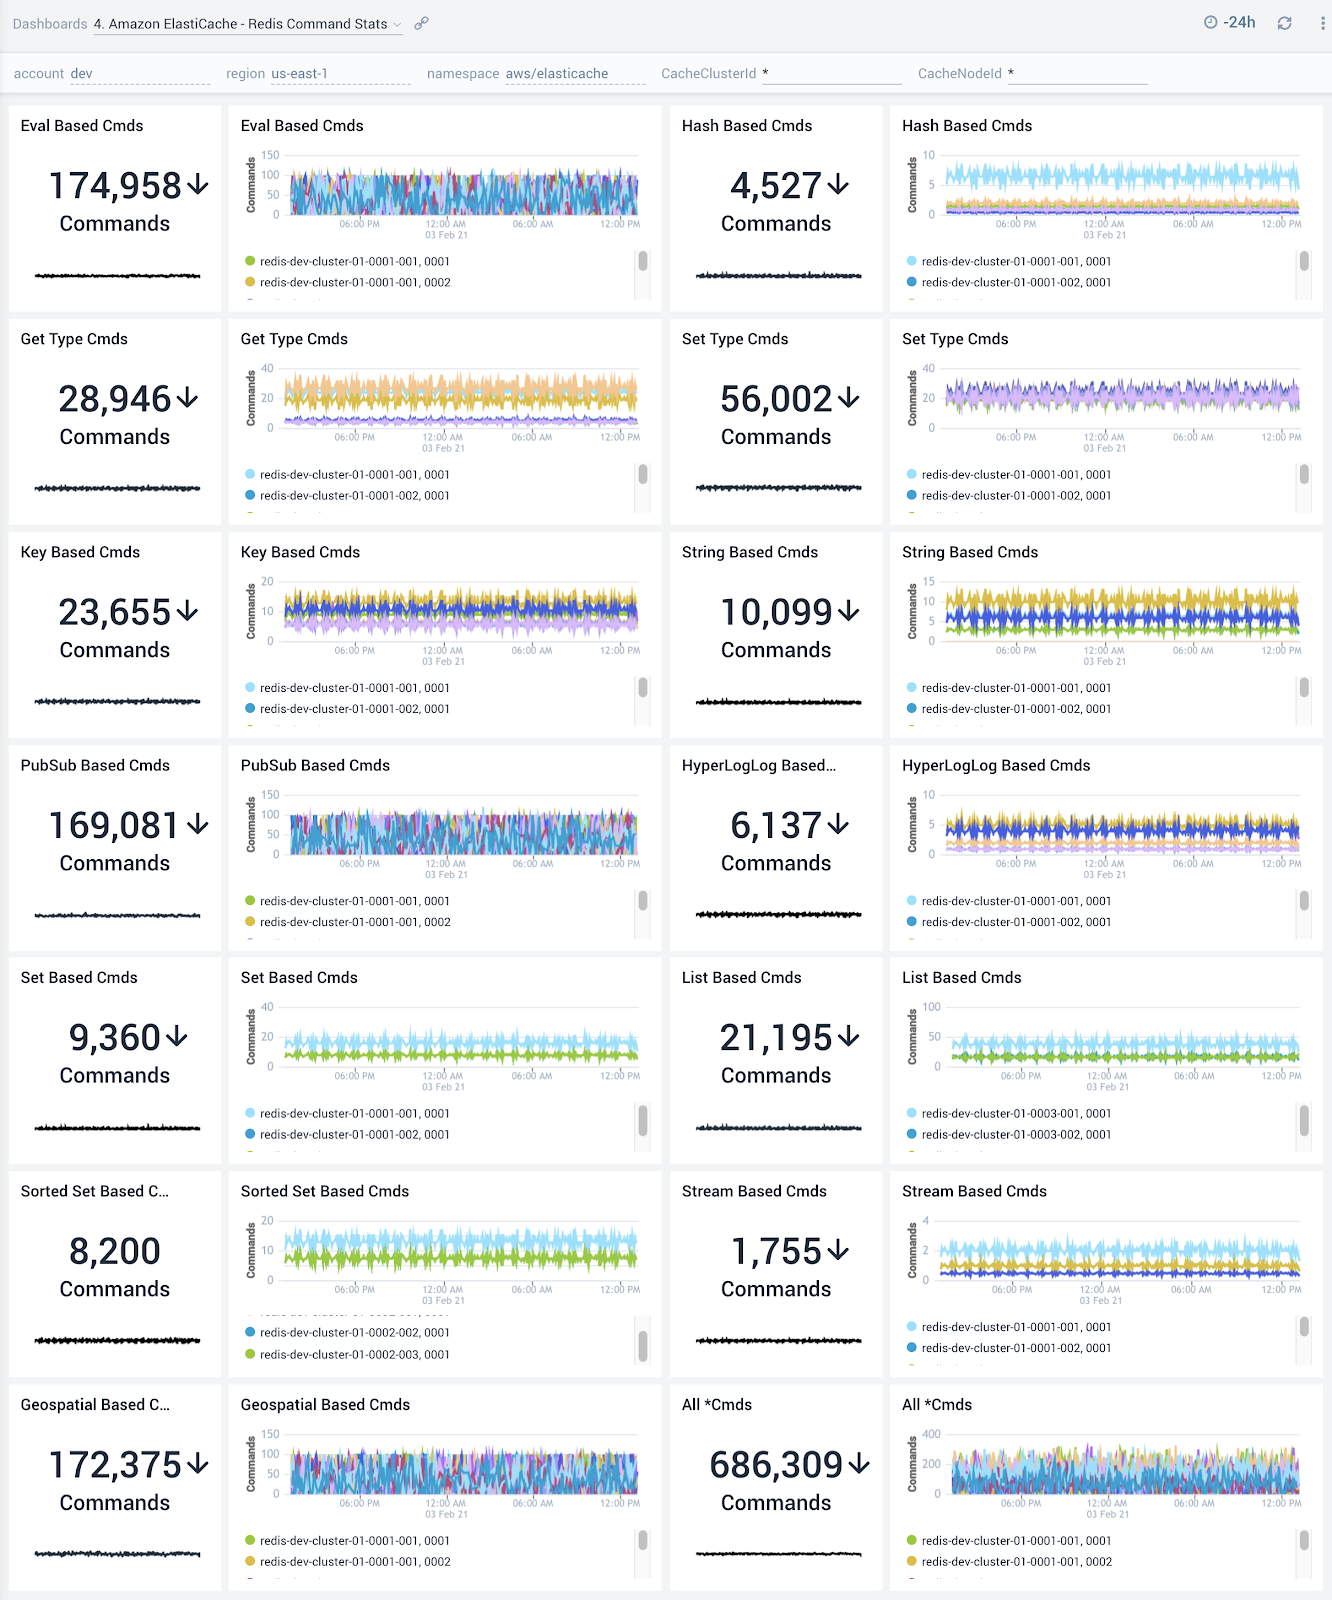
4. Amazon ElastiCache - Redis Command Stats
The Amazon ElastiCache - Redis Command Stats dashboard provides detailed insights into the number of commands being performed.
Use this dashboard to:
- Monitor various Get and Set commands received by your ElastiCache clusters and nodes
- Correlate with the Redis Command Latency dashboard to identify most/least frequently used and least performant command types
If high latency commands are not being processed frequently, you will want to look into monitoring and potentially allocating more CPU resources.