Amazon SNS
The Sumo Logic app for Amazon SNS collects CloudTrail logs and CloudWatch metrics to provide is a unified logs and metrics app that provides insights into the operations and utilization of your SNS service. The preconfigured dashboards help you monitor the key metrics by application, platform, region, and topic name, view the SNS events for activities, and help you plan the capacity of your SNS service.
Log and metrics types
The app uses SNS logs and metrics:
Sample log messages
{
   "eventVersion":"1.08",
   "userIdentity":{
      "..."
   },
   "eventTime":"2022-07-14T23:06:43Z",
   "eventSource":"sns.amazonaws.com",
   "eventName":"ListTagsForResource",
   "awsRegion":"us-east-1",
   "sourceIPAddress":"config.amazonaws.com",
   "userAgent":"config.amazonaws.com",
   "requestParameters":{
      "resourceArn":"arn:aws:sns:us-east-1:956882708938:testnull-SumoCWEmailSNSTopic-1NV3GQ8XZ4DFY"
   },
   "responseElements":null,
   "requestID":"d8eee5b8-a894-5db4-994c-bef20b57fc0b",
   "eventID":"2156cf7f-f18d-47f4-b7ba-7b8a6907390a",
   "readOnly":true,
   "eventType":"AwsApiCall",
   "managementEvent":true,
   "recipientAccountId":"956882708938",
   "eventCategory":"Management"
}
Sample queries
account={{account}} region={{region}} namespace={{namespace}} "\"eventsource\":\"sns.amazonaws.com\""
| json "userIdentity", "eventSource", "eventName", "awsRegion", "sourceIPAddress", "userAgent", "eventType", "recipientAccountId", "requestParameters", "responseElements", "requestID", "errorCode", "errorMessage" as userIdentity, event_source, event_name, region, src_ip, user_agent, event_type, recipient_account_id, requestParameters, responseElements, request_id, error_code, error_message nodrop
| where event_source = "sns.amazonaws.com"
| json field=userIdentity "accountId", "type", "arn", "userName"  as accountid, type, arn, username nodrop
| parse field=arn ":assumed-role/*" as user nodrop
| parse field=arn "arn:aws:iam::*:*" as accountid, user nodrop
| json field=requestParameters "topicArn", "name", "resourceArn", "subscriptionArn" as req_topic_arn, req_topic_name, resource_arn, subscription_arn  nodrop | json field=responseElements "topicArn" as res_topic_arn nodrop
| if (isBlank(req_topic_arn), res_topic_arn, req_topic_arn) as topic_arn
| if (isBlank(topic_arn), resource_arn, topic_arn) as topic_arn
| parse field=topic_arn "arn:aws:sns:*:*:*" as region_temp, accountid_temp, topic_arn_name_temp nodrop
| parse field=subscription_arn "arn:aws:sns:*:*:*:*" as region_temp, accountid_temp, topic_arn_name_temp, arn_value_temp nodrop
| if (isBlank(req_topic_name), topic_arn_name_temp, req_topic_name) as topicname
| if (isBlank(accountid), recipient_account_id, accountid) as accountid
| where (tolowercase(topicname) matches tolowercase("{{topicname}}")) or isBlank(topicname)
| if (isEmpty(error_code), "Success", "Failure") as event_status
| if (isEmpty(username), user, username) as user
| count by event_status
| sort by _count, event_status asc
account={{account}} region={{region}} namespace={{namespace}} TopicName={{topicname}} metric=NumberOfMessagesPublished Statistic=Sum | sum
Viewing Amazon SNS dashboards
All dashboards have a set of filters that you can apply to the entire dashboard. Use these filters to drill down and examine the data to a granular level.
- You can change the time range for a dashboard or panel by selecting a predefined interval from a drop-down list, choosing a recently used time range, or specifying custom dates and times. Learn more.
- If required, configure the refresh interval rate for a dashboard or panel by clicking the drop-down arrow next to the refresh icon.
- Click the funnel icon in the dashboard top menu bar to filter dashboard with Template Variables.
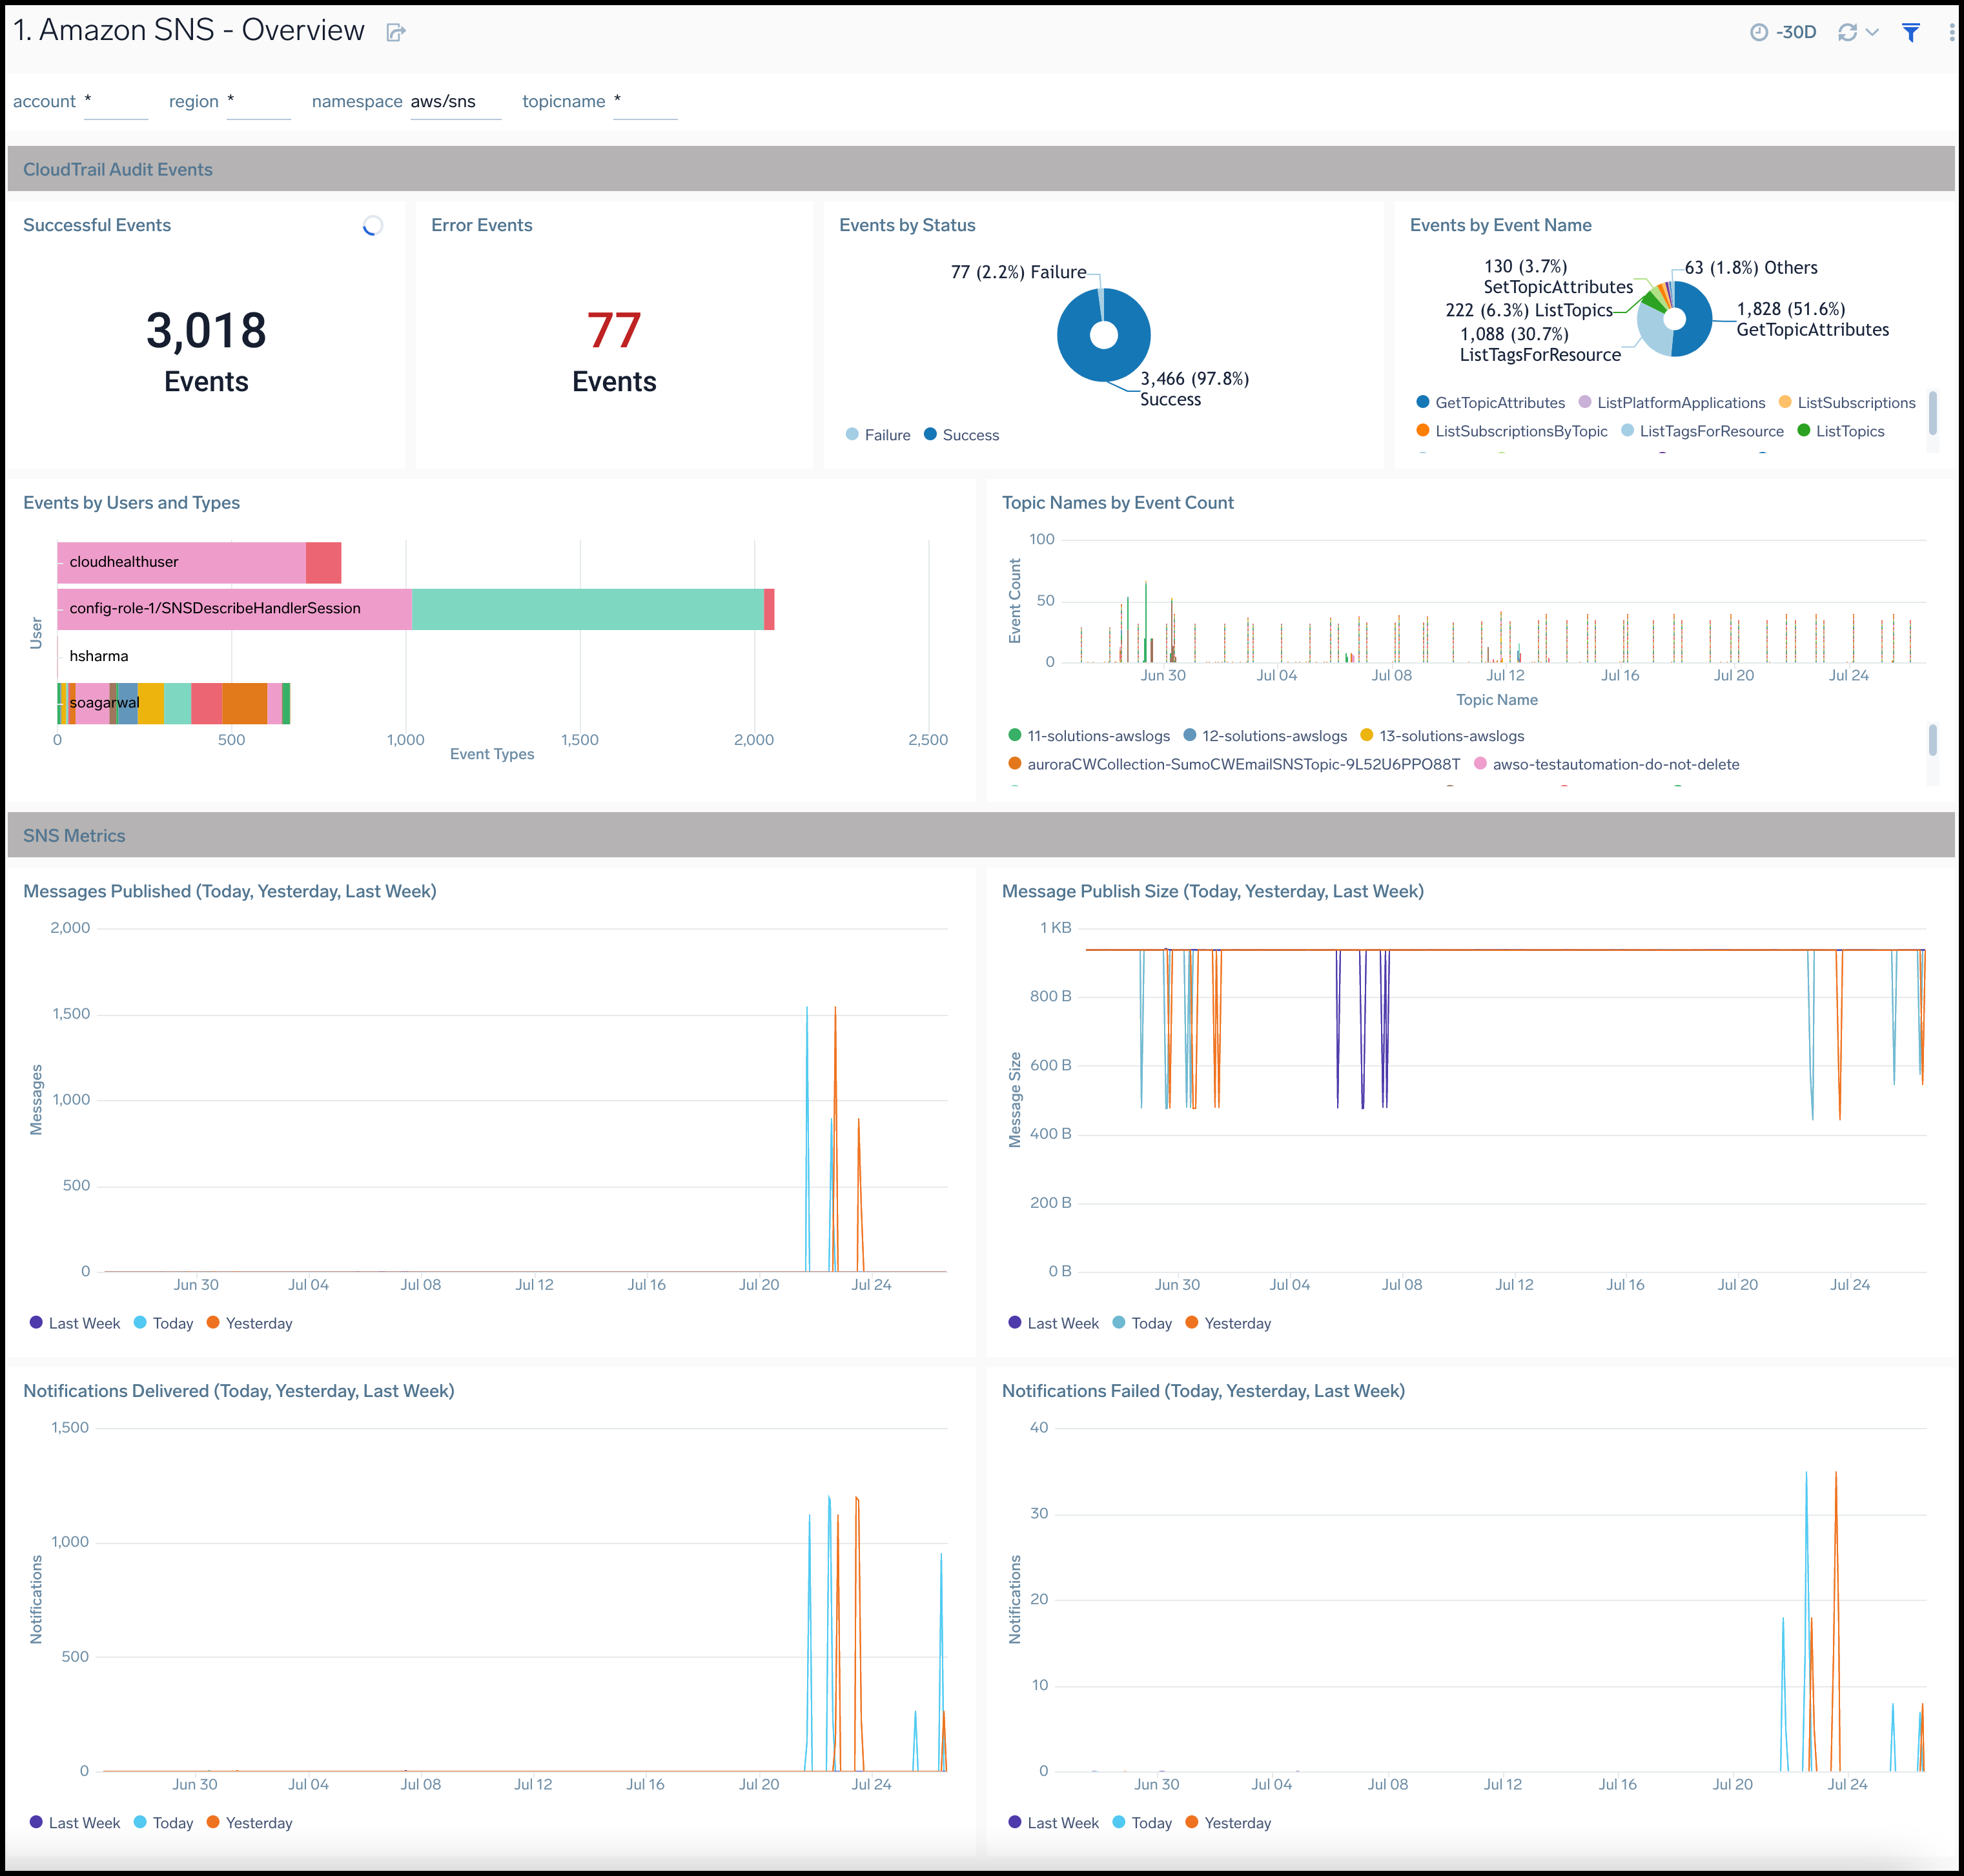
Amazon SNS - Overview
The Amazon SNS - Overview dashboard provides insights across CloudTrail events and metrics.
Use this dashboard to:
- Monitor events by status, type, topic names and users.
- Monitor number of messages and messages by publish size.
- Monitor delivered and failed notifications.
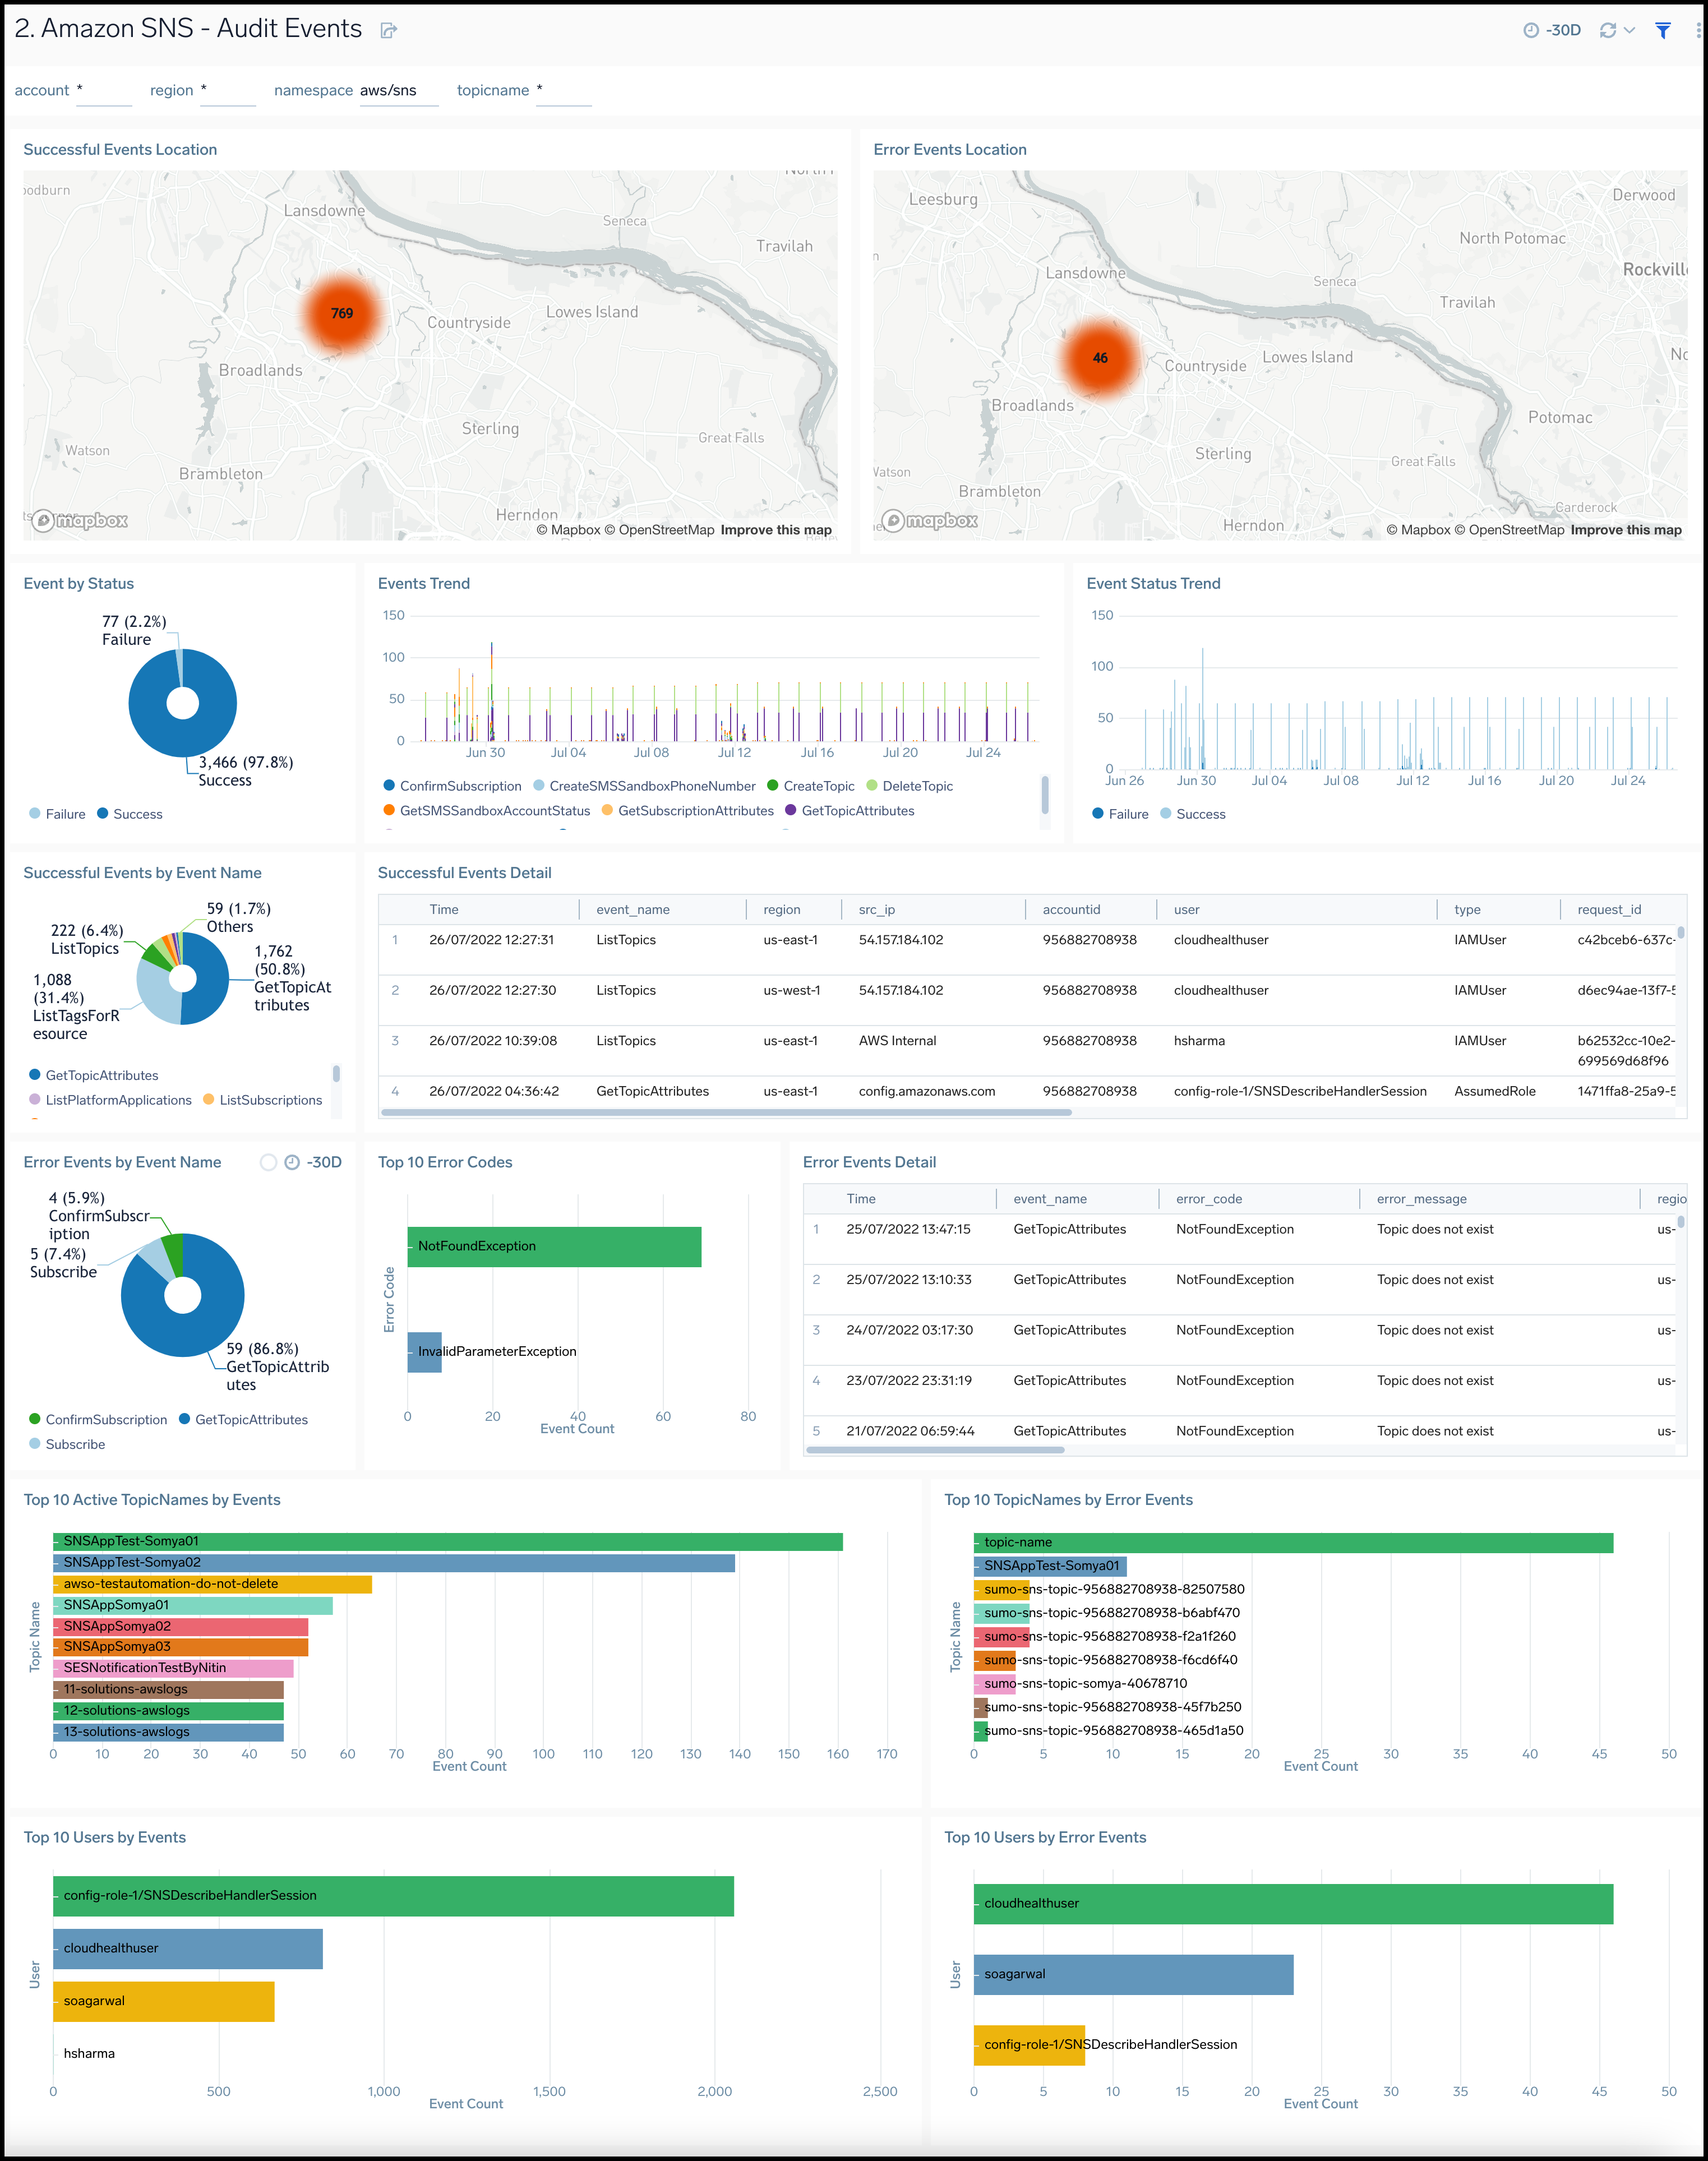
Amazon SNS - Audit Events
The Amazon SNS - Audit Events dashboard provides insights across CloudTrail events across location, status, and topic names.
Use this dashboard to:
- Monitor successful and failed events by location.
- Get trends of events by status, type.
- Monitor successful and error events with error code in detail.
- Get details of active topic names and users of both successful and error events.
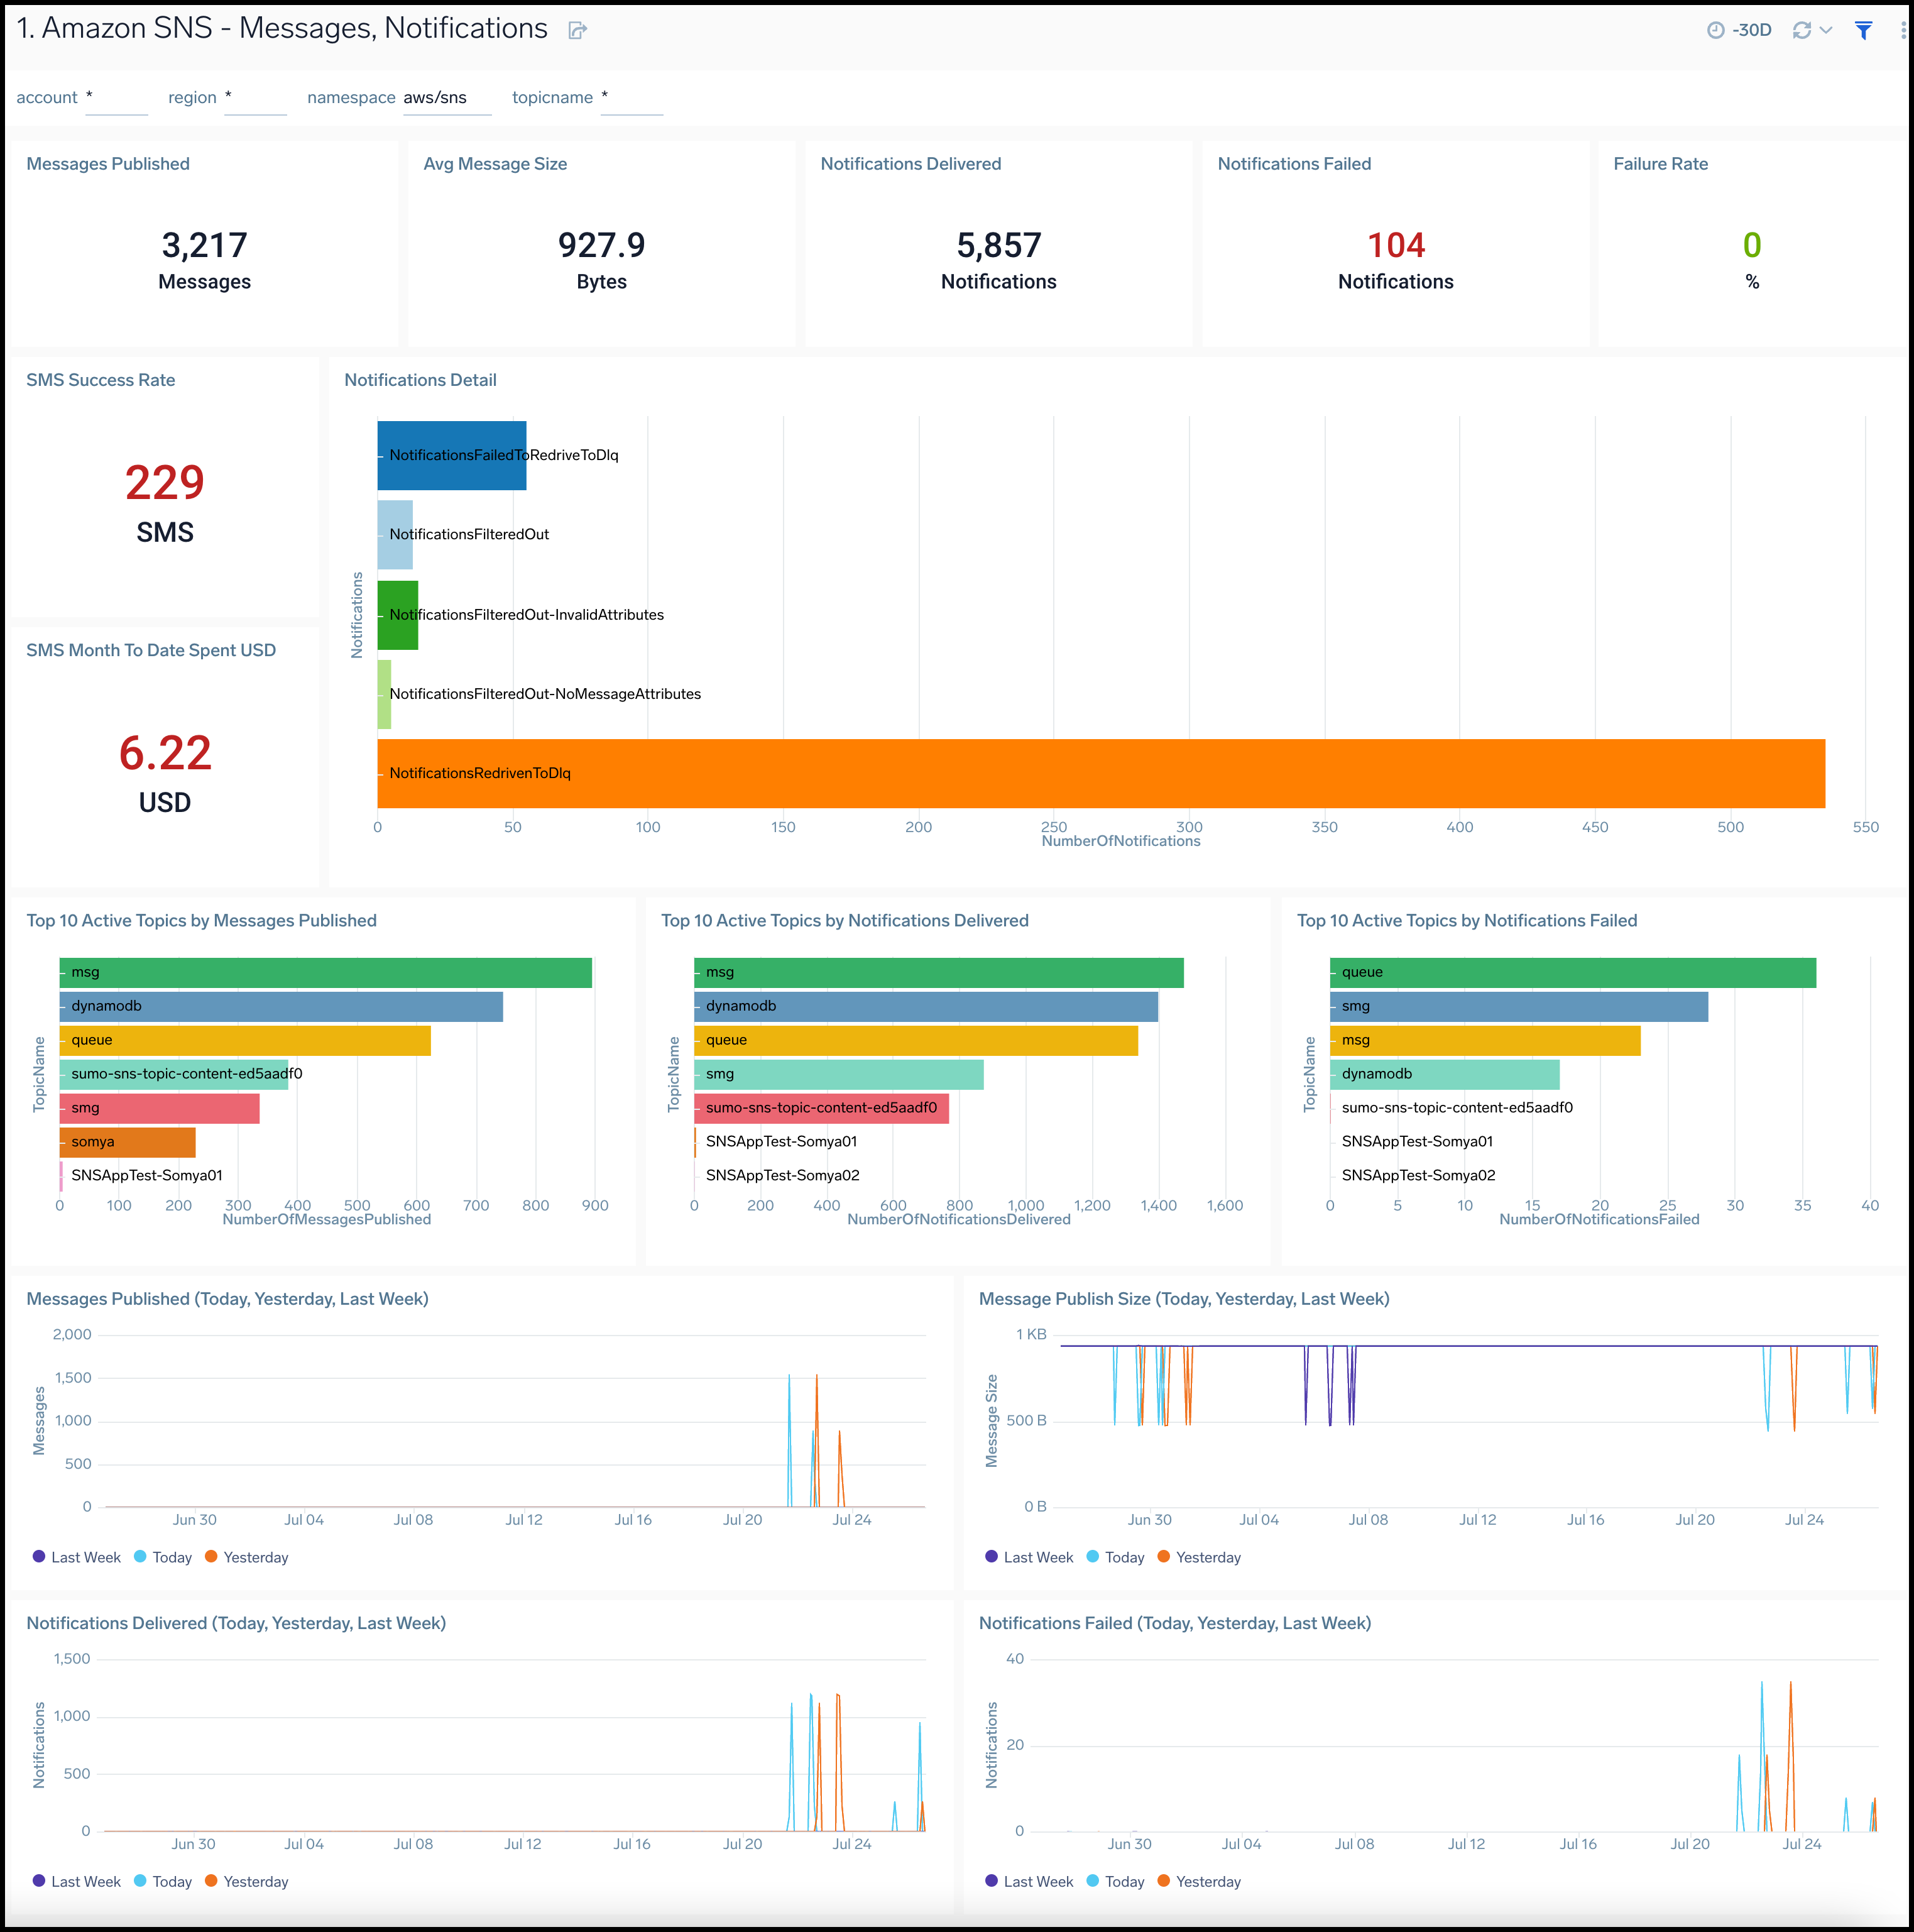
Amazon SNS - Messages, Notifications
The Amazon SNS - Messages, Notifications dashboard provides insights across metrics by messages, notifications, SMS rates.
Use this dashboard to:
- Monitor details of messages published and message size .
- Monitor details of notifications delivered, failed , filtered out, redriven to dlq and failed to redriven to dlq.
- Get details of SMS success rate and spends.
- Get the details of top topic names by messages published, notifications delivered and notifications failed.
- Compare messages published and message size by today, yesterday, last week.
- Compare notifications delivered and failed by today, yesterday, last week.
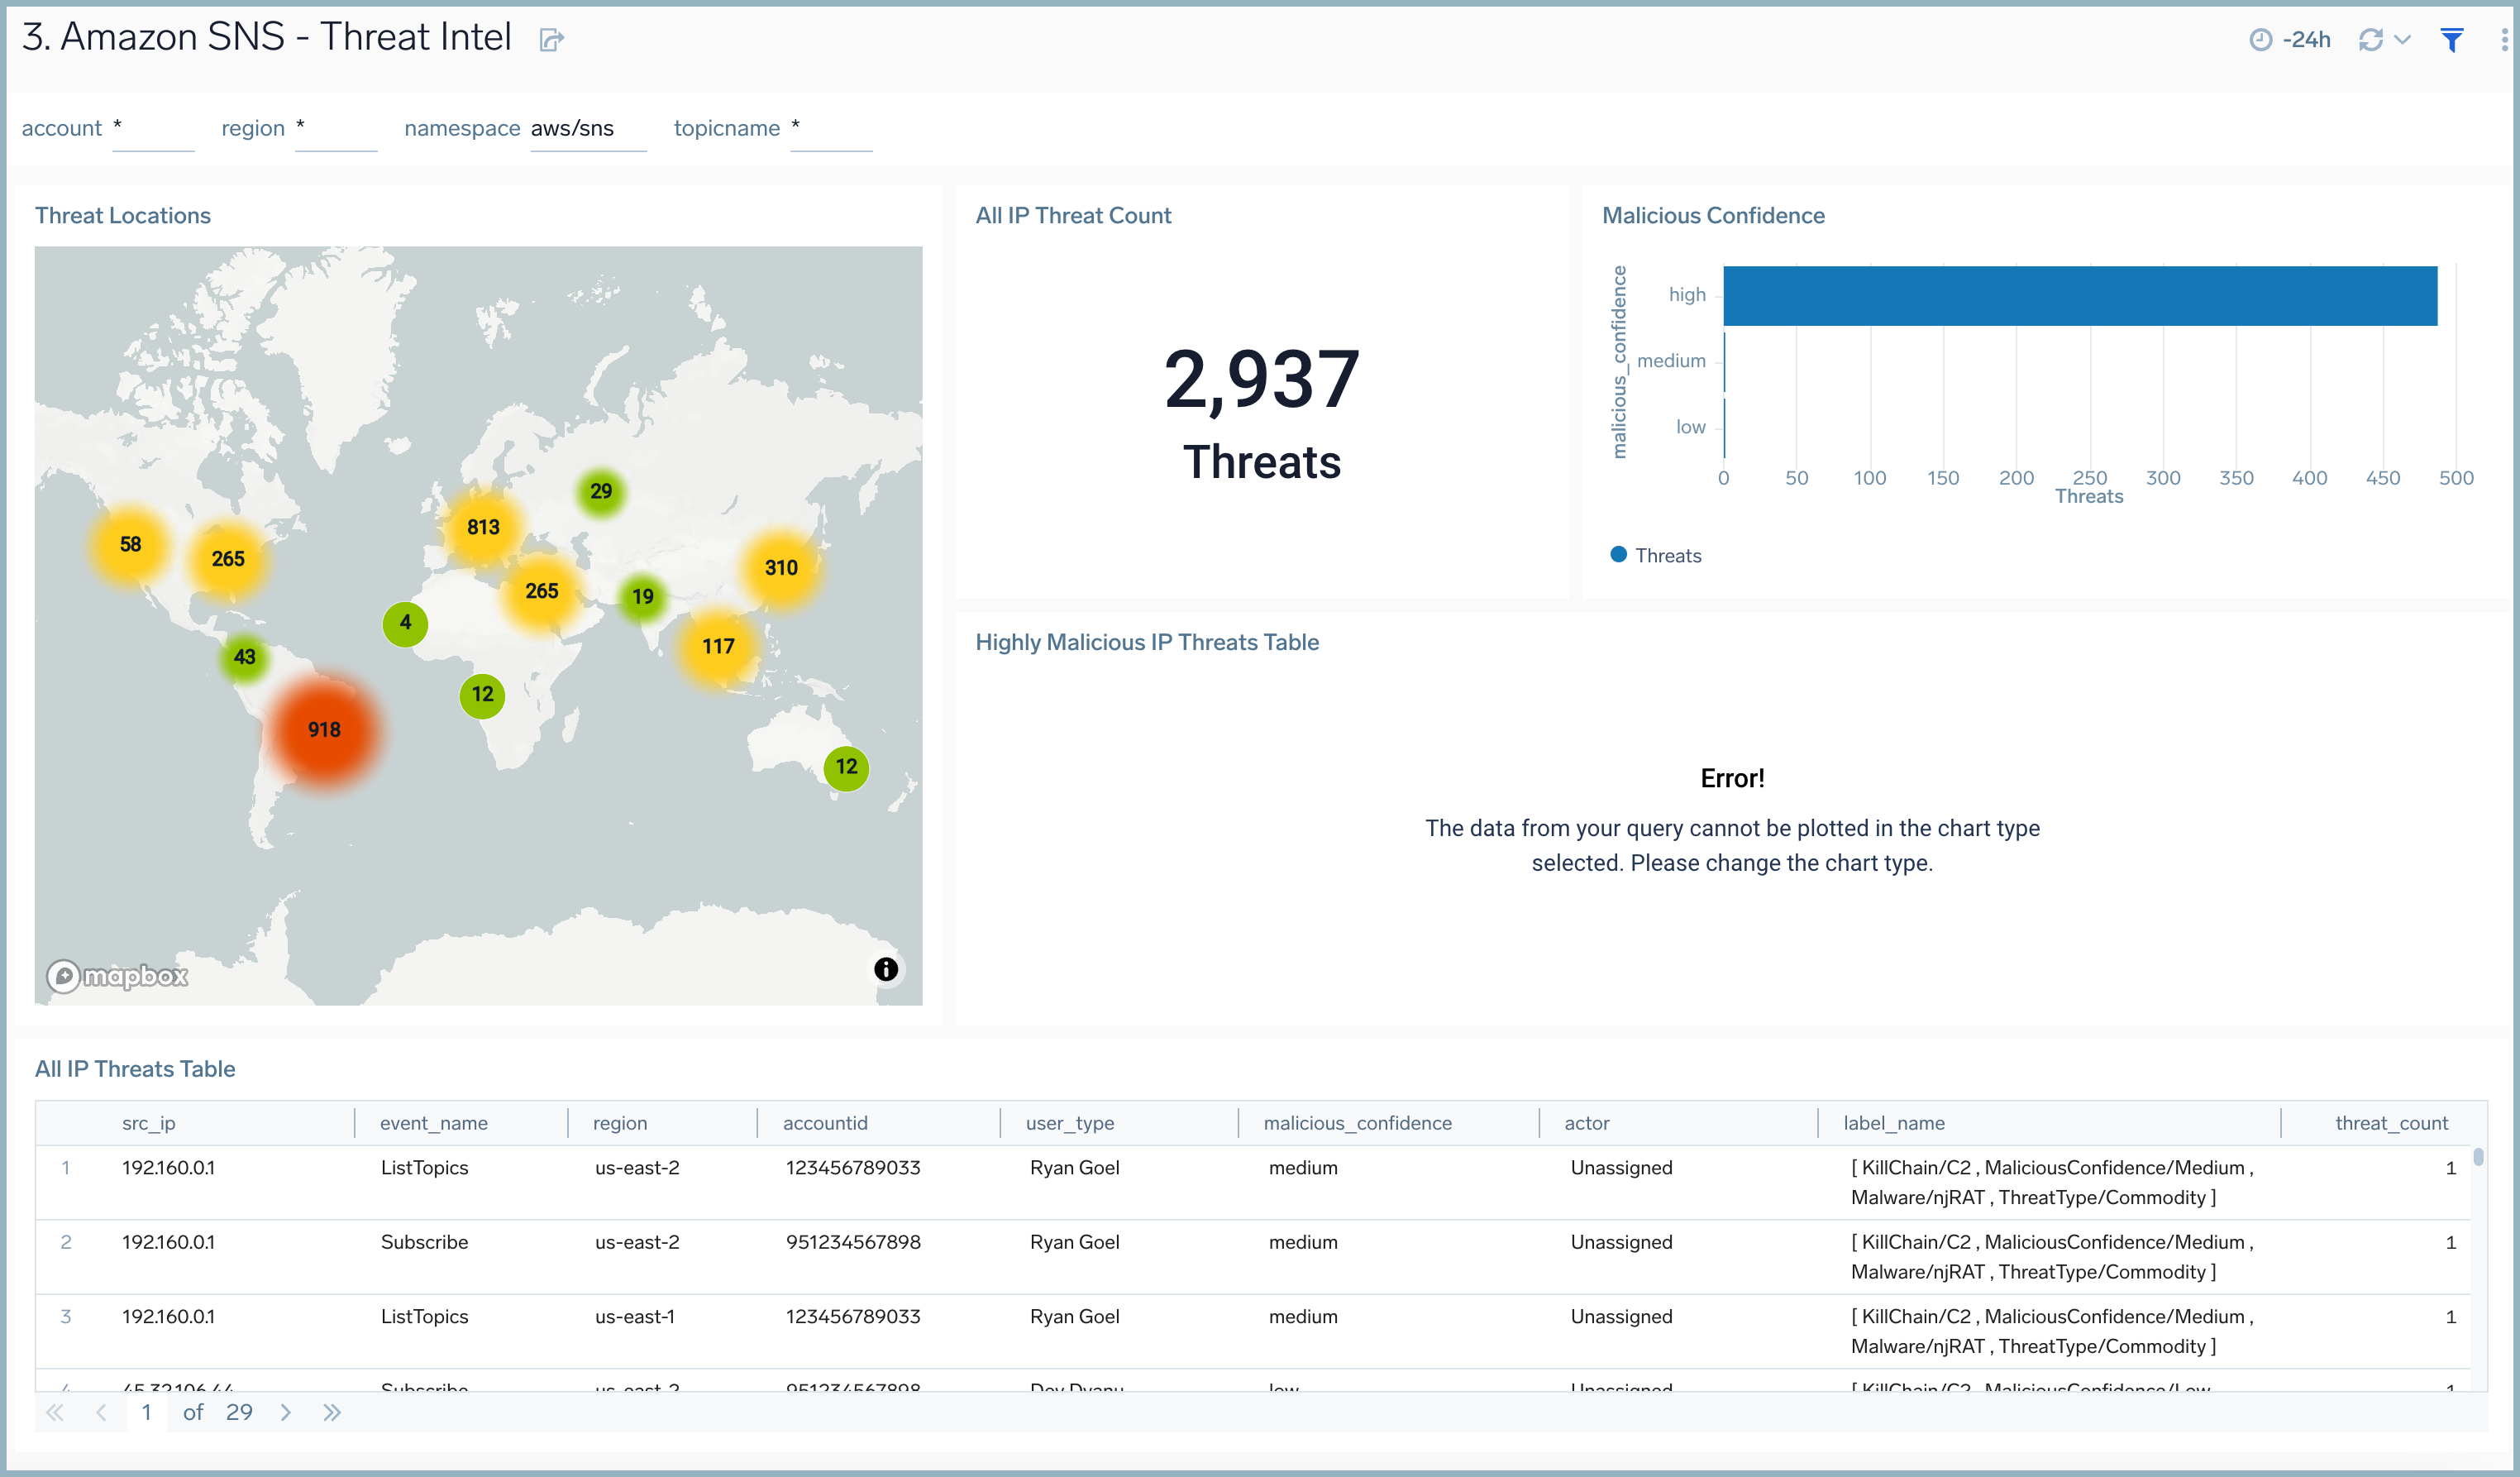
Amazon SNS - Threat Intel
The Amazon SNS - Threat Intel dashboard provides insights across threat locations, count, malicious confidence and details.
Use this dashboard to:
- Monitor details of threat locations and count .
- Get details of threats by malicious confidence and malicious IPs.
- Get details of all threats by IPs.
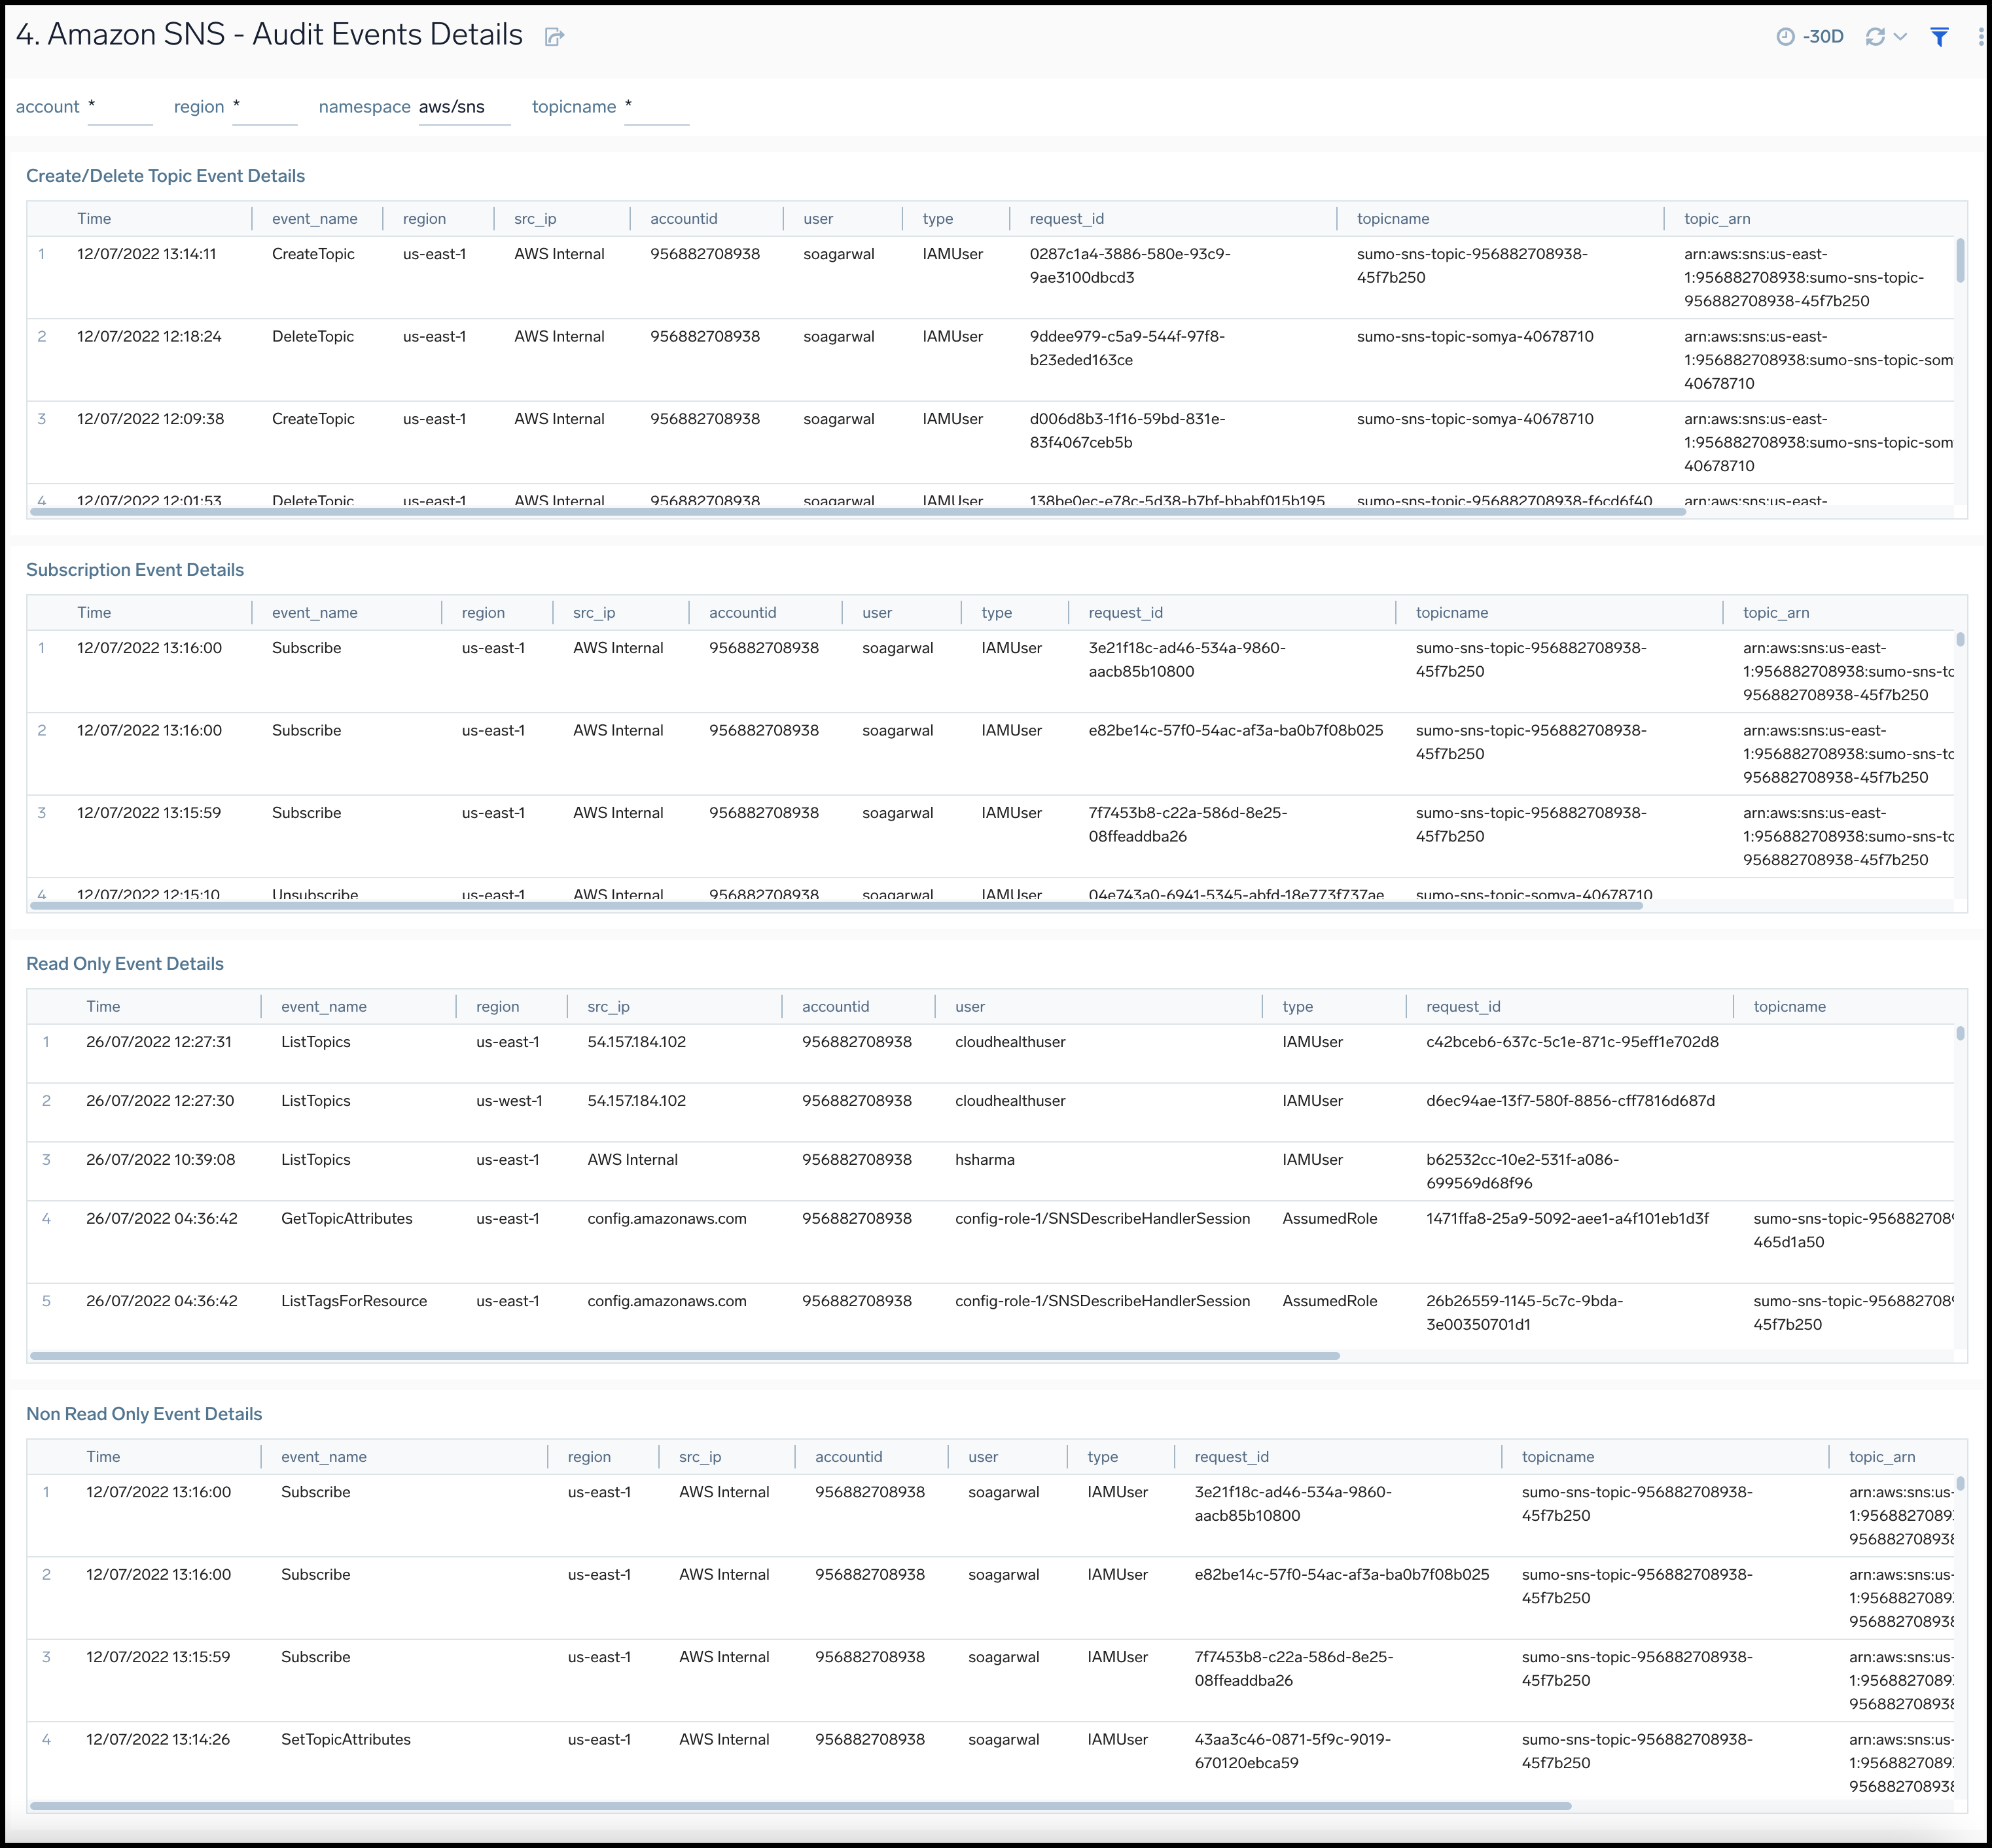
Amazon SNS - Audit Events Details
The Amazon SNS - Audit Events Details dashboard provides insights across topics, subscriptions, read only and non read only events.
Use this dashboard to:
- Monitor details of topics created and deleted.
- Get all details of all subscription events.
- Get details of all read only and non read only events.