AWS Application Load Balancer
The AWS application Load Balancer functions at the application layer receive requests, evaluates the listener rules in priority order to determine which rule to apply, and then selects a target from the target group.
The Sumo Logic app for AWS Observability Application Load Balancer is a unified logs and metrics (ULM) app that gives you visibility into the health of your Application Load Balancer and target groups. Use the pre-configured dashboards to understand the latency, request and host status, threat intel, and HTTP backend codes by availability zone and target group.
Log and metrics types
The AWS Application Load Balancer ULM App uses the following log and metric types:
- Metrics included in the AWS/ApplicationELB namespace. For more details, see this AWS Services help page.
- The Application Load Balancer Access Log introduces two new fields in addition to the fields contained in Classic ELB Access log:
- Type. This is the type of request or connection (HTTP, HTTPS, H2, ws, wss)
- Target_group_arn. This is the Amazon Resource Name (ARN) of the target group
The logs are stored in a .gzip format in the specified S3 bucket and contain these fields in this order: timestamp, elb, client:port, target:port, request_processing_time, target_processing_time, response_processing_time, elb_status_code, target_status_code, received_bytes, sent_bytes, request, user_agent, ssl_cipher, ssl_protocol, target_group_arn, trace_id. For more details on the ALB Access log, see the AWS documentation.
Sample log messages
https 2017-11-20T22:05:36 long-bill-lb 77.222.19.149:41148 10.168.203.134:23662 0.000201 0.401924
0.772005 500 200 262 455 "GET https://elmagek.no-ip.org:443/json/v...=1405574870206 HTTP/1.1"
"Mozilla/5.0 (Macintosh; U; Intel Mac OS X 10.5; en-US; rv:1.9.0.4) Gecko/2008102920 Firefox/3.0.4"
DH-RSA-AES256-GCM-SHA384 TLSv1.2 arn:aws:elasticloadbalancing:us-west-2:104030218370:targetgroup/Prod-frontend/92e3199b1rc814fe9
"Root=1-58337364-23a8c76965a2ef7629b185e134"
Sample queries
The following query sample was taken from the HTTP Target 5xx per Target Group panel on the AWS Application Load Balancer - HTTP Target Group Codes dashboard.
_sourceCategory=Labs/AWS/ALB/Metrics Namespace=aws/applicationelb metric=HTTPCode_Target_5XX_Count
Statistic=Sum _sourceHost=* _collector=* region=* targetgroup=* AvailabilityZone=* entity=* account=*
| parse field= TargetGroup */* as Unused, TargetGroup | sum by TargetGroup
Viewing AWS Application Load Balancer dashboards
We highly recommend you view these dashboards in the AWS Observability view of the AWS Observability solution.
All dashboards have a set of filters that you can apply to the entire dashboard. Use these filters to drill down and examine the data to a granular level.
- You can change the time range for a dashboard or panel by selecting a predefined interval from a drop-down list, choosing a recently used time range, or specifying custom dates and times. Learn more.
- If required, configure the refresh interval rate for a dashboard or panel by clicking the drop-down arrow next to the refresh icon.
- Click the funnel icon in the dashboard top menu bar to filter dashboard with Template Variables.
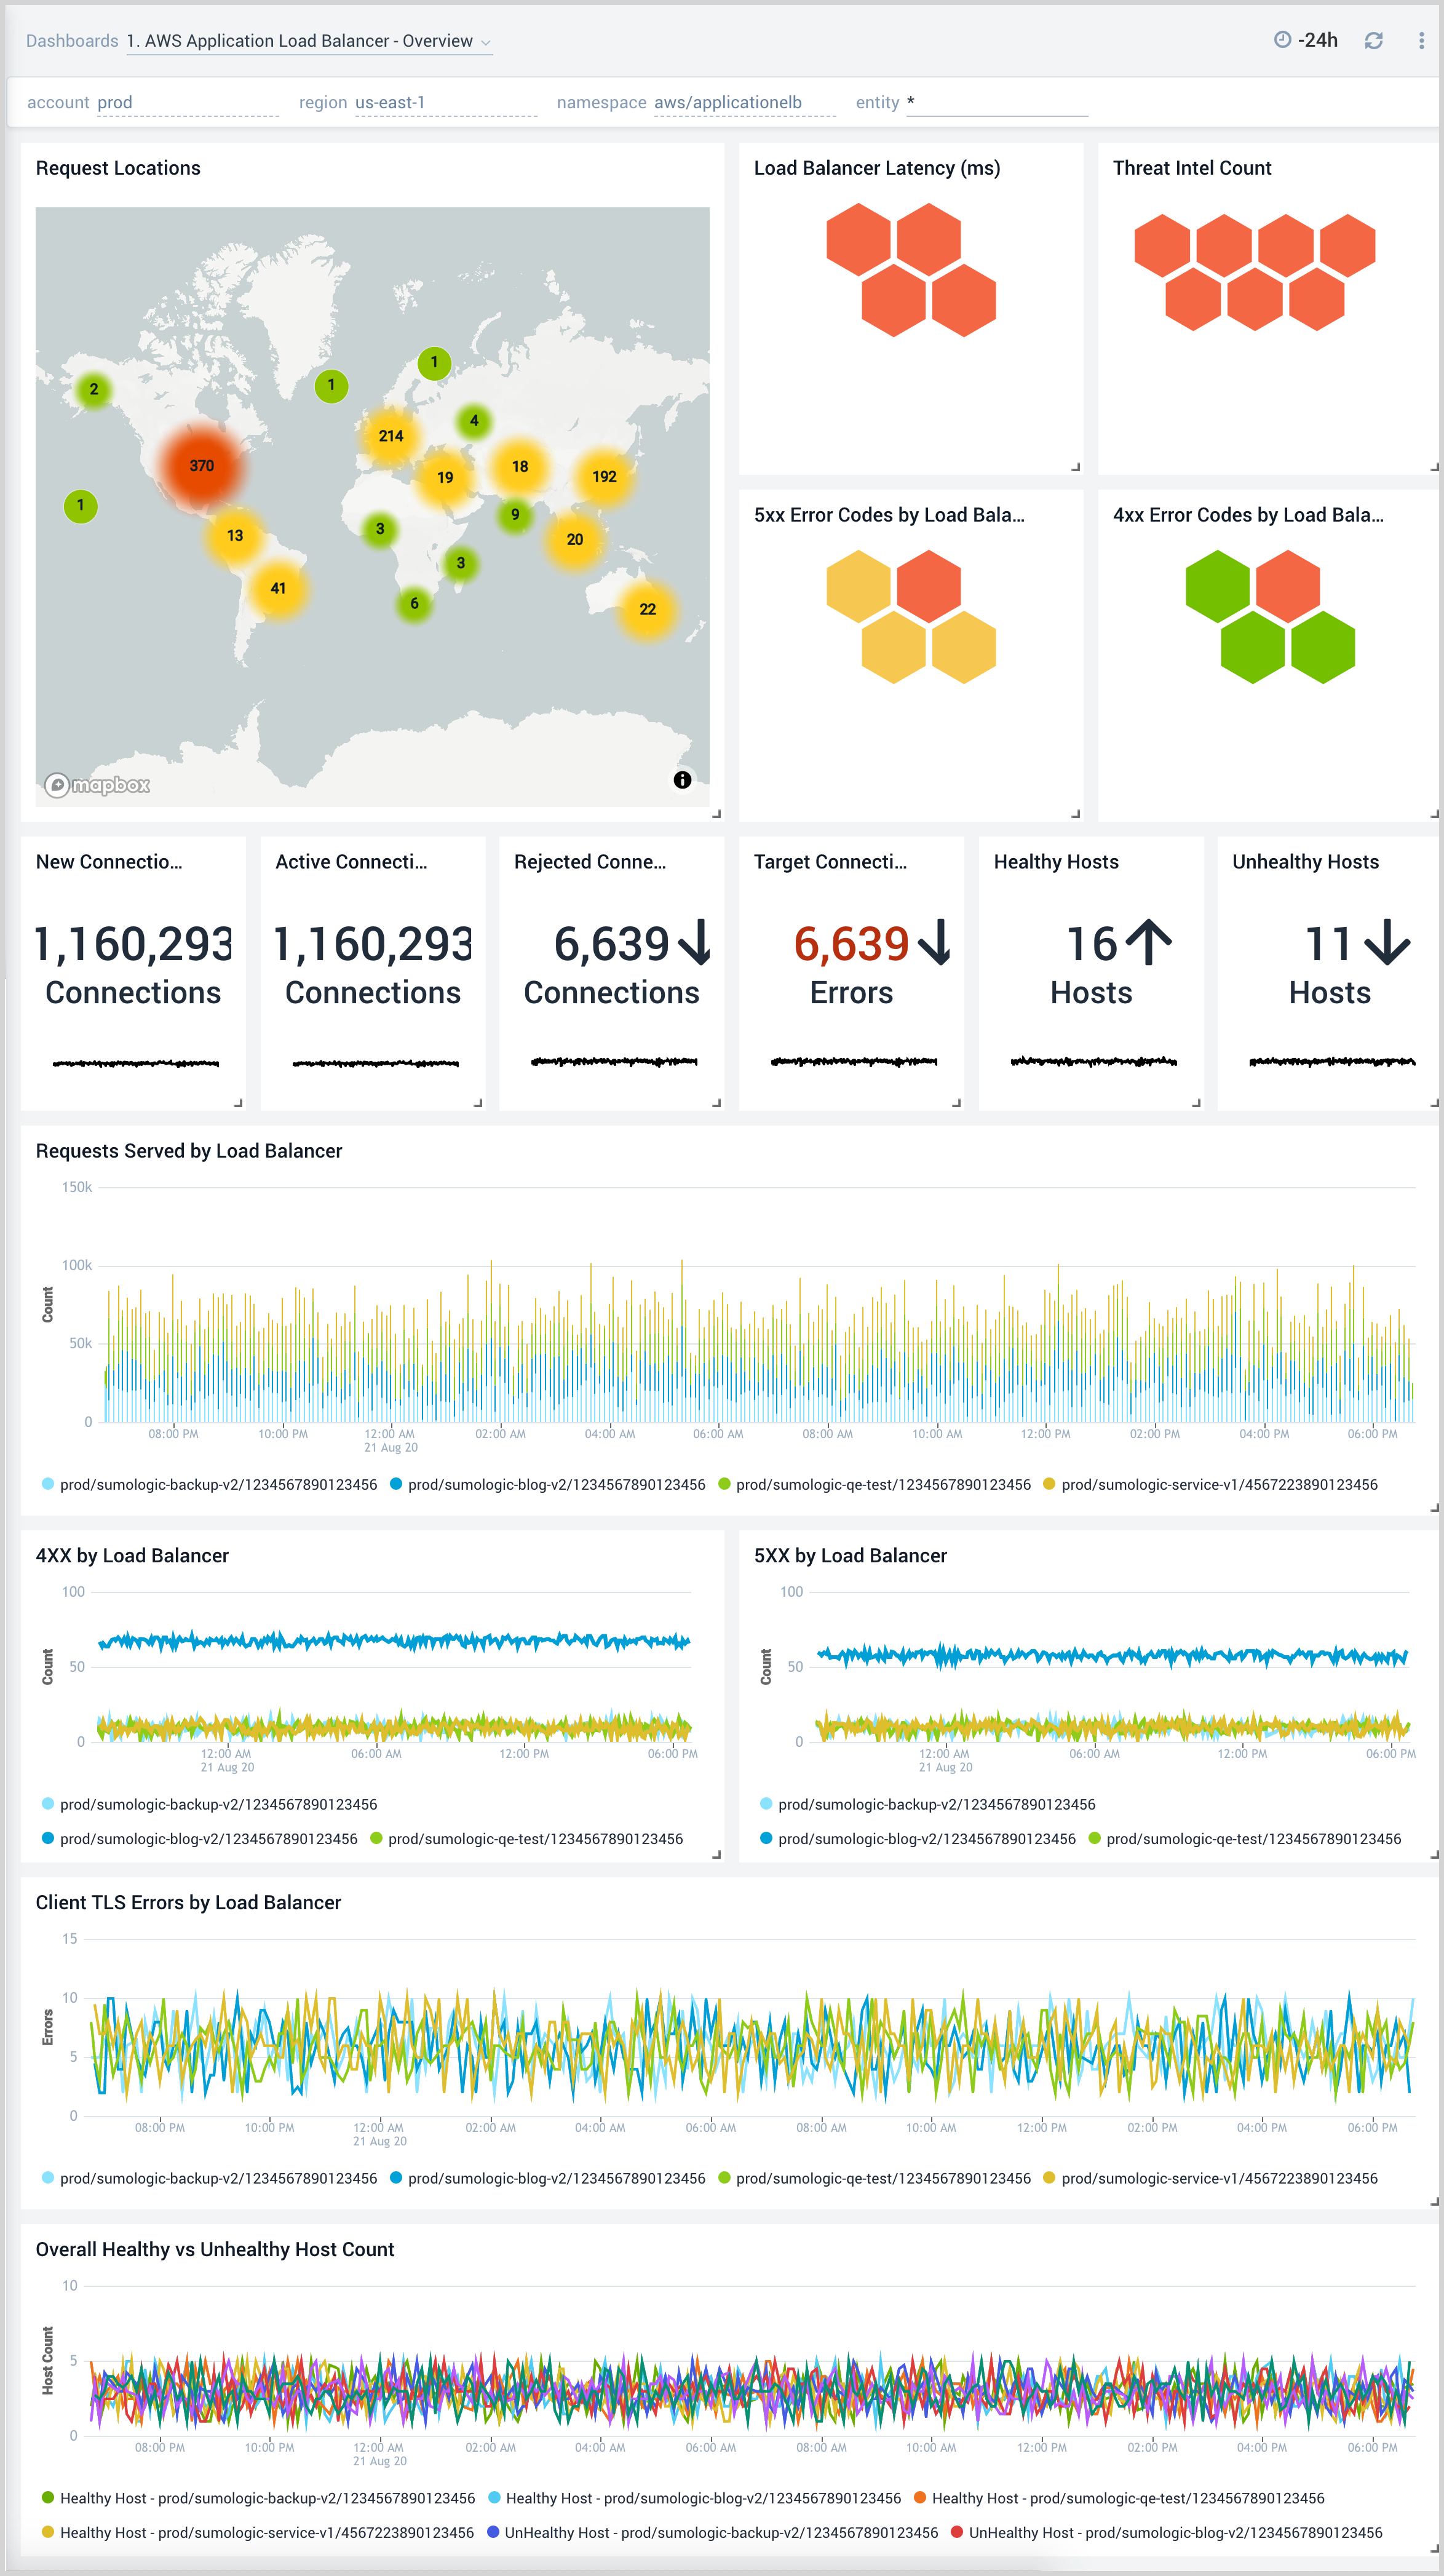
AWS Application Load Balancer - Overview
The AWS Application Load Balancer - Overview dashboard provides visibility into the health of your Application Load Balancer and target groups, with at-a-glance views of latency, request and host status, requests from malicious sources, and HTTP backend codes.
Use this dashboard to:
- Monitor requests to each load balancer to ensure the load is being distributed as desired.
- Quickly identify healthy and unhealthy hosts.
- Monitor trends for load balancers errors, 4xx, and 5xx errors, as well as healthy and unhealthy hosts.
- Monitor the current state across all load balancers via active connections, new connections, target connection errors, and rejected connections.
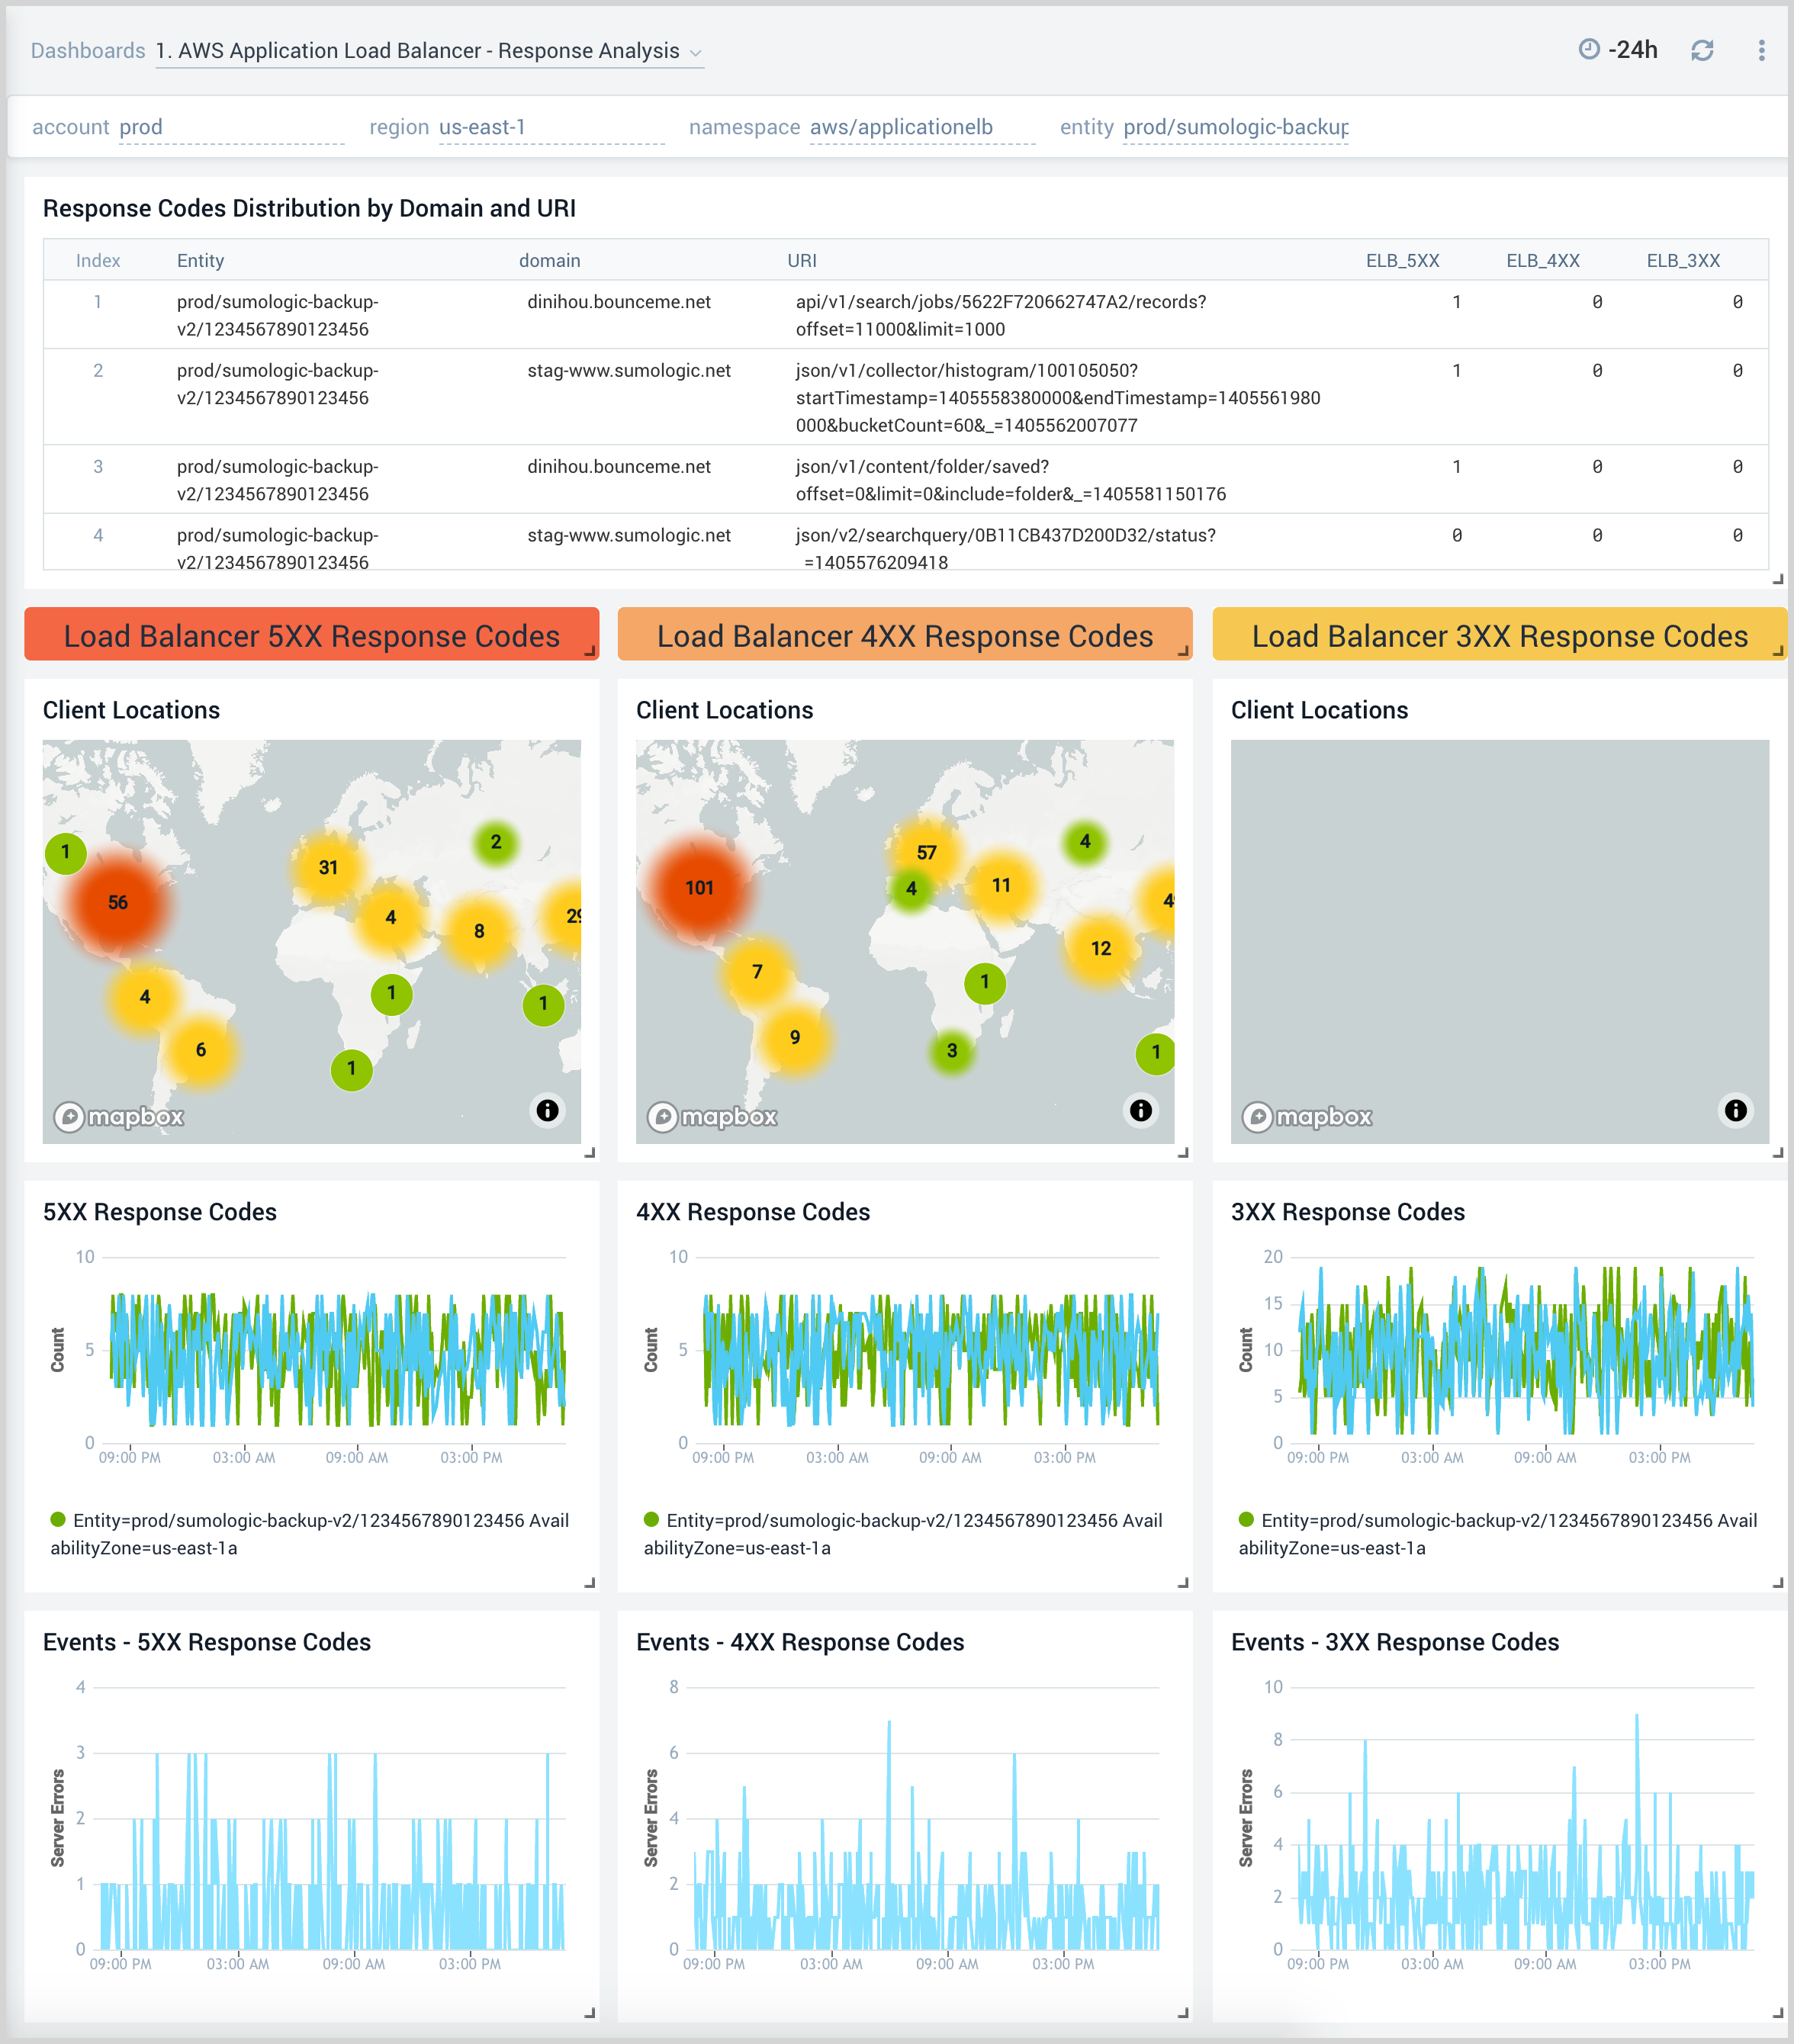
1. AWS Application Load Balancer - Response Analysis
The AWS Application Load Balancer - Response Analysis dashboard provides insights into how your load balancers are responding to clients.
Use this dashboard to:
- Monitor incoming client locations for all 5XX, 4XX and 3XX error responses.
- Quickly correlate error responses using load balancer access logs and AWS CloudWatch metrics to determine the possible cause for failures and decide corrective actions.
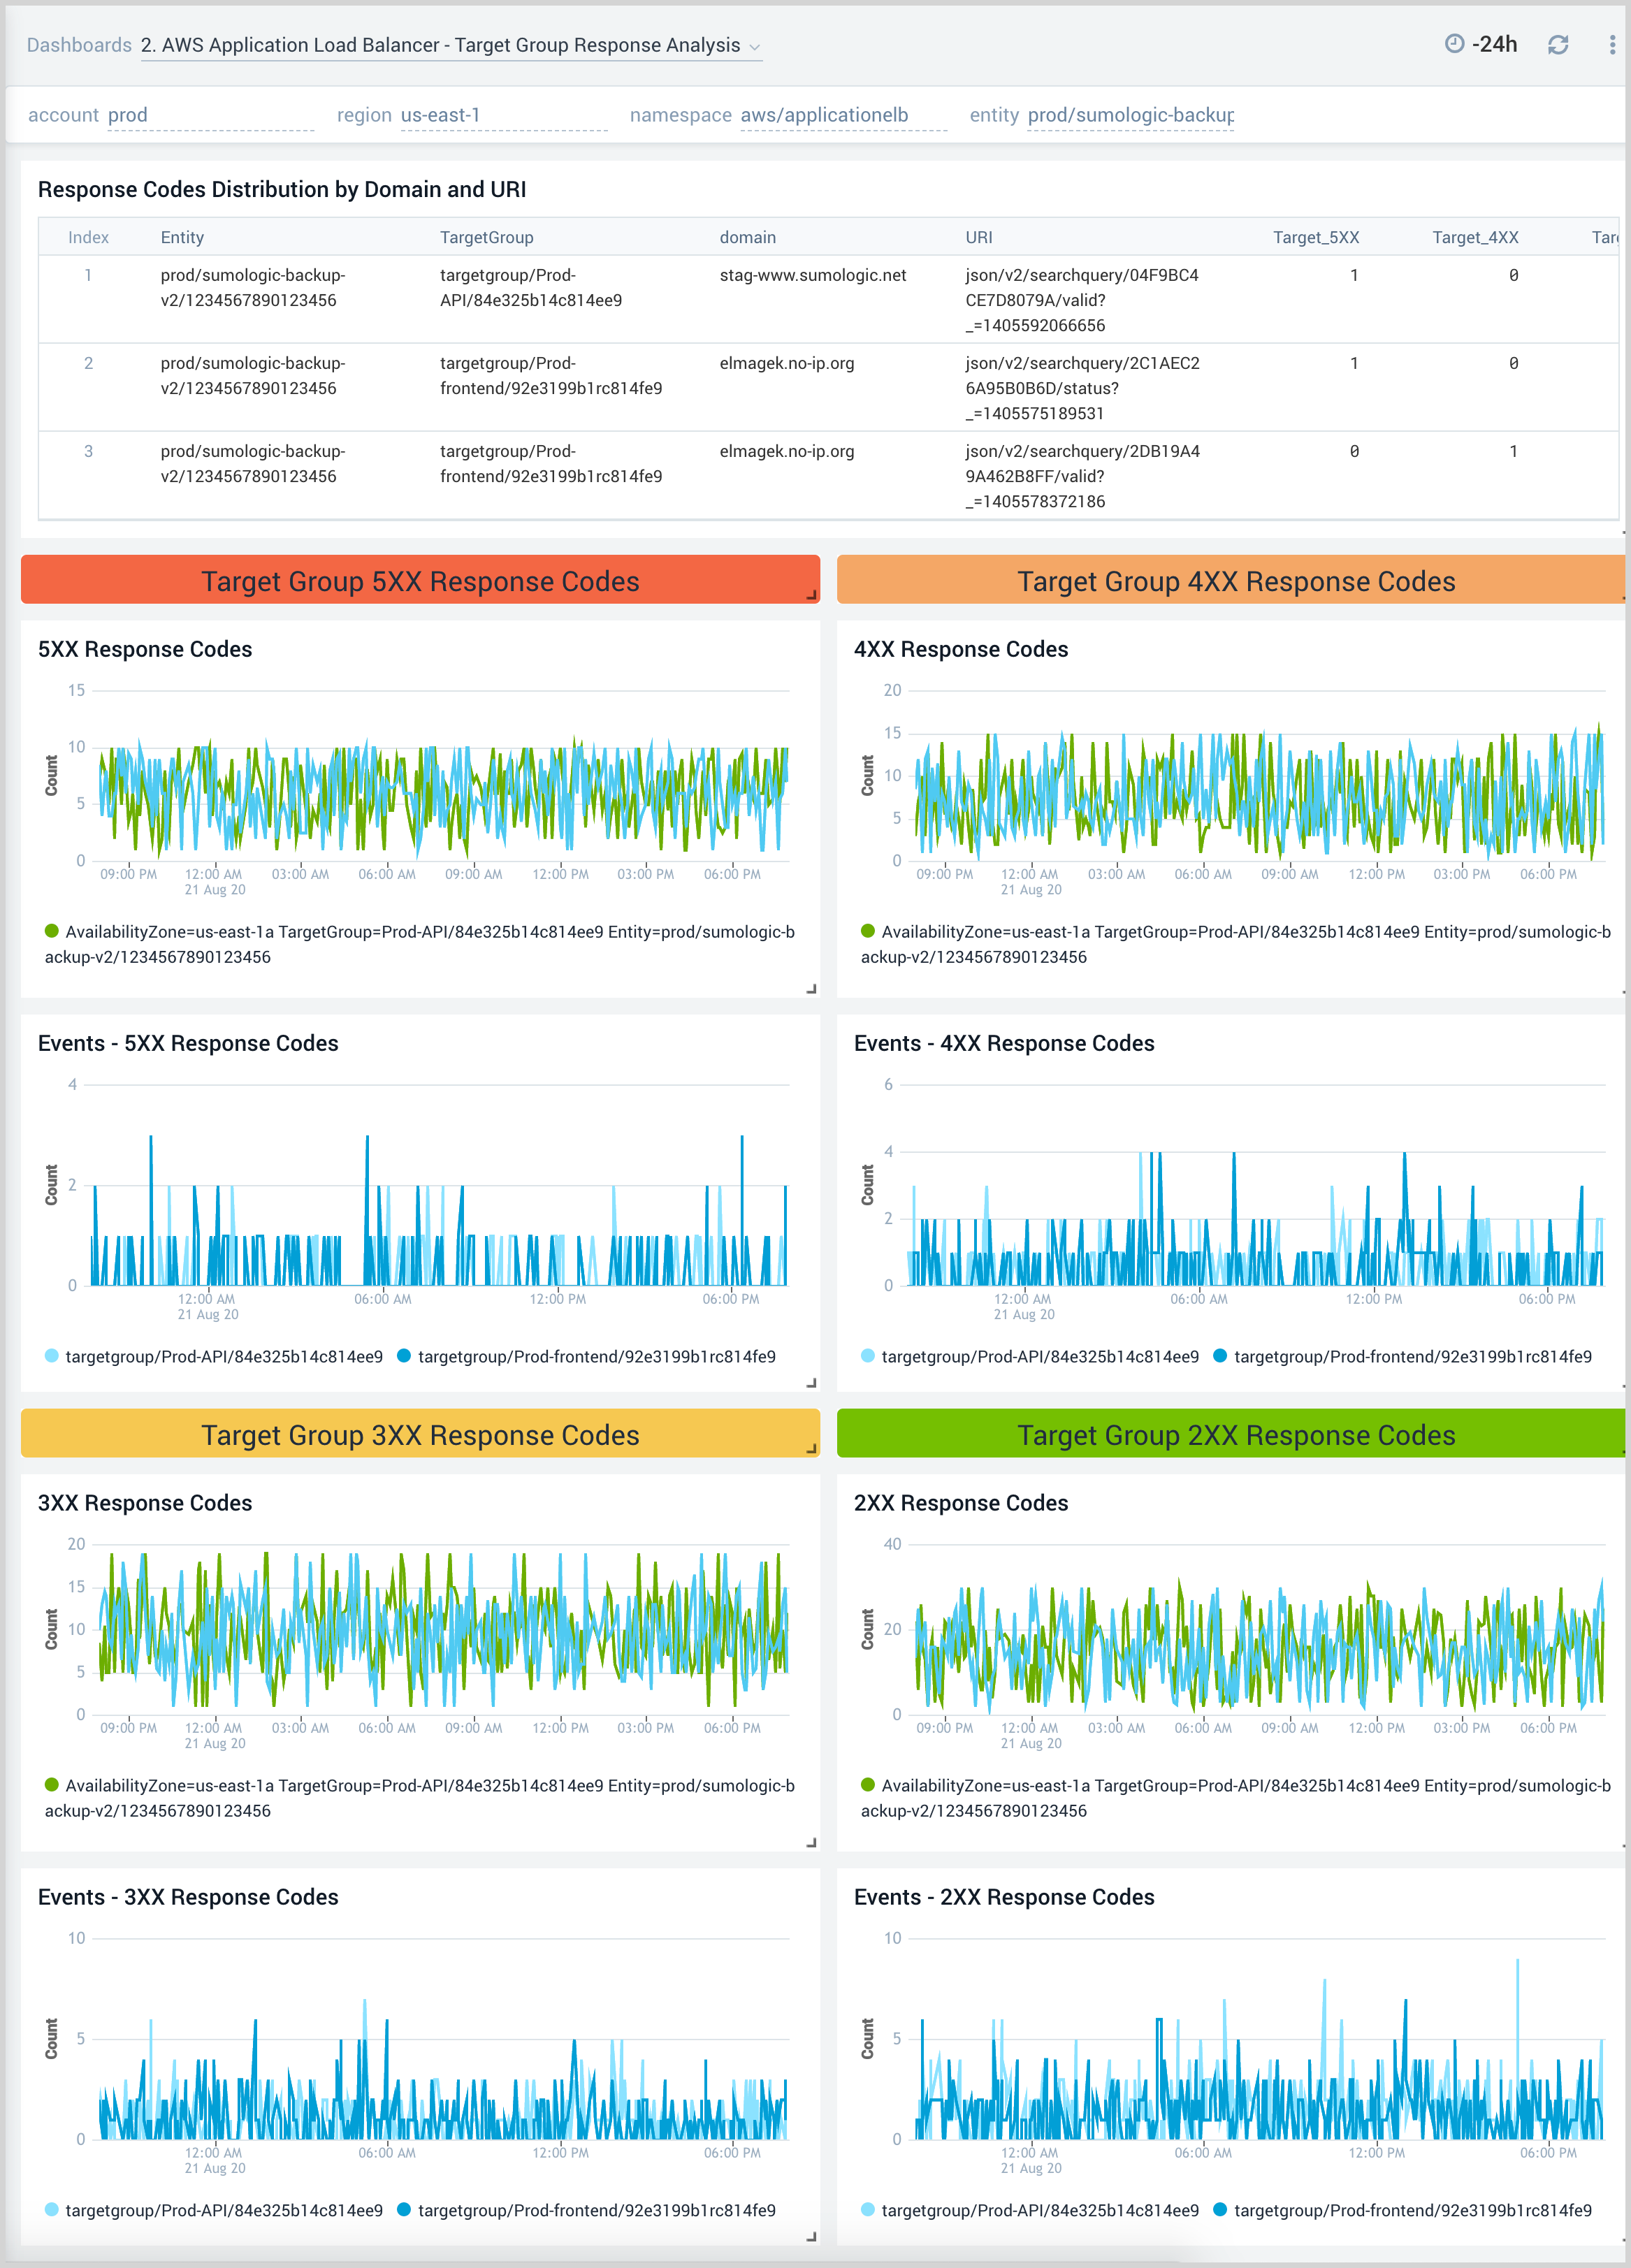
2. AWS Application Load Balancer - Target Group Response Analysis
The AWS Application Load Balancer - Target Group Response Analysis dashboard provides insights into how various target groups are responding to client requests.
Use this dashboard to:
- Monitor trends of all response codes for your target groups by LoadBalancer, Target Group, and availability zones.
- Correlate response code trends across load balancer access logs and CloudWatch metrics to determine the root cause for failures.
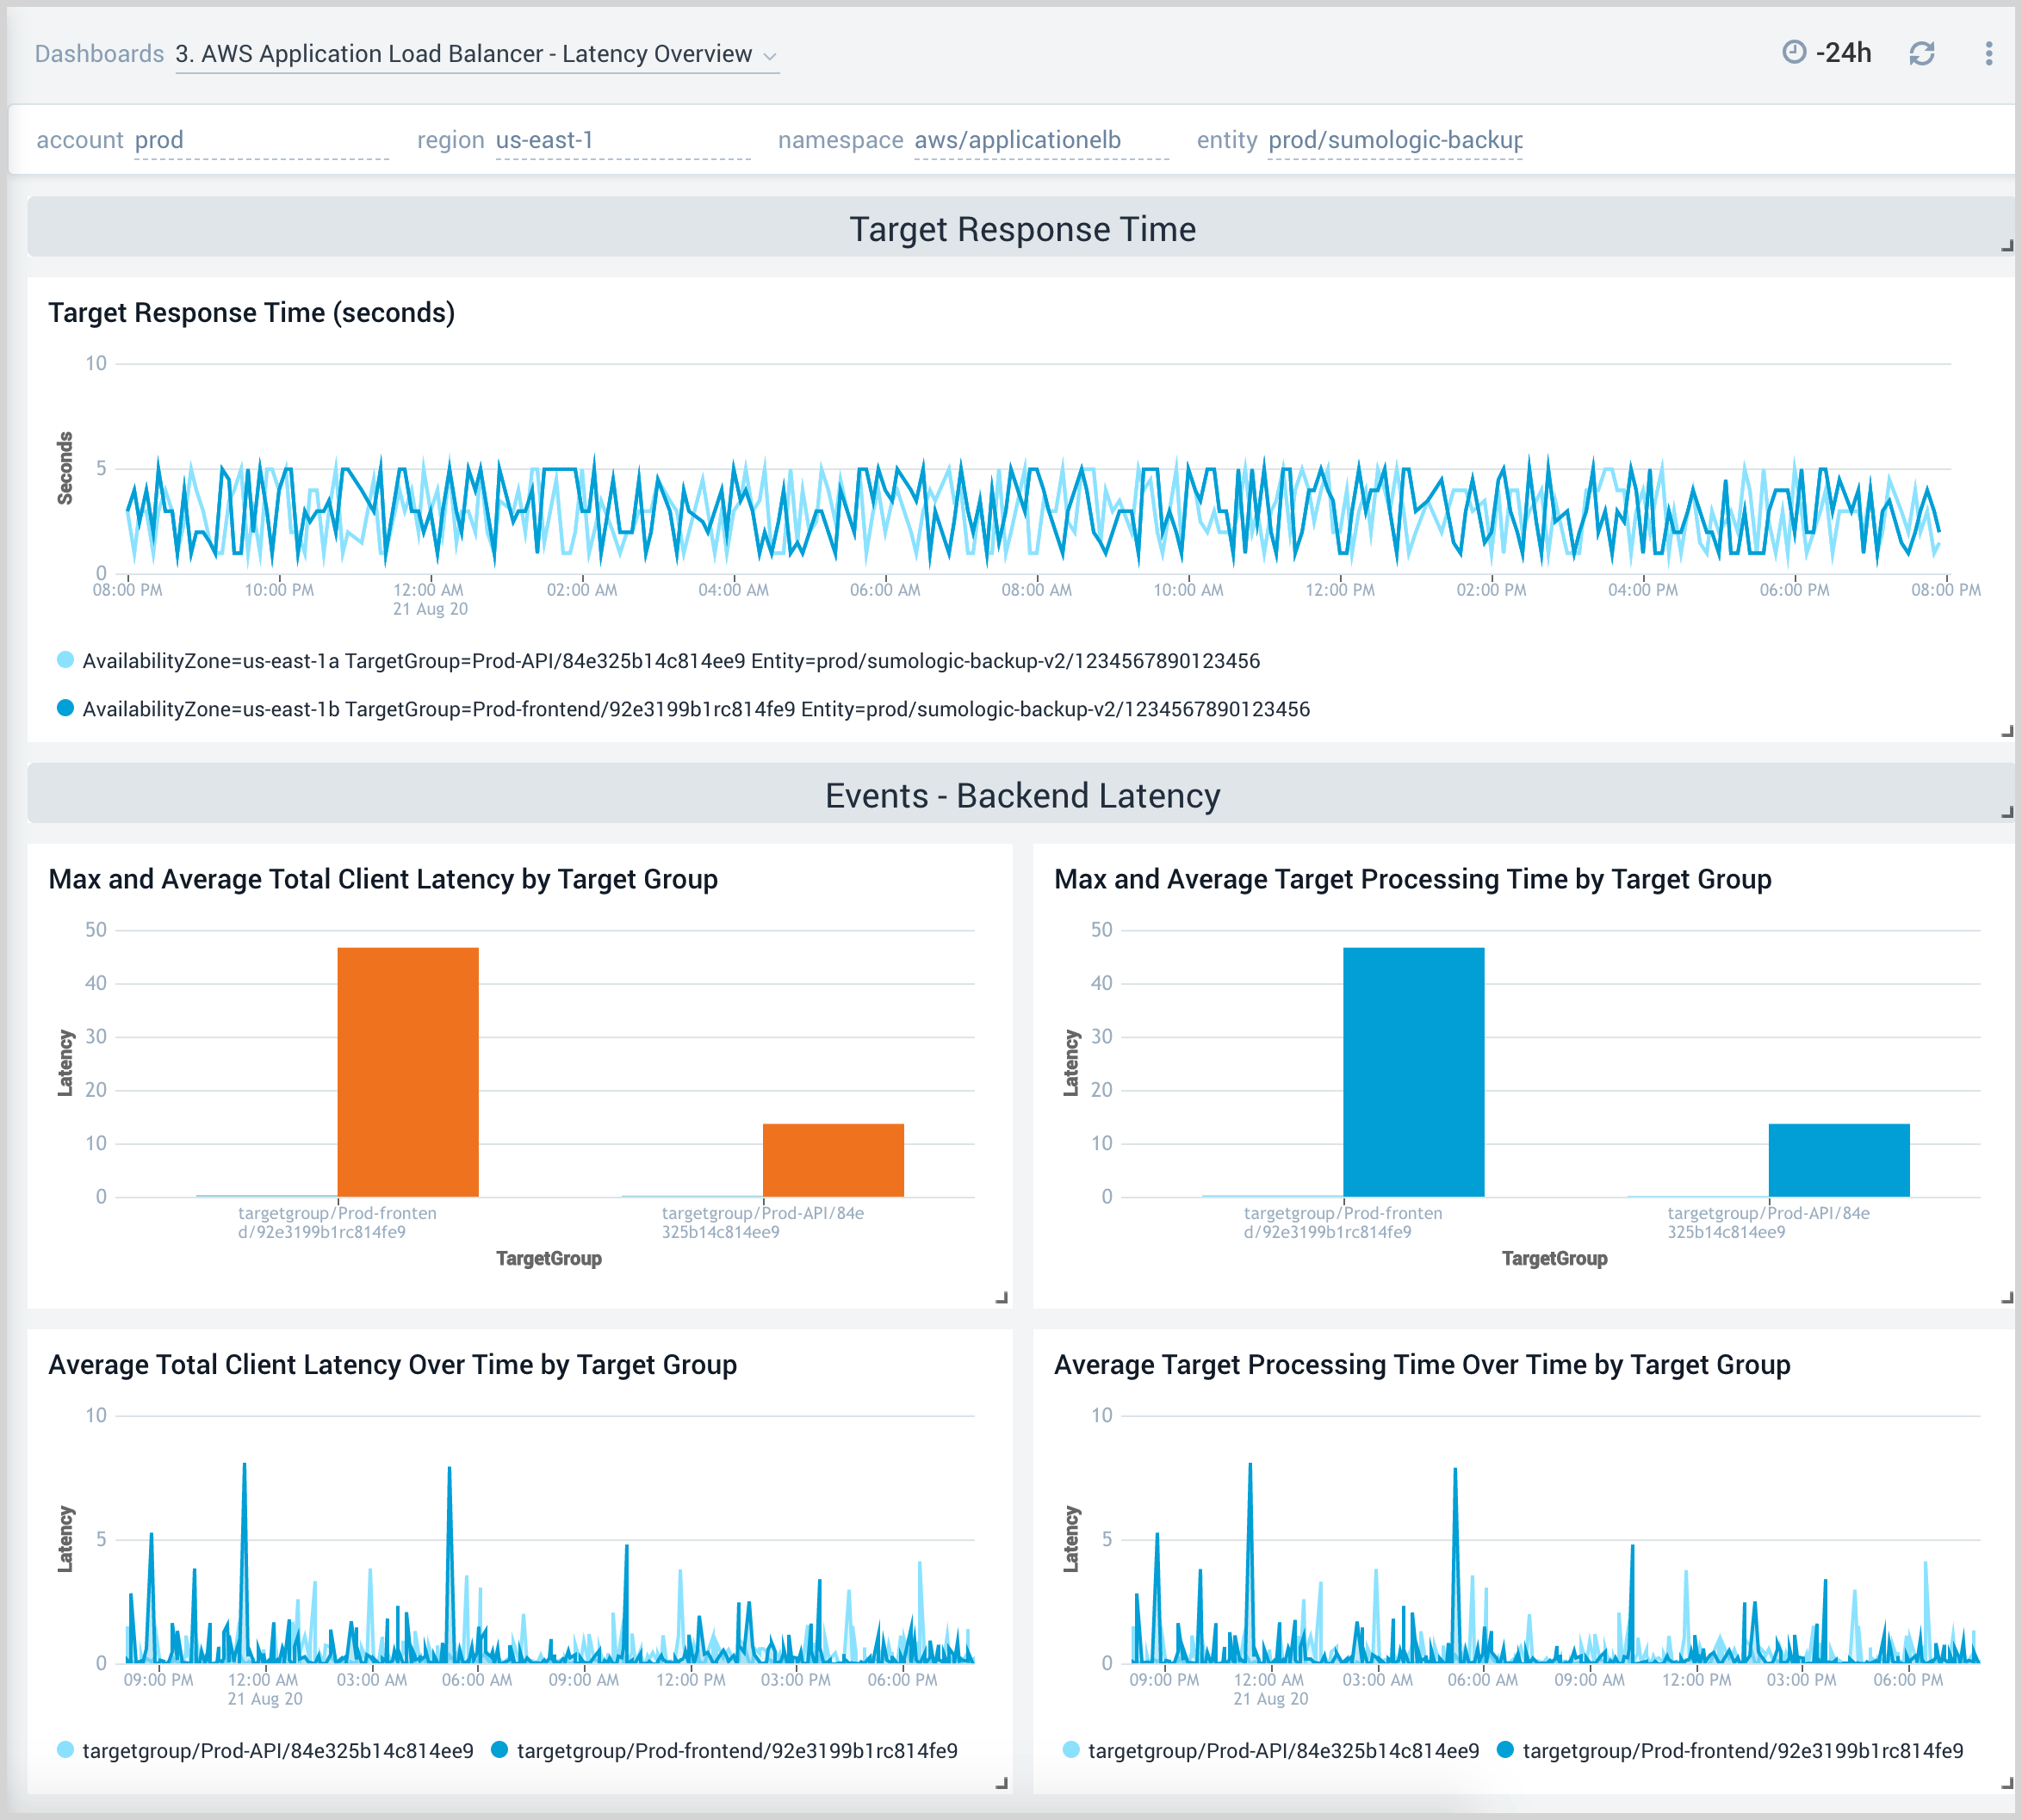
3. AWS Application Load Balancer - Latency Overview
The AWS Application Load Balancer - Latency Overview dashboard provides insights into response times for load balancers, target groups, and availability zones, including backend log response times.
Use this dashboard to:
- Monitor response times by load balancer, target group, and availability zone.
- Monitor client latency and processing times for target groups.
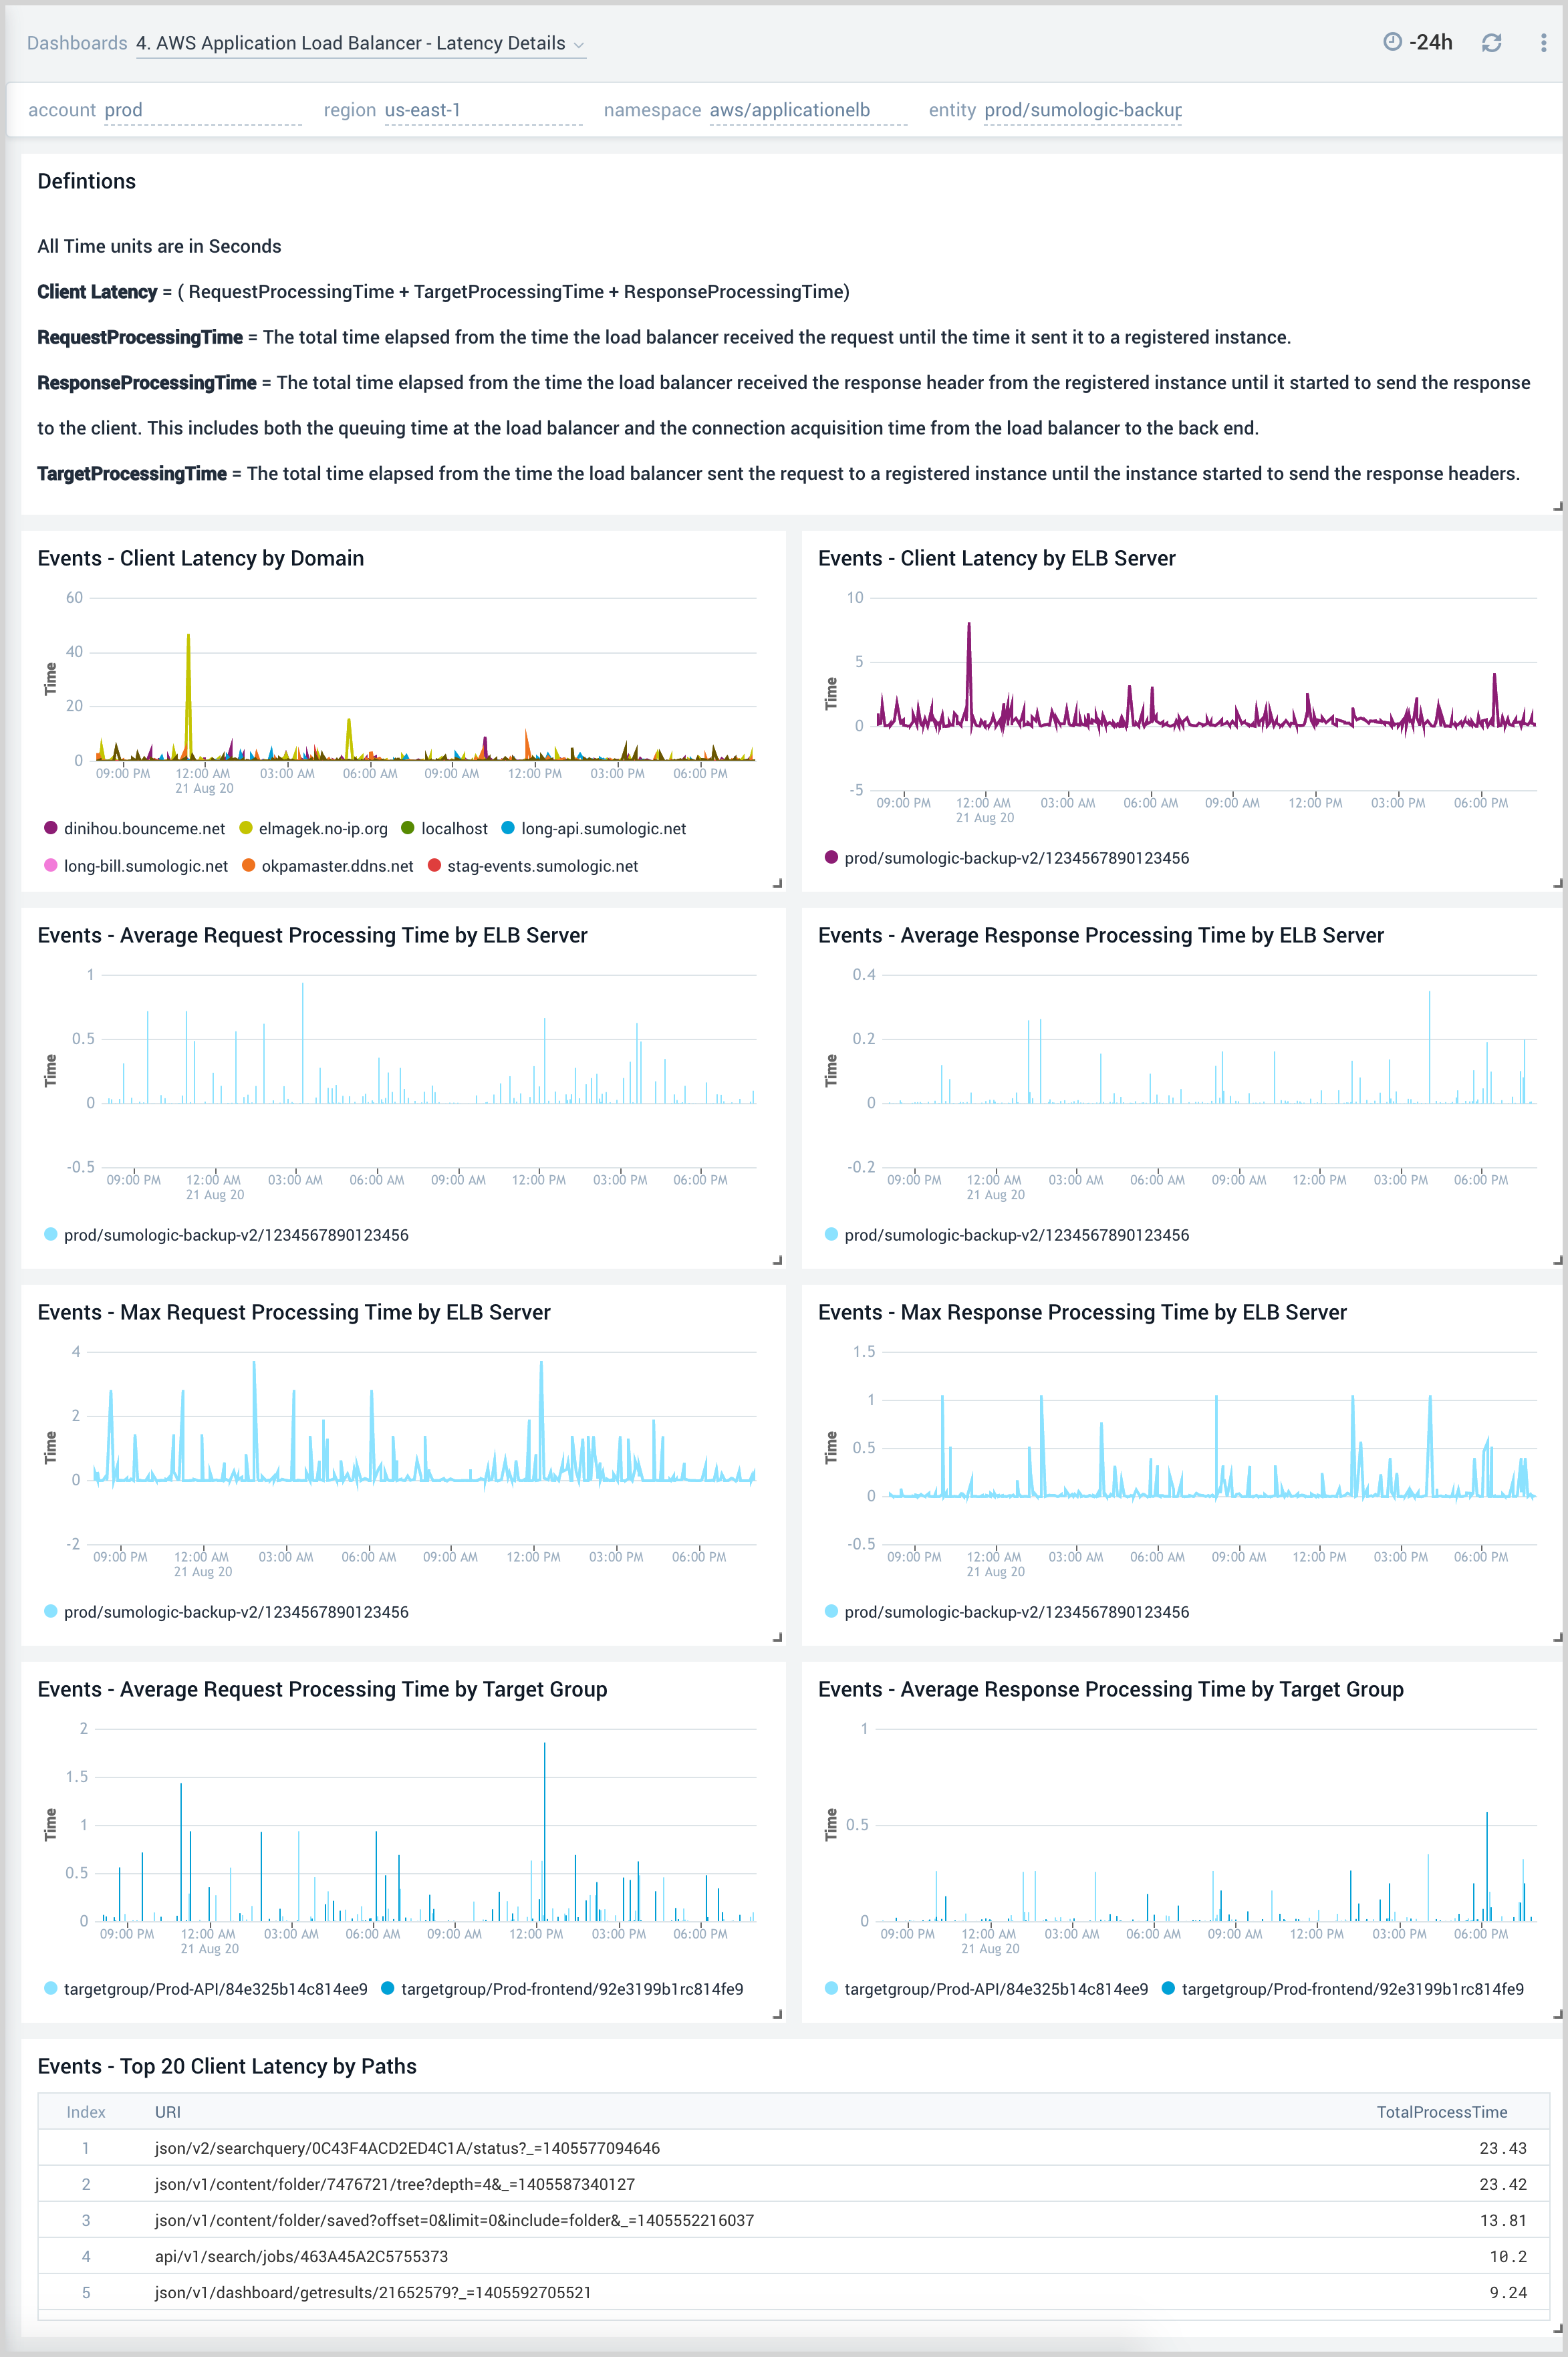
4. AWS Application Load Balancer - Latency Details
The AWS Application Load Balancer - Latency Details dashboard provides insights into client latency by domain and ELB server, as well as processing times by ELB server and target groups throughout your infrastructure.
Use this dashboard to:
- Troubleshoot load balancer performance via detailed views across client, request processing, and response time latencies.
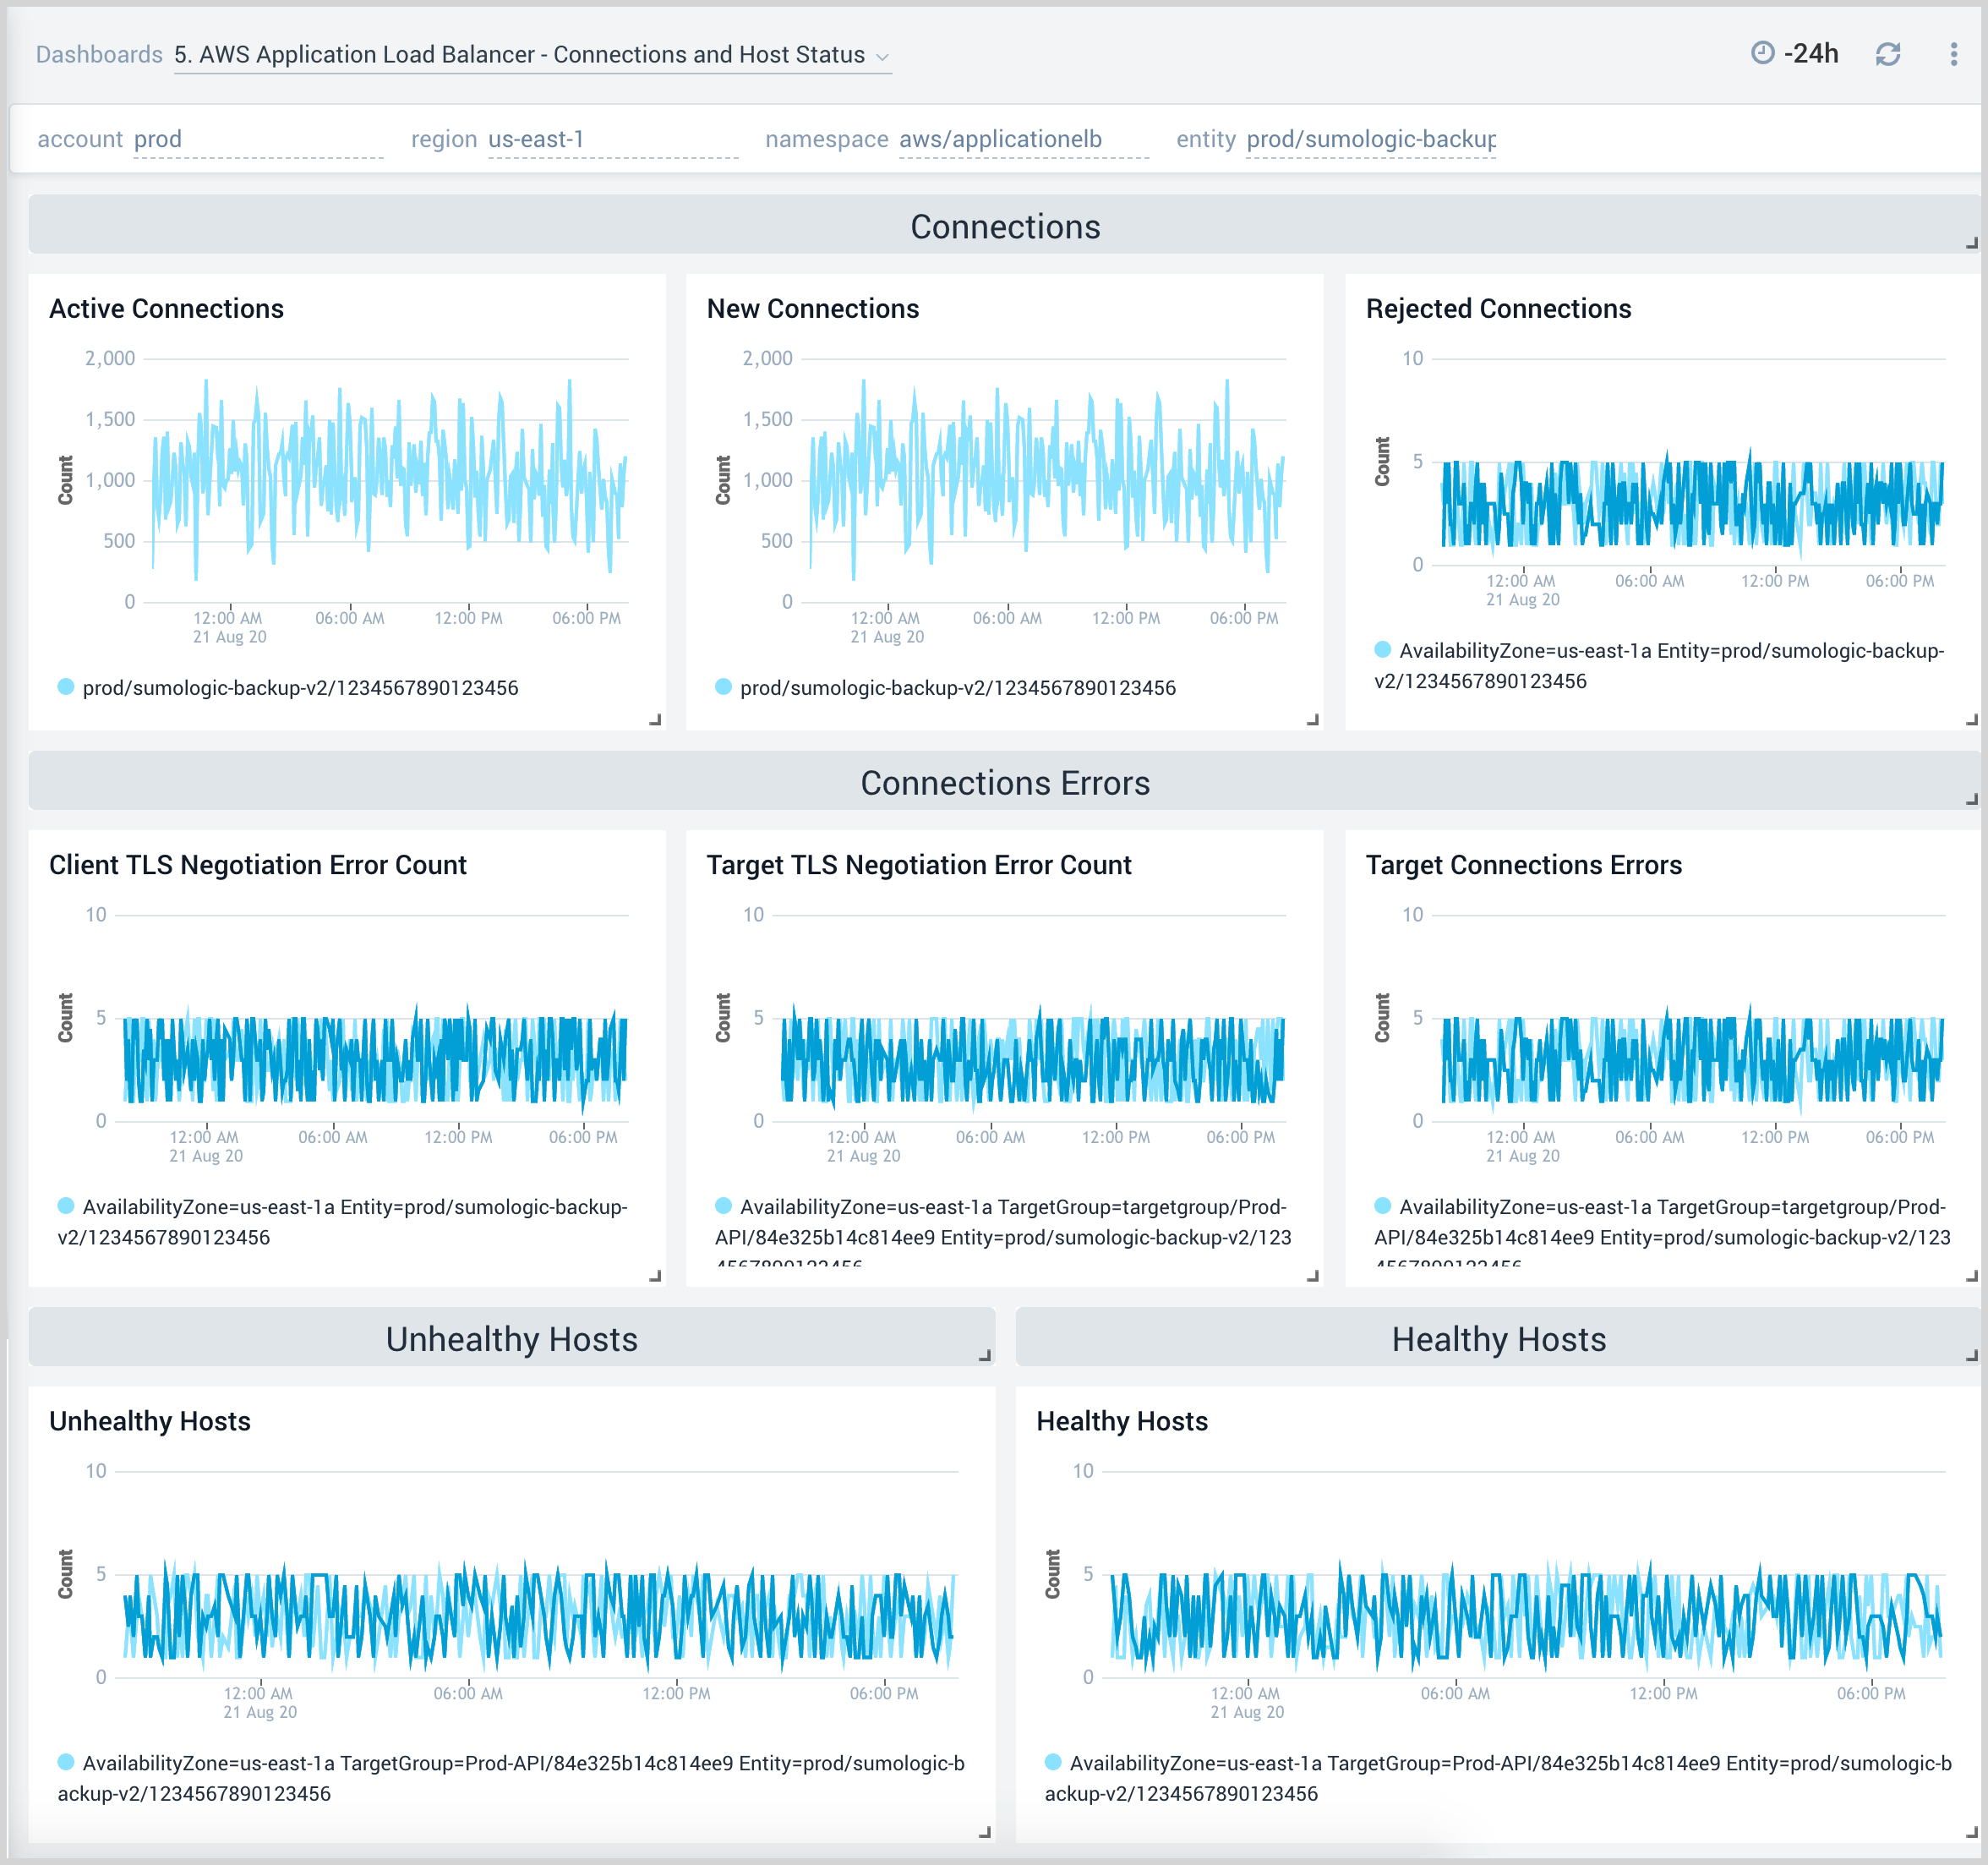
5. AWS Application Load Balancer - Connection and Host Status
The AWS Application Load Balancer - Connection and Host Status dashboard provides insights into active and rejected connections, target connection errors, and healthy and unhealthy hosts.
Use this dashboard to:
- Monitor active connections, new connections, rejected connections, and connection errors for the load balancer.
- Monitor healthy and unhealthy host counts by the load balancer, target group, and availability zone across your infrastructure.
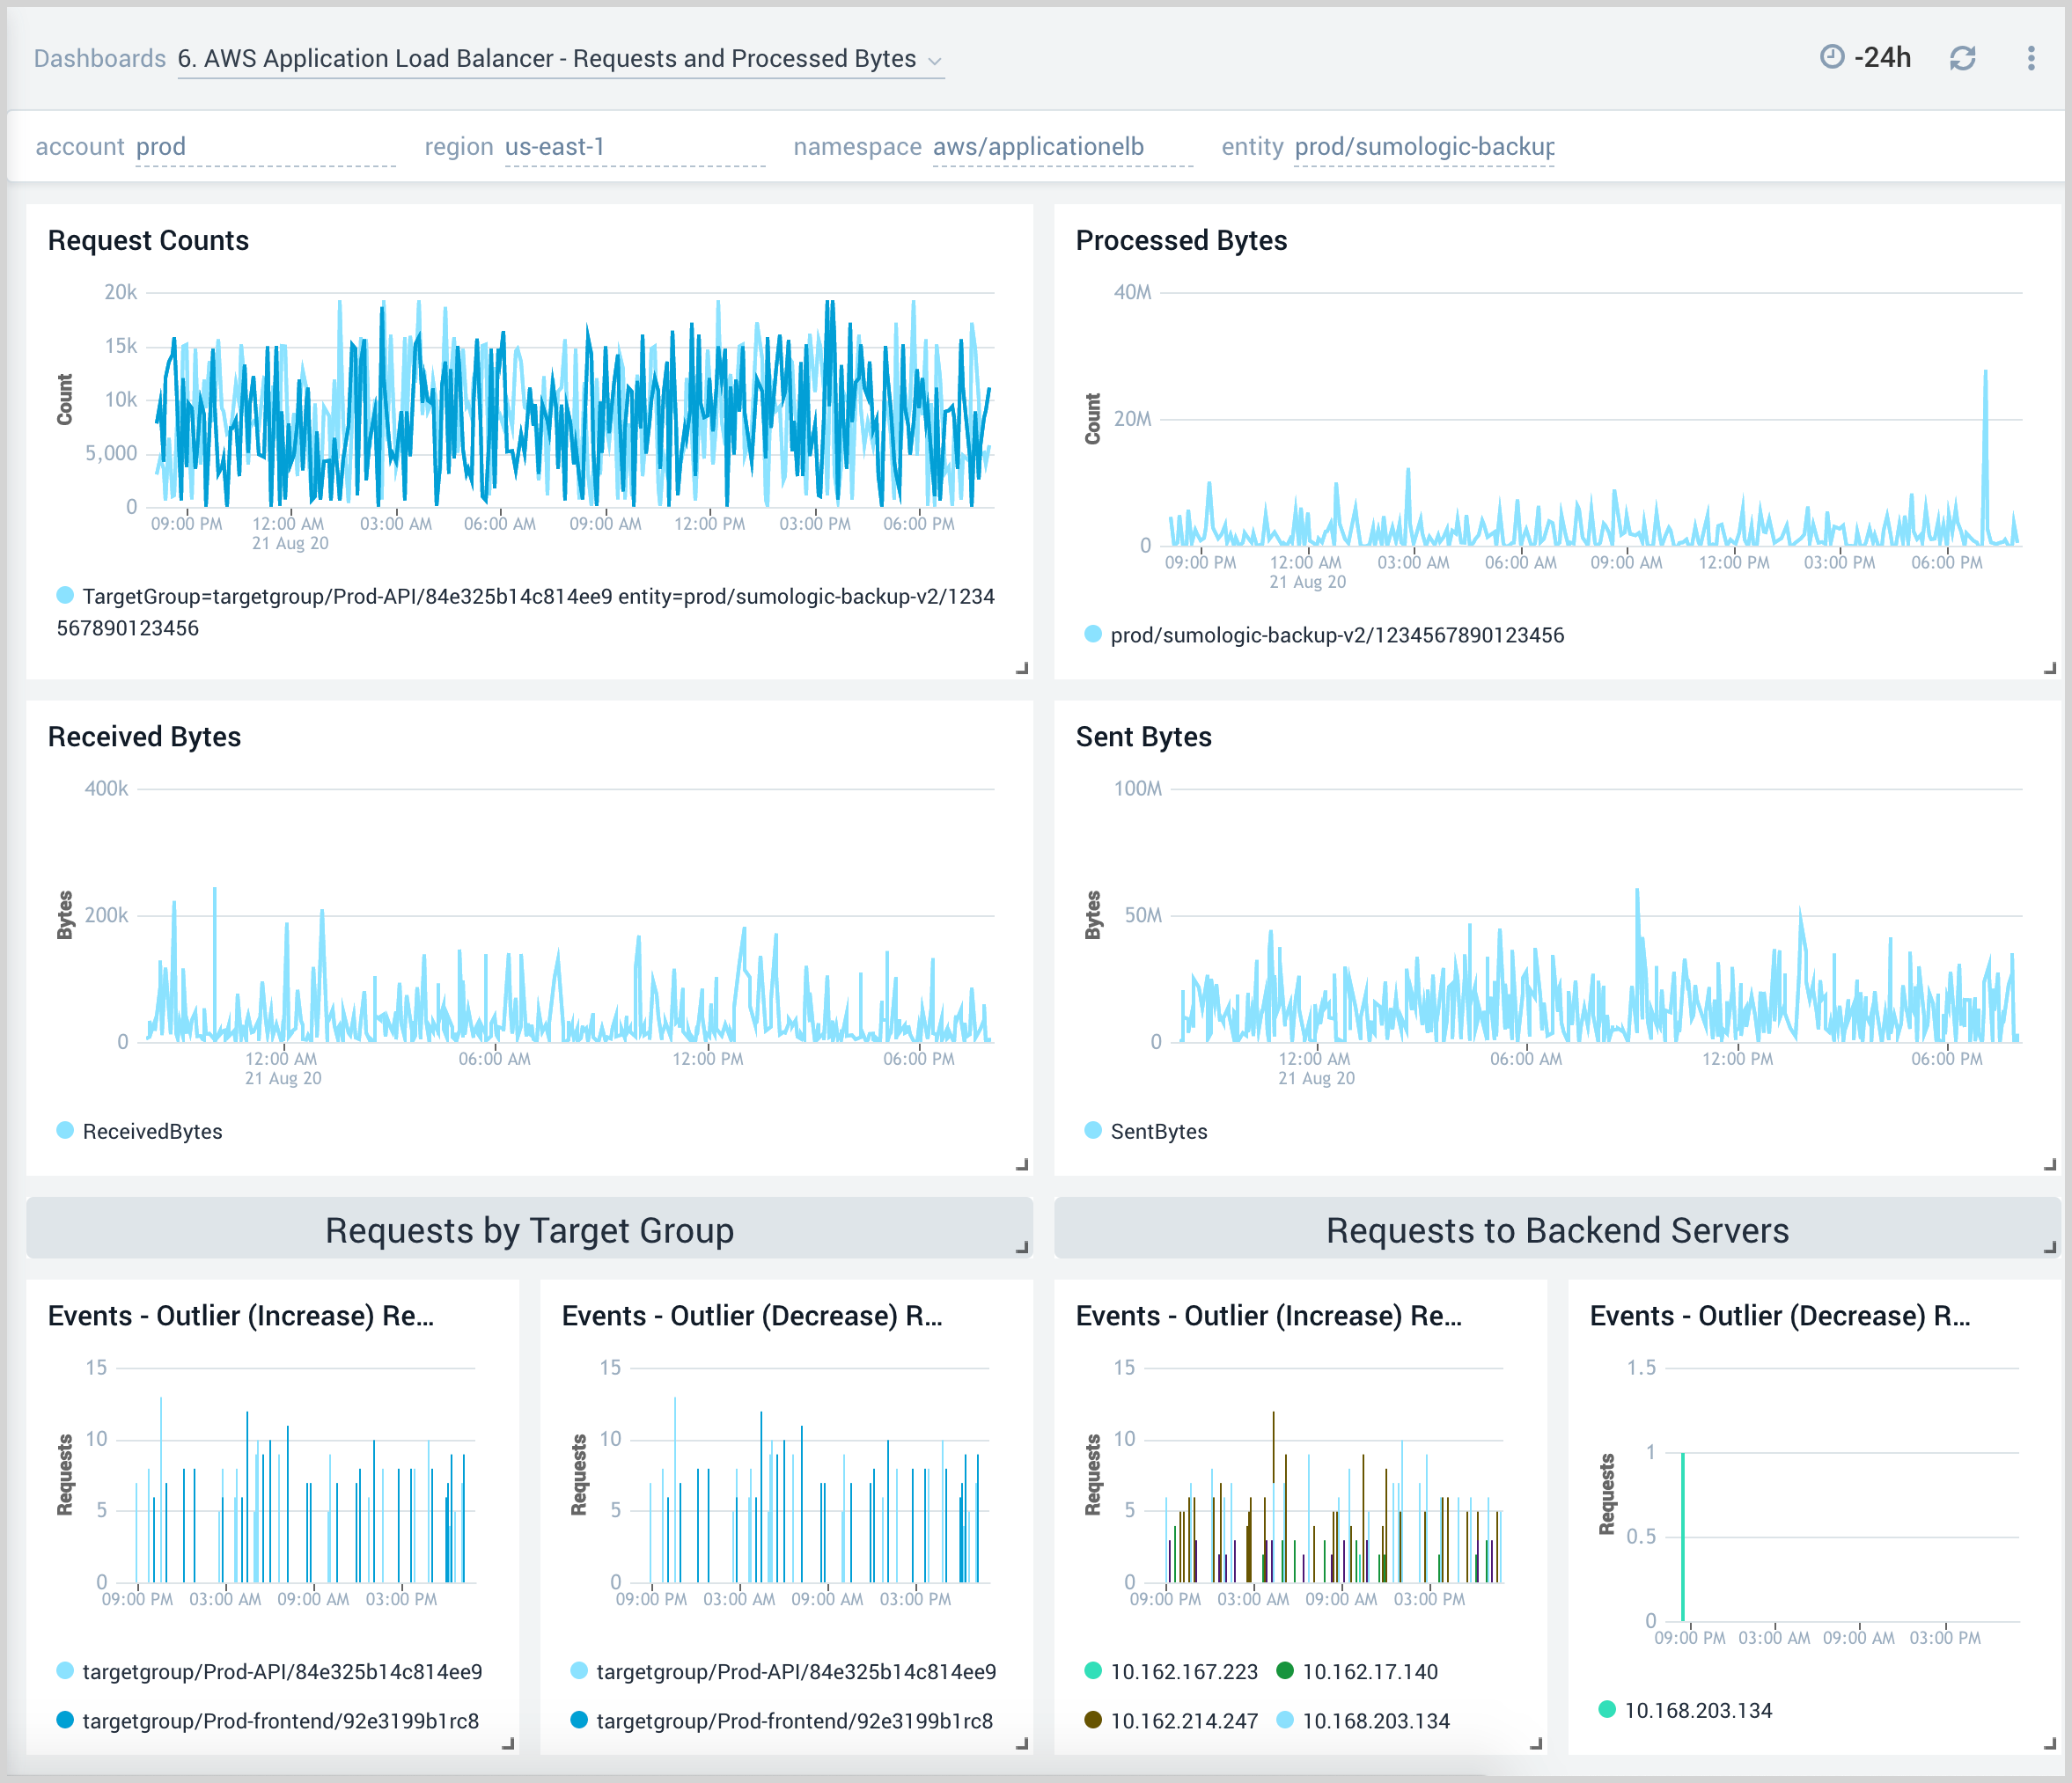
6. AWS Application Load Balancer - Requests and Processed Bytes
The AWS Application Load Balancer - Requests and Processed Bytes dashboard provides insights into client requests, network traffic, and processed data.
Use this dashboard to:
- Monitor client request load, network traffic, and processed bytes to determine how to best configure load balancers for optimal performance.
- Determine how to best allocate backend resources and target groups based on load.
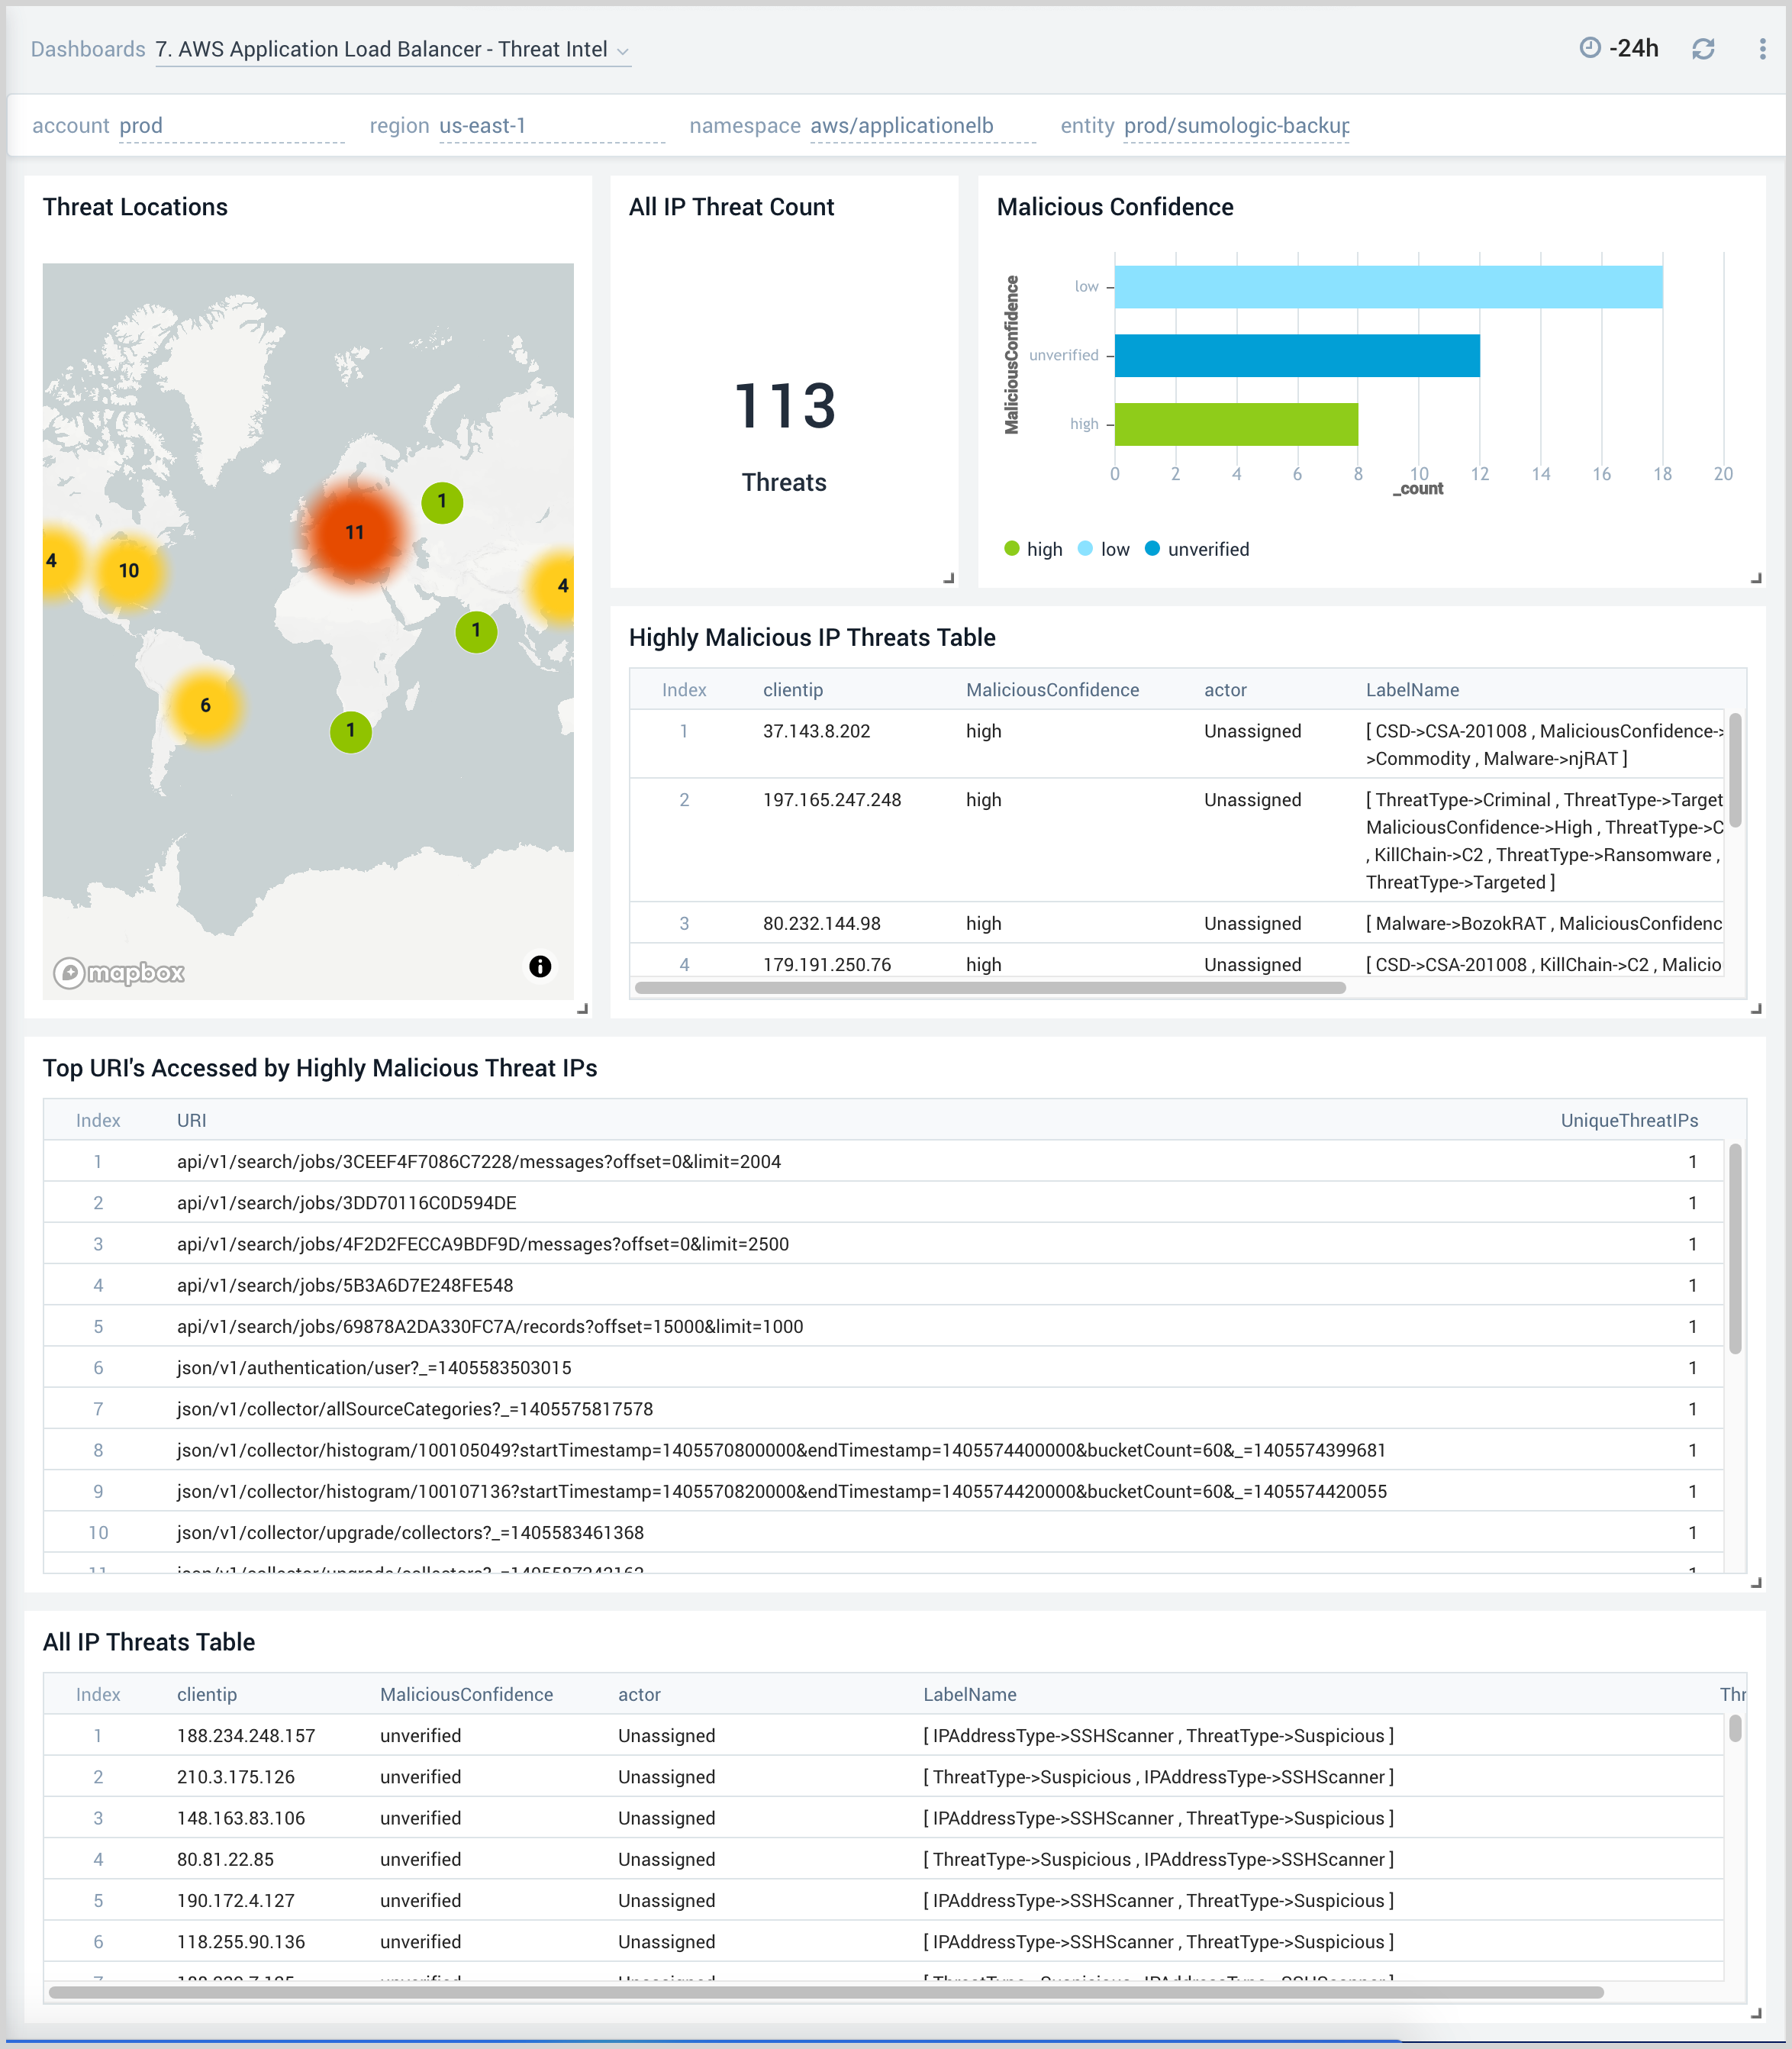
7. AWS Application Load Balancer - Threat Intel
The AWS Application Load Balancer - Threat Intel dashboard provides insights into incoming requests from malicious sources determined via Sumo Logic’s Threat Intel feature. Panels show detailed information on malicious IPs and the malicious confidence of each threat.
Use this dashboard to:
- Identify known malicious IPs that are access your load-balancers and use firewall access control lists to prevent them from sending you traffic going forward
- Monitor the malicious confidence level for all incoming malicious IP addresses the threats.