AWS DynamoDB
AWS DynamoDB is a fast and flexible NoSQL database service that provides consistent, single-digit millisecond latency at any scale.
The Sumo Logic app for AWS Observability DynamoDB is a unified logs and metrics (ULM) app that provides operational insights into DynamoDB instances across your infrastructure. Preconfigured app dashboards allow you to monitor key metrics, view the throttle events, errors, latency and help you plan the capacity of DynamoDB instances in your environment.
Log and metrics types
Sample log messages
{
  "eventVersion":"1.05",
  "userIdentity":{
     "type":"IAMUser",
     "principalId":"AIDAIBF5TU7HNYUE7V676",
     "arn":"arn:aws:iam::568388783903:user/ankit",
     "accountId":"568388783903",
     "accessKeyId":"ASIAI3Q5RU4FIZFHFJZA",
     "userName":"ankit",
     "sessionContext":{
        "attributes":{
           "mfaAuthenticated":"false",
           "creationDate":"2017-10-10T23:01:45+0000"
        }
     },
     "invokedBy":"signin.amazonaws.com"
  },
  "eventTime":"2017-10-10T23:01:45+0000",
  "eventSource":"dynamodb.amazonaws.com",
  "eventName":"DescribeTable",
  "awsRegion":"us-east-1",
  "sourceIPAddress":"38.99.50.98",
  "userAgent":"signin.amazonaws.com",
  "requestParameters":{
     "tableName":"users3"
  },
  "responseElements":null,
  "requestID":"AIFQQ1I27ASKDSAQ4L9L4DTQPVVV4KQNSO5AEMVJF66Q9ASUAAJG",
  "eventID":"f2bec08c-a56a-4f04-be92-0cac7aaabe9b",
  "eventType":"AwsApiCall",
  "apiVersion":"2012-08-10",
  "recipientAccountId":"568388783903"
}
Sample queries
_sourceCategory=Labs/AWS/DynamoDB account=* namespace=* "\"eventSource\":\"dynamodb.amazonaws.com\""
| json "eventName", "awsRegion", "requestParameters.tableName", "sourceIPAddress", "userIdentity.userName" as event_name, Region, entity, ip_address, user
| where Region matches "*" and tolowercase(entity) matches "*"
| where ip_address != "0.0.0.0" and ip_address != "127.0.0.1"
| count as ip_count by ip_address
| lookup type, actor, raw, threatlevel as malicious_confidence from sumo://threat/cs on threat=ip_address
| json field=raw "labels[*].name" as label_name nodrop
| replace(label_name, "\\/","->") as label_name
| replace(label_name, "\""," ") as label_name
| where  type="ip_address" and !isNull(malicious_confidence)
| if (isEmpty(actor), "Unassigned", actor) as Actor
| sum (ip_count) as threat_count
Viewing AWS DynamoDB dashboards
We highly recommend you view these dashboards in the AWS Observability view of our AWS Observability solution.
All dashboards have a set of filters that you can apply to the entire dashboard. Use these filters to drill down and examine the data to a granular level.
- You can change the time range for a dashboard or panel by selecting a predefined interval from a drop-down list, choosing a recently used time range, or specifying custom dates and times. Learn more.
- If required, configure the refresh interval rate for a dashboard or panel by clicking the drop-down arrow next to the refresh icon.
- Click the funnel icon in the dashboard top menu bar to filter dashboard with Template Variables.

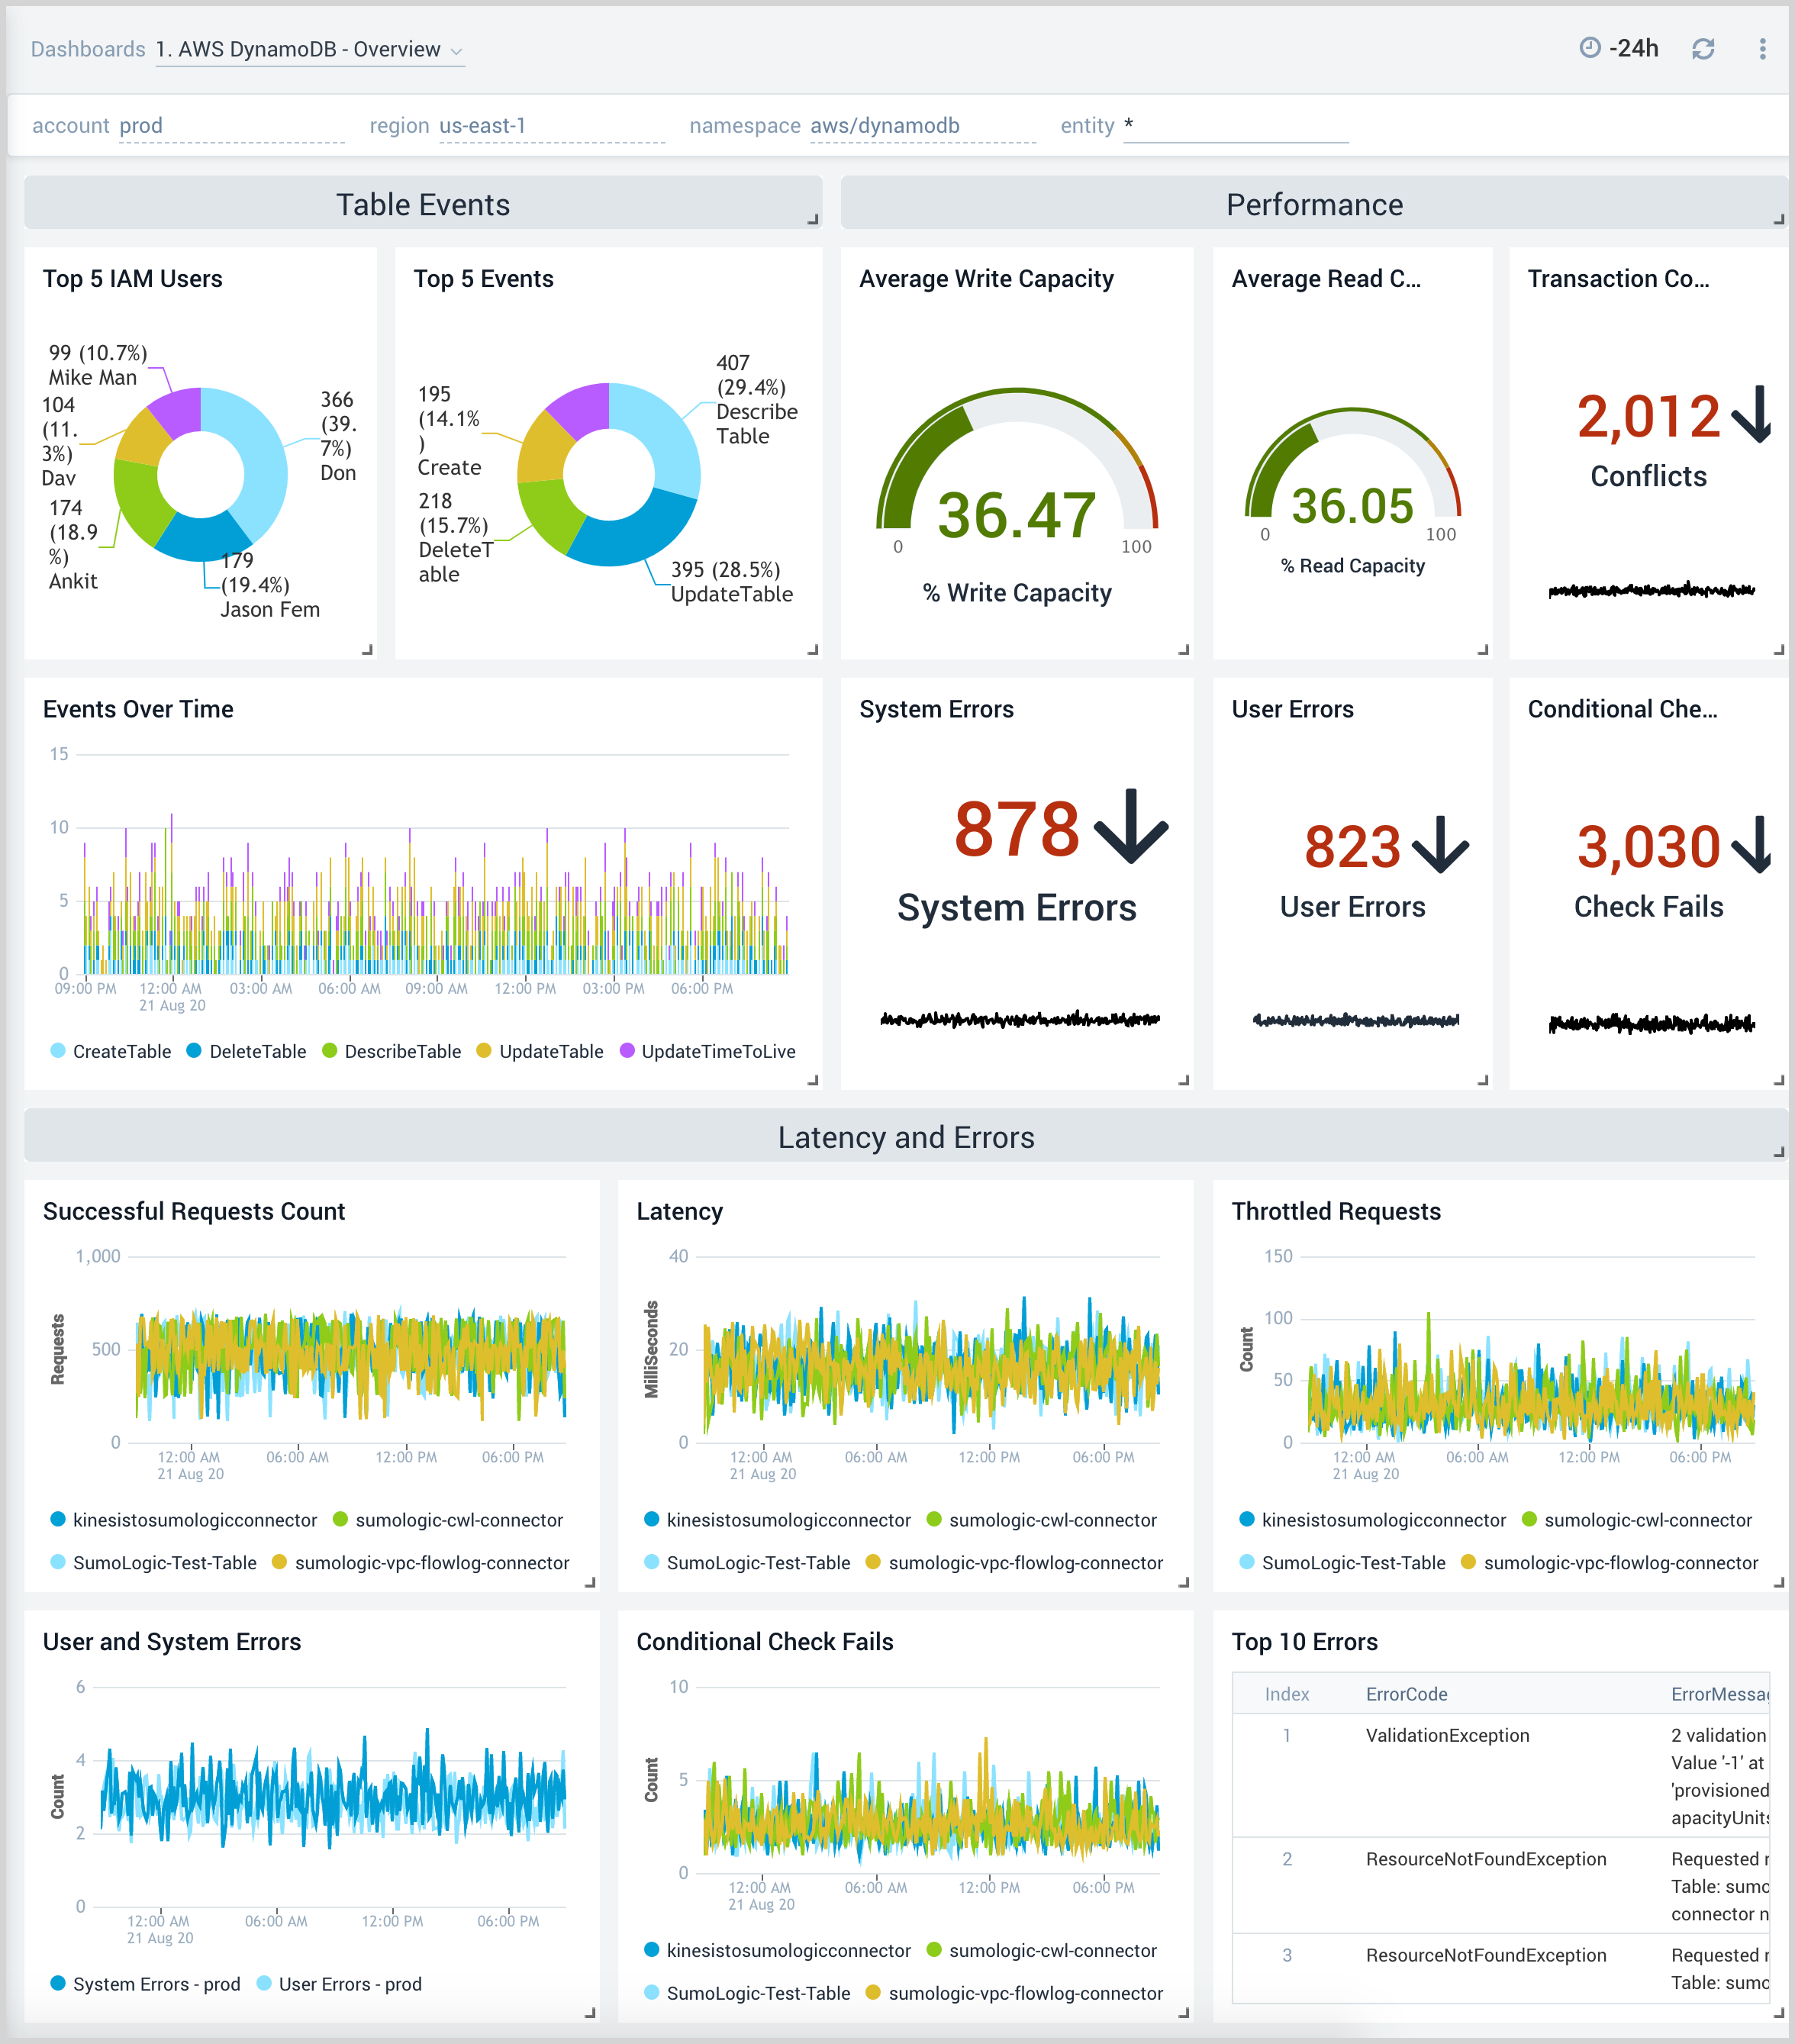
1. AWS DynamoDB - Overview
The AWS DynamoDB - Overview dashboard provides insights across your infrastructure for DynamoDB events, errors, requests, latency, and their trends.
Use this dashboard to:
- Monitor average read and write capacity percentages for DynamoDB instances.
- Quickly identify system errors, user errors, transaction conflicts, and conditional check fail requests for DynamoDB Monitor overall resource utilization of your DynamoDB instances.
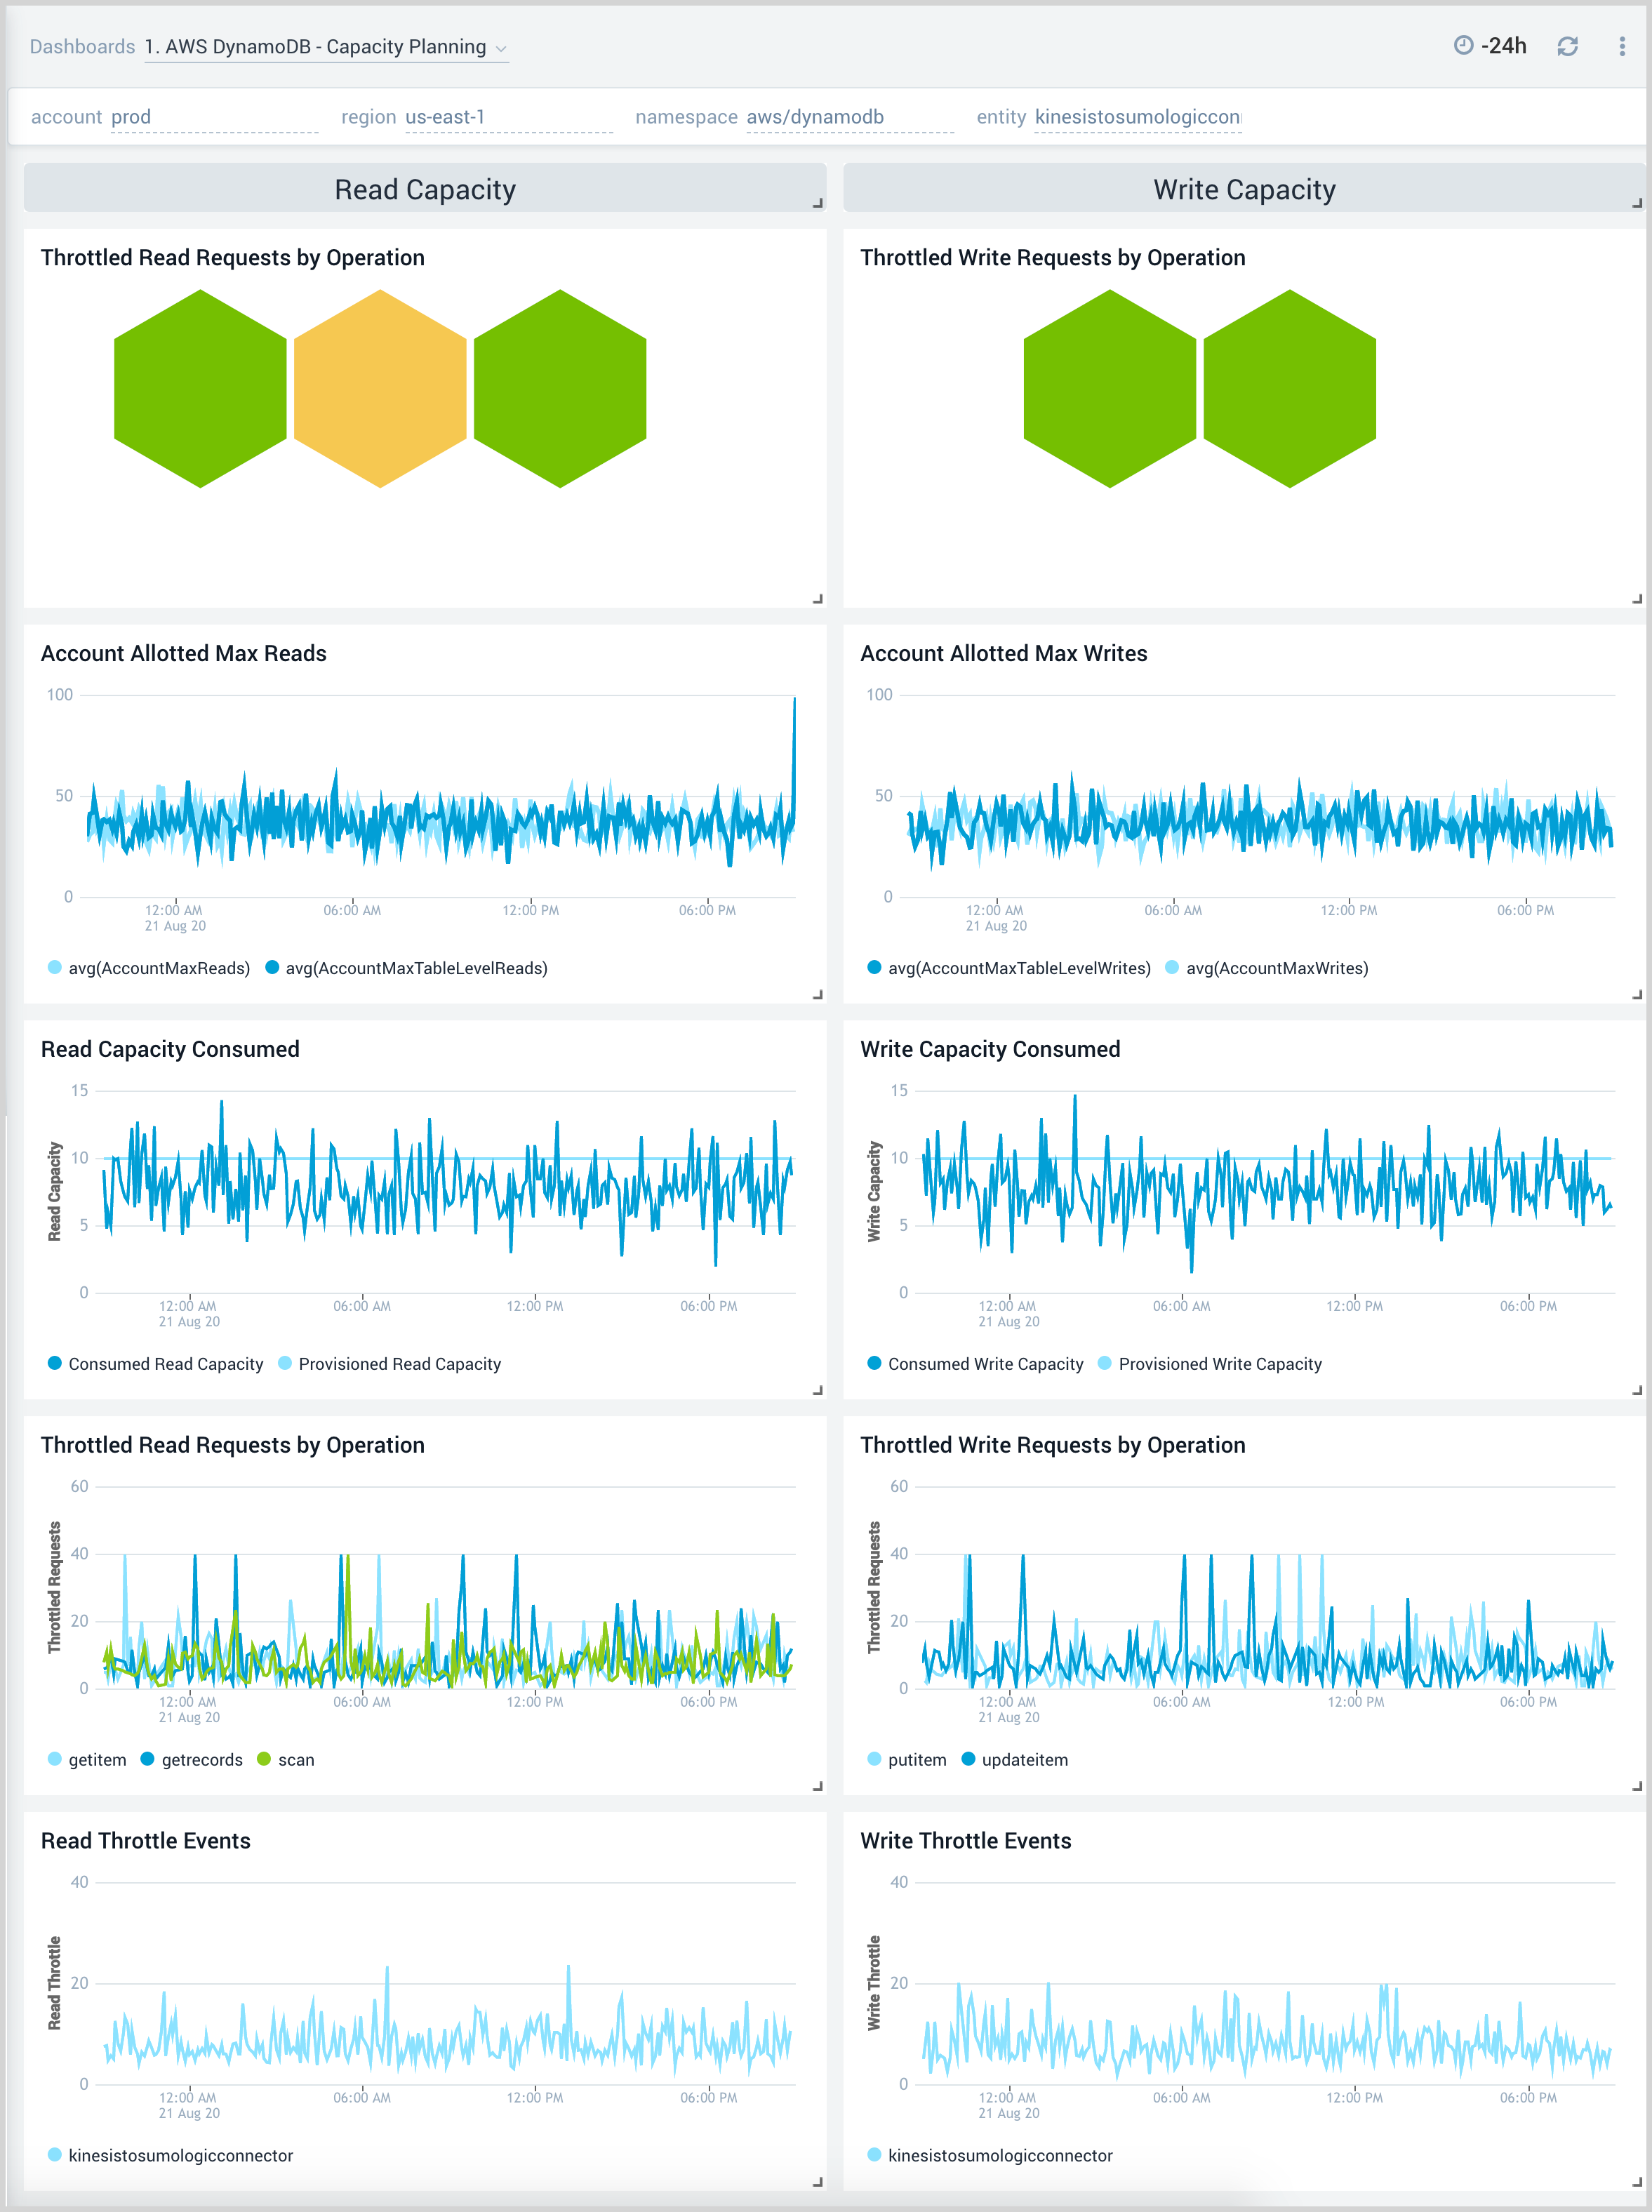
1. AWS DynamoDB - Capacity Planning
The AWS DynamoDB - Capacity Planning dashboard provides insights for DynamoDB read and write capacity across account allotments, consumed percentages, throttle events, and requests.
Use this dashboard to:
-
Monitor DynamoDB tables for throttled read and write requests, along with the type of operation.
-
Monitor AWS account level maximum allocations across read and write capacities.
-
Monitor resource utilization using trend panels for read and write capacity, throttled read and write requests, as well as read and write throttle events for DynamoDB throughout your infrastructure.
-
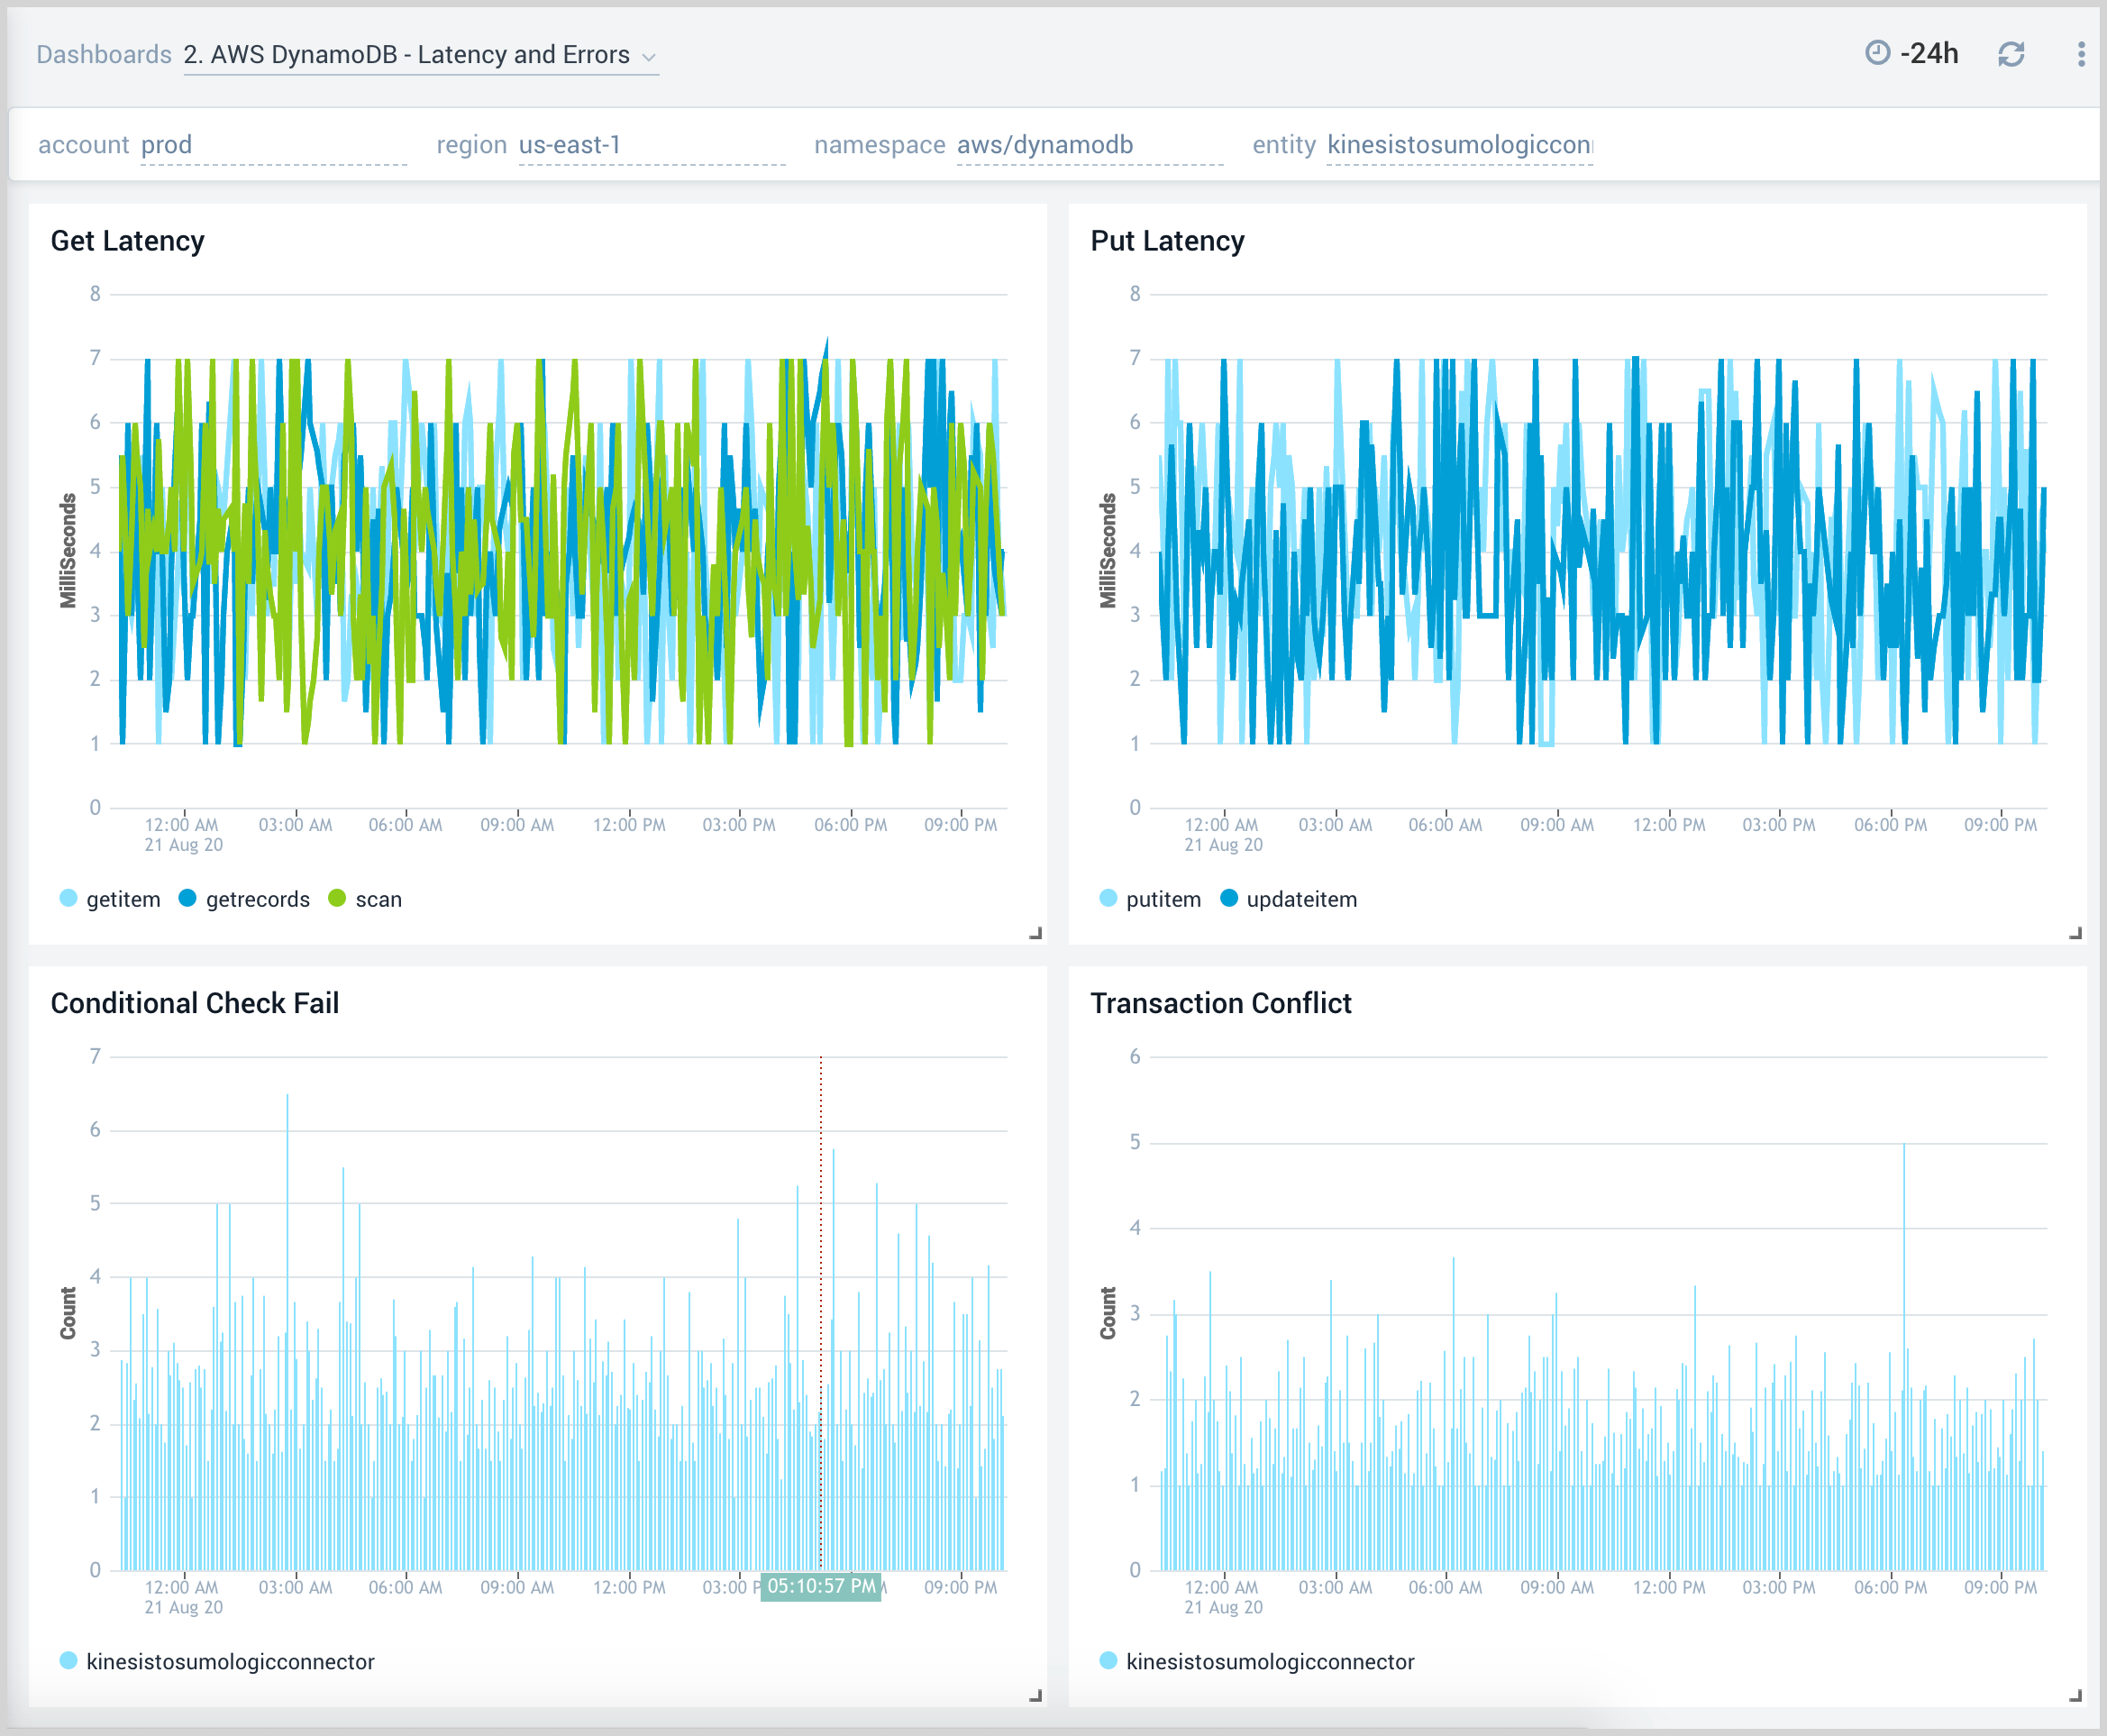
2. AWS DynamoDB - Latency and Errors
The AWS DynamoDB - Latency and Errors dashboard provides insights across your infrastructure for DynamoDB errors and latency including failed requests, and latency.
Use this dashboard to:
- Identify high get and put latencies for DynamoDB tables.
- Quickly identify the number of conditional checks fail, and transaction conflicts for DynamoDB.
- Monitor resource utilization using trend panels for latencies and errors for DynamoDB.
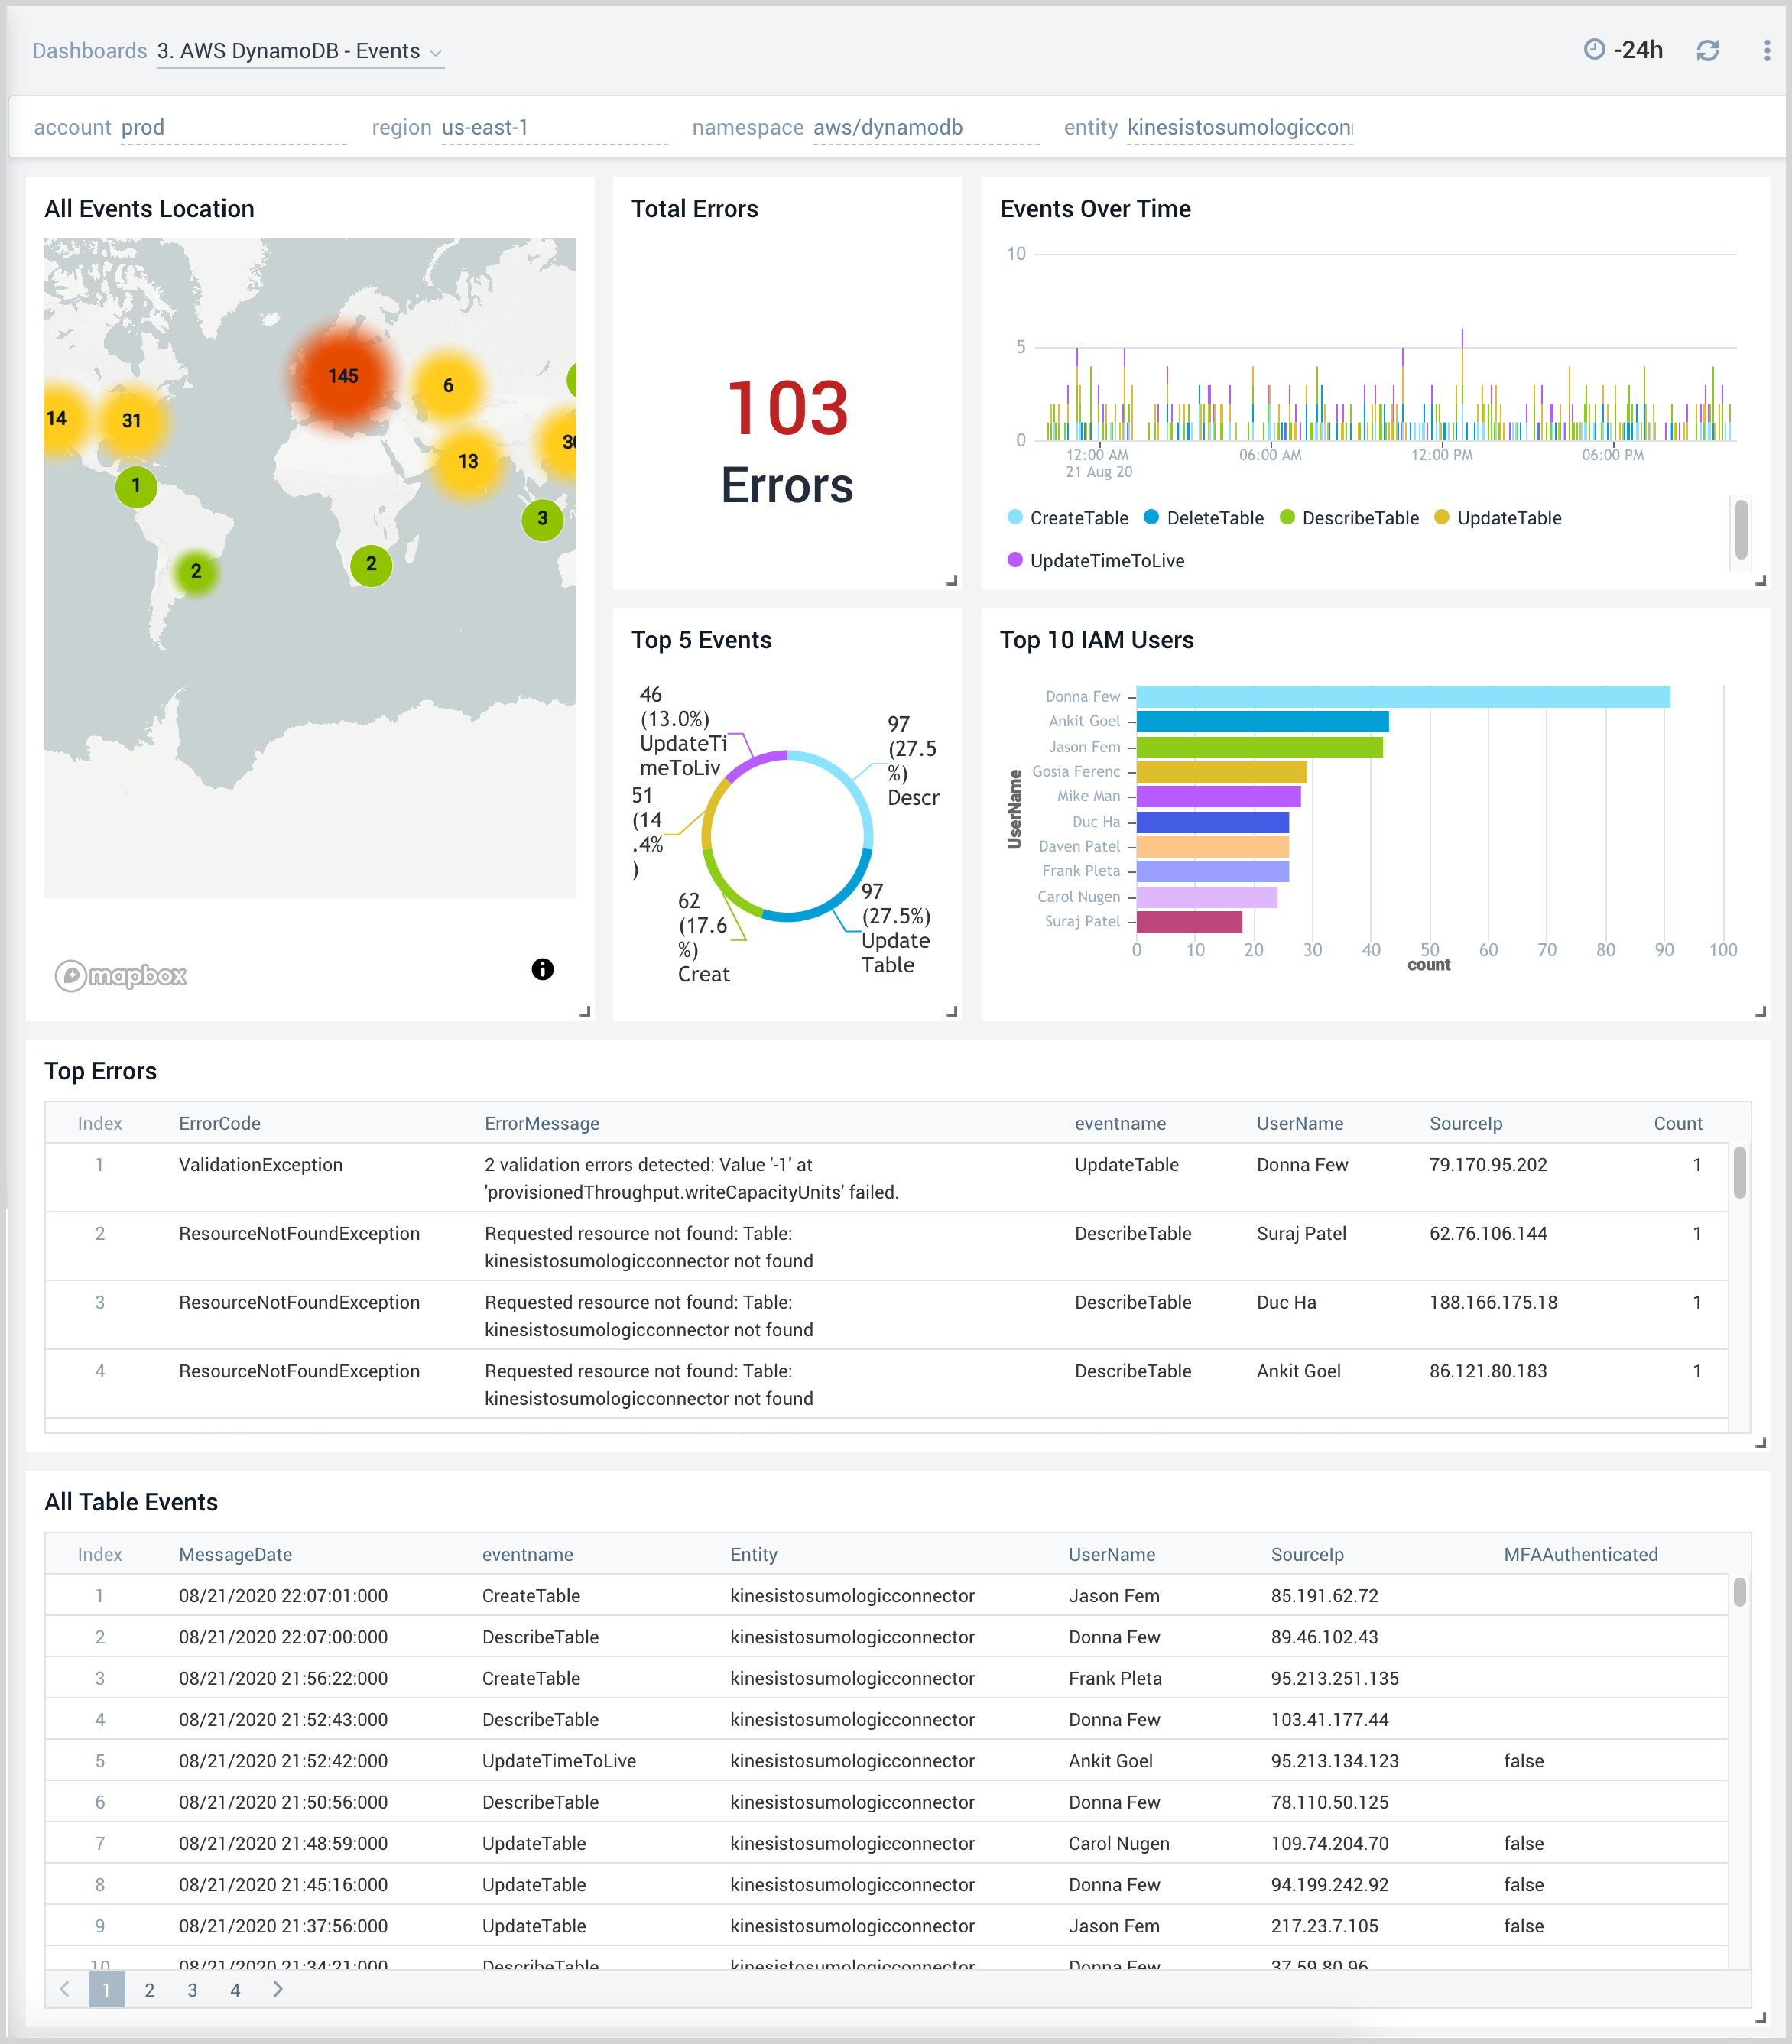
3. AWS DynamoDB - Events
The AWS DynamoDB - Events dashboard provides insights across your infrastructure for DynamoDB events including trends, users, errors, updates, creations, and deletions to tables.
Use this dashboard to:
- Monitor DynamoDB activities and ensure they are in line with expectations.
- Monitor different types of table events, such as create, update, and describe tables.
- Quickly identify the top DynamoDB related errors.
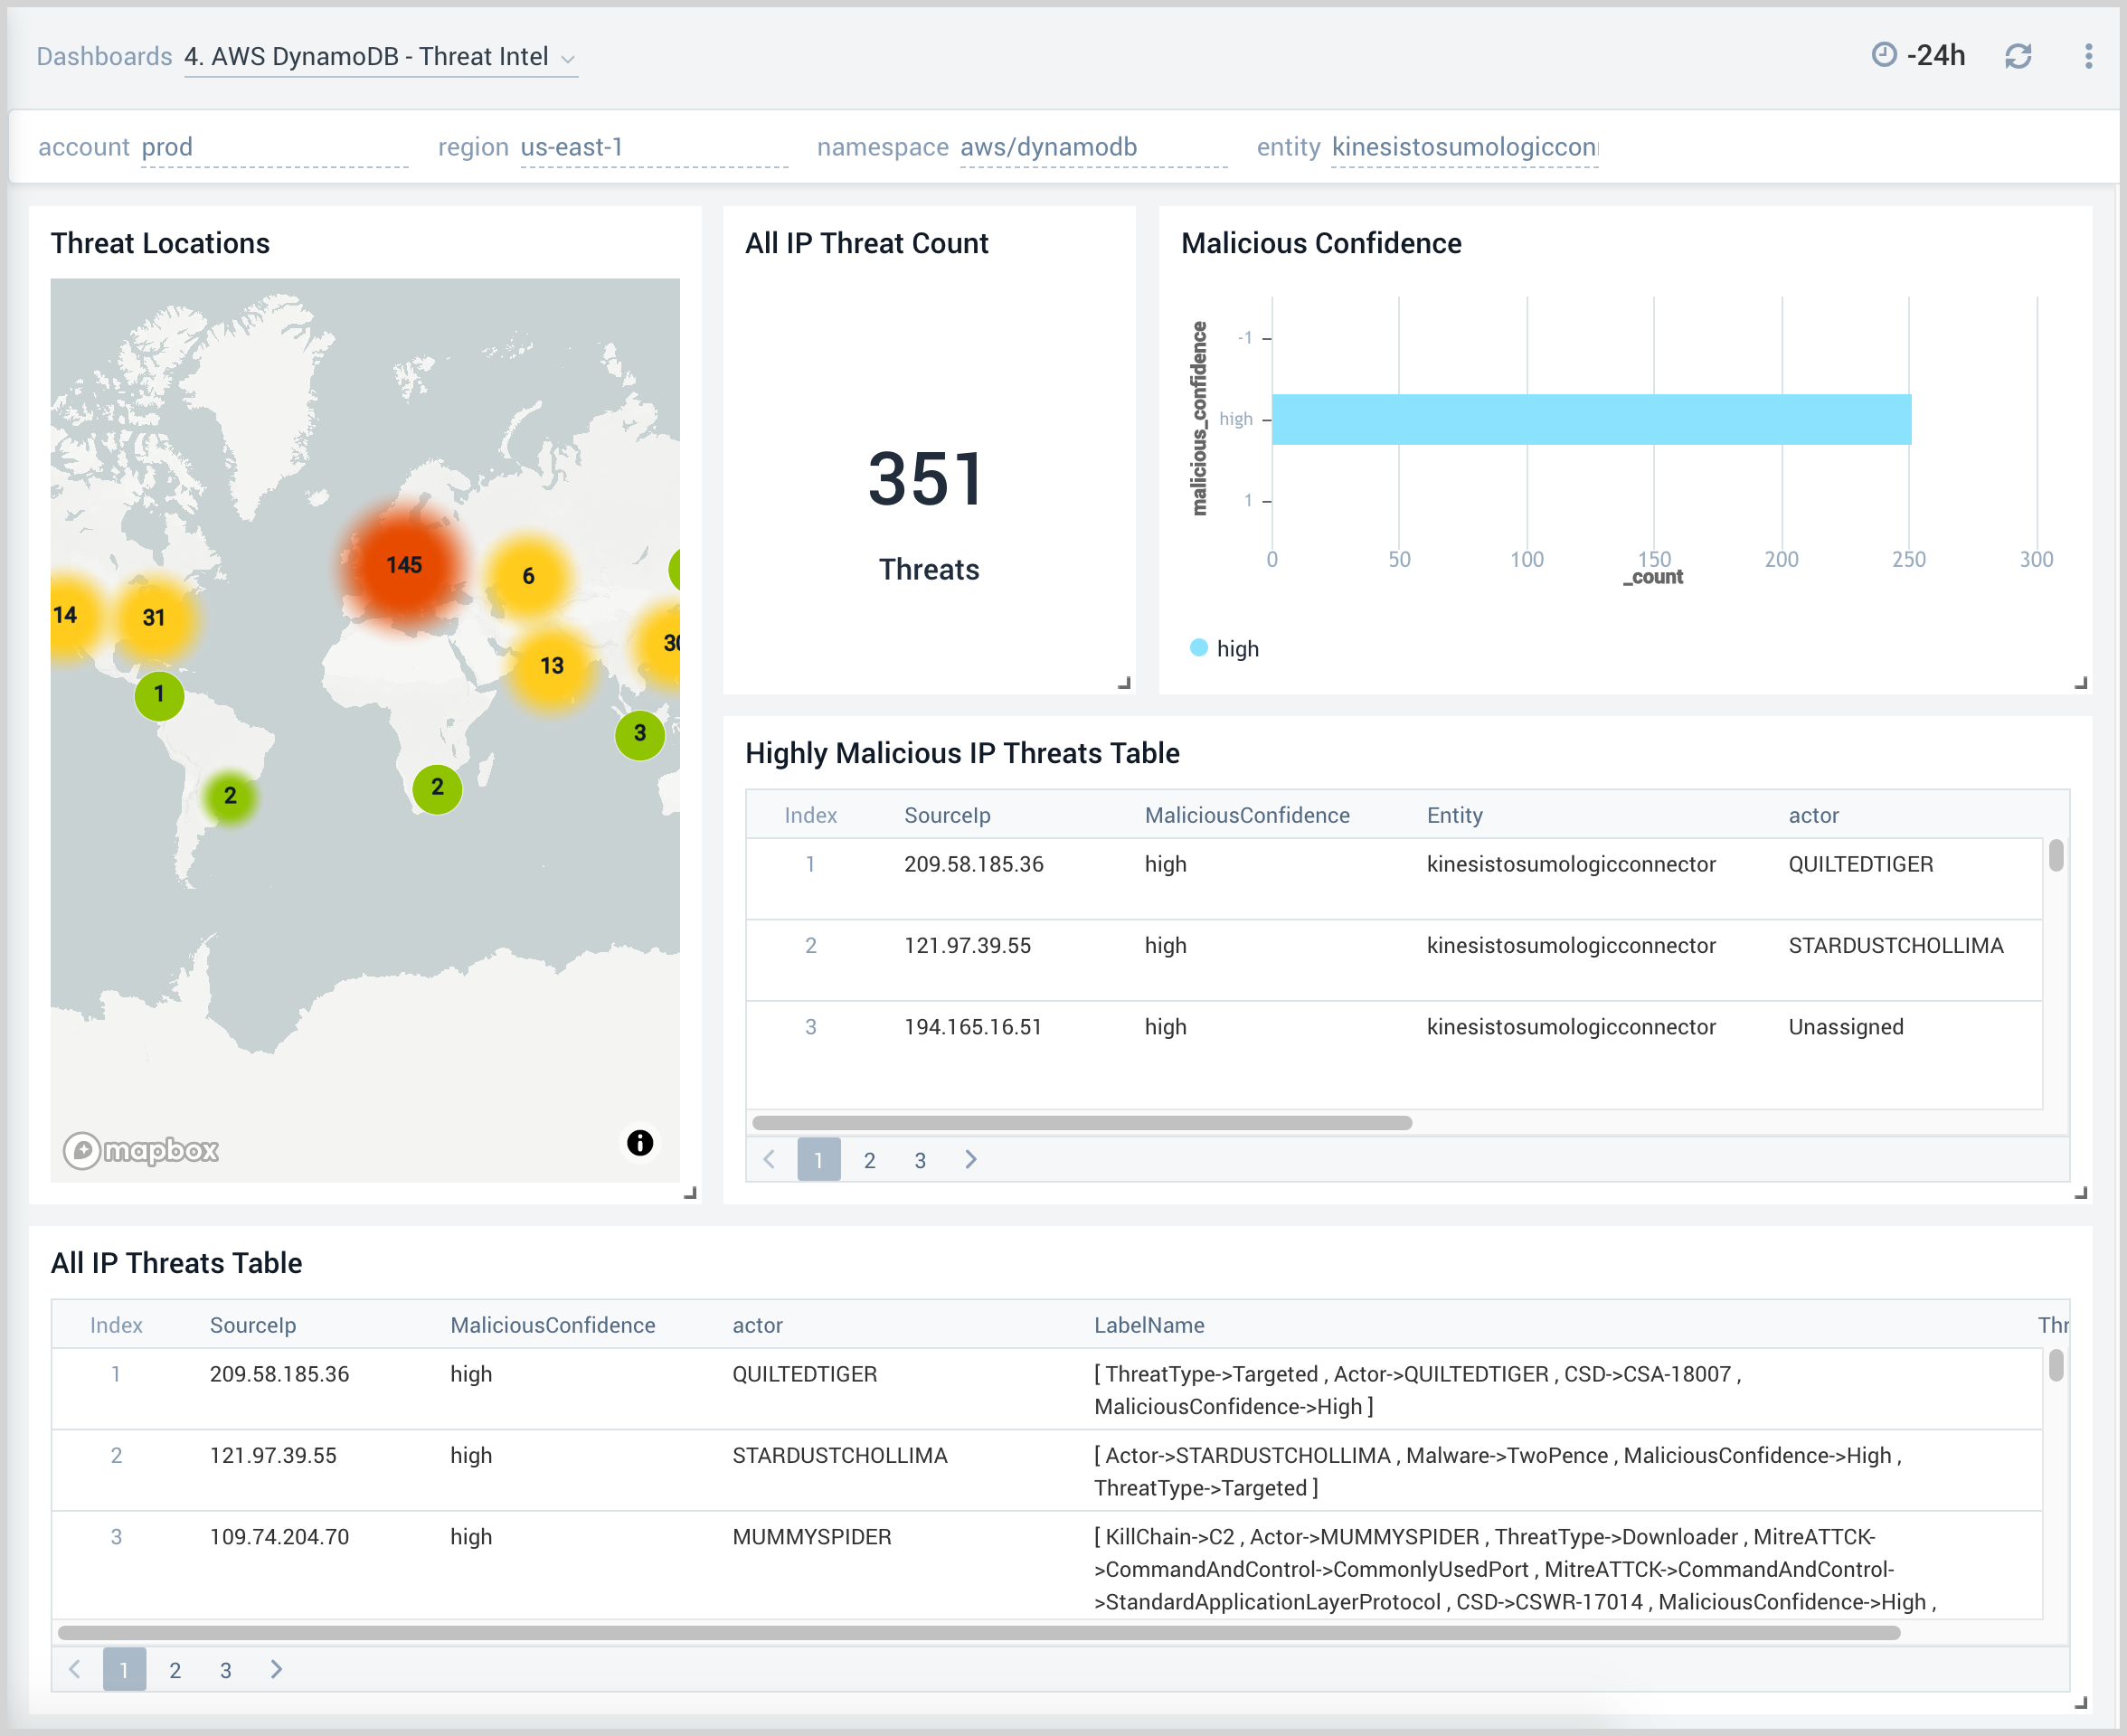
4. AWS DynamoDB - Threat Intel
The AWS DynamoDB - Threat Intel dashboard provides insights across your infrastructure for malicious requests to DynamoDB tables.
Use this dashboard to:
- Identify malicious IPs performing operations on DynamoDB tables across using Sumo Logic Threat Intel.