AWS Lambda
AWS Lambda allows you to run code without the burden of provisioning or managing servers. The AWS Lambda ULM App is a unified logs and metrics (ULM) app for monitoring operation and performance trends in the Lambda functions in your account.
The AWS Observability Lambda utilizes Lambda Logs and Metrics from CloudWatch, as well as CloudTrail Lambda Data Events. Preconfigured dashboards provide insights into executions, such as memory and duration usage by function versions or aliases, as well as performance metrics such as errors, throttles, invocations, and concurrent executions.
Log and metrics types
The AWS Lambda ULM app uses the following logs and metrics:
Sample log messages
{
	"id":"32563142671071560797760688825700039436306340248688066573",
	"timestamp":1511808906799,
	"message":"REPORT RequestId: cf75cfa3-fe16-11e5-9b16-e3e4c70845f2    Duration: 50.23 ms    Billed Duration:
100 ms     Memory Size: 128 MB    Max Memory Used: 24 MB ",
	"requestID":null,
	"logStream":"2017/11/27/[Prod]1108153ced144f8cbb161aef096218d1",
	"logGroup":"/aws/lambda/AWSlambda1"
}
{
   "eventVersion":"1.06",
   "userIdentity":{
      "type":"IAMUser",
      "principalId":"AIDAJ45Q7YFFAREXAMPLE",
      "arn":"arn:aws:iam::111111111111:user/duc",
      "accountId":"111111111111",
      "accessKeyId":"AKIAIOSFODNN7EXAMPLE",
      "userName":"duc"
   },
   "eventTime":"2017-11-27T19:05:20.524Z",
   "eventSource":"lambda.amazonaws.com",
   "eventName":"Invoke",
   "awsRegion":"us-west-1",
   "sourceIPAddress":"155.14.186.236",
   "userAgent":"aws-cli/1.11.129 Python/2.7.8 botocore/1.5.92",
   "requestParameters":{
      "invocationType":"RequestResponse",
      "functionName":"arn:aws:lambda:us-west-1:111111111111:function:function237",
      "clientContext":"ew0KICAiB99udGV6lGtleSIgOiAiY29udGV4dHZhbEXAMPLE=="
   },
   "responseElements":null,
   "additionalEventData":{
      "functionVersion":"arn:aws:lambda:us-west-1:111111111111:function:function238:$LATEST"
   },
   "requestID":"e38fb262-8f45-11e7-9845-e5f2f205b110",
   "eventID":"277a6881-66f4-4f3e-ade5-ba76255b7d93",
   "readOnly":false,
   "resources":[
      {
         "accountId":"111111111111",
         "type":"AWS::Lambda::Function",
         "ARN":"arn:aws:lambda:us-west-1:111111111111:function:function239"
      }
   ],
   "eventType":"AwsApiCall",
   "managementEvent":false,
   "recipientAccountId":"111111111111"
}
Sample queries
_sourceCategory=Labs/AWS/Lambda
| json "message"
| json "logStream", "logGroup"
// | _sourceName as logStream | _sourceHost as logGroup
| parse regex field=message "REPORT\s+RequestId:\s+(?[^\s]+)\s+Duration:\s+(?[^\s]+)\s+ms\s+Billed Duration:\s+(?[^\s]+)\s+ms\s+Memory\s+Size:\s+(?[^\s]+)\s+MB\s+Max\s+Memory\s+Used:\s+(?[^\s]+)\s+MB"
| parse field=loggroup "/aws/lambda/*" as functionname
| where account matches "*" and region matches "*" and namespace matches "aws/lambda" and functionname matches "*"
| sum(Duration) as DurationSum, avg(Duration) as DurationAvg, count as frequency by functionname
| top 10 functionname by DurationAvg, DurationSum, frequency
Viewing AWS Lambda dashboards
We highly recommend you view these dashboards in the AWS Observability view of the AWS Observability solution.
All dashboards have a set of filters that you can apply to the entire dashboard. Use these filters to drill down and examine the data to a granular level.
- You can change the time range for a dashboard or panel by selecting a predefined interval from a drop-down list, choosing a recently used time range, or specifying custom dates and times. Learn more.
- If required, configure the refresh interval rate for a dashboard or panel by clicking the drop-down arrow next to the refresh icon.
- Click the funnel icon in the dashboard top menu bar to filter dashboard with Template Variables.
About measurements
This section explains some of the measurements and calculations underlying the information presented in dashboard panels.
- Duration (ms). This represents the function duration as the elapsed wall clock time, in milliseconds, from when a function starts executing as a result of an invocation to when it stops executing. Function duration is a measure of performance. Billed Duration for an invocation is the value of duration rounded up to the nearest 100 milliseconds.
- Memory Size. The amount of memory allocated for a function.
- Max Memory (MB) Used. The amount of memory used by a function, in MBs. This is a measure of performance.
- Compute Usage (GBs). This is a product of Memory Size and Billed Duration (Memory Size * Billed Duration).
- Billed Compute. memory configured on the function (in GB) x duration of the request (in seconds). In the actual query, Sumo Logic converts MB to GB and milliseconds to seconds to get the real billing numbers used. The actual cost varies by customer. This measurement is used to measure cost.
- Unused Memory. This is Memory Size - Max Memory Used = Unused Memory. Because you are billed based on Memory Size (which you allocate), this is an indicator of not allocating appropriately.
- IteratorAge. This AWS Lambda CloudWatch metric is emitted for stream-based invocations (functions triggered by an Amazon DynamoDB stream or Kinesis stream). Measures, in milliseconds, the age of the last record for each batch of records processed. Age is the difference between the time Lambda received the batch, and the time the last record in the batch was written to the stream.
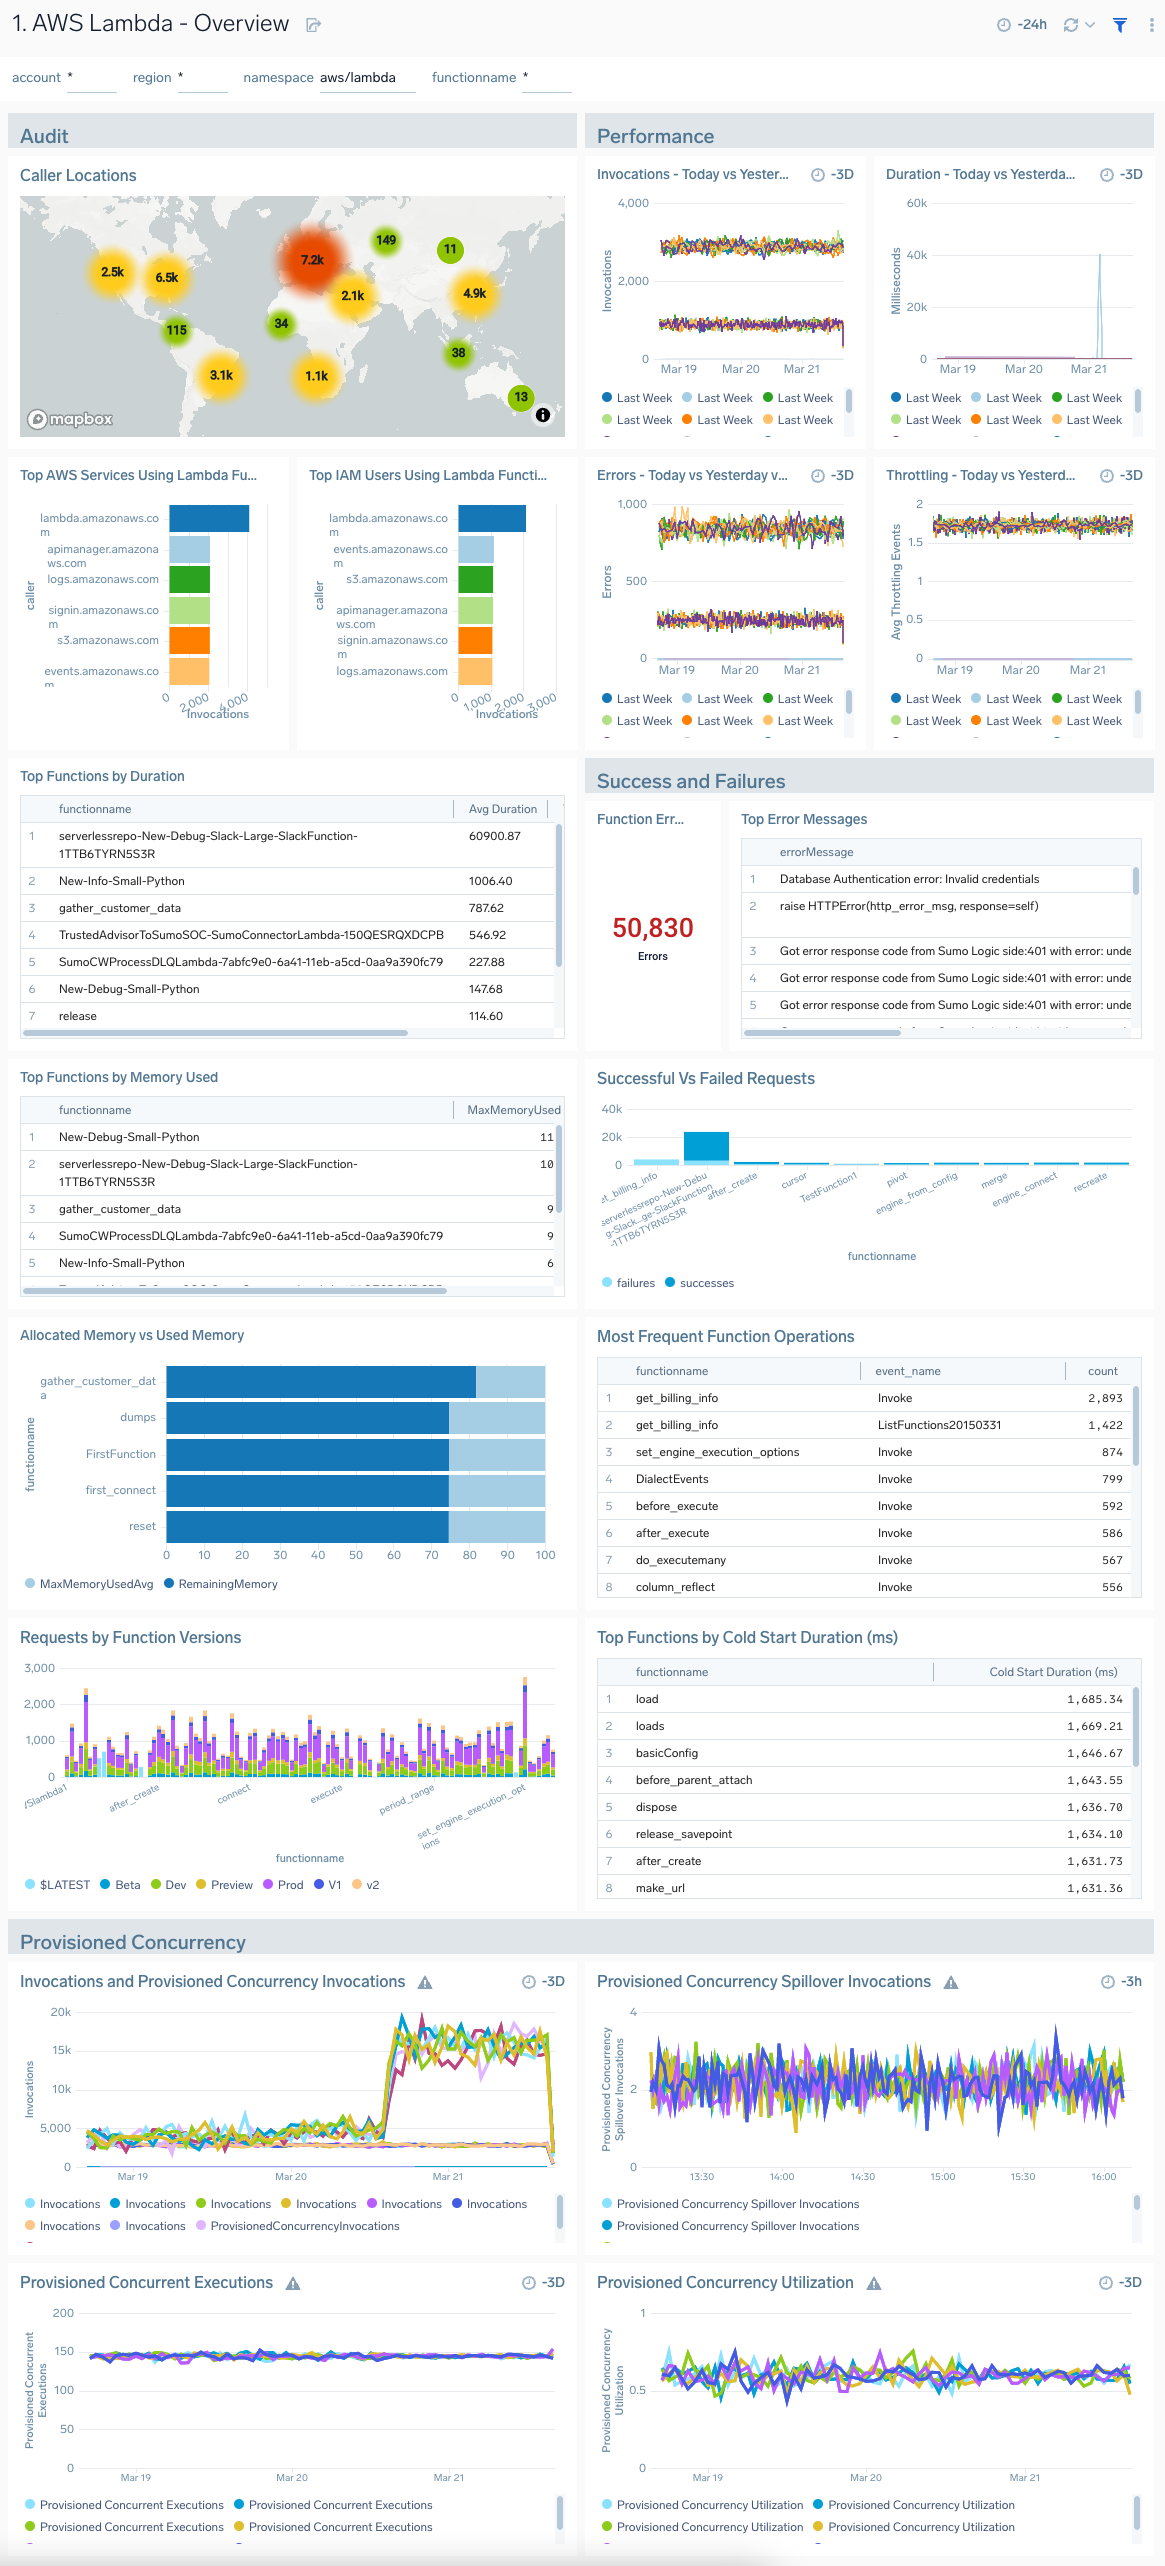
AWS Lambda - Overview
The AWS Lambda - Overview dashboard provides intuitive insights with CloudWatch Lambda metrics, CloudTrail audit logs for Lambda, as well as Lambda logs to give you an at-a-glance view of actions, performance, and health of your AWS Lambda functions.
Use this dashboard to:
- Monitor how often your Lambda functions are being invoked across and ensure they are as per expectations.
- Identify and resolve the top error messages across your Lambda functions.
- Quickly identify top error messages, slow-performing Lambda functions, and functions using the most resources.
- Monitor provisioned concurrency invocations, executions, and utilization.
- Identify and validate the top IAM Users and AWS services invoke AWS Lambda functions.
- Monitor cold start duration for lambda functions.
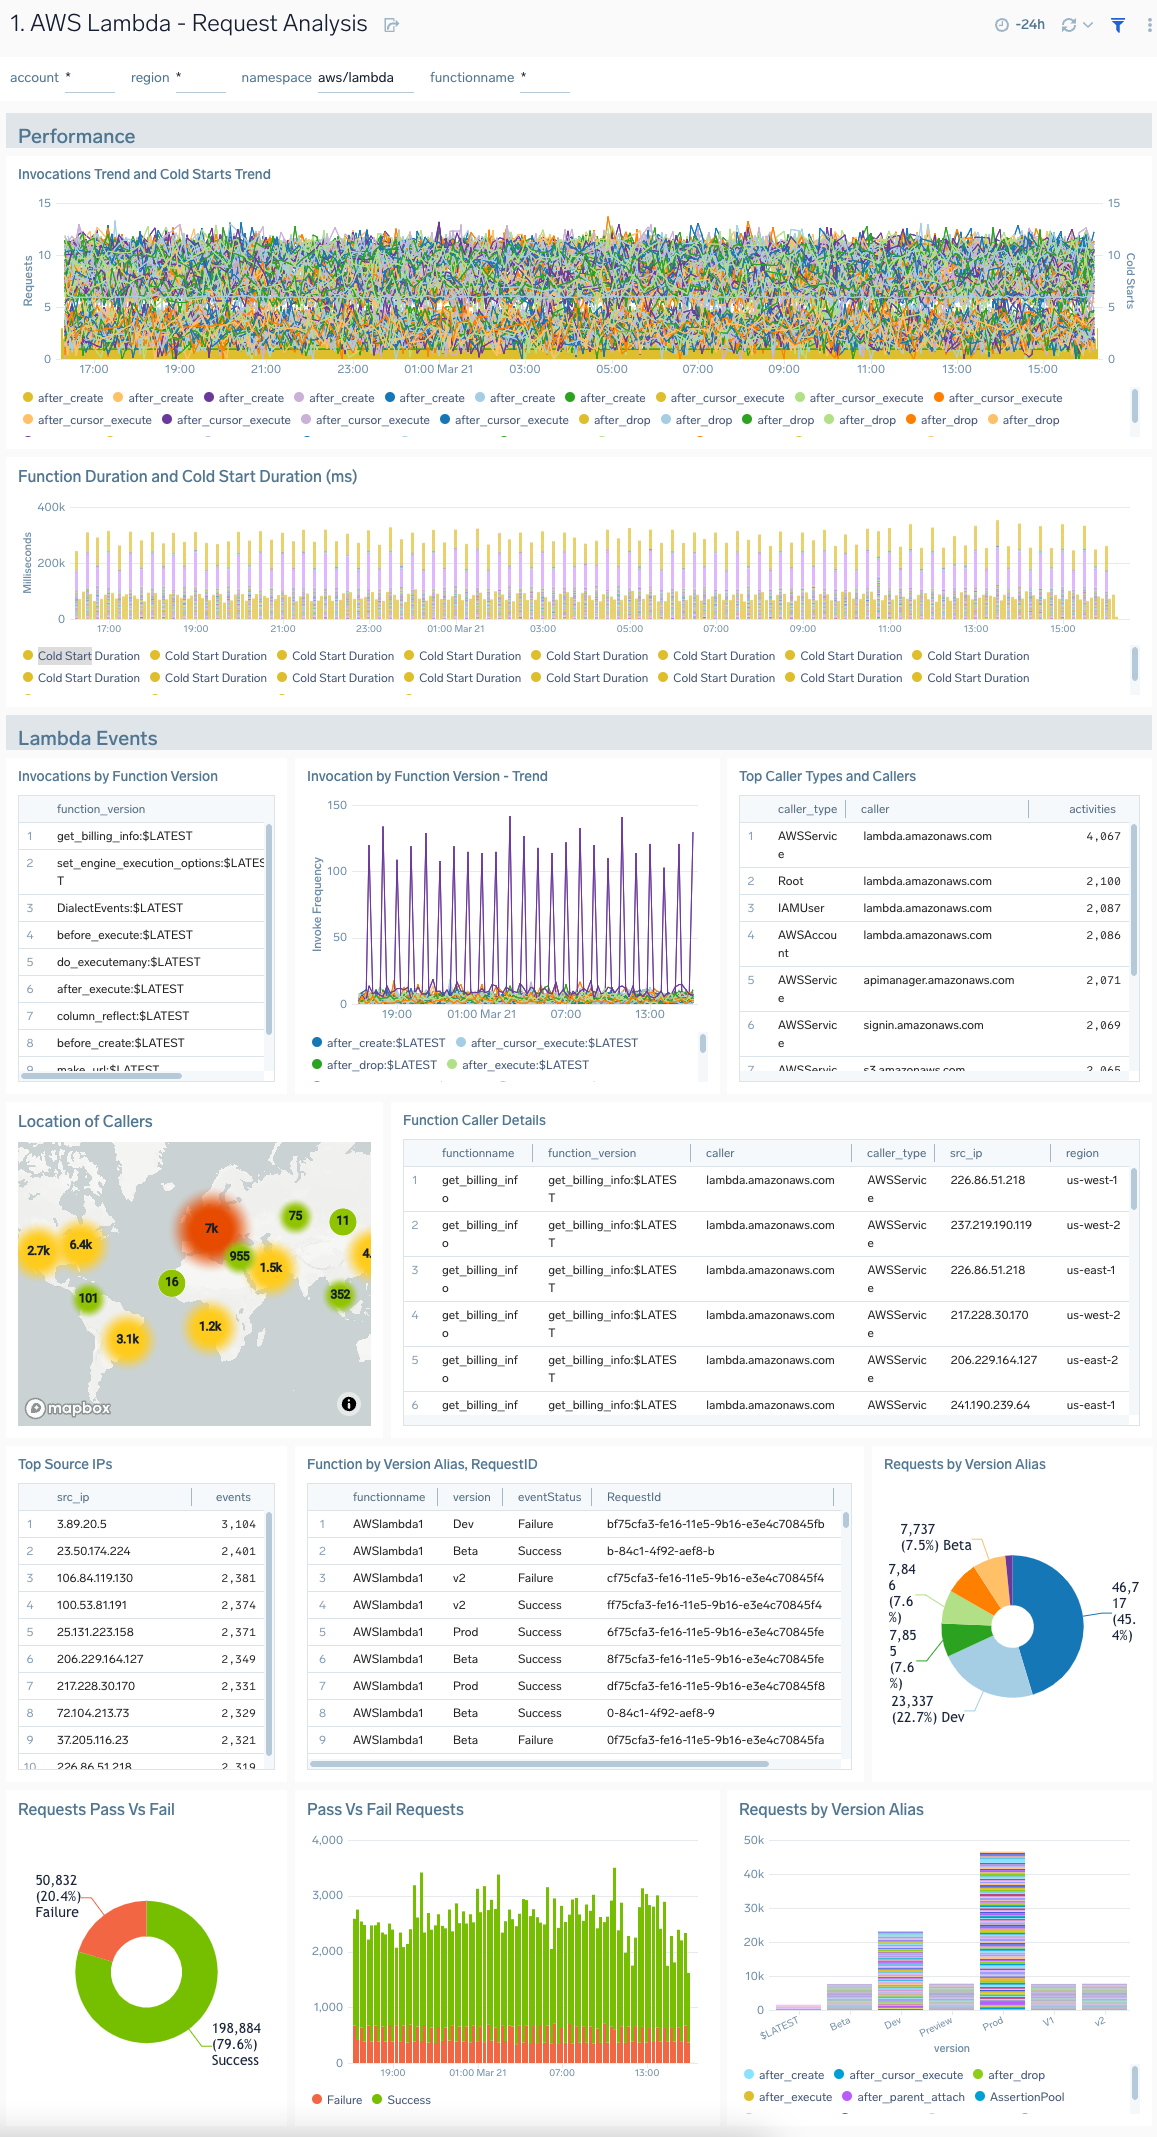
1. AWS Lambda - Request Analysis
The AWS Lambda - Request Analysis dashboard provides deeper insights into the invocations and performance of your AWS Lambda functions.
Use this dashboard to:
- Monitor the invocation of an AWS Lambda function against all other functions.
- Identify and top callers, top caller types, and top source IPs.
- Monitor failed and successful requests by function name to quickly identify when failed requests are occurring.
- Troubleshoot and investigate individual function requests.
- Monitor cold start duration for lambda functions.
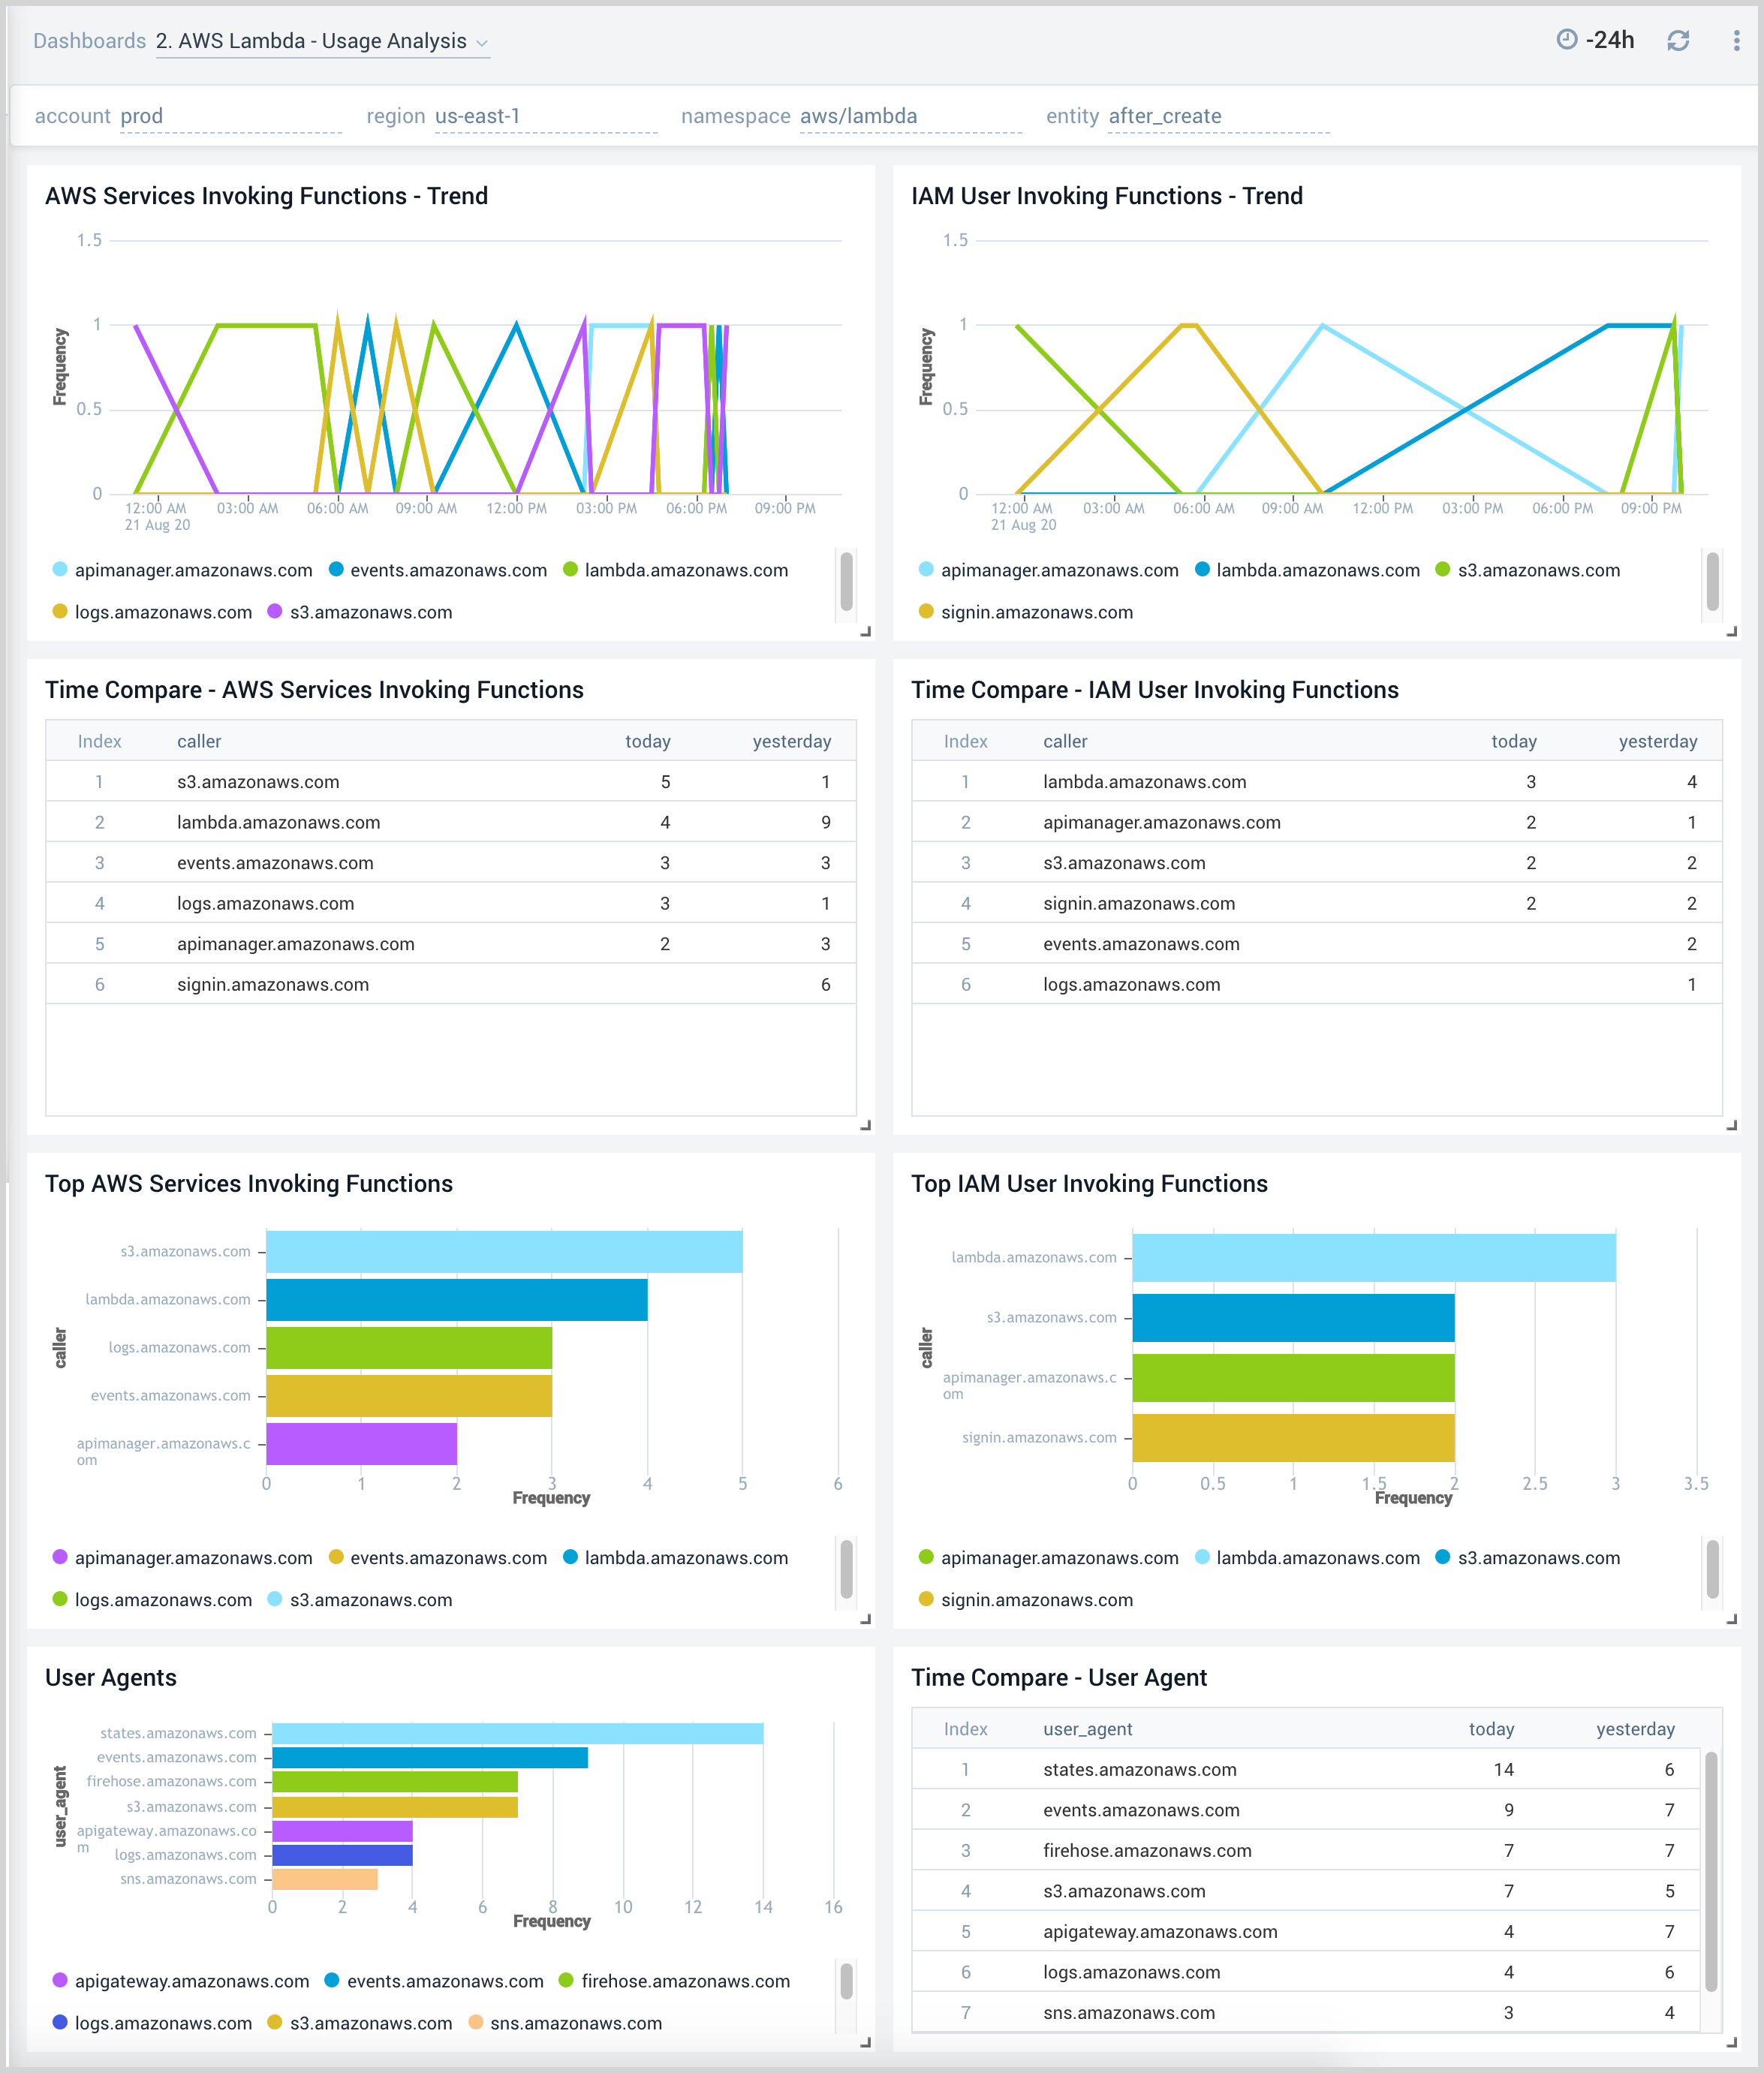
2. AWS Lambda - Usage Analysis
AWS Lambda - Usage Analysis dashboard provides insights into function usage by AWS services, user agents, and IAM users.
Use this dashboard to:
- Audit, monitor, and compare the functions used in your serverless infrastructure.
- Monitor which AWS services and IAM users are calling individual AWS Lambda functions.
- Monitor which user agents are being used in Lambda function calls.
- Compare data across time to identify any unusual trends.
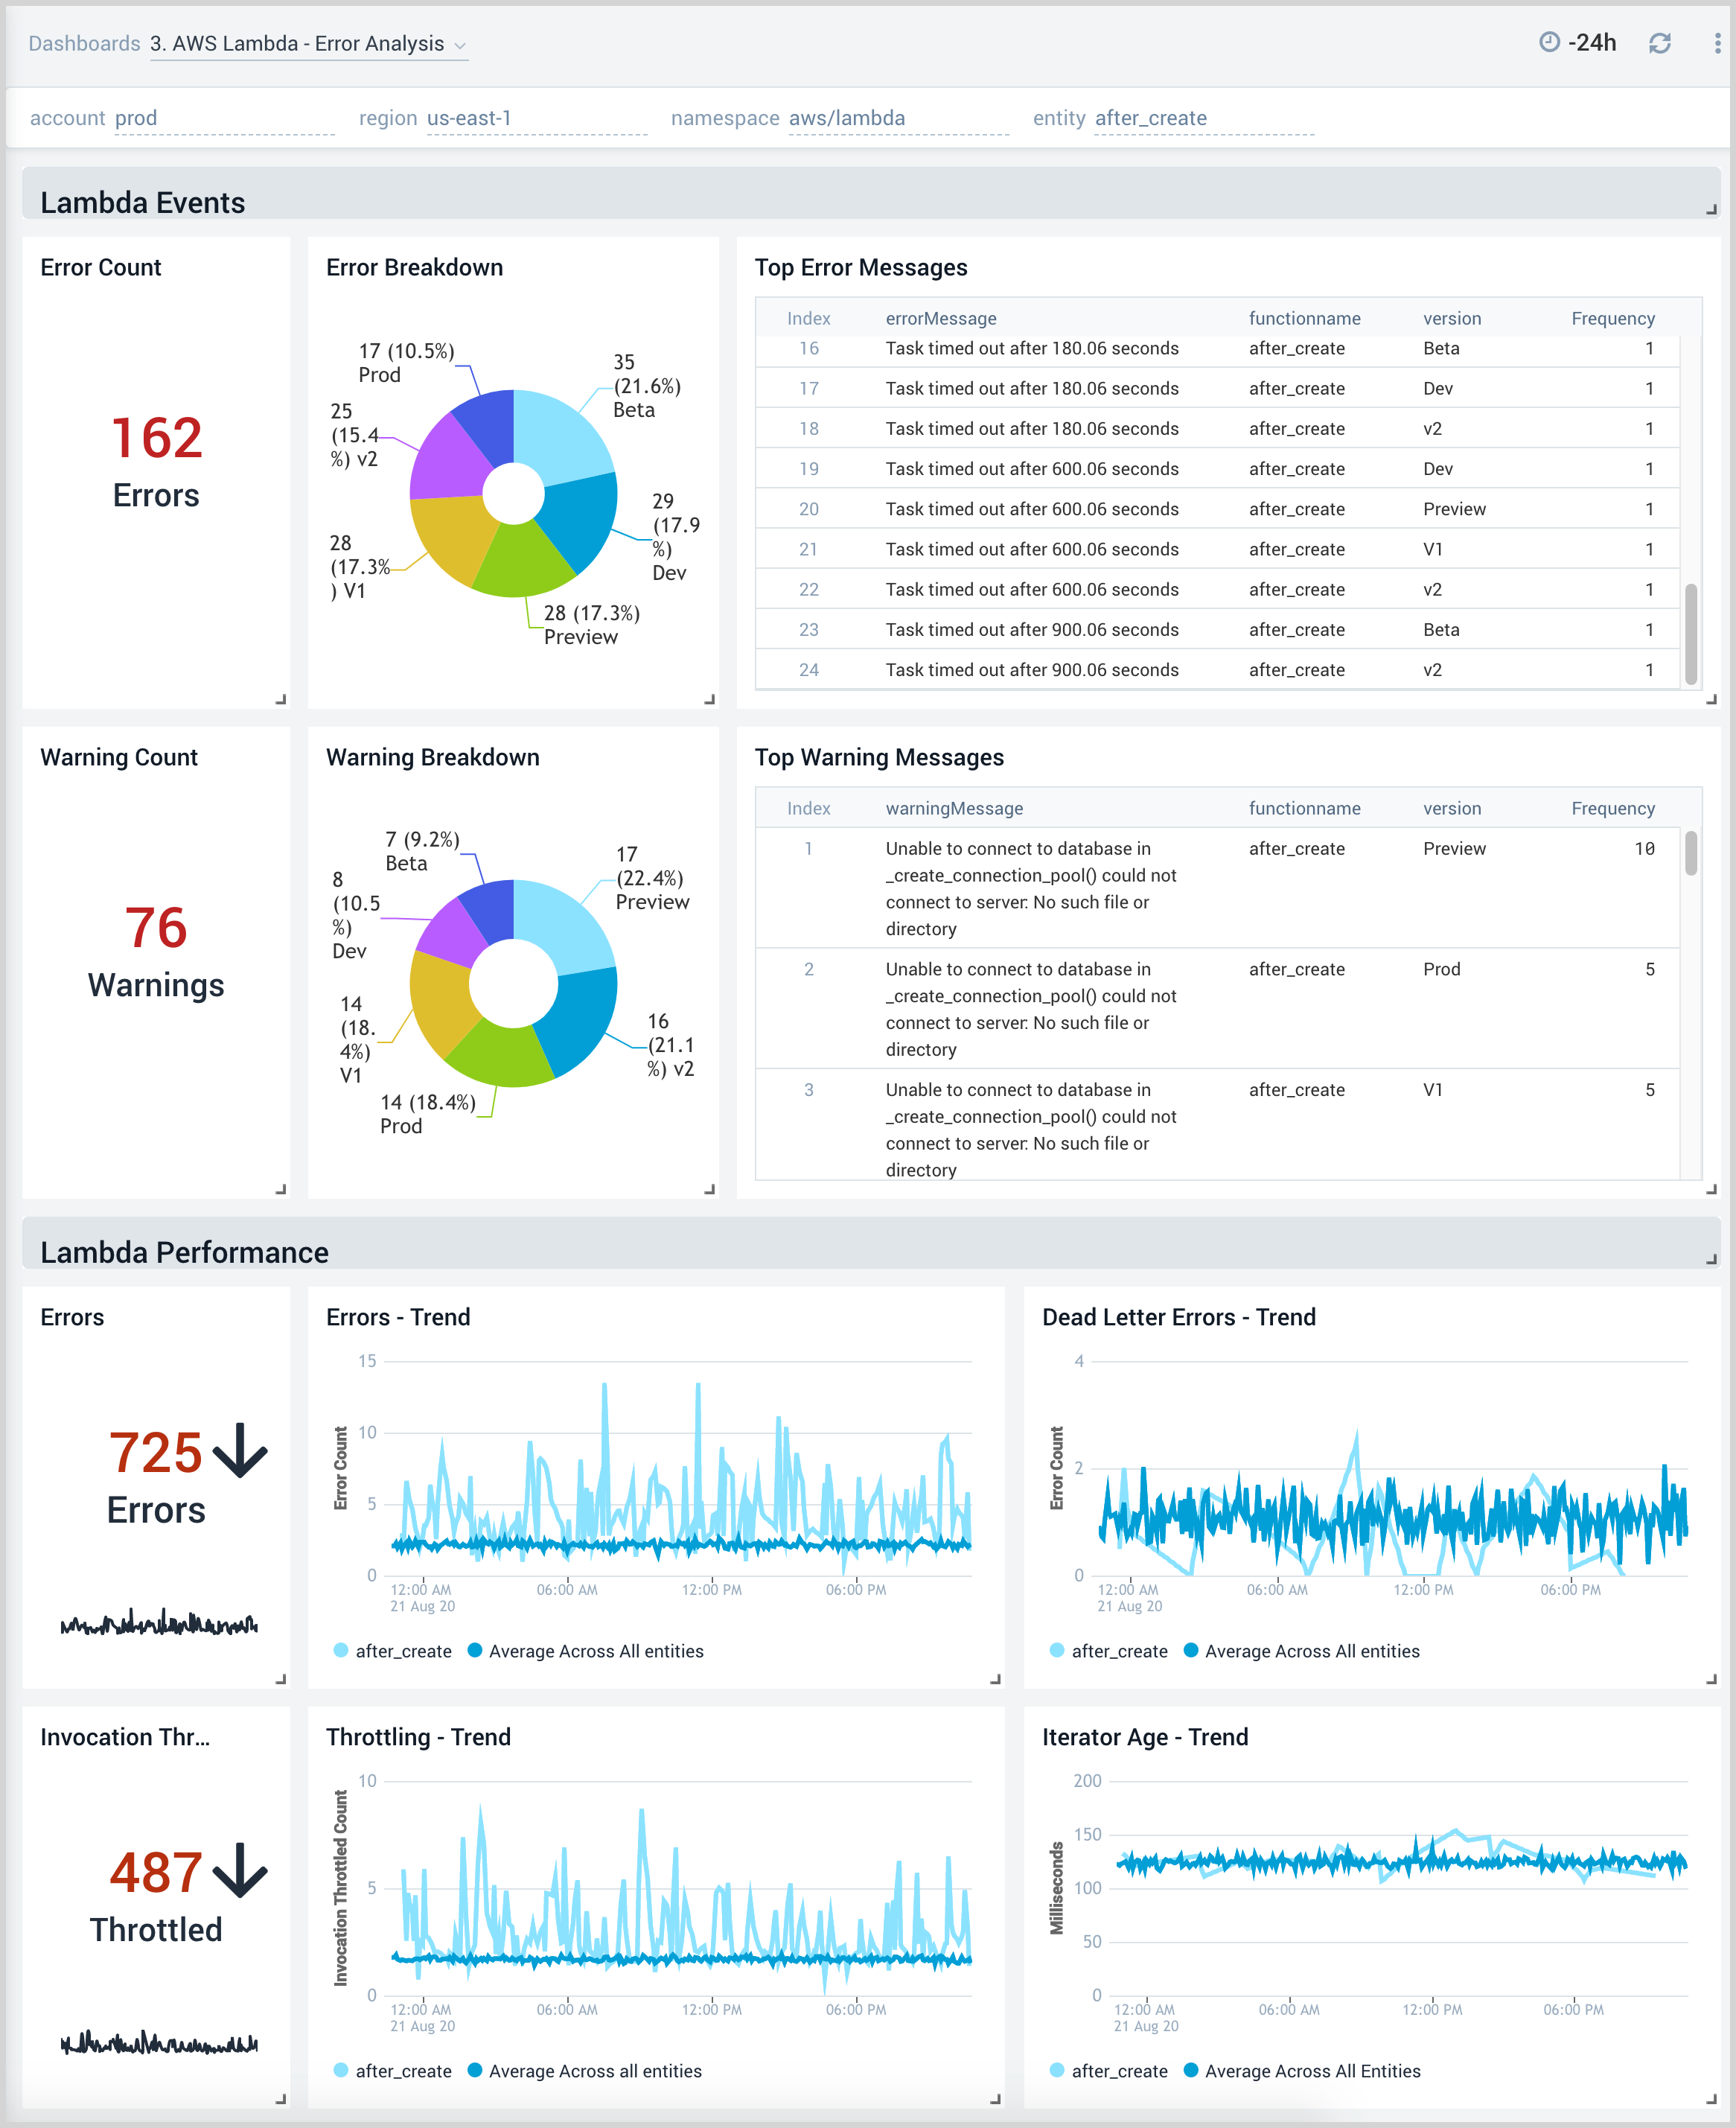
3. AWS Lambda - Error Analysis
The AWS Lambda - Error Analysis dashboard provides insights on errors and warnings in your AWS Lambda functions.
Use this dashboard to:
- Quickly identify the top errors and warnings across a Lambda function and its version.
- Prioritize the resolution of errors and warnings across all Lambda functions.
- Monitor the trend for the number of dead letter errors; when a Lambda is unable to write the failed event payload to your function's dead-letter queue.
- Monitor the trend for the number of Lambda function throttling events; the number of Lambda function invocation attempts throttled due to invocation rates exceeding the configured concurrent limits.
- Monitor the trend for Iterator Age applicable for your stream-based invocations only. This measures the age of the last record for each batch of records processed. Age is the difference between the time Lambda received the batch and the time the last record in the batch was written to the stream.
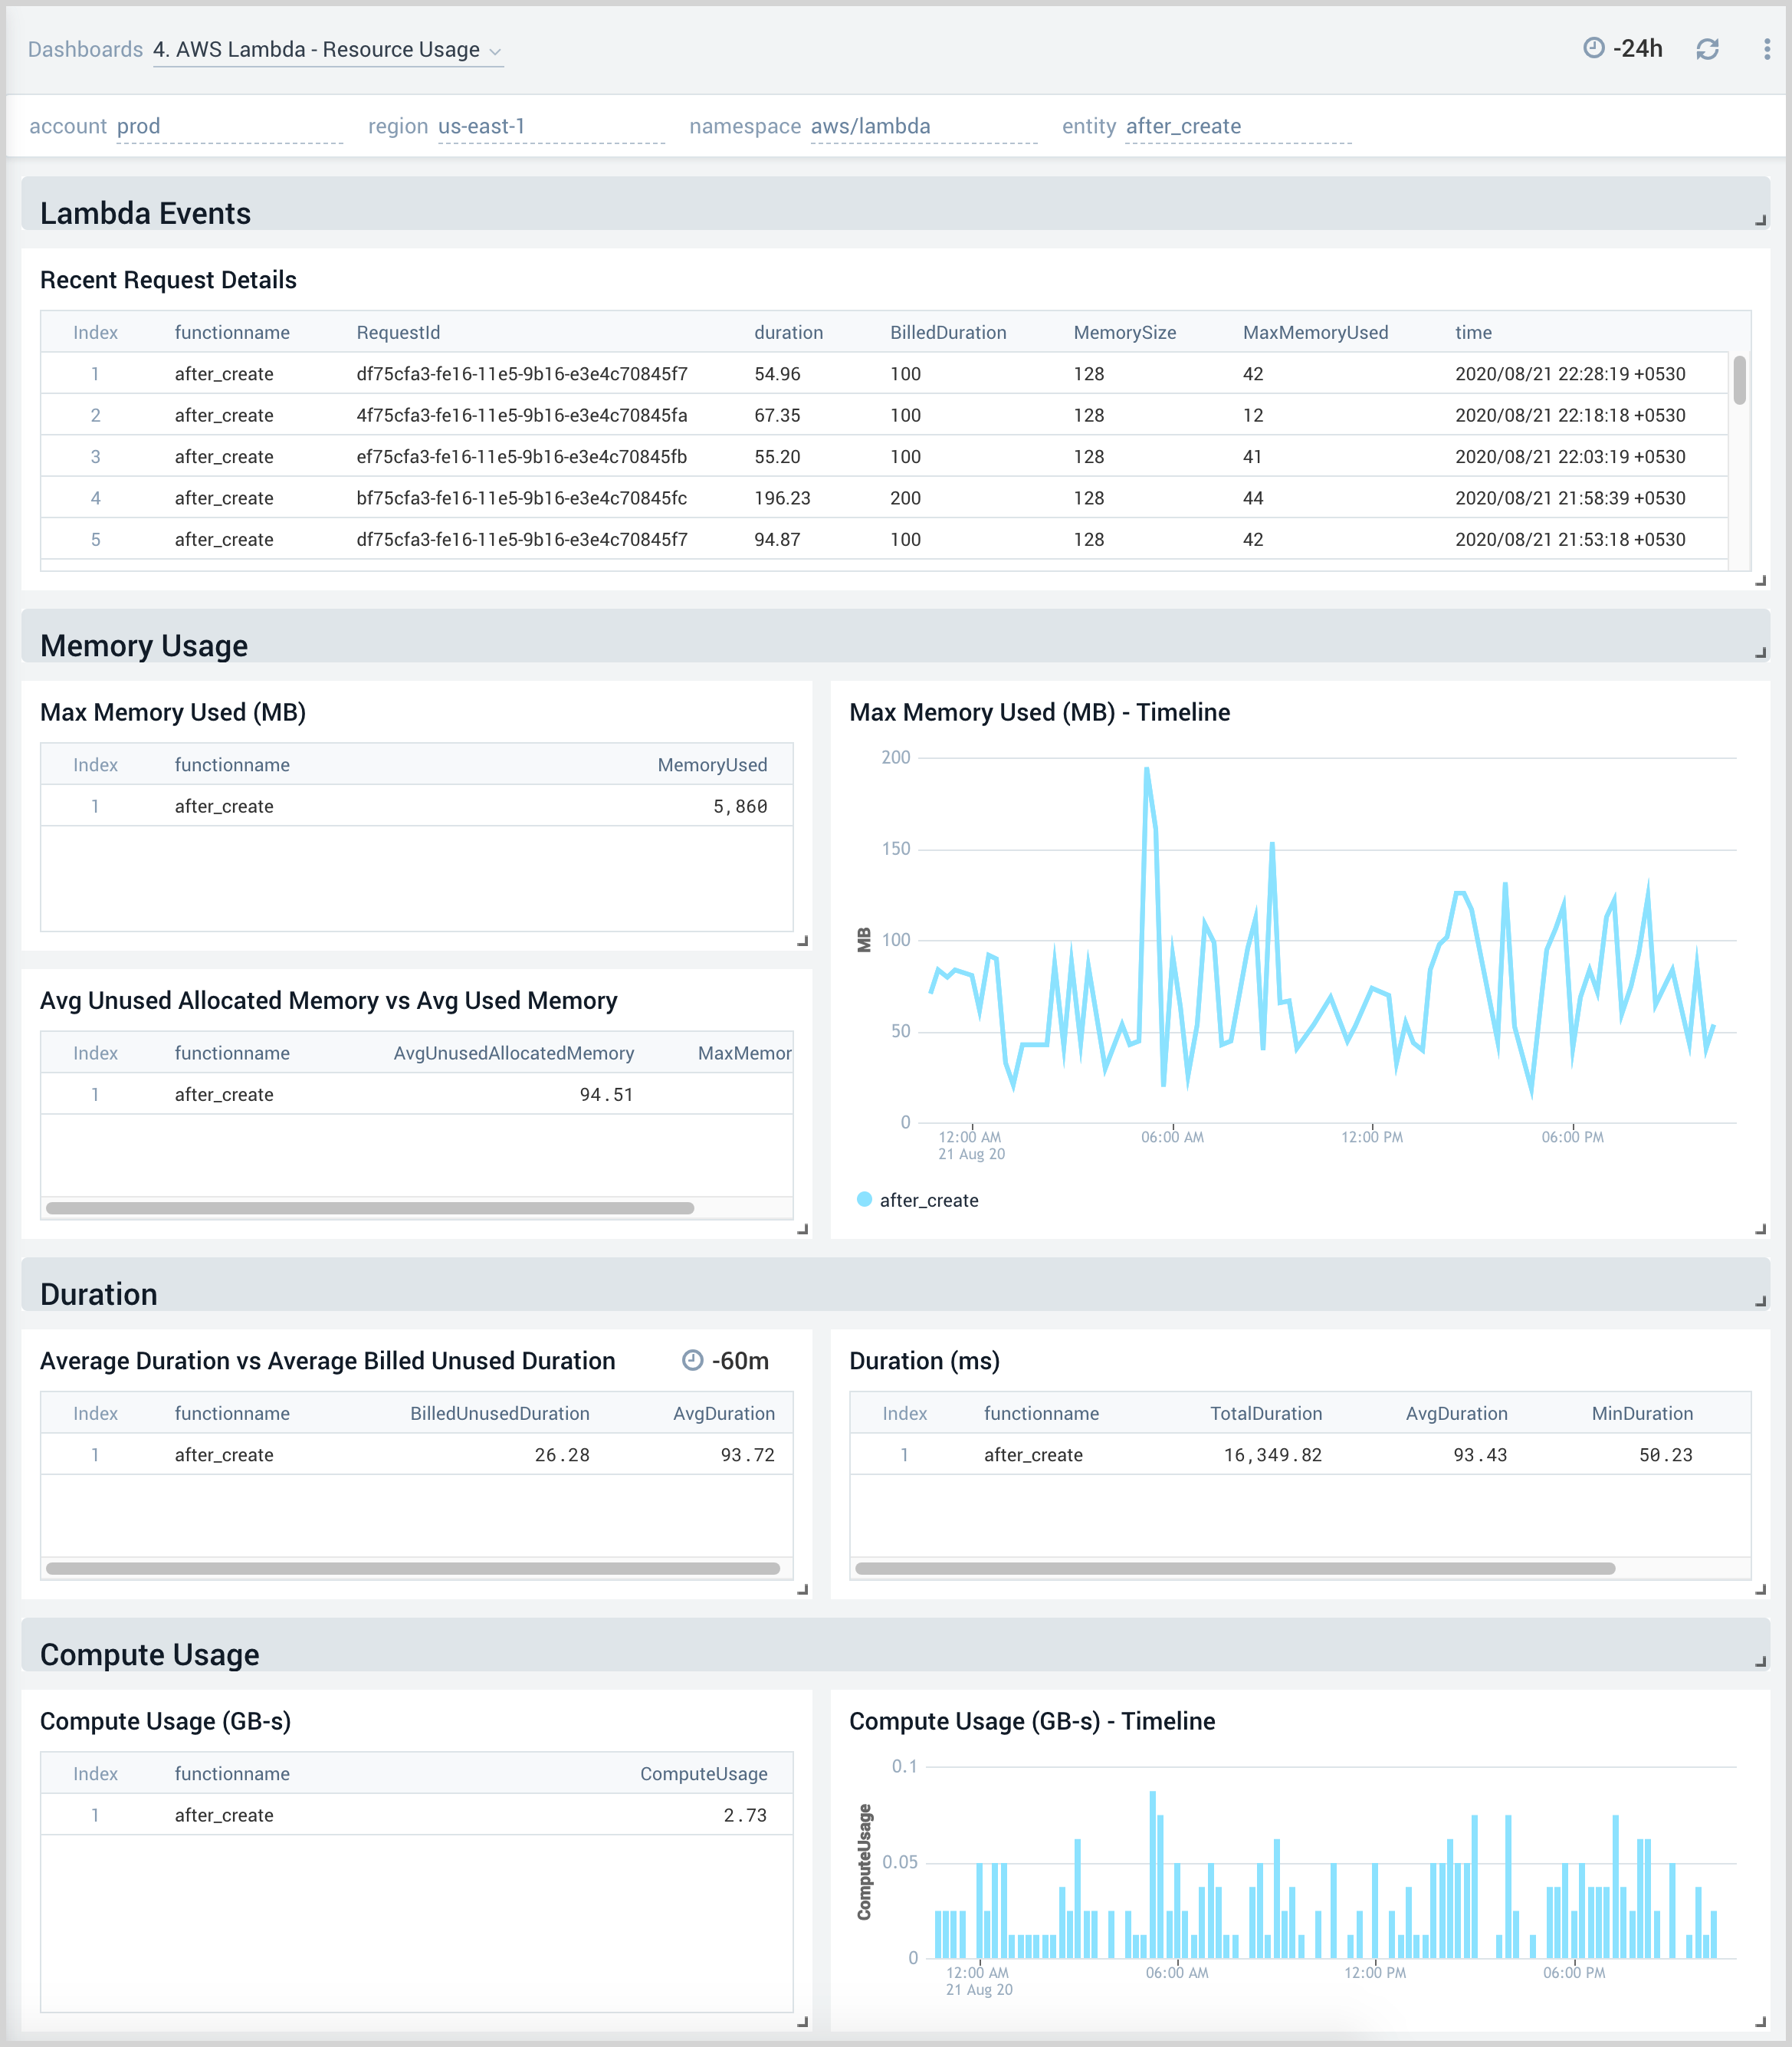
4. AWS Lambda - Resource Usage
AWS Lambda - Resource Usage dashboard provides insights on recent AWS Lambda request details, memory usage trends, function duration, and compute usage.
Use this dashboard to:
- Monitor the memory usage pattern of a Lambda function during its execution.
- Monitor time taken by function for execution particularly to understand the unbilled duration.
- Monitor the compute usage by function.
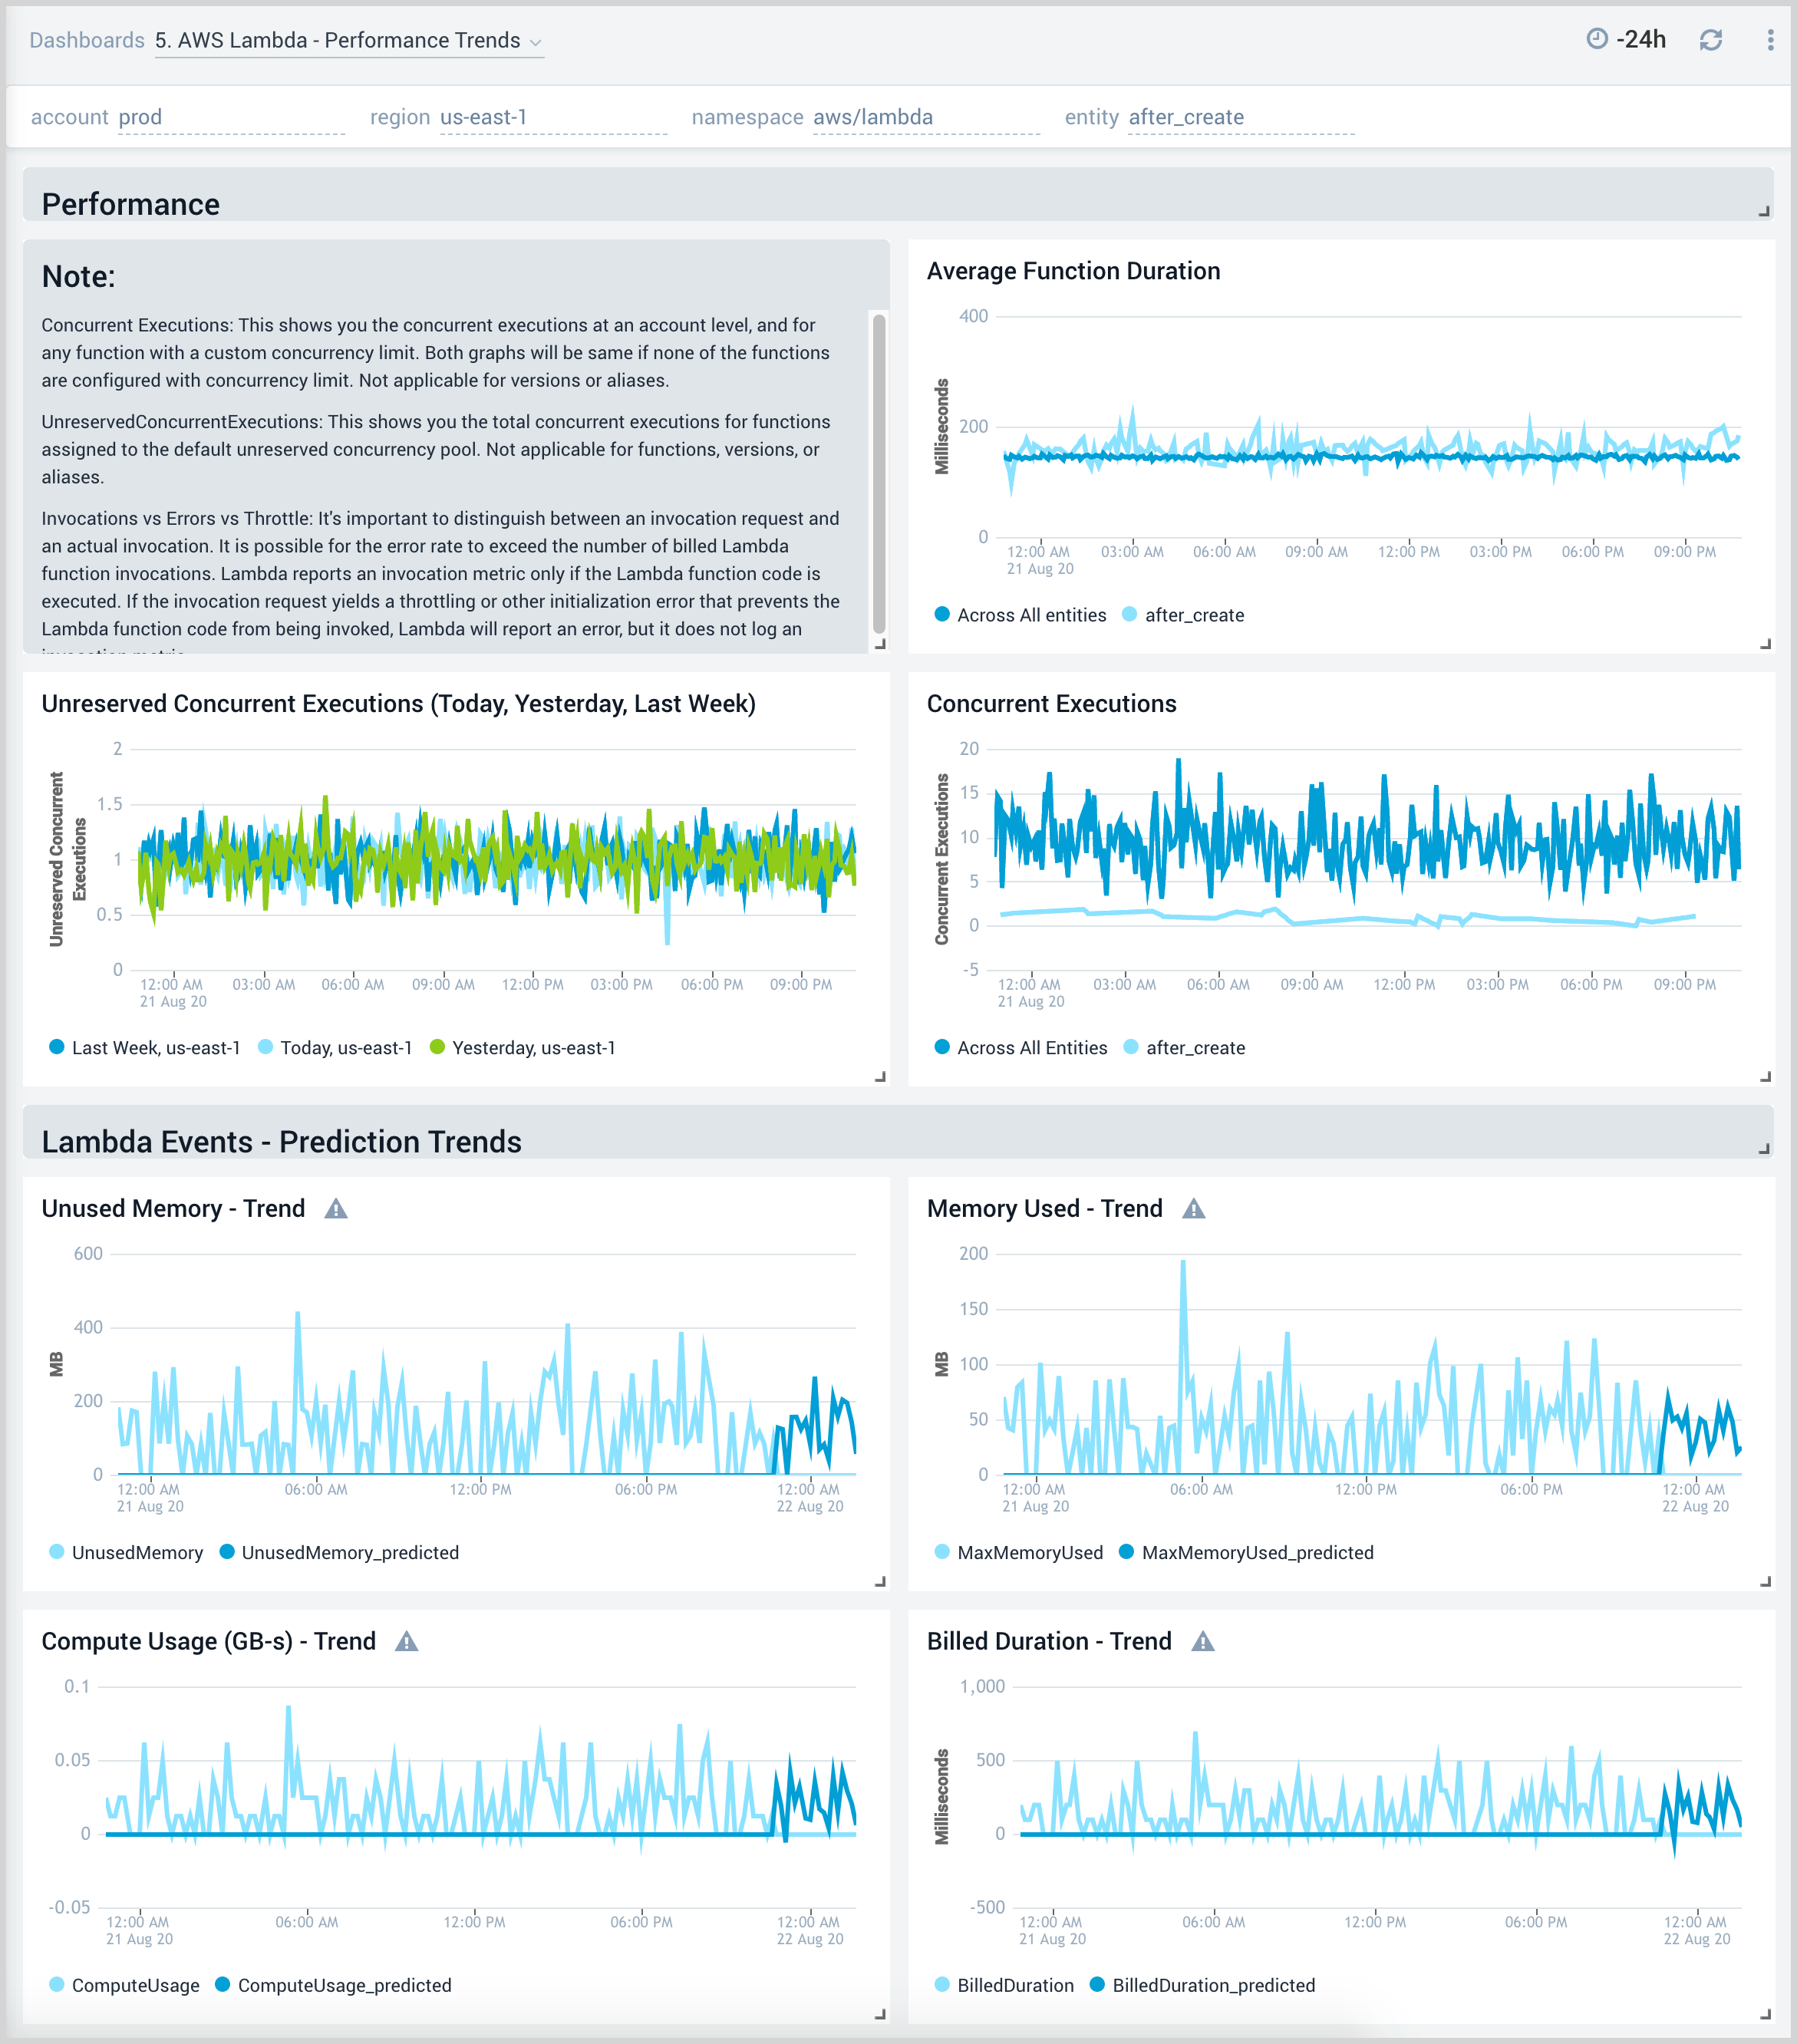
5. AWS Lambda - Performance Trends
AWS Lambda - Performance Trends dashboard displays log data analytics to provide insights on memory usage, function duration, recent request details, and compute usage.
Use this dashboard to:
- Monitor concurrent executions of an AWS Lambda function and understand trends over time.
- Monitor average AWS Lambda execution durations against wasted billed durations.
- Monitor memory used by AWS Lambda functions.
- Monitor compute usage trends and predictions by AWS Lambda function in GB-Seconds.
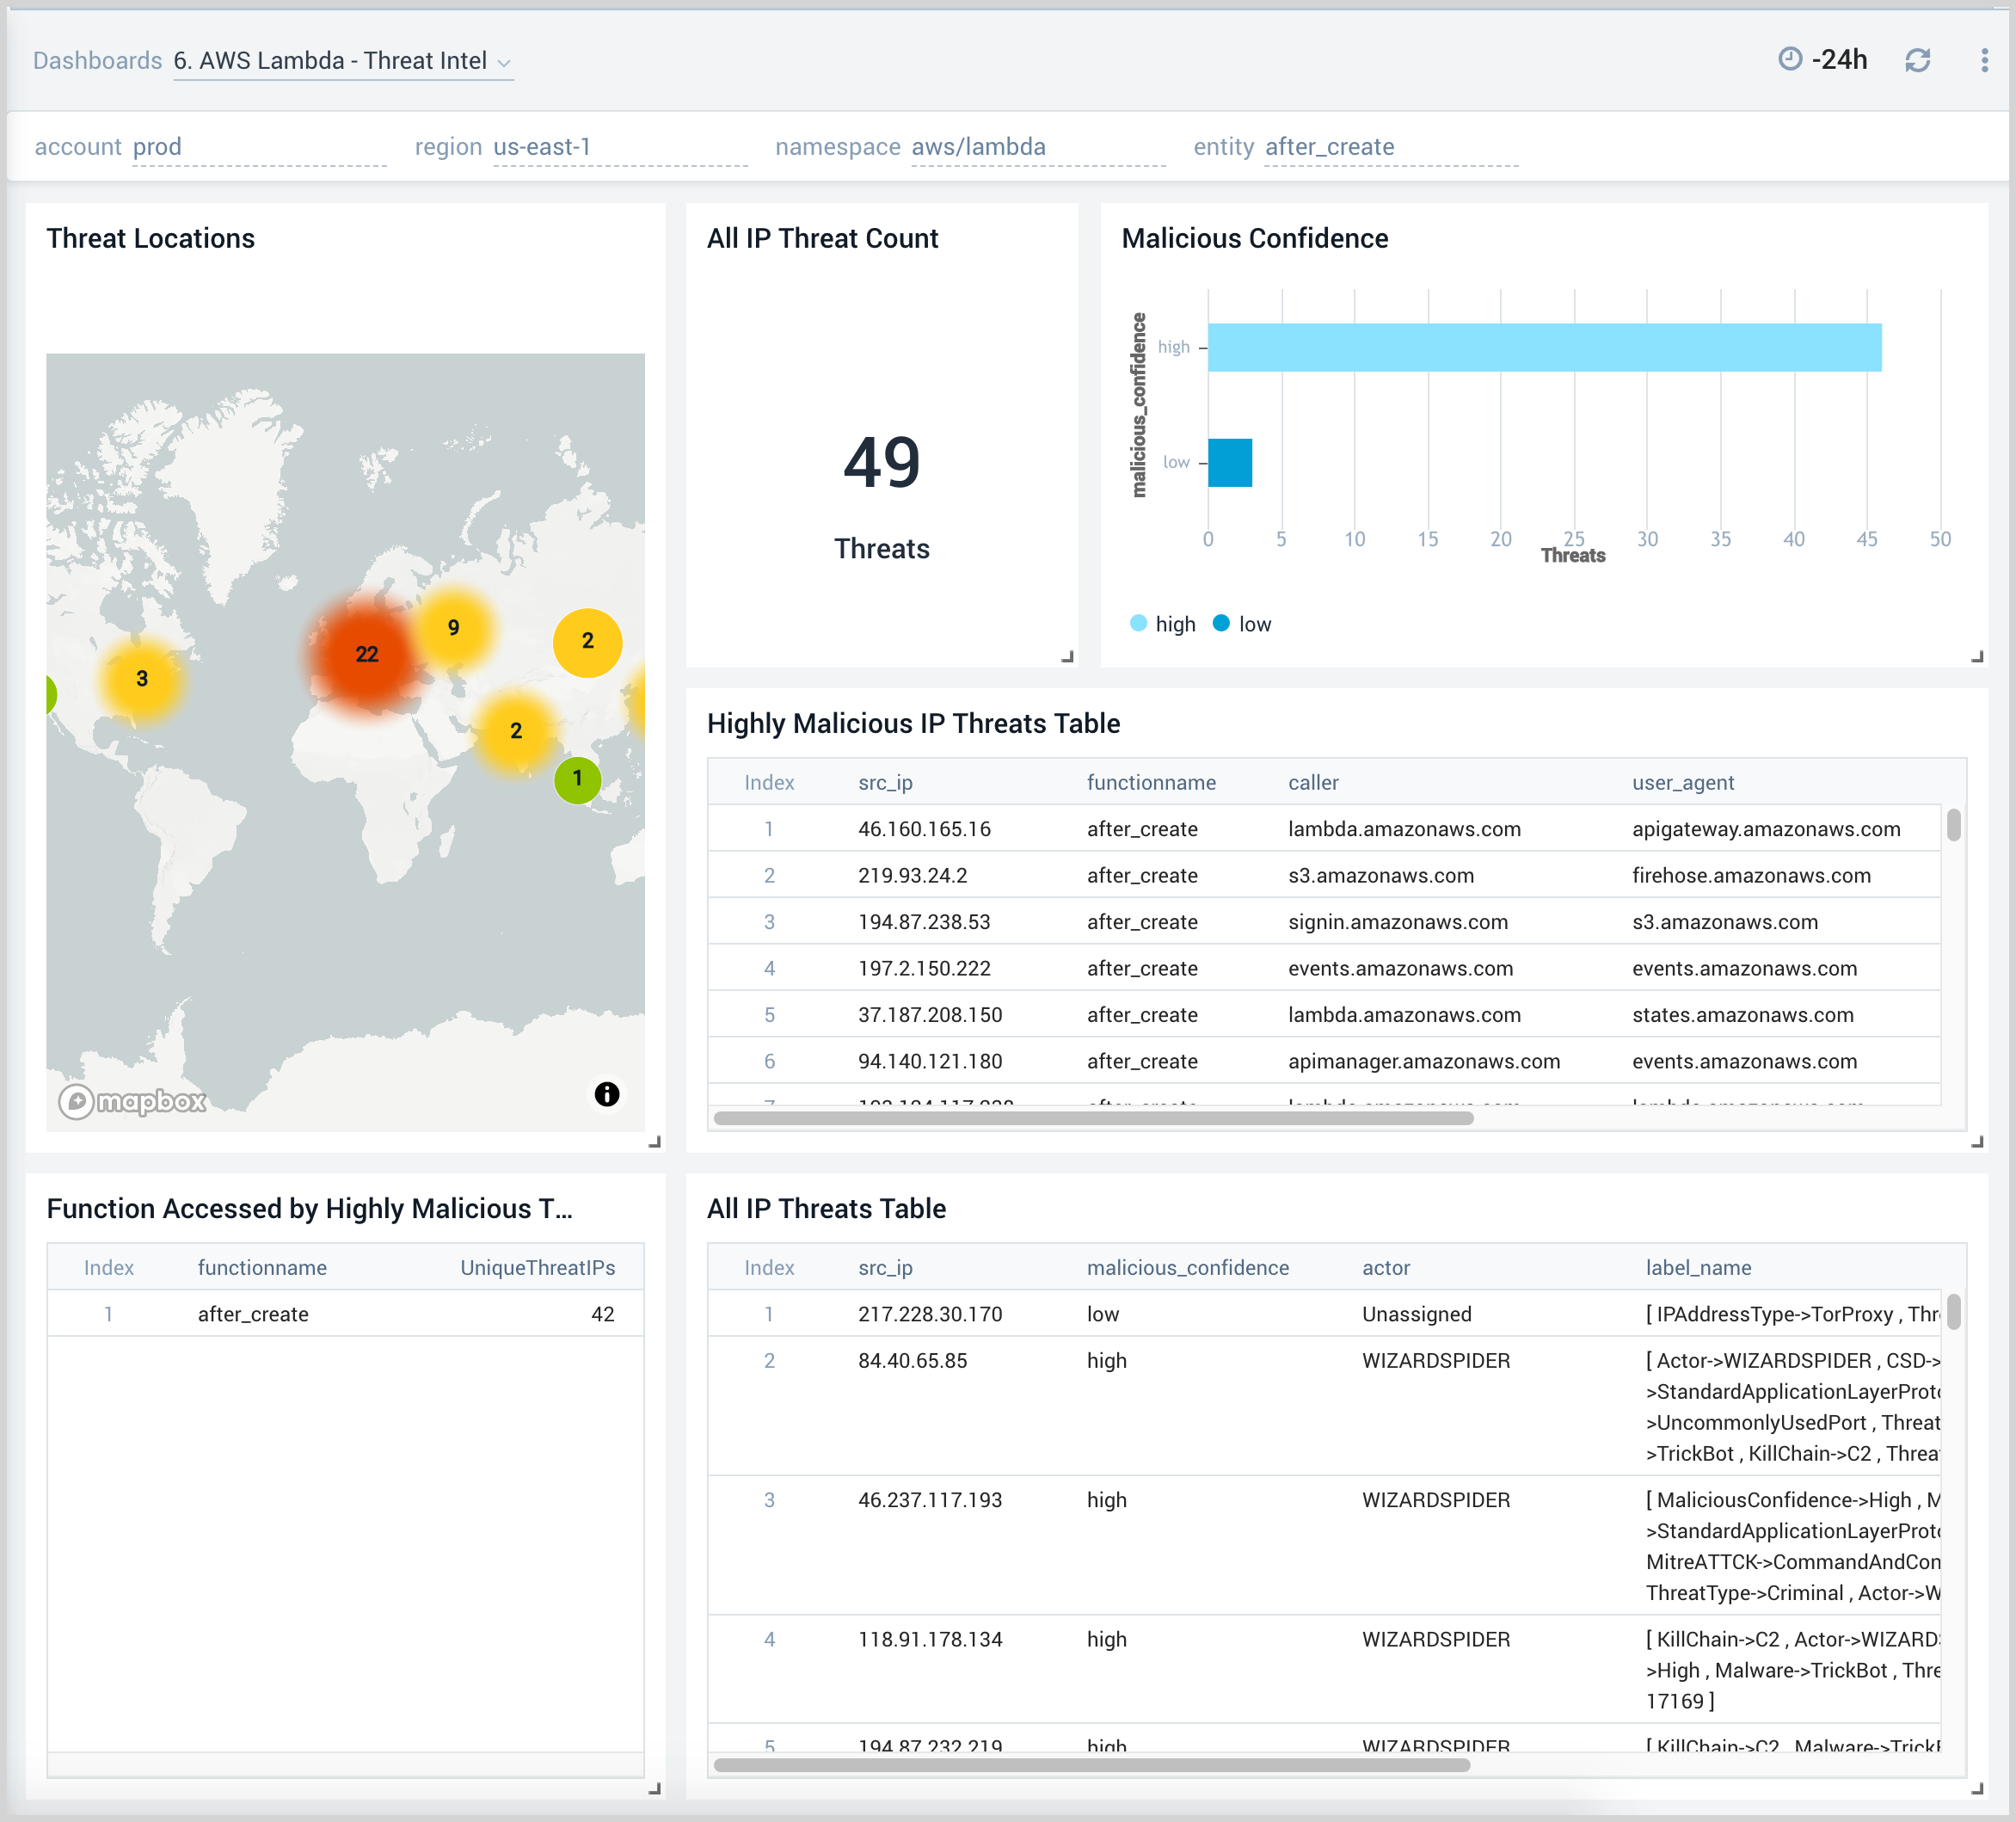
6. AWS Lambda - Threat Intel
AWS Lambda - Threat Intel dashboard provides insights into incoming requests to your AWS Lambda functions from malicious sources determined via Sumo Logic’s Threat Intel feature. Panels show detailed information on malicious IPs and the malicious confidence of each threat.
Use this dashboard to:
- Identify known malicious IPs that are access your load-balancers and use firewall access control lists to prevent them from sending you traffic going forward
- Monitor the malicious confidence level for all incoming malicious IP addresses the threats.