AWS Network Load Balancer
The AWS Network Load Balancer service is distributed in OSI Layer 4 (i.e., network) traffic (e.g., TCP, UDP, TLS) and can handle over a million requests per second.
The AWS Network Load Balancer dashboards provide insights to ensure that your network load-balancers are operating as expected, backend hosts are healthy and to quickly identify errors.
Metrics types
The AWS Network Load Balancer app uses the following logs and metrics:
Sample queries
Namespace=aws/NetworkELB metric=ActiveFlowCount Statistic=Sum account=dev region=us-east-1 LoadBalancer=* | sum by account, region, namespace, LoadBalancer
Viewing AWS Network Load Balancer dashboards
All dashboards have a set of filters that you can apply to the entire dashboard. Use these filters to drill down and examine the data to a granular level.
- You can change the time range for a dashboard or panel by selecting a predefined interval from a drop-down list, choosing a recently used time range, or specifying custom dates and times. Learn more.
- If required, configure the refresh interval rate for a dashboard or panel by clicking the drop-down arrow next to the refresh icon.
- Click the funnel icon in the dashboard top menu bar to filter dashboard with Template Variables.
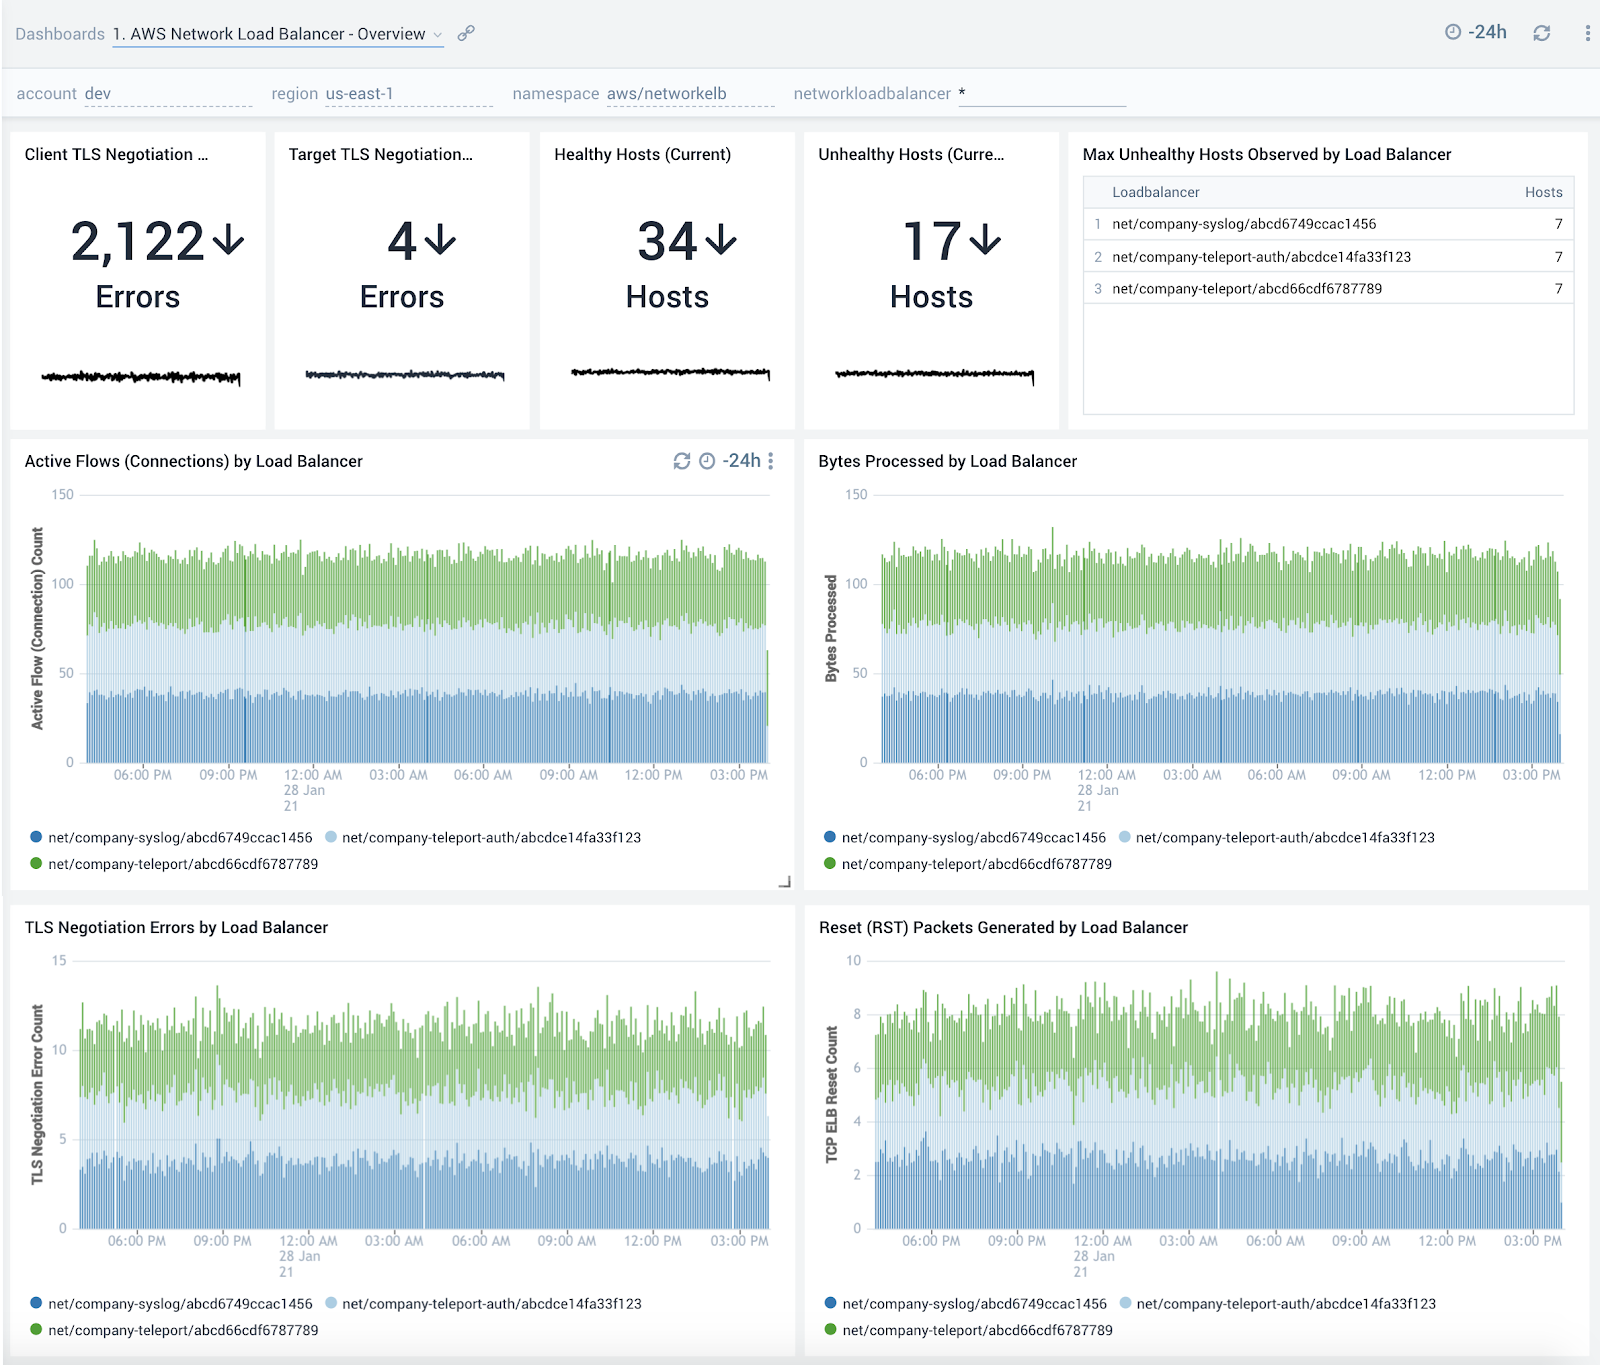
1. AWS Network Load Balancer - Overview
The AWS Network Load Balancer - Overview dashboard provides detailed insights into a view of network utilization and performance. The dashboard provides information about the errors, health, and traffic handled by the load balancer.
Use this dashboard to:
- Get an at-a-glance view of the number of errors and status of backend hosts.
- Identify load balancers with the most number of unhealthy hosts.
- Monitor trends around active connections, bytes processed, and reset packets to ensure load balancers are operating as expected.
1. Amazon Network Load Balancer - Active and New Flows
The AWS Network Load Balancer - Active and New Flows dashboard provides detailed insights for new flows, and active flows for TCP, TLS, and UDP traffic.
Use this dashboard to:
- Monitor trends around active and new flows (connections) to make sure they line up with expectations and then use that information to scale up/scale down backend hosts.

2. AWS Network Load Balancer - Host Health Status
The AWS Network Load Balancer - Host Health Status dashboard provides detailed insights into the number of healthy and unhealthy hosts.
Use this dashboard to:
- Get a quick overview of the number of healthy and unhealthy hosts.
- Monitor trends around the number of unhealthy hosts to spot potential service disruptions that could warrant deeper investigation.

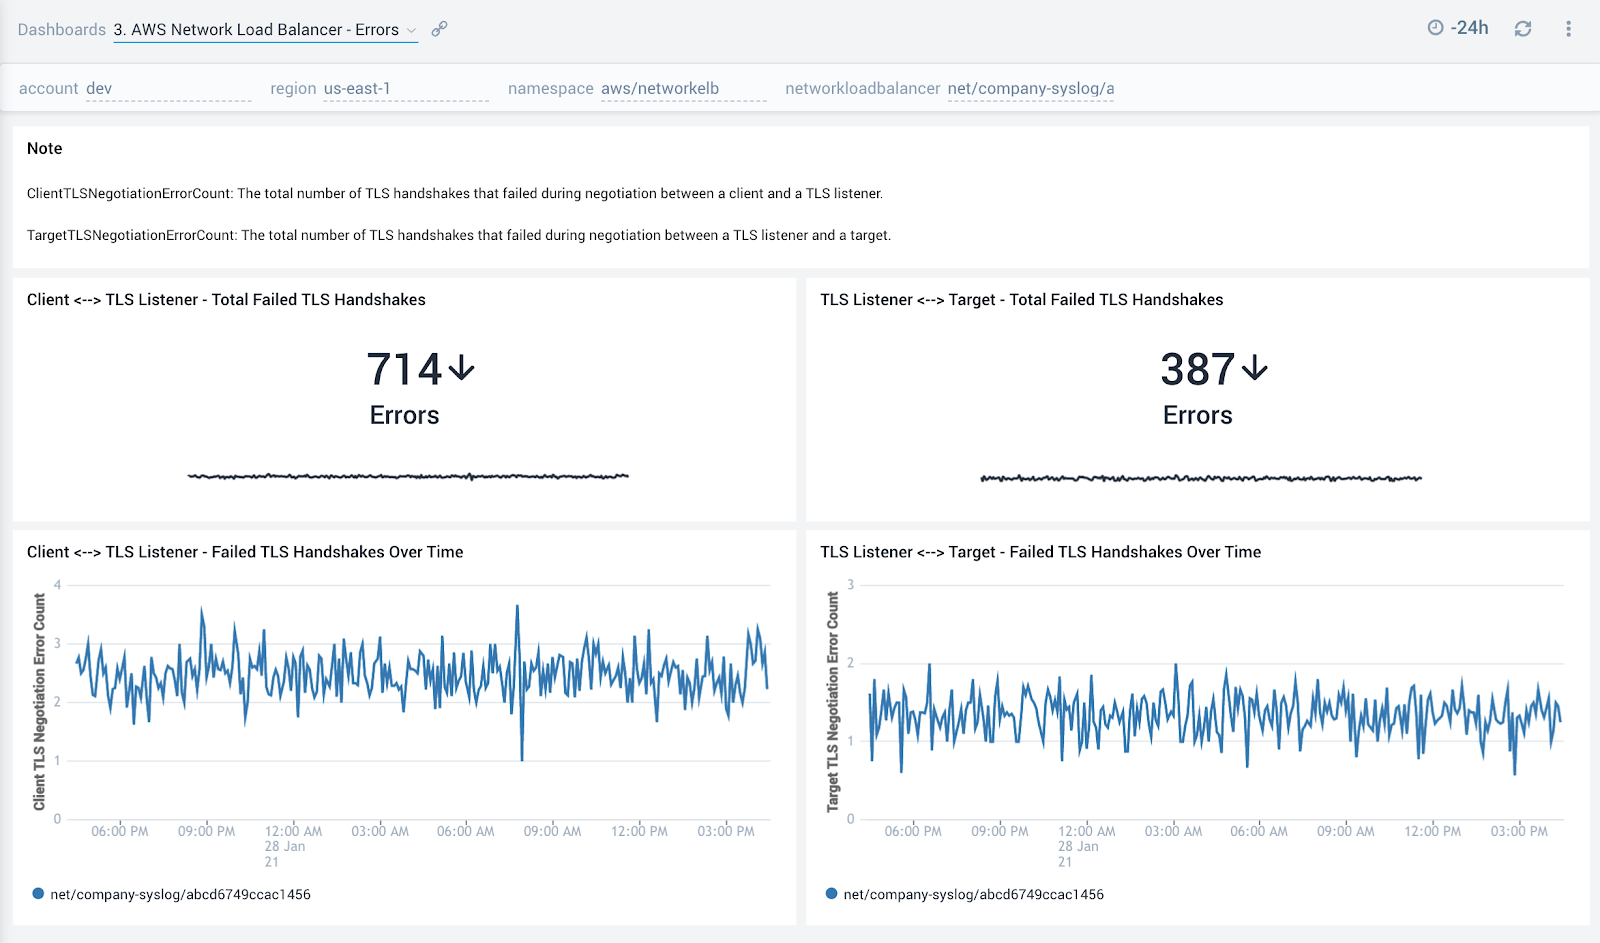
3. AWS Network Load Balancer - Errors
The AWS Network Load Balancer - Errors dashboard provides detailed insights into the errors reported by the network load balancer. This dashboard shows information for the total number of TLS handshakes that failed during negotiation between a client and a TLS listener, and the total number of TLS handshakes that failed during negotiation between a TLS listener and a target.
Use this dashboard to:
- Monitor TLS handshake errors during negotiation between a client and a TLS listener, which could happen if clients are sending an incorrect cipher or are using incorrect protocols not matching the one specified in the security policy. It’s recommended to use the most recent AWS CLI client version.
- Monitor TLS handshake errors during negotiation between a TLS listener and a target. Possible causes for this error include a mismatch of ciphers or protocols.
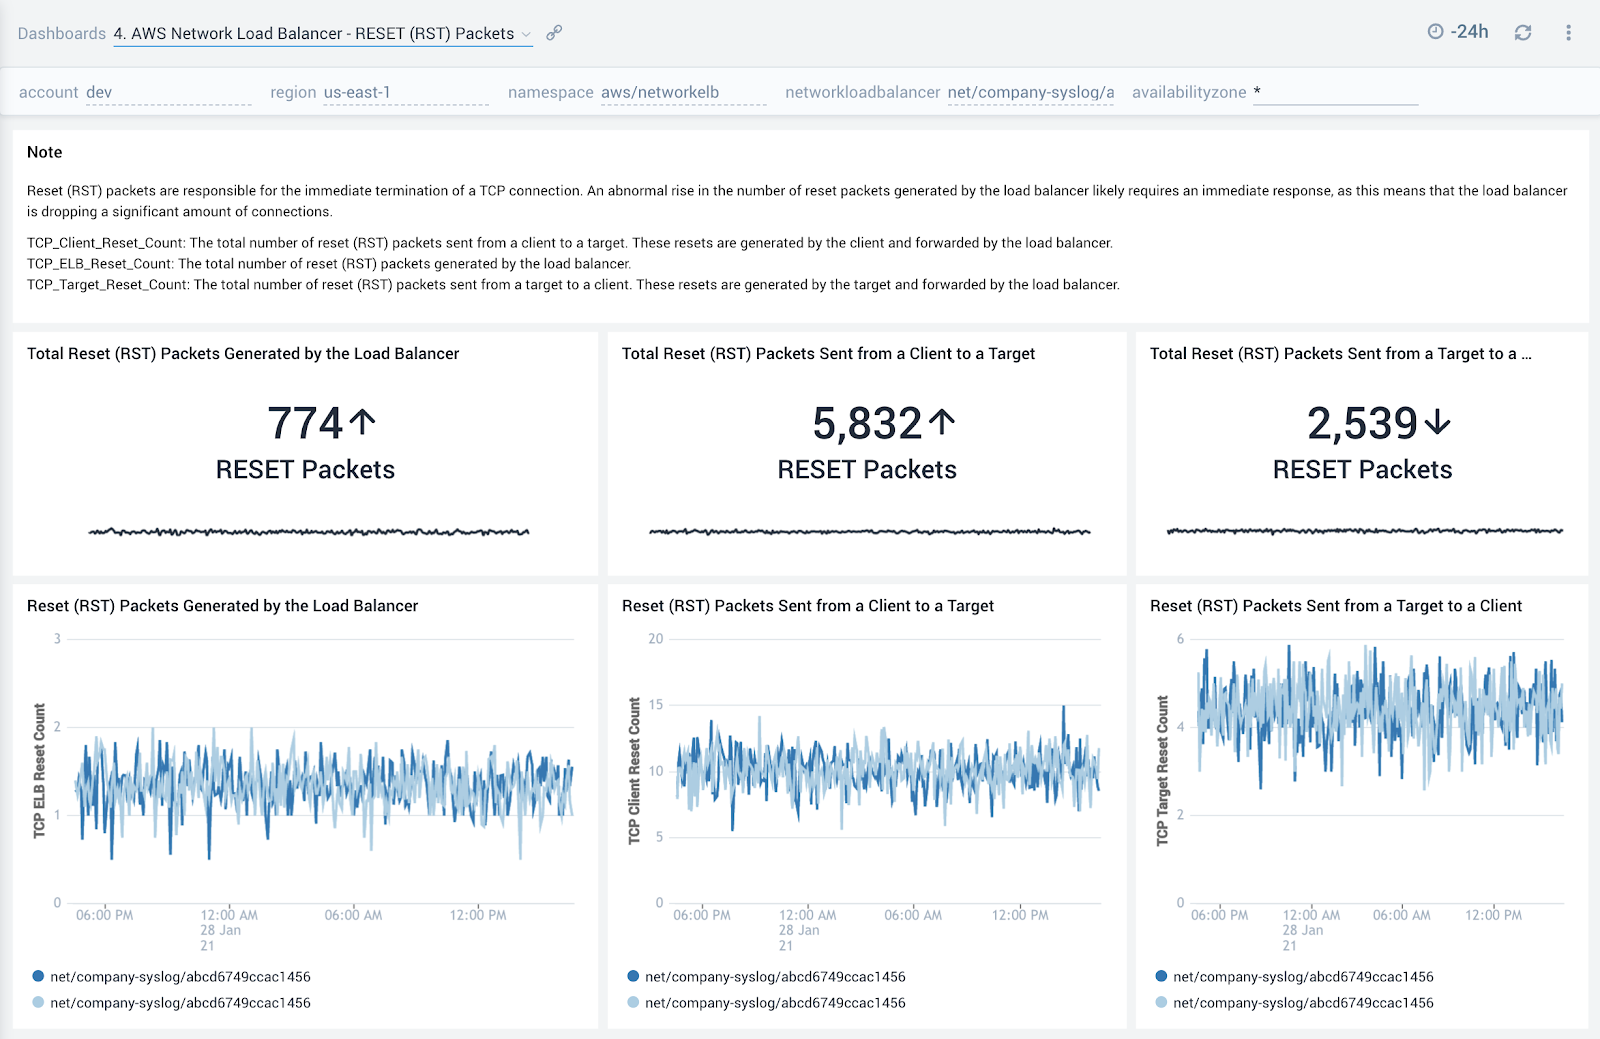
4. AWS Network Load Balancer - Reset (RST) Packets
The AWS Network Load Balancer - Reset (RST) Packets dashboard provides detailed insights into the number reset (RST) packets received by the network load balancer. The dashboard shows the information for the total number of reset (RST) packets sent from a client to a target, the total number of reset (RST) packets generated by the load balancer, and the total number of reset (RST) packets sent from a target to a client.
Use this dashboard to:
- To monitor the number of RST packets. A high number of reset packets could indicate connections are getting dropped and could mean a disruption in service.
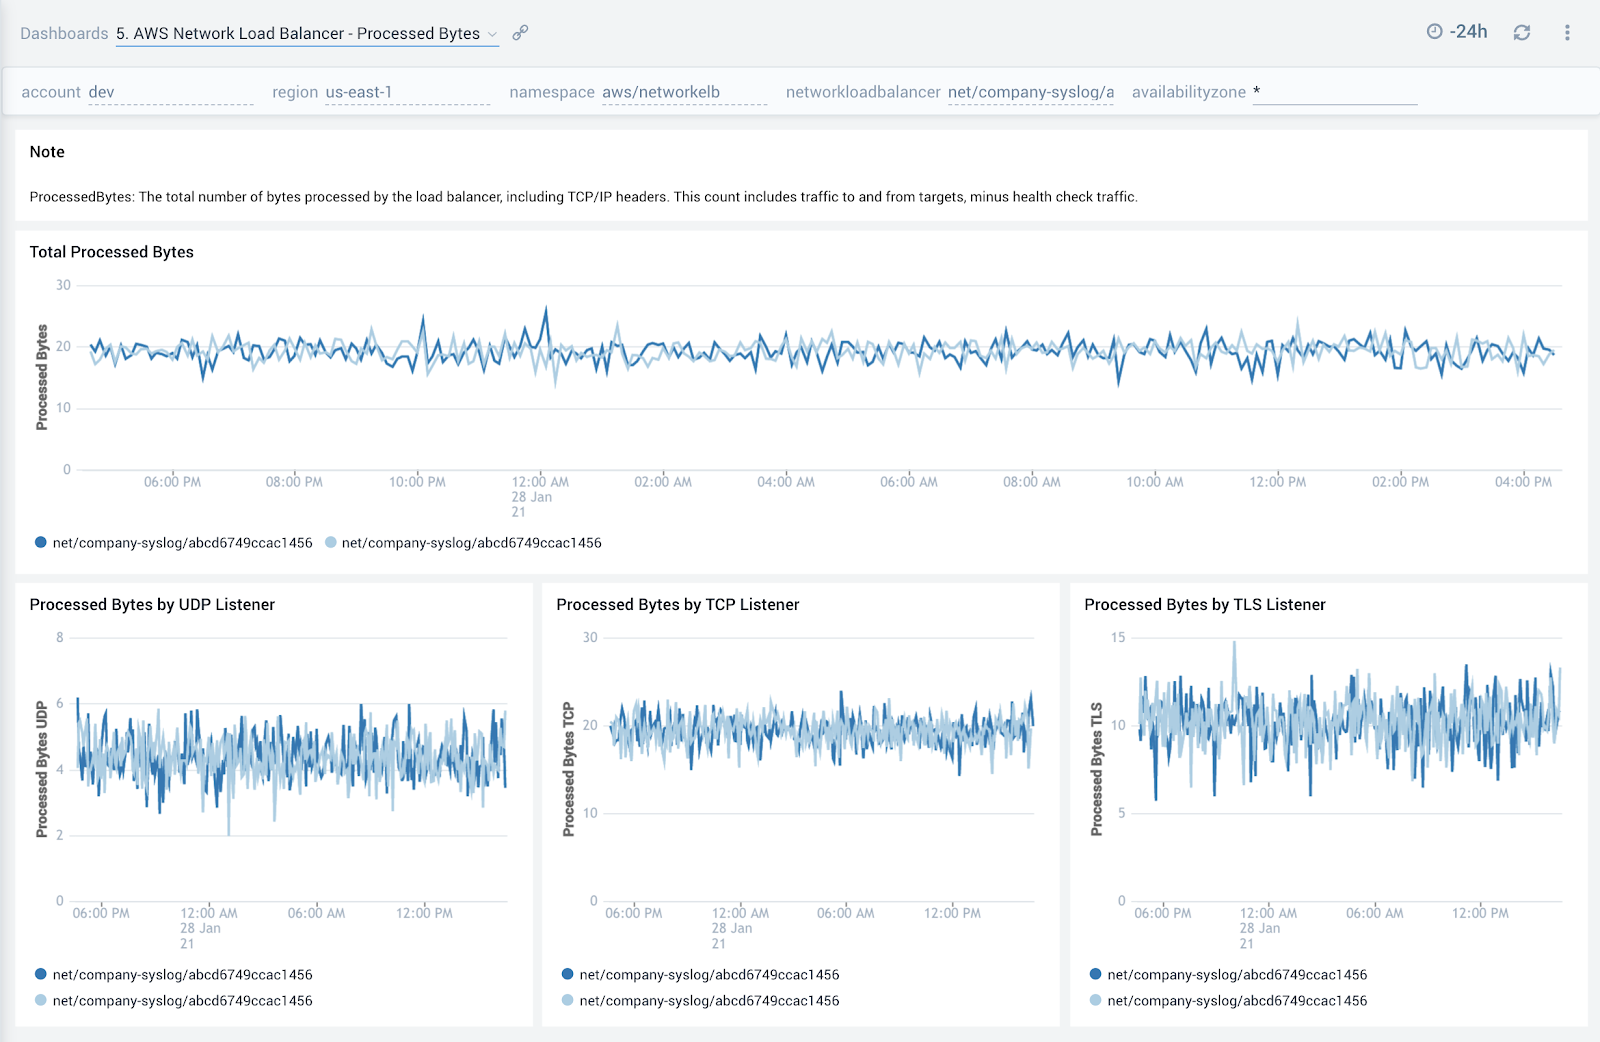
5. AWS Network Load Balancer - Processed Bytes
The AWS Network Load Balancer - Processed Bytes dashboard provides detailed insights into the amount of bytes processed by the load balancer for total, UDP, TCP and TLS traffic.
Use this dashboard to:
- Monitor trends around processed bytes to make sure they line up with expectations and then use that information to scale up or scale down backend hosts.
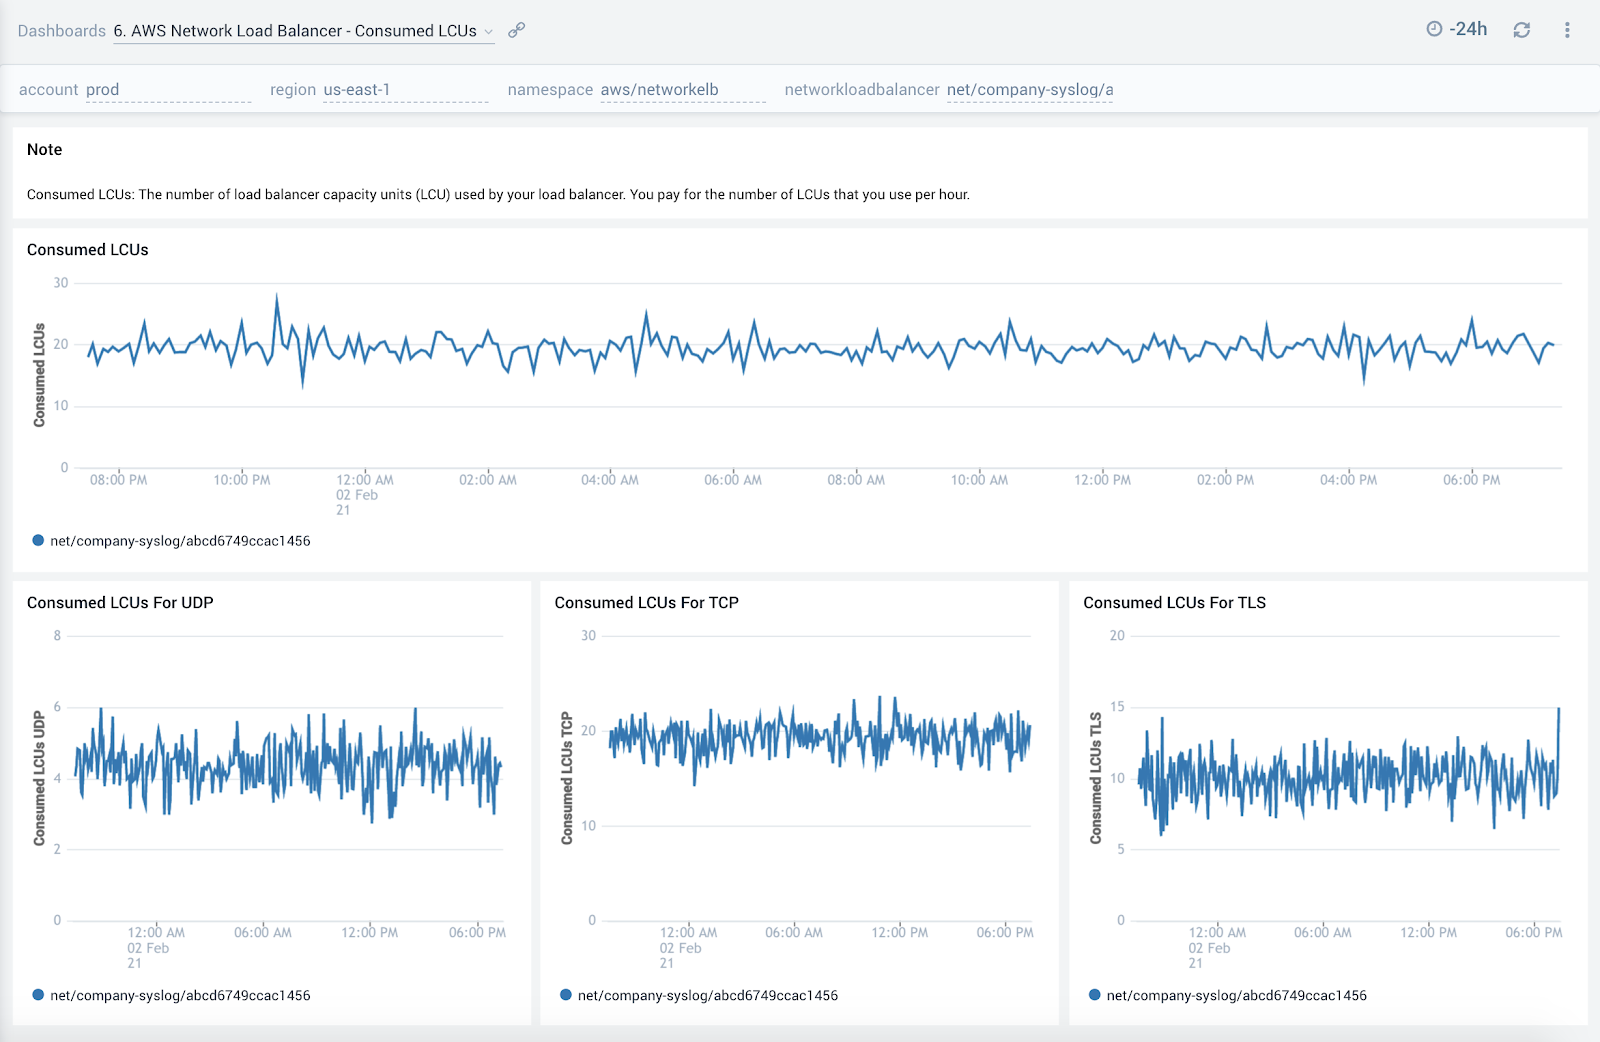
6. AWS Network Load Balancer - Consumed LCUs
The AWS Network Load Balancer - Consumed LCUs dashboard shows you the total number of load balancer capacity units (LCU) used by your load balancer by network protocol.
You only pay for the number of LCUs that you use per hour.
Use this dashboard to:
- Optimize load balancer costs by monitoring trends around the number of load balancer capacity units (LCU) used by network protocol.