Add a New AWS Service to the AWS Observability View Hierarchy
The AWS Observability view provides a unified view of your AWS Services within Sumo Logic from multiple AWS accounts. It shows a hierarchy across AWS accounts, regions, namespaces, and entities to present an intuitive navigation flow.
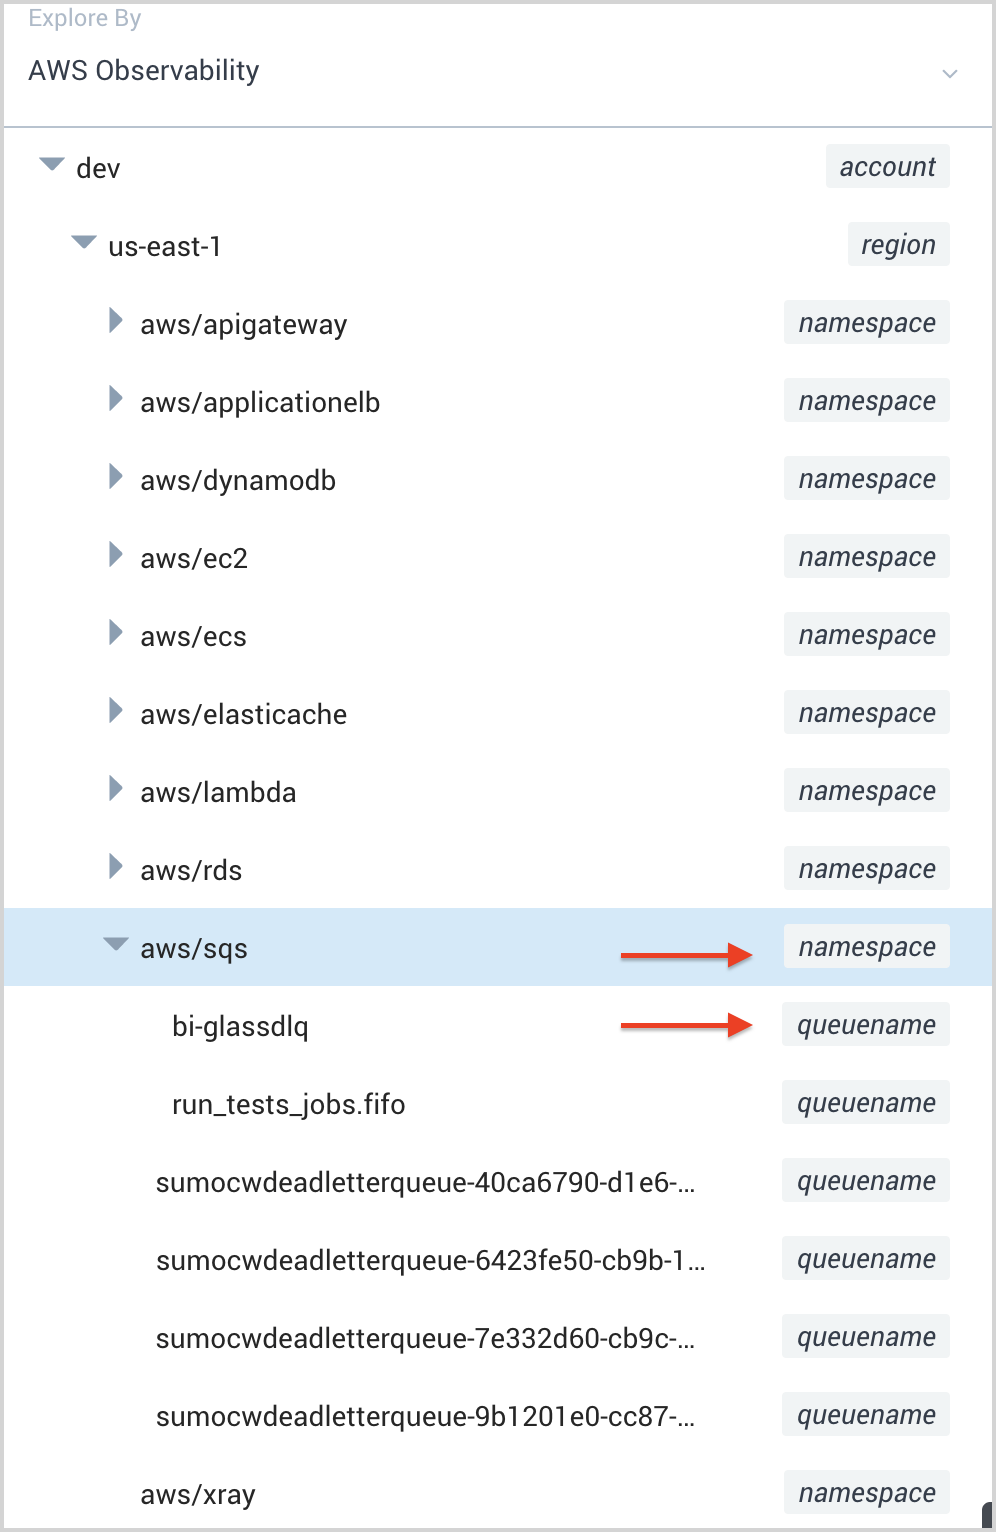
By default, the AWS Observability view supports the following services: AWS EC2, AWS API Gateway, AWS Lambda, AWS RDS, Amazon DynamoDB, and AWS Application ELB. The purpose of this document is to guide you towards adding any dashboards you may have built for additional services to the AWS Observability hierarchy.
Prerequisites
Before you can add dashboards for a new service to the AWS Observability hierarchy:
- The AWS Observability solution must have already been installed for at least one supported service.
- You need to collect metrics for your service via a Sumo Logic AWS CloudWatch metrics source for an AWS account that is already being monitored by the AWS Observability solution. We recommend creating a new AWS CloudWatch metrics source for the service you want to monitor as opposed to using an existing source for performance reasons.
- You need to create at least one Sumo Logic dashboard based on CloudWatch metrics and log data to monitor the operations of the AWS Service in question.
Add a new service to the AWS Observability View
As dashboards can be created based on both logs and metrics data, in this section, we identify how to add dashboards based on both data types to the AWS Observability views.
Step 1. Enrich Metrics Data
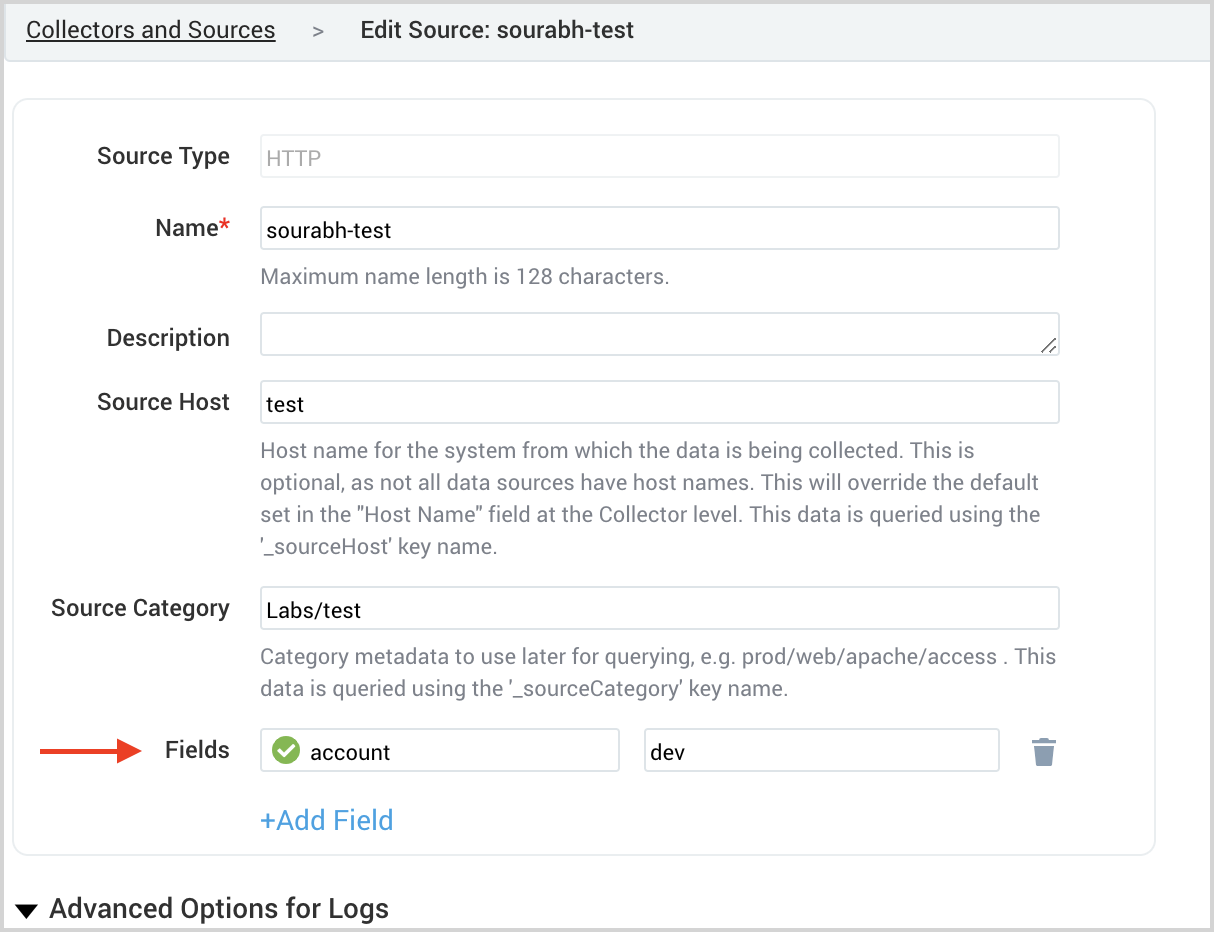
Add the account field as a metadata tag to the AWS CloudWatch metrics source
The Account field is already a part of CloudWatch metrics sources that were configured as part of the AWS Observability Solution’s CloudFormation template. Therefore the Account metadata field needs to be added to the CloudWatch metrics source using Fields configuration.
This can be done by following the steps below:
- Go to App Catalog, then search for and select AWS Observability.
- In the AWS Observability solution, identify the account alias for the AWS account you have configured that is running the service you want to monitor.
- Edit the CloudWatch Metrics source for the AWS service you wish to add to the AWS Observability solution.
- Add Account field as by adding a field as shown in the screenshot below.
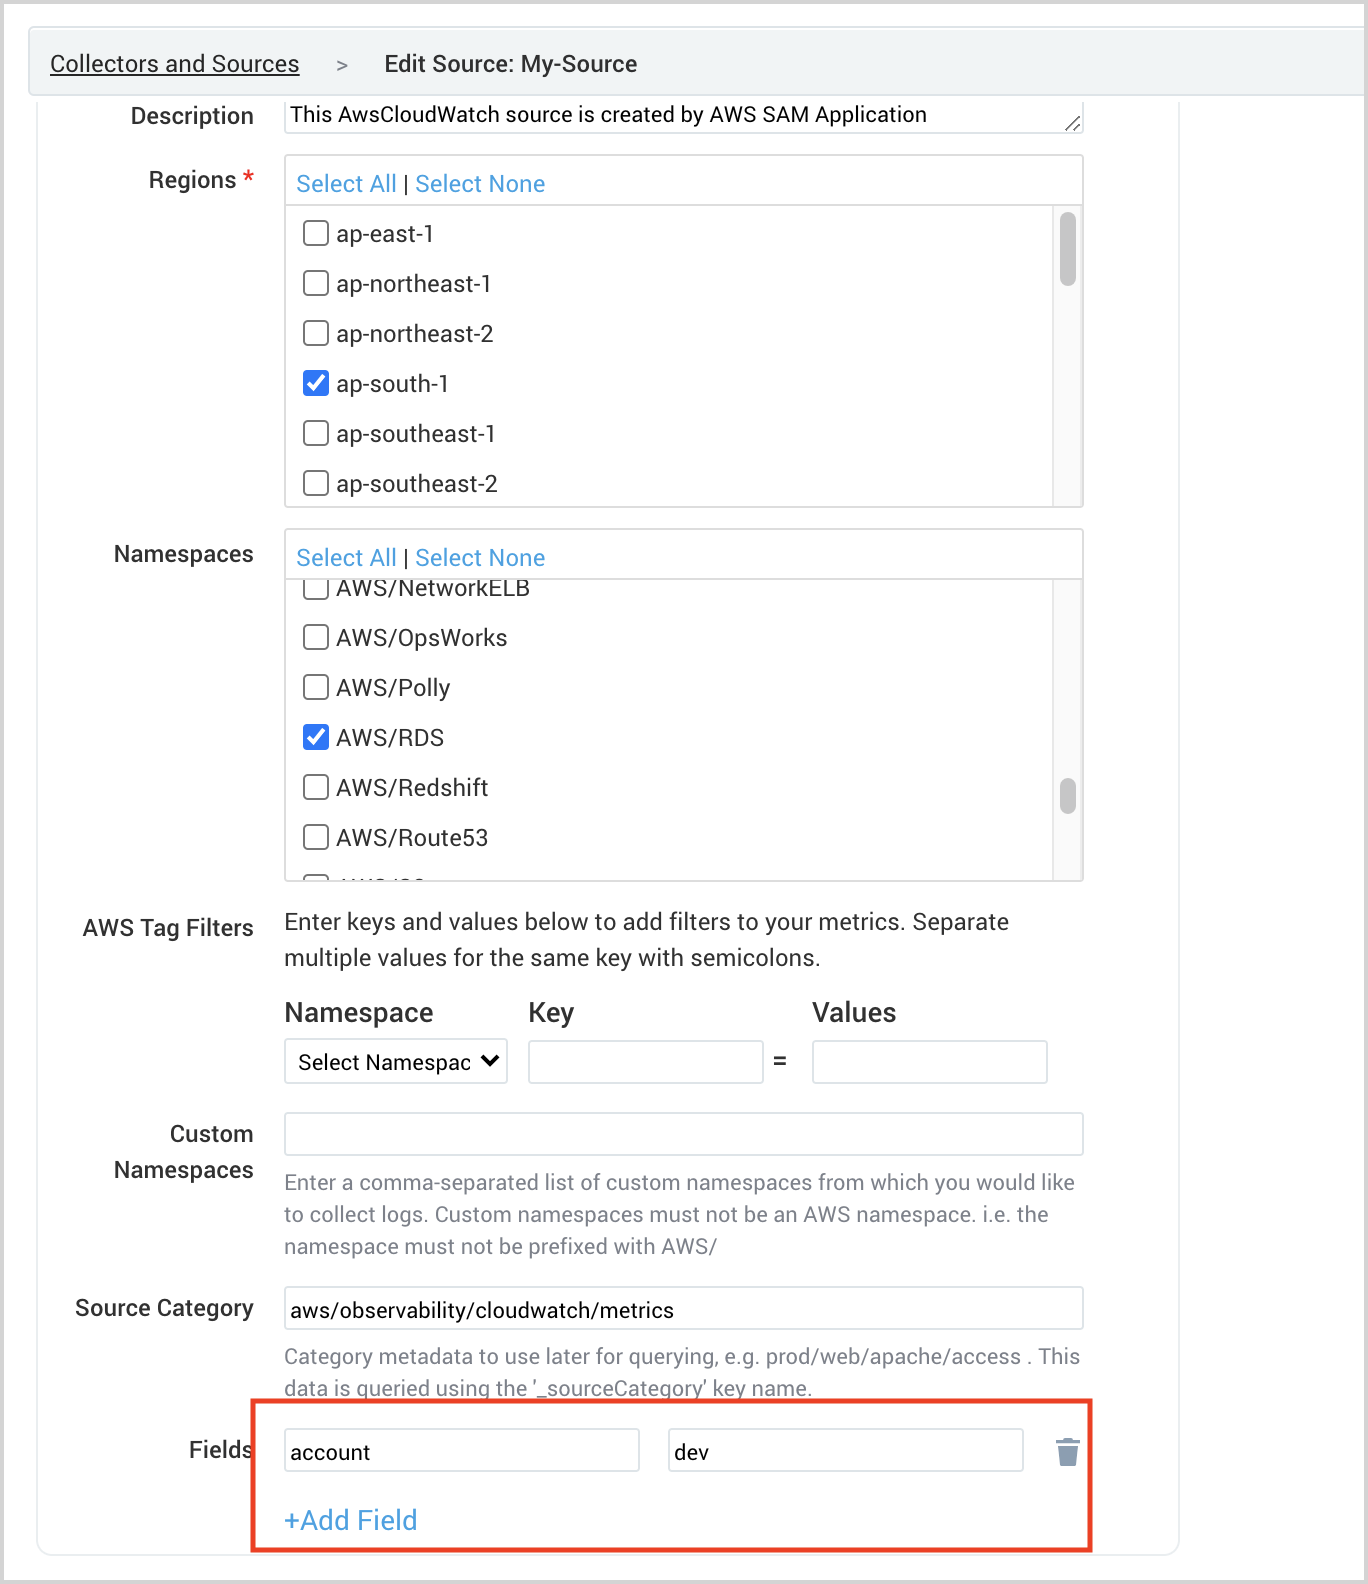
- To confirm if the account tag is indeed added as metadata, go to your Sumo Logic AWS CloudWatch Metric source and check the metrics data.
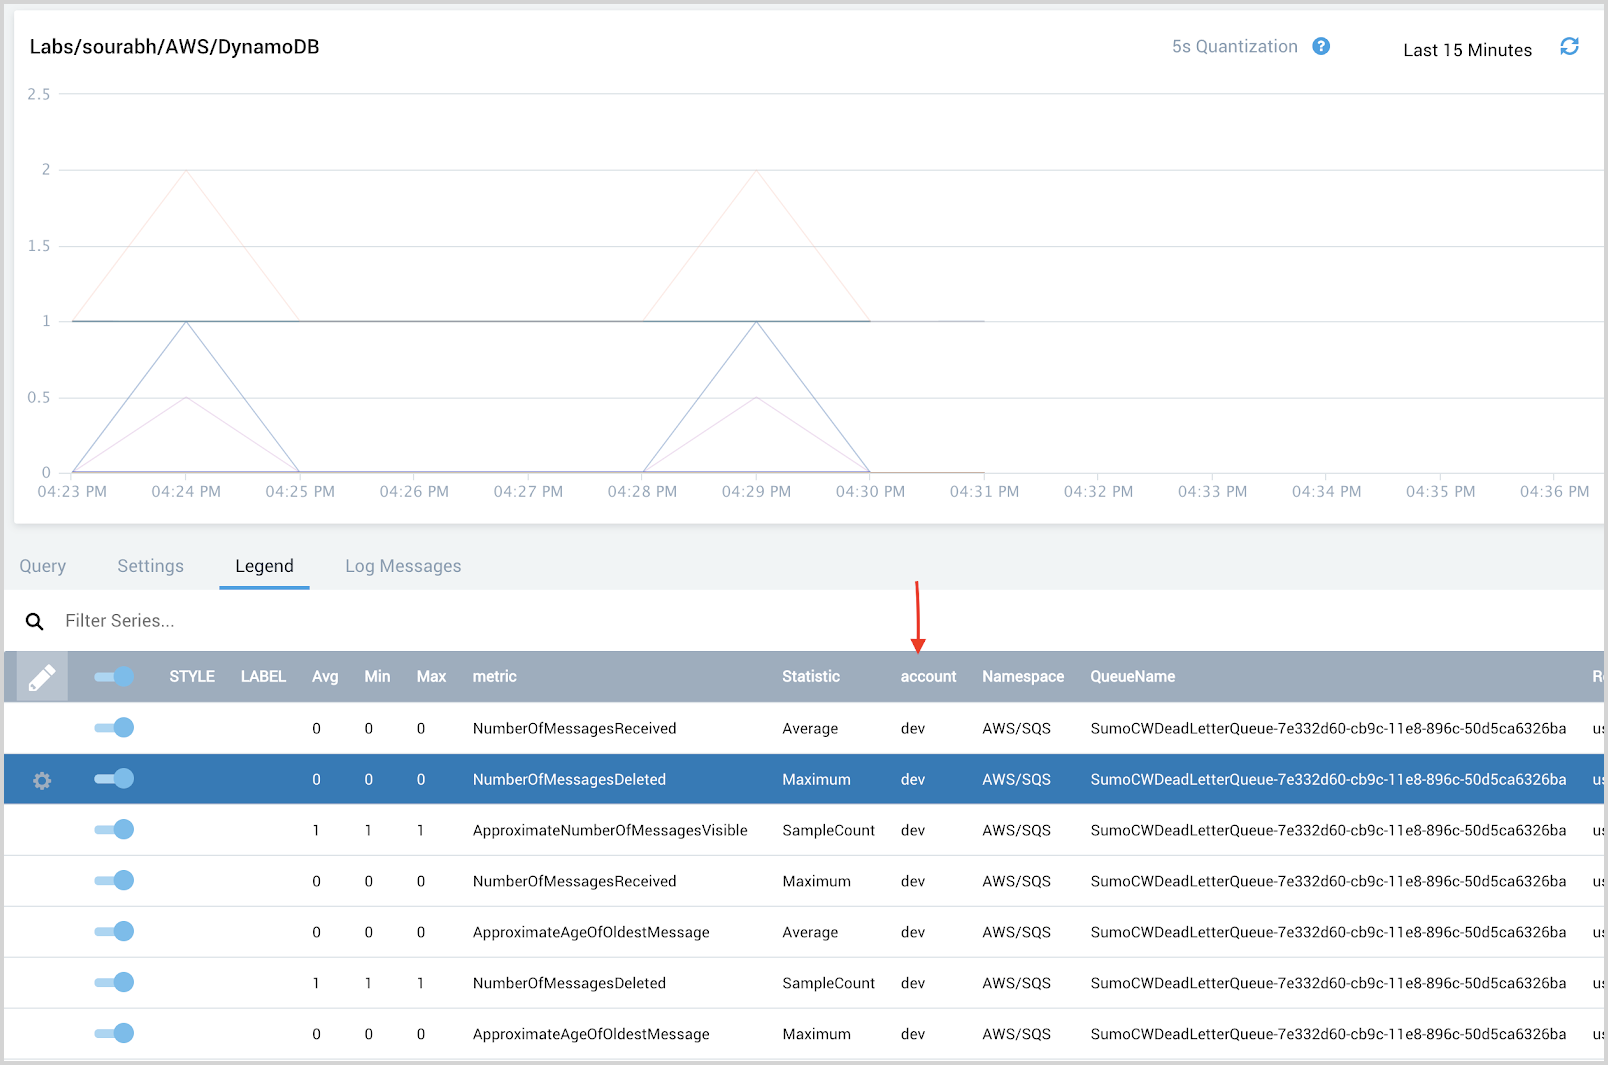
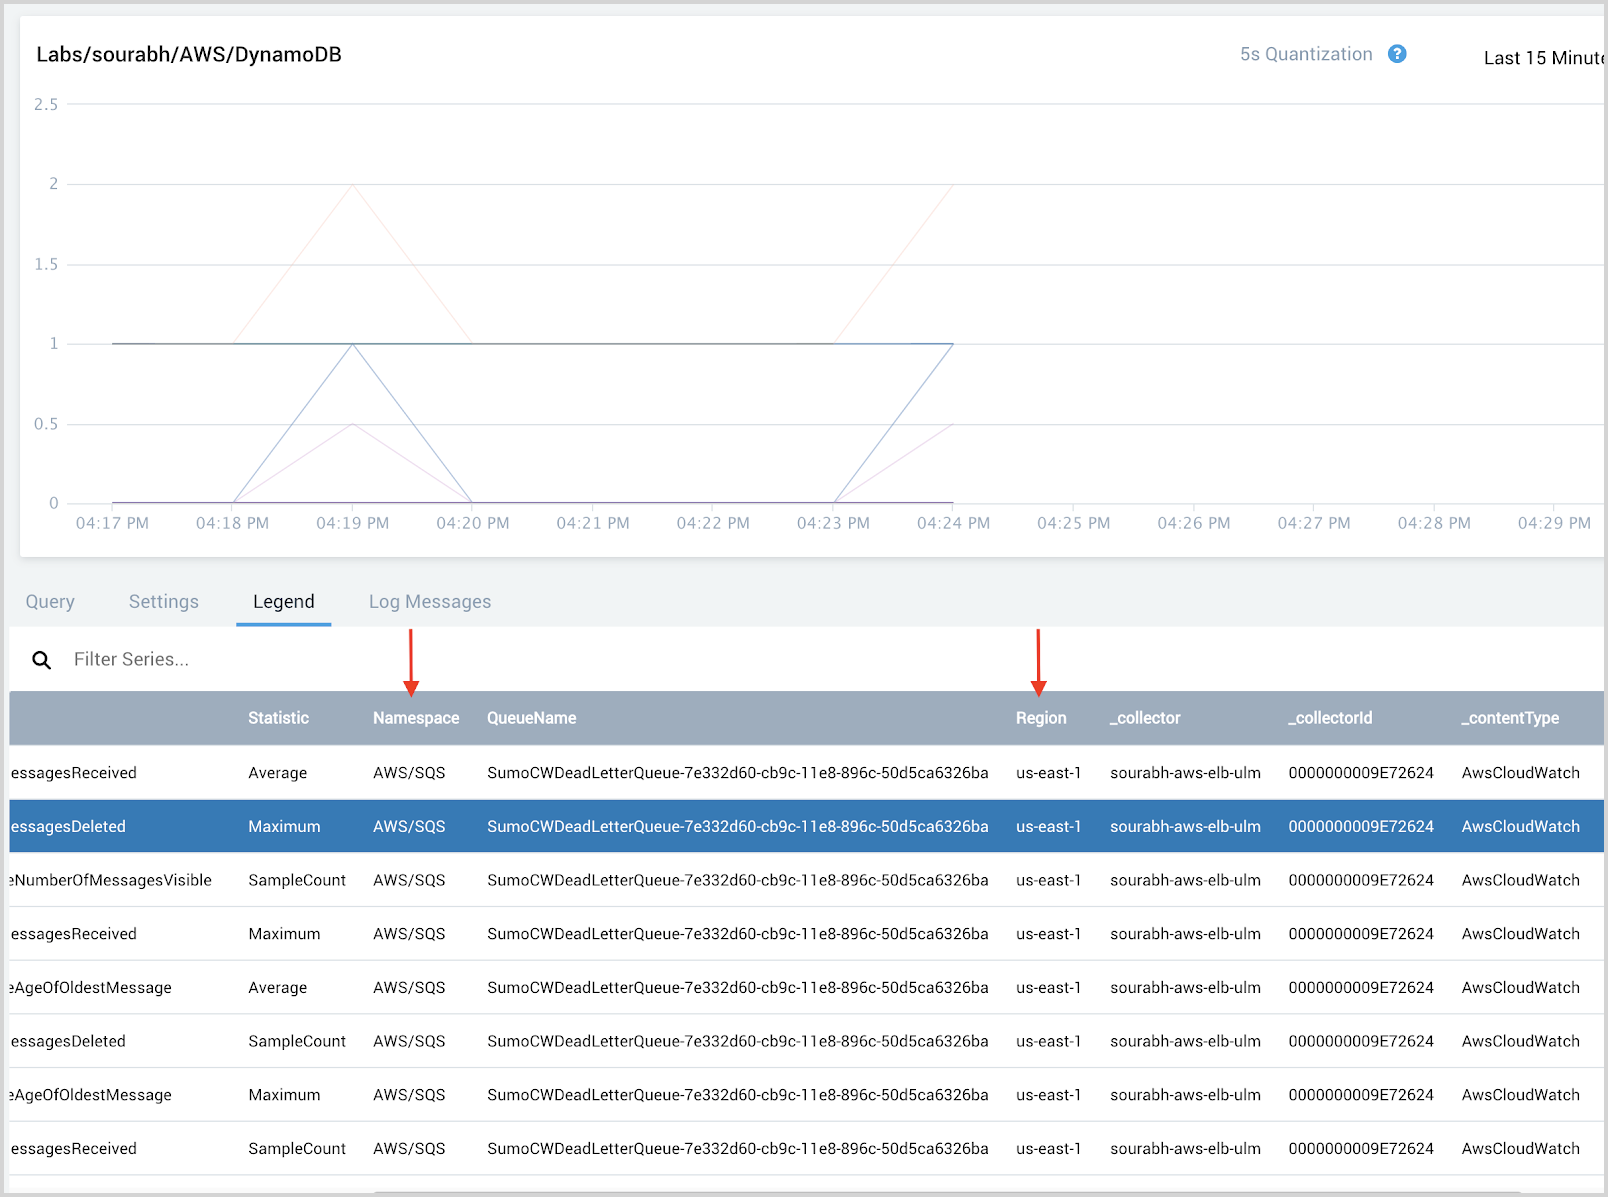
Validate the namespace and region metadata tags
The namespace and region tags are generally present in AWS CloudWatch metrics when collecting metrics using the Sumo Logic AWS CloudWatch metrics source.
For the desired AWS Service, go to your Sumo Logic AWS CloudWatch Metric source and check the metric data.
- Log in to your Sumo Logic account.
- Open a Metrics tab and run a query to get metrics data for the AWS Service you wish to add to AWS Observability.
- Check the data in the Legend tab and ensure namespace and region metadata tags are present. If these are not present, you will not be able to add this service to the AWS Observability solution.
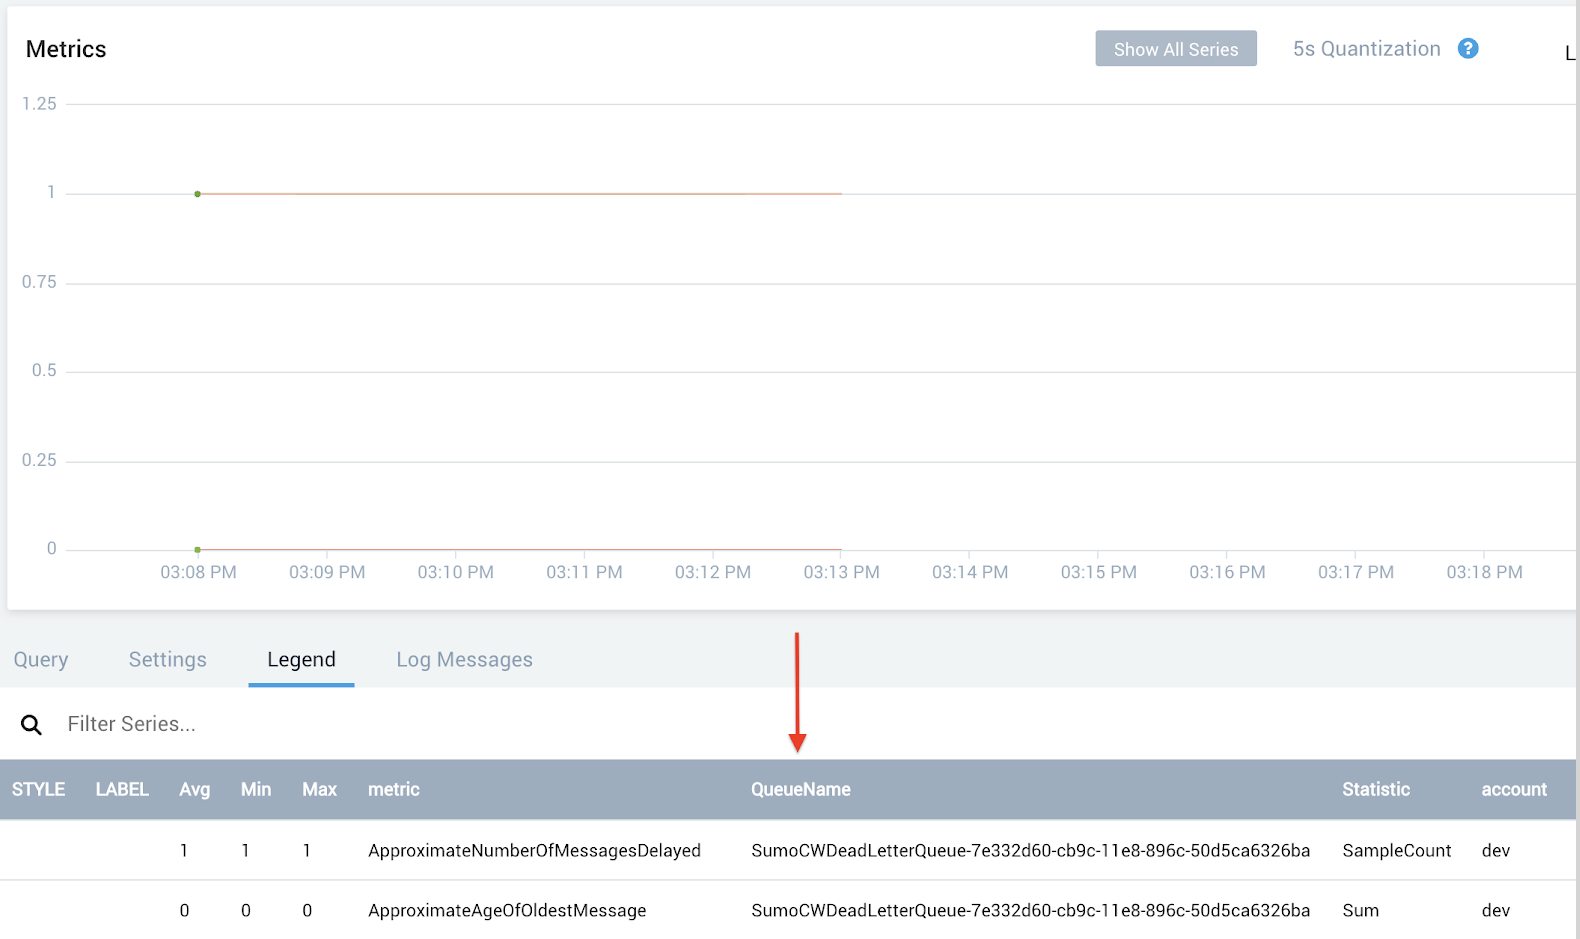
Identify the AWS Resource Name field
An AWS Resource Name metadata field represents an instance of the AWS service like table name, load balancer name, database instanceId, database clusterId, API name, function name etc,. For AWS service you wish to monitor, identify the field in the metrics data that can uniquely represent the AWS service.
For Example, If we wish to monitor AWS/SQS service, then QueueName can be used as the AWS Resource name.
Update the existing hierarchy
Once all the tags are checked and identified in the metrics, we can update the existing hierarchy to show the new AWS Service. Follow the steps below to update the existing hierarchy.
Replace these variables with your own in the code samples in this section:
ACCESS_IDandACCESS_KEY. Replace with your Sumo Logic access ID and access key.SUMOLOGIC_URL. Replace with the API Endpoint URL for your deployment.ID. Replace with the hierarchy ID as present in the JSON output from Step 1 below.JSON_CONTENT_AFTER_UPDATE. Replace with the JSON updated with new AWS service after Step 2 below.
- Run the below curl command to get the existing AWS Observability hierarchy.
The output of the command will look something like below (it is trimmed output, the actual output can vary as per your hierarchy):
curl -s -H "Content-Type: application/json" --user
"<ACCESS_ID>:<ACCESS_KEY>" -X GET
https://<SUMOLOGIC_URL>/api/v1/entities/hierarchies | json_pp
-json_opt pretty,canonical | grep -B 80 "\"AWS Observability\"" |
grep "id" | head -1 | awk -F":" '{ print $2}' | tr -cd '[:digit:]' |
xargs -I {} curl -s -H "Content-Type: application/json" --user
"<ACCESS_ID>:<ACCESS_KEY>" -X GET
https://<SUMOLOGIC_URL>/api/v1/entities/hierarchies/{} | json_pp -json_opt pretty{
"filter": null,
"id": "0000000000000278",
"level": {
"nextLevel": {
"nextLevel": {
"nextLevelsWithConditions": [
{
"condition": "AWS/ApplicationElb",
"level": {
"entityType": "loadbalancer",
"nextLevelsWithConditions": [],
"nextLevel": null
}
},
{
"condition": "AWS/ApiGateway",
"level": {
"nextLevel": null,
"entityType": "apiname",
"nextLevelsWithConditions": []
}
}
],
"entityType": "namespace",
"nextLevel": null
},
"nextLevelsWithConditions": [],
"entityType": "region"
},
"nextLevelsWithConditions": [],
"entityType": "account"
},
"name": "AWS Observability"
} - If the AWS Service namespace is not present in the output JSON, update the JSON as below. We are taking AWS/SQS as an example here.
{
  "filter": null,
  "id": "0000000000000278",
  "level": {
    "nextLevel": {
      "nextLevel": {
        "nextLevelsWithConditions": [
          {
            "condition": "AWS/ApplicationElb",
            "level": {
              "entityType": "loadbalancer",
              "nextLevelsWithConditions": [],
              "nextLevel": null
            }
          },
          {
            "condition": "AWS/ApiGateway",
            "level": {
              "nextLevel": null,
              "entityType": "apiname",
              "nextLevelsWithConditions": []
            }
          },
          {
            "condition": "AWS/SQS", -> Namespace
            "level": {
              "nextLevel": null,
              "entityType": "queuename", -> AWS Resource Name identified in Step 1.3
              "nextLevelsWithConditions": []
            }
          }
        ],
        "entityType": "namespace",
        "nextLevel": null
      },
      "nextLevelsWithConditions": [],
      "entityType": "region"
    },
    "nextLevelsWithConditions": [],
    "entityType": "account"
  },
  "name": "AWS Observability"
} - Update the hierarchy using the below command.
curl -s -H "Content-Type: application/json" --user
"<ACCESS_ID>:<ACCESS_KEY>" -X PUT
 https://<SUMOLOGIC_URL>/api/v1/entities/hierarchies/<ID> -d
'<JSON_CONTENT_AFTER_UPDATE>'
Validate the new Hierarchy
Once you are done with the above steps, the AWS service will be added to the AWS Observability view hierarchy. To validate this:
- Classic UI. Go to the Home screen and select Explore. Then select AWS Observability from the dropdown menu in the upper left.
New UI. In the main Sumo Logic menu, select Observability, and then under Infrastructure Monitoring, select AWS Observability. You can also click the Go To... menu at the top of the screen and select Observability. - You should be able to see the new service in the hierarchy represented by namespace/entity.
Step 2. Enrich Log Data
Add account field to log data
Logs from AWS services are collected into Sumo Logic via Amazon S3, AWS Elastic Load Balancing, Amazon CloudFront, AWS CloudTrail, Amazon S3 Audit, or HTTP Log source (CloudWatch logs). You can add metadata fields to sources using Fields configuration.
Add account field by adding fields to your log source as shown below:
Add the namespace and region metadata tags to log data using Field Extraction Rule
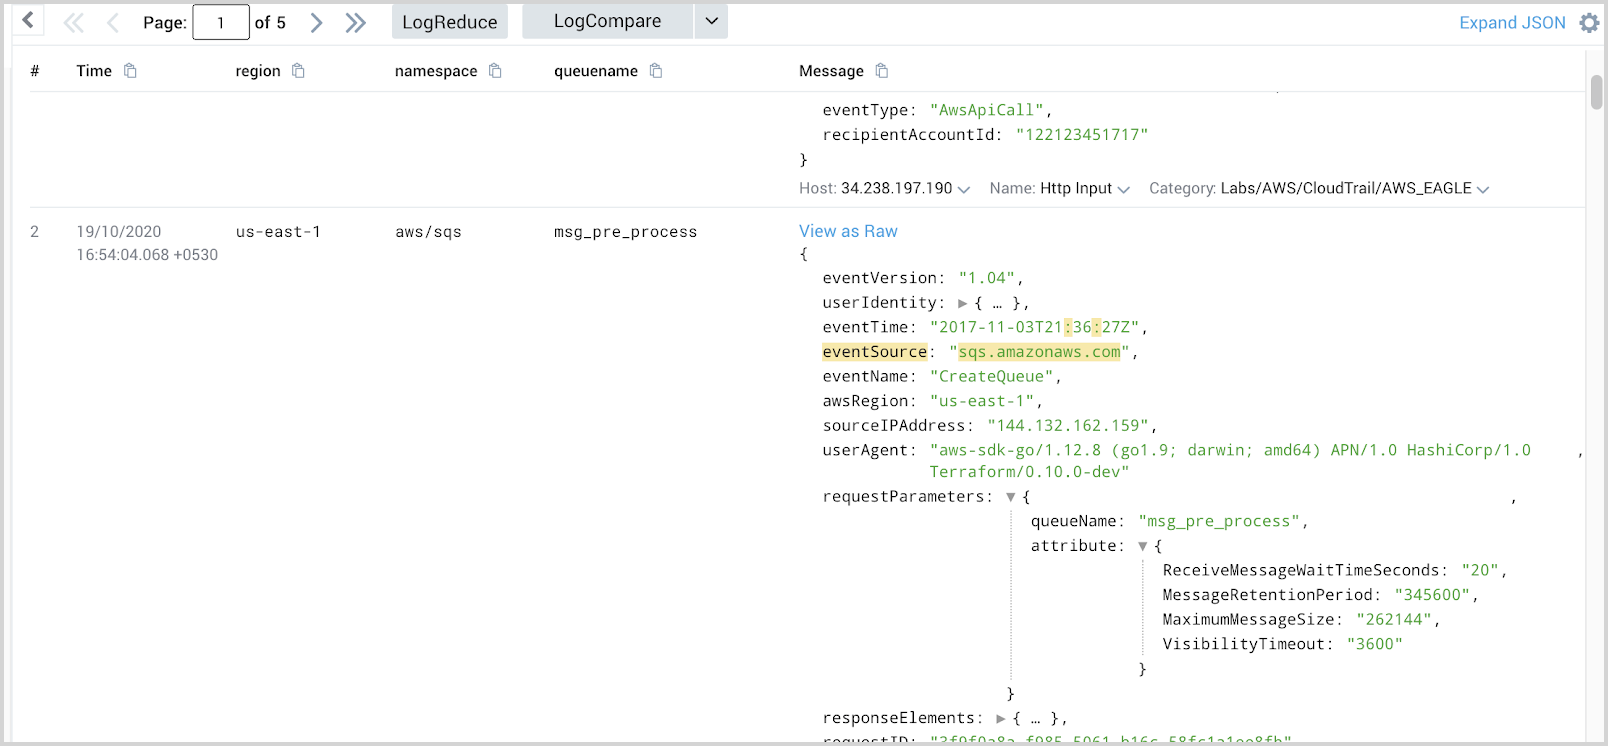
To enrich the logs data with namespace, region, and aws resource name, we will create a Field Extraction Rule that will add metadata to the logs.
We will take AWS/SQS as an example. For SQS, we selected QueueName as our resource name in metrics data. We will create below FER to extract region, namespace, and queuename from CloudTrail logs.
Name: AwsObservabilitySqsFieldExtractionRule
Scope:
(_sourceCategory=aws/observability/cloudtrail/logs "eventSource":"sqs.amazonaws.com")
Parse expression:
json "eventSource", "awsRegion", "requestParameters" as eventSource, region, requestParameters nodrop
| json field=requestParameters "queueName" as queuename nodrop
| where eventSource = "sqs.amazonaws.com"
| "aws/sqs" as namespace
| fields region, namespace, queuename
Depending on different log types, you can create a FER to extract region, namespace, and aws resource name.
Step 3. Modify Dashboards
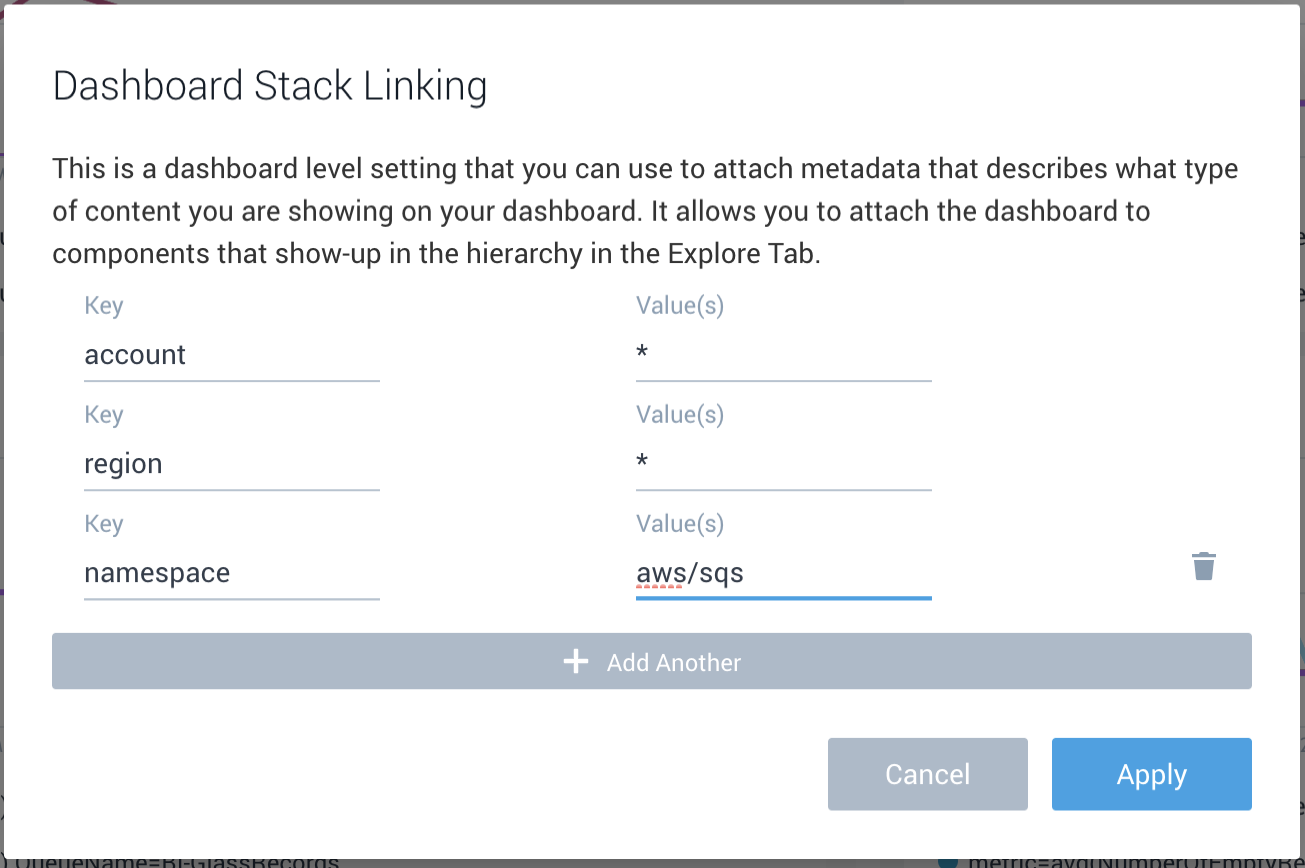
Add Stack Linking to Dashboards
To add any dashboard to the hierarchy, perform the below steps:
- Go to your dashboard in the Sumo Logic account.
- Select Create Stack Linking as per the below screenshot.
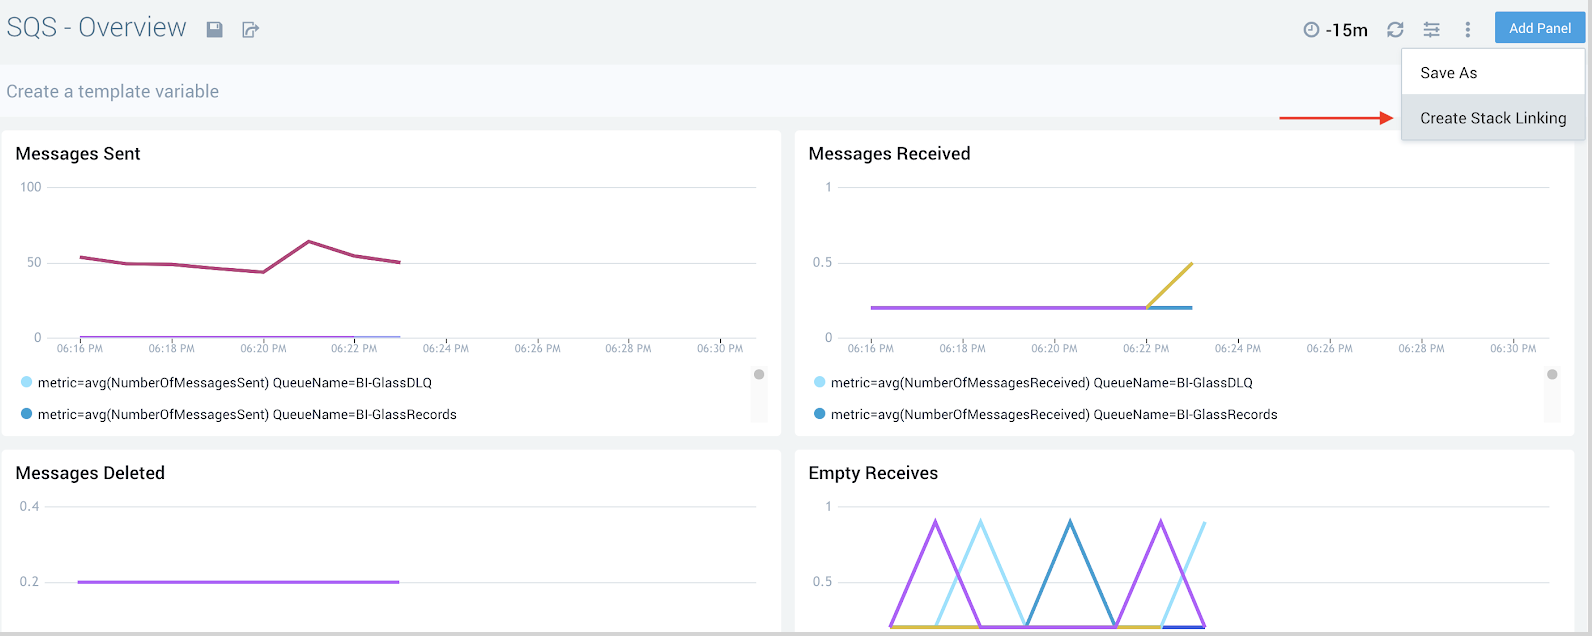
- In the pop-up, add the fields shown below to make it part of AWS Observability in the hierarchy.
- account:
* - region:
* - namespace:
<namespace of aws service>Example for SQS Service provide value as aws/sqs - AWS Resource name: * For example, if you were to use SQS, the Key here will be
“queuename”
- account:
The number of keys added decides the dashboards placement in Hierarchy. For example, if you add account and region in stack linking, dashboards will be present at the region level in the hierarchy.
Consider the example of an SQS dashboard:
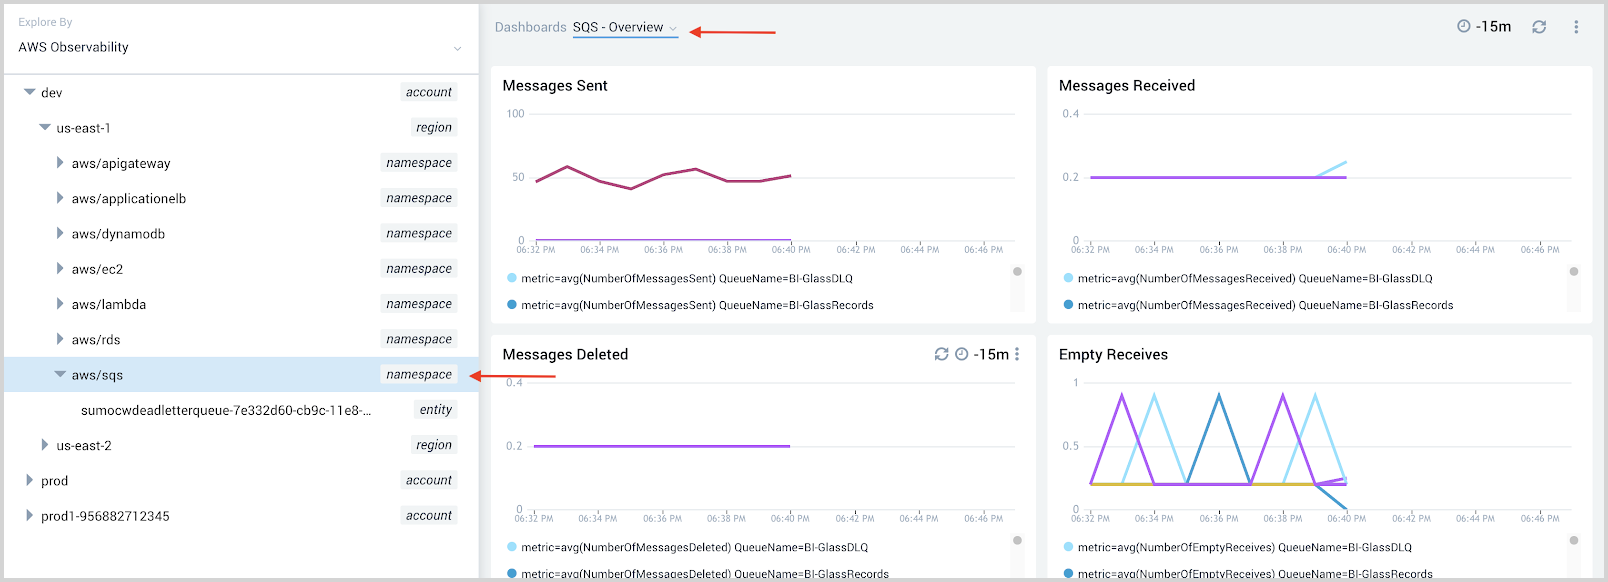
- Add dashboard at the namespace level.
- Add account, region, namespace in stack linking.
- Go to AWS Observability view to look at the dashboard on namespace level.
- Add account, region, namespace in stack linking.
- Add dashboard at queuename level.
- Add account, region, namespace, and queuename in stack linking.
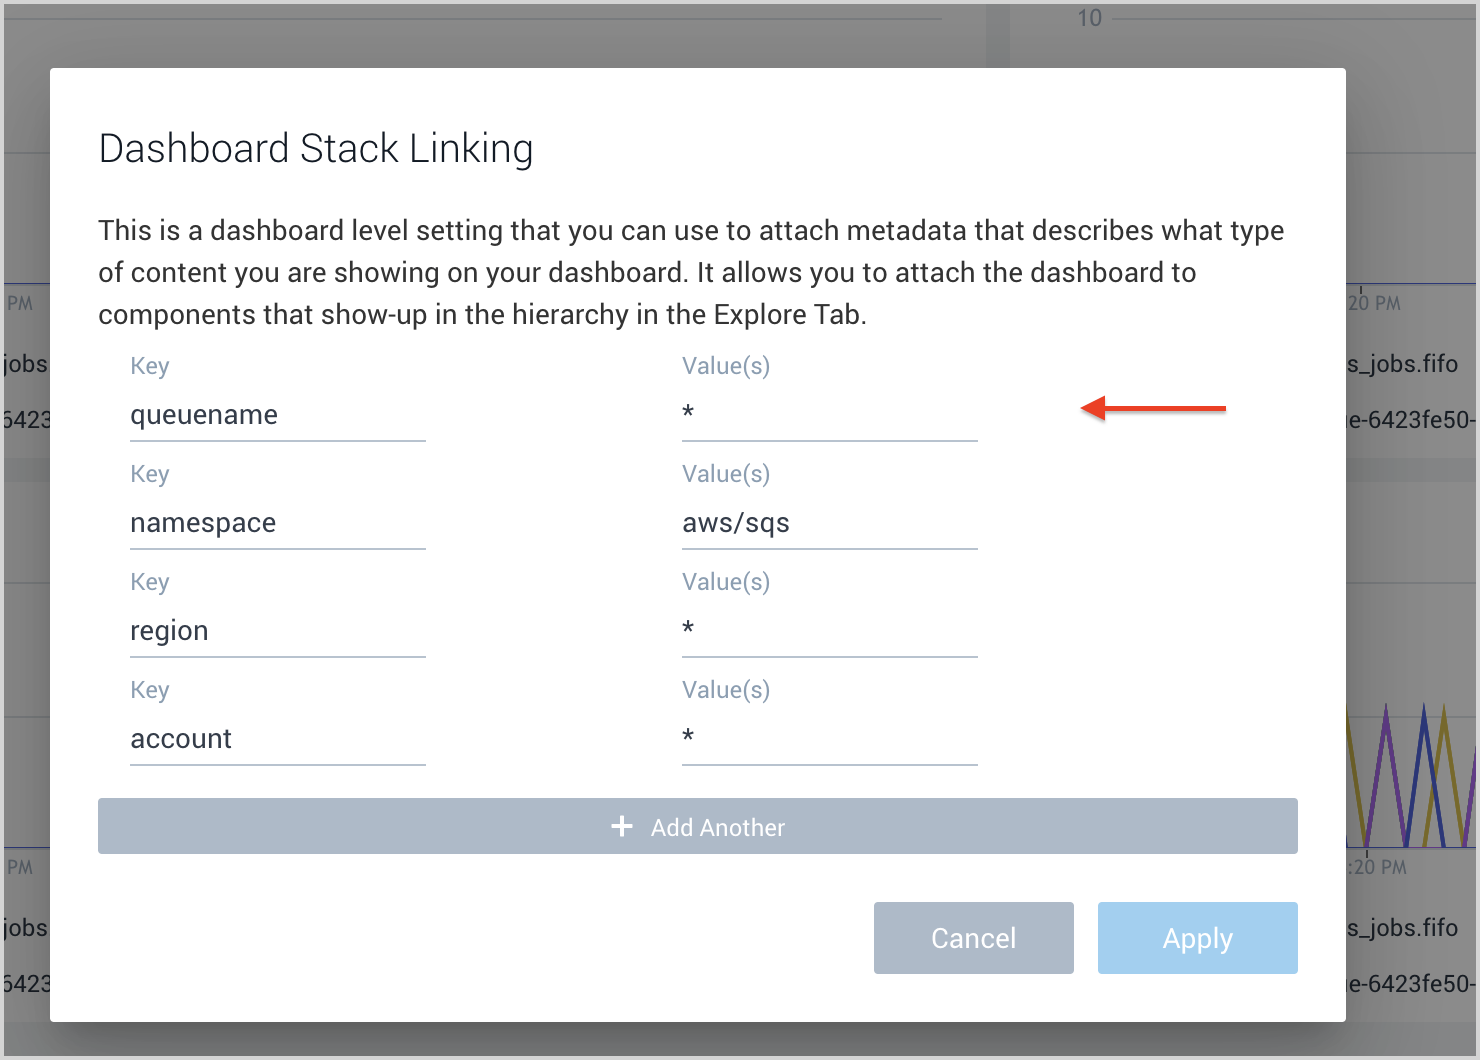
- Go to AWS Observability view to look at the dashboard on queuename level.
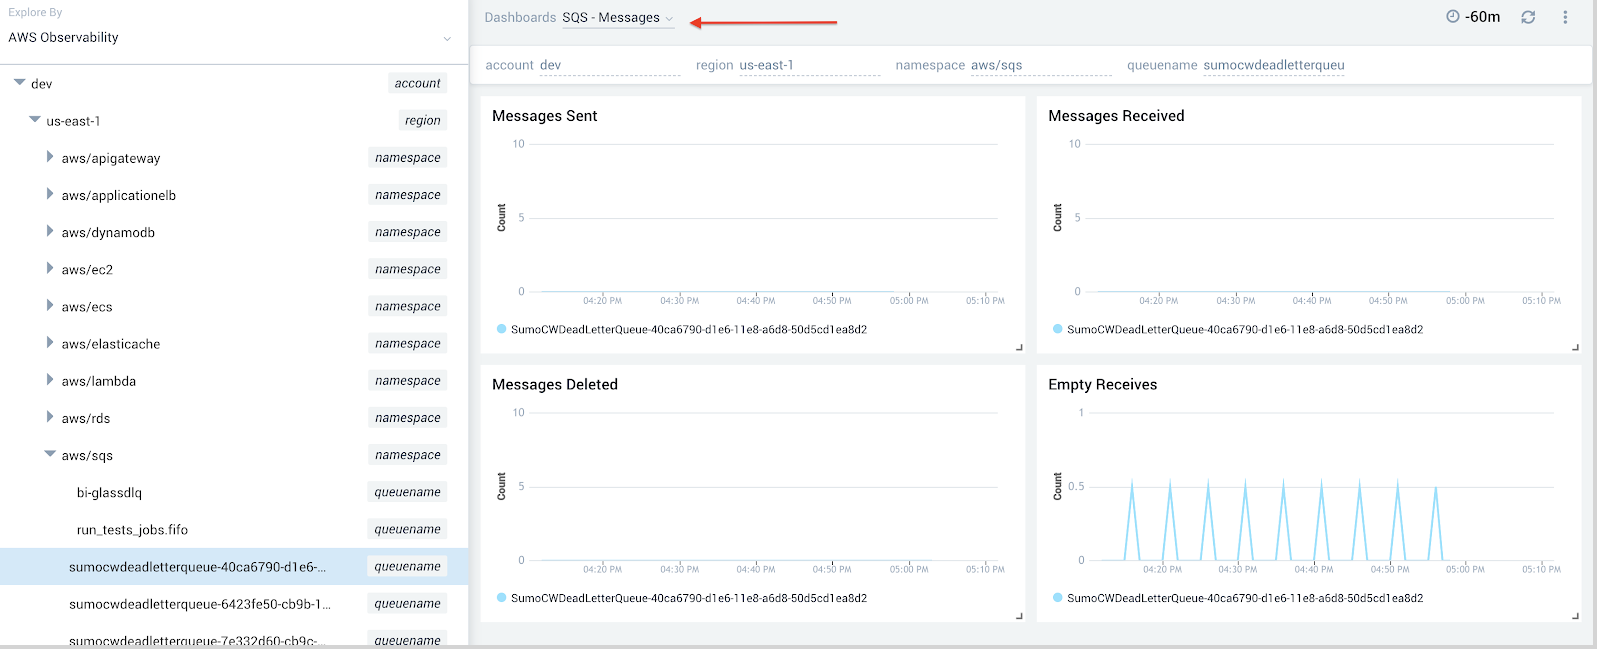
- Add account, region, namespace, and queuename in stack linking.
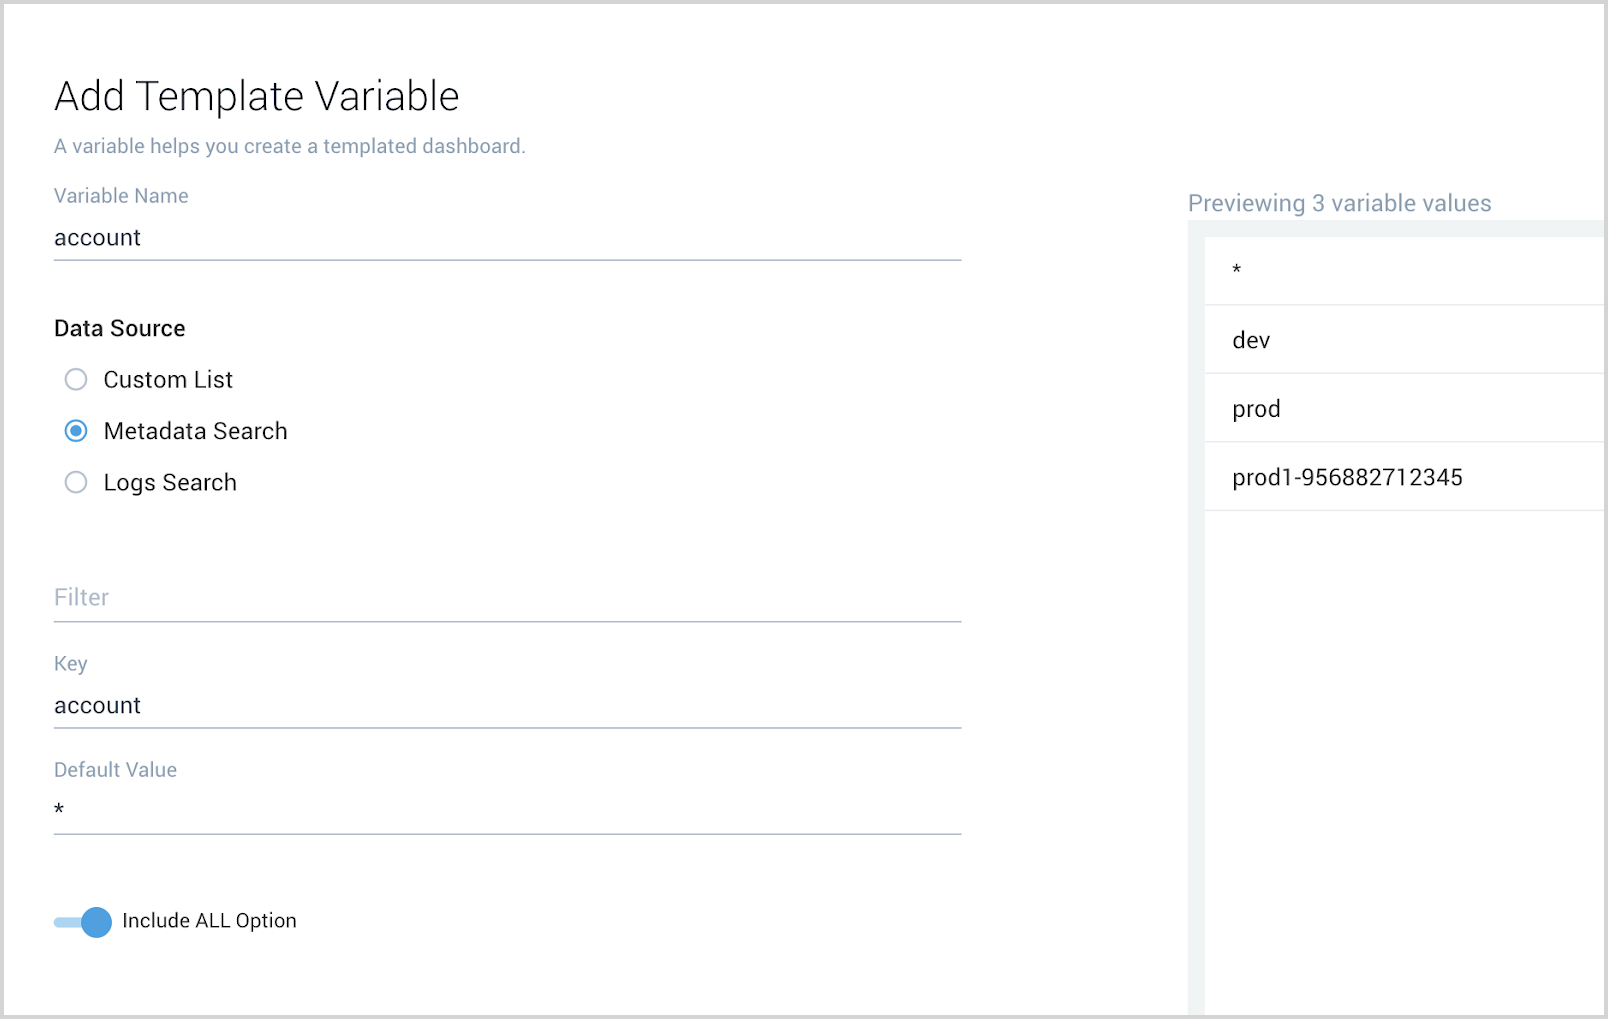
Add Template Variables (Optional)
You can add template variables to dashboards to better filter your data in the AWS Observability view.
Follow the steps to add variables to the dashboards:
- Go to the dashboard.
- Click + button near the Create a template variable text.
- Add a template variable as shown below:
Refer to this document for further details on how to use filters with template variables.
Improve Queries to include variables in log queries (Optional)
Write log queries to include variables so data can be filtered in the AWS Observability view. See the Sumo Logic help doc for details on how to use template variables in log queries.
For example:
account={{account}} namespace={{namespace}} region={{region}} queuename={{queuename}} “sqs.amazonaws.com”
| json "eventName", "awsRegion", "requestParameters.queueName", "sourceIPAddress", "userIdentity.userName" as event_name, Region, queuename, src_ip, user
| count by event_name
Improve queries to include variables in metrics queries (Optional)
You can add the created template variable to queries to better filter the data. Please see this document help doc for details
You can add a variable to your queries by using
<key name> = {{variable name}}
For example:
namespace=aws/sqs metric=NumberOfMessagesSent
account={{account}}  region={{region}} queuename={{queuename}} | avg by QueueName, account, region, namespace