Troubleshoot with Kubernetes Views
Kubernetes views allow you to quickly locate the object in a physical stack that needs to be debugged. This page walks you through a high-level troubleshooting scenario to illustrate the possibilities.
Step 1: Analyze a cluster
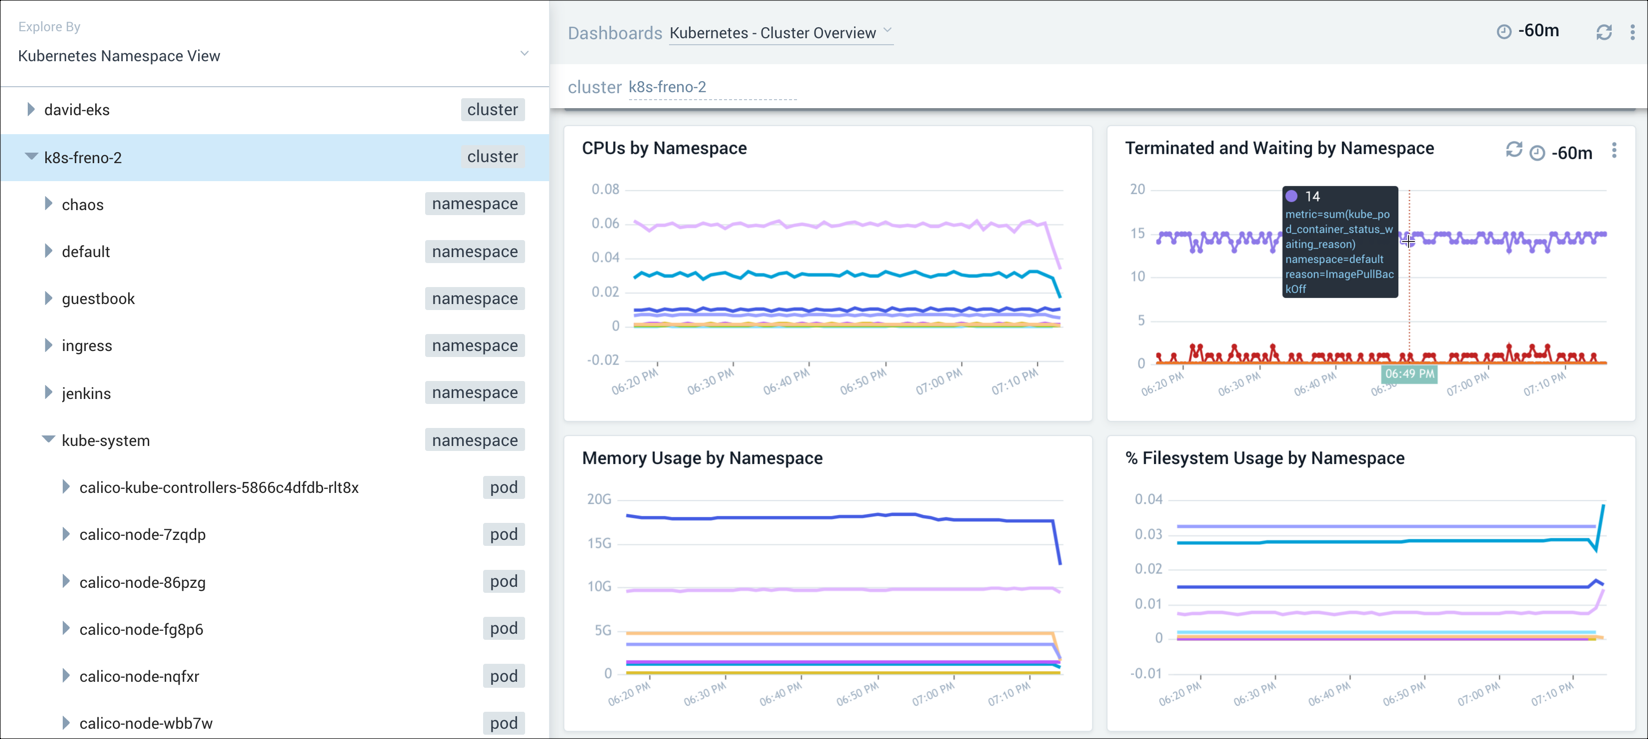
We suspect there's a problem with a Kubernetes cluster, but aren't sure where. As a result, we begin by analyzing the Cluster Overview dashboard. Everything that is running on the cluster is shown on this dashboard. The Terminated and Waiting by Namespace panel allows us to easily comprehend the failure states of the namespaces. This allows us to easily see if there are configuration issues or overall administration issues that need to be addressed.
Step 2: Explore a namespace
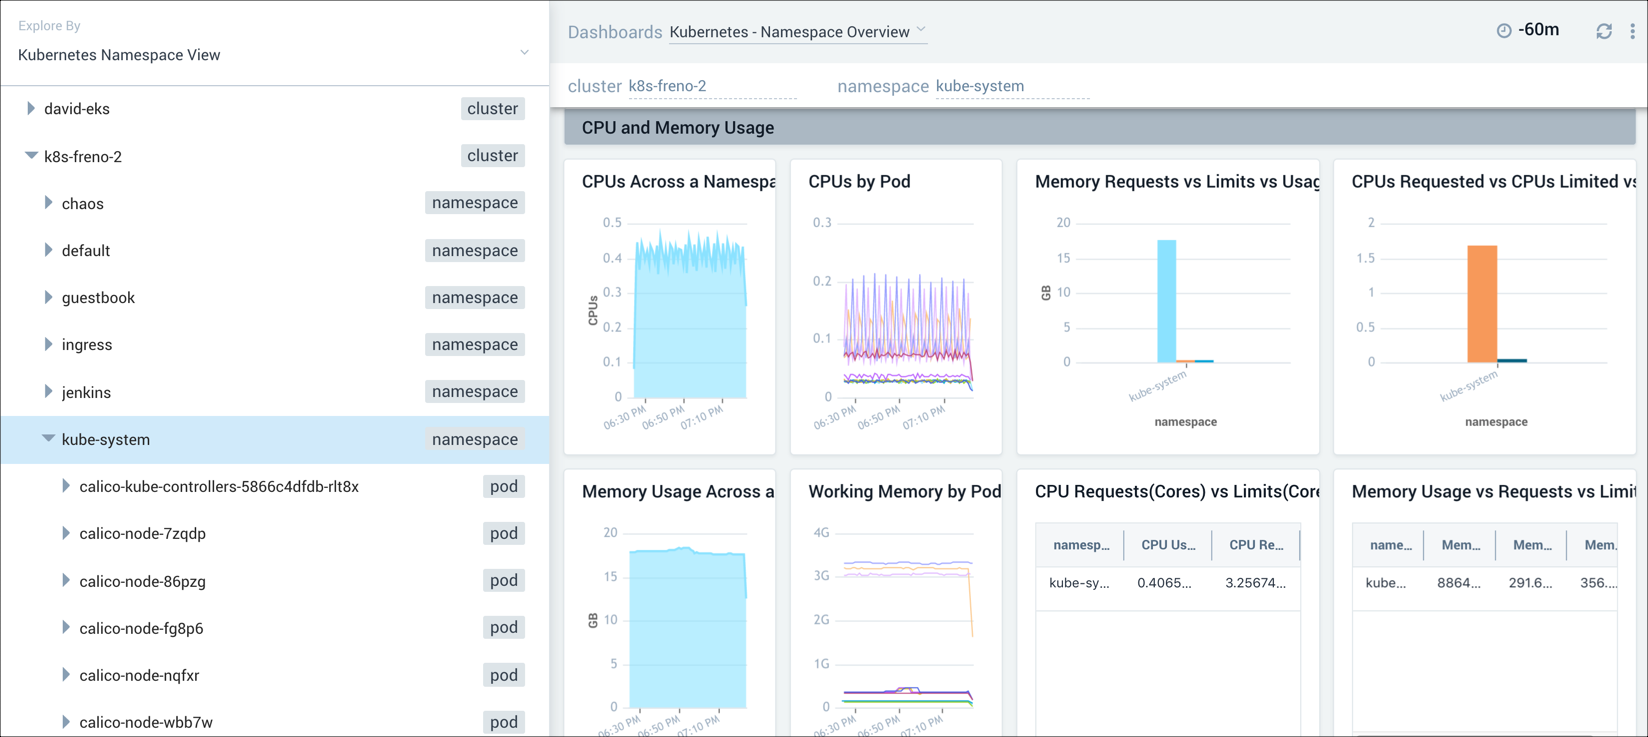
To further pinpoint the problem with our cluster, we investigate the namespace by selecting kube-system in the navigation panel, and then switch to the Namespace Overview dashboard. This dashboard provides information on pods that are running in the deployment, failed pods, errors, CPU and memory usage, file system usage, terminated and waiting pods, and containers. In this example, we focus on the CPU and memory usage panels of the dashboard in our attempt to find out where our application is running into problems.
Step 3: Drill down into a pod
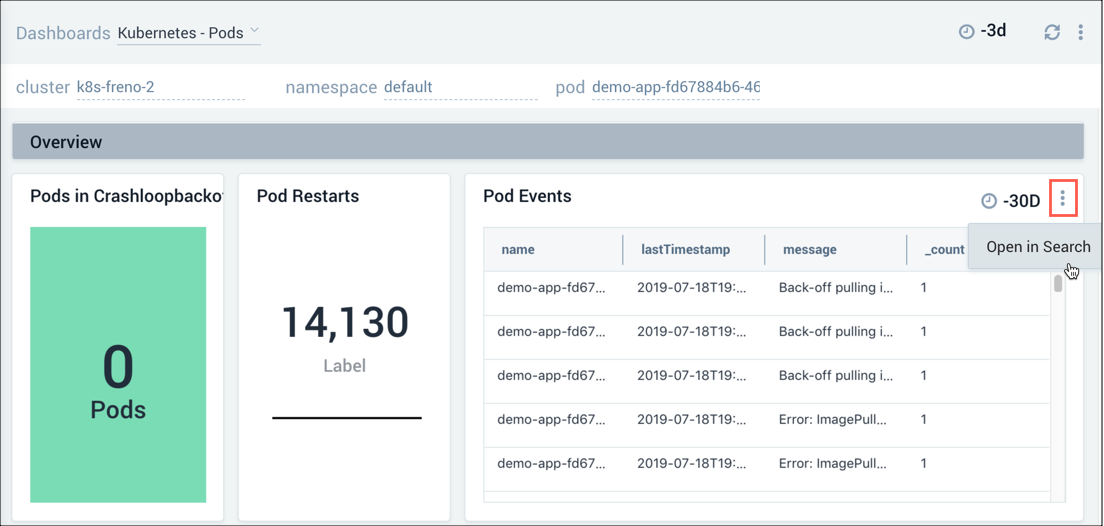
Once we've determined which pod is having problems, we can drill down into the pod for more granular data. For example, we can select the Details icon for a panel to view that data in a search, or review the actual logs in the Log Stream panel.
Troubleshooting walkthrough - Pod-level authentication
In this troubleshooting scenario, we detect a problem with a cluster while navigating our Kubernetes environment. To determine what's causing the problem, we drill down and investigate the log stream to uncover an authentication problem where an access key was disabled and deleted. Further analysis of a sequence of logs allows us to determine the root cause of the problem and establish preventative measures for such occurrences going forward.
To troubleshoot a problem with our cluster, we performed the following steps:
- Classic UI. We went to our Home dashboard and selected Explore.
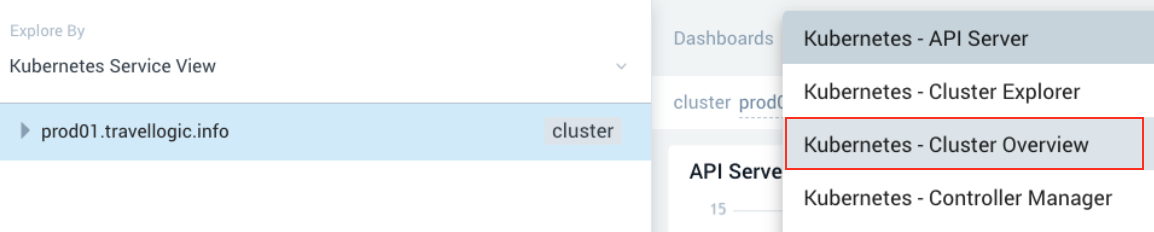
New UI. In the main Sumo Logic menu, we selected Observability, and then under Infrastructure Monitoring, we selected Kubernetes. - In the upper-left corner of the screen, we selected Kubernetes Service View, then chose the cluster we wanted to explore, and selected the Dashboards Kubernetes - Cluster Overview option on the upper right menu bar.
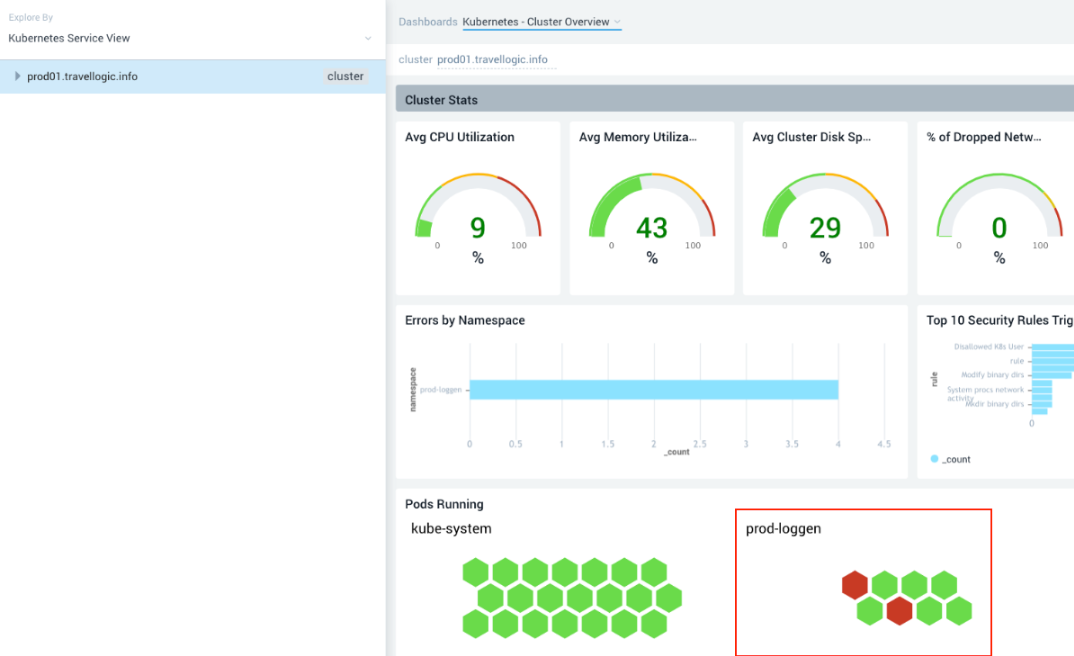
The Dashboards view on the right displays panels that show the statuses of the clusters. - In our scenario, we selected the prod-loggen namespace in the Pods Running panel and discovered 2 pods that were not functioning (shown in Red).
- We hovered our cursor over one of the failed pods for a detailed view of the failed services.
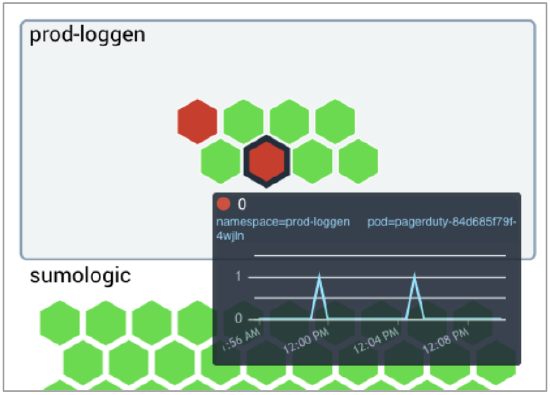
In our scenario, we focused on PagerDuty pod and made a note of the pod name, including the last 5 characters that follow the hyphen (in this example we are looking at pagerduty-84d685f79f-4wjln). Pods are ephemeral and the characters after pagerduty- constantly change, so it's important to make a note of them for further investigation. - To find out more, we went back to the Explore By menu at the top left and selected Kubernetes Namespace View, clicked the arrow to the left of prod01.travellogic.info to view the contents, then selected
prod-loggen > pagerduty-*-*(suffix matching the pod name we noted in the previous step) to view the pods and containers.
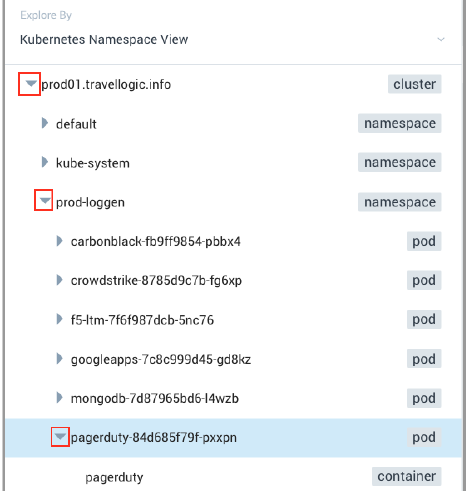
The data for our selection displayed in the dashboard panels on the right.
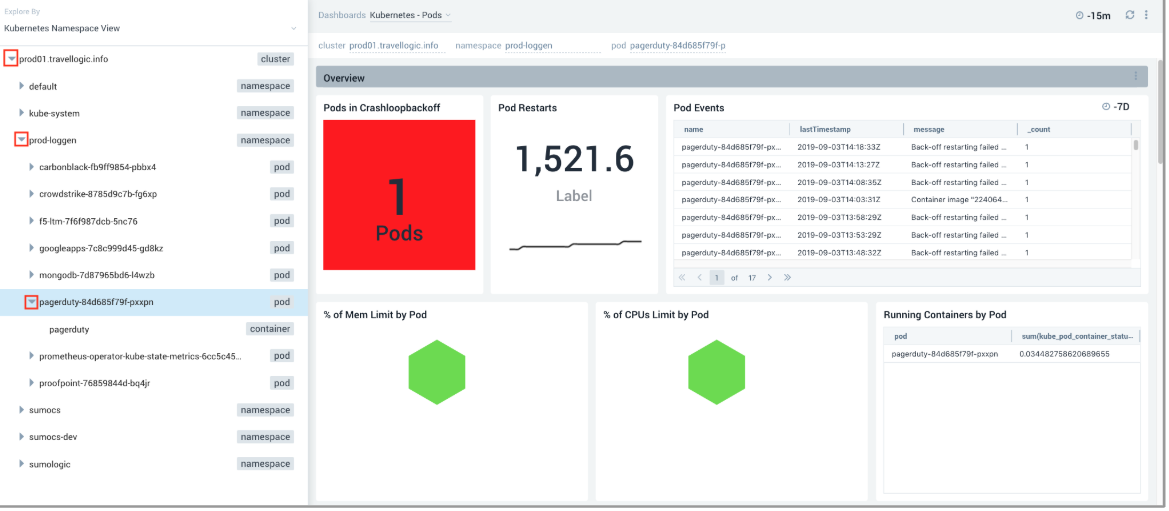
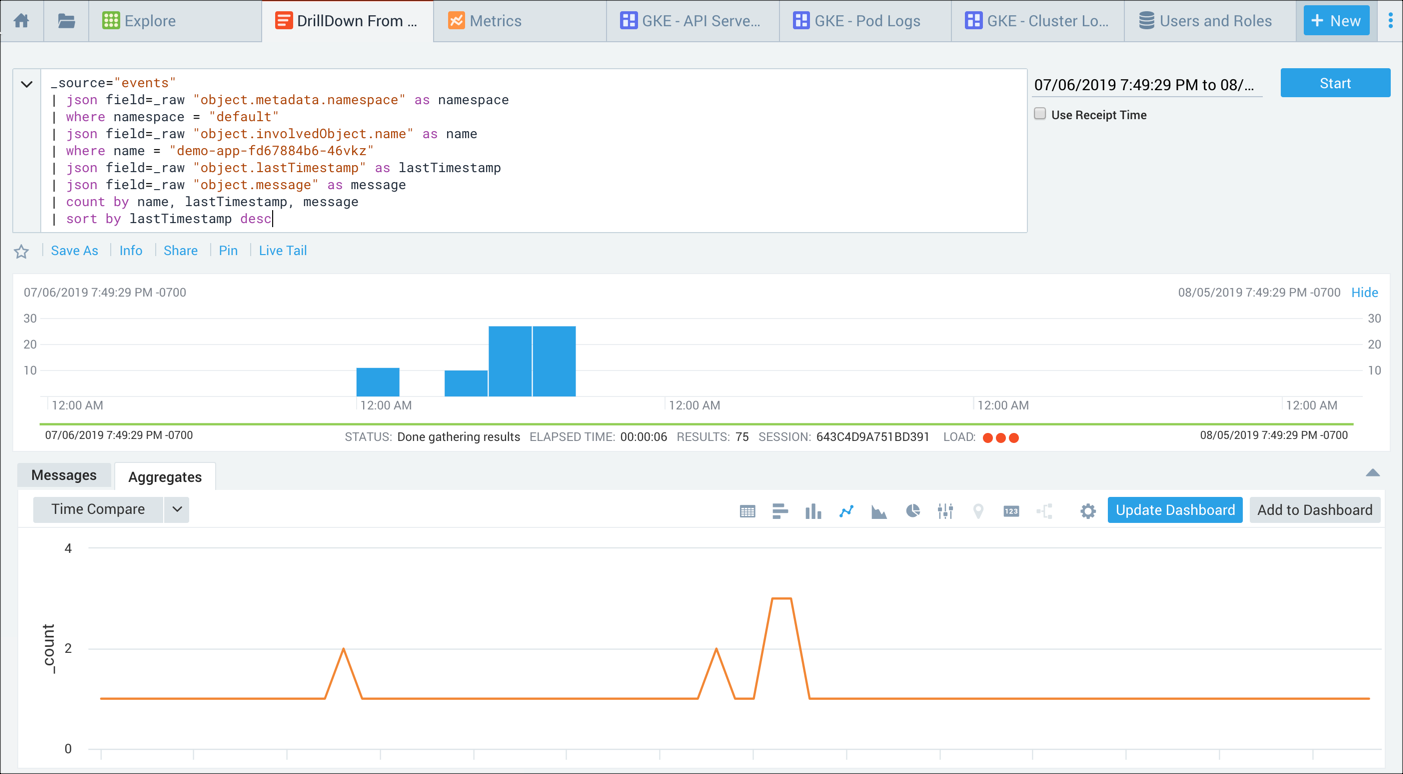
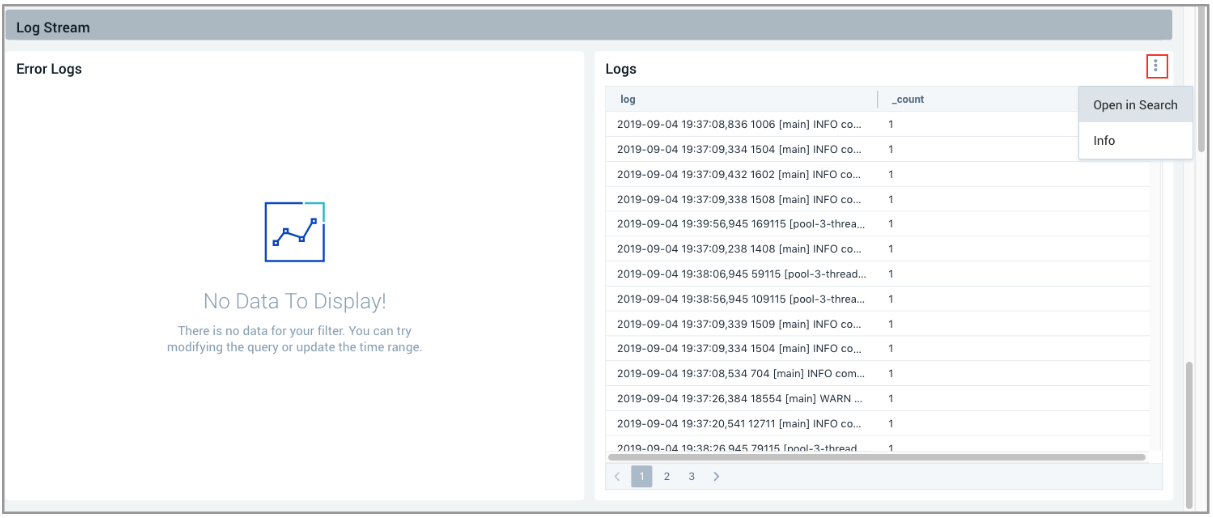
- We scrolled to the bottom of the page to Log Stream to view the logs generated by PagerDuty, then clicked the Details icon (3 dots) on the top right and selected Open in Search.
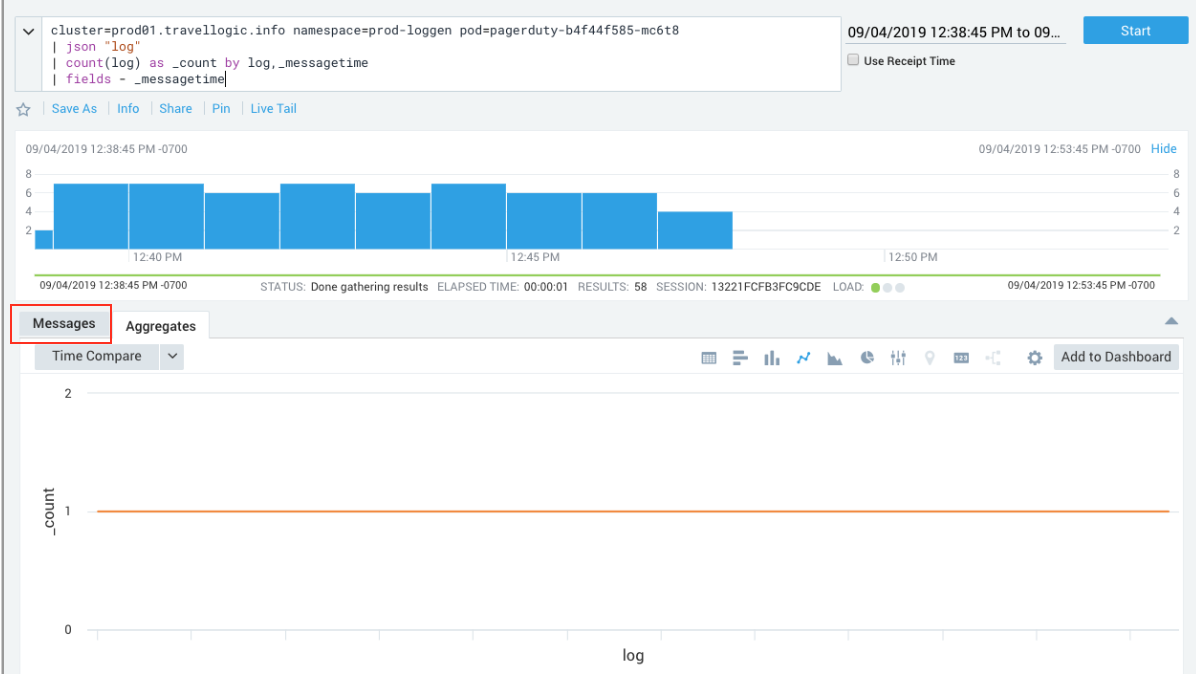
- The Aggregates view displays by default, so we clicked the Messages tab to analyze the log messages.
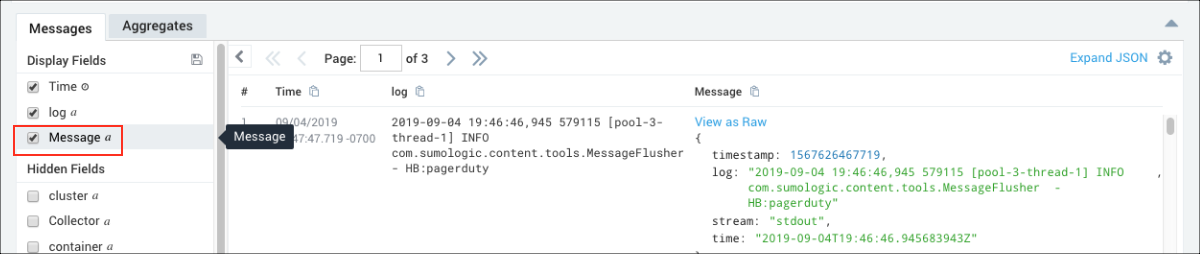
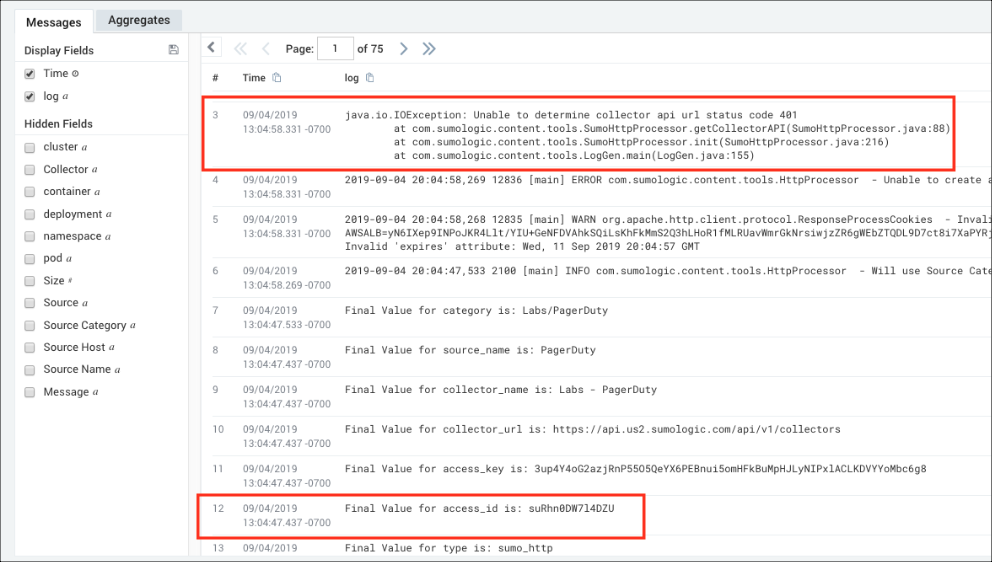
- To further isolate the data we're looking for, we unchecked Message in the left navigation panel. We had parsed the log message so as to leave out the message field, allowing us to view log messages that are easier to understand so we can focus on the parsed log metadata.
- We want to focus on two messages to pinpoint the authentication problem. The first message shows a java.io.IOException and contains an HTTP status code 401 related to authentication. The second message shows the access_id used for the authentication. To isolate this further, we highlighted the access_id, suRhn0DW7l4DZ, right-clicked and selected Copy Selected Text.
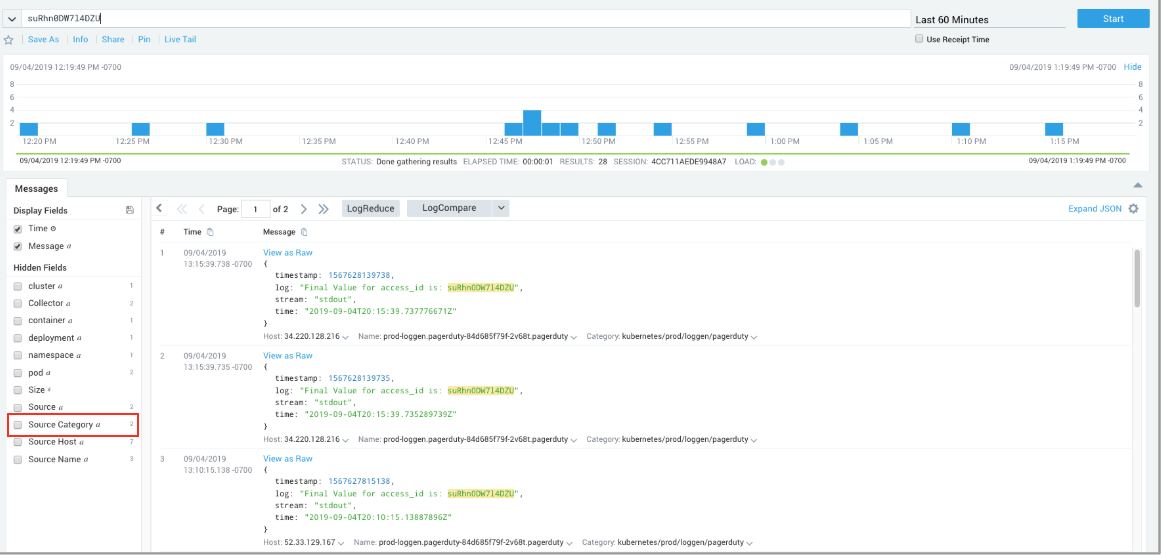
- To search for the keyword suRhn0DW7l4DZU, we went to our Home page and selected Log Search from the dropdown menu, changed the time interval to the Last 60 Minutes, then pasted the access_id keyword suRhn0DW7l4DZU in the query window and clicked Start. To view the logs retrieved from 2 Source Categories, we went to Hidden fields on the left and clicked Source Category.
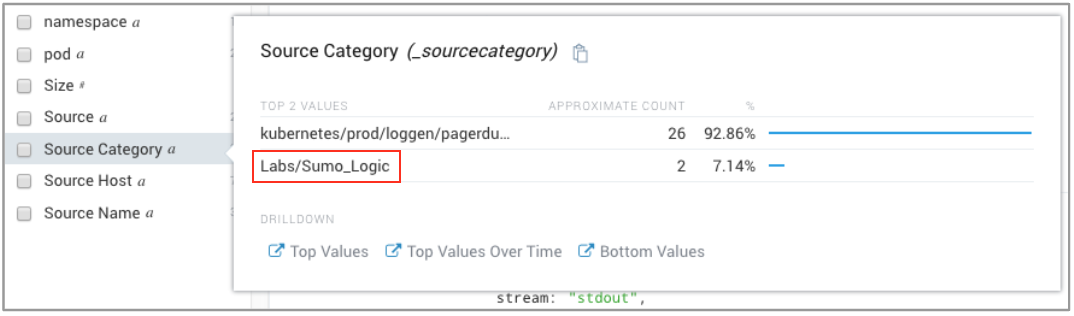
- We noticed that the Labs/Sumo_Logic only had a couple of messages. This caught our attention, because root cause items occur less frequently. To investigate further, we highlighted and select the Labs/Sumo_Logic Source Category.
We discovered evidence that the access key suRhn0DW7l4DZU was disabled and deleted, but were only viewing logs that contained the access_id, which was too limiting for a decisive conclusion of what caused the root problem. To get a better understanding of what occurred, we wanted to look at other messages that happened around the same time of the access key deletion and disablement. - We clicked Category Labs/Sumo_Logic and from the dropdown chose Surrounding Messages and +/- 1 Minute to view the other log messages that occurred before and after.
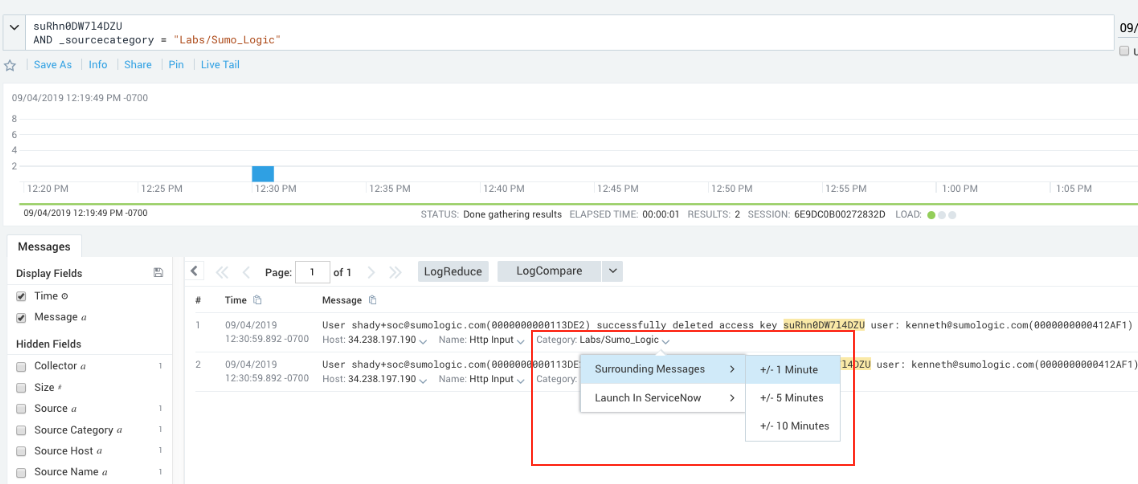
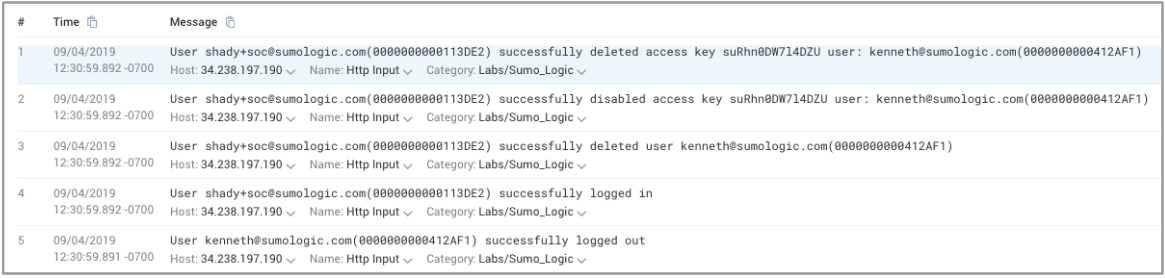
There were 5 messages that revealed what happened, reading the lines from the bottom to the top to discover the sequence of events leading up to the root cause of the authentication problem:- Line 5: User kenneth logs out.
- Line 4: User shady+soc logs in.
- Line 3: User shady+soc deletes user kenneth.
- Line 2: Deleting user kenneth disables his access keys.
- Line 1: Deleting user kenneth also deletes his access keys.
Conclusion
It turned out that admin shady+soc deleted the Kenneth user, which also disabled and deleted Kenneth's access key. Kenneth's access key was used to authenticate with PagerDuty, but after it was deleted the service couldn't authenticate and the authentication failed, as we saw in the Pod view.
After further investigation, we discovered that Kenneth left the company and was off-boarded by shady+soc. The authentication problem could've been avoided if shady+soc had contacted Kenneth's manager prior to deleting his user account to verify if Kenneth had any active keys associated with his account, or had he scanned for active keys associated with Kenneth's user account.