Reliability Management (SLOs/SLIs)
A reliable end user experience is the key goal for observability. In complex systems, apps, service, and infrastructure can fail in unpredictable ways, resulting in a storm of potentially meaningless alerts. Reliability, as formalized in Service Level Objectives (SLOs), helps developers focusing on monitoring and troubleshooting user experience by measuring what matters to end users.
This guide provides an overview of Sumo Logic Reliability Management using Service-Level Objectives (SLO). This feature helps site reliability engineers (SREs) and product teams define and monitor SLOs through alerts and dashboards.
Prerequisites
To work with SLOs, you need the following Sumo Logic capabilities: View SLOs (viewSlos) and Manage SLOs (manageSlos permissions).
Terminology
Reliability is essentially the uptime of systems and services. This includes the following concepts:
Service-Level Objective (SLO). The software provider's performance promise made to end users. This goal defined by the SLI for a compliance period.
Service-Level Indicator (SLI). Quantitative measurements of a system/service availability within a specific time period. These performance figures are used to determine that the SLO — the quality promised to end users — is being met.
Error Budget. The tolerable amount/level of system unavailability in the compliance period.
Compliance period. The duration of time used to monitor and score your system/service availability. Breaking down your organization's quantitative success rate over consistent time periods is useful internally and can be communicated to customers that you're meeting your goals. See the following information for the max compliance period:
| Logs-based SLO | Metrics-based SLO | |
| Maximum compliance period | Rolling compliance: 90d. Calendar compliance: 1 Quarter | Rolling compliance: 90d. Calendar compliance: 1 Quarter |
| Threshold-based SLO definition | Supported for window- and request-based evaluation | Supported for window-based evaluation only |
As an example, let's say an eCommerce app considers its checkout service transactions to be successful (good) when completed in less than 500ms. A successful five-minute (5m) time window may be one in which the p99 of latency is less than 500ms.
The SLI can be defined as the percentage of successful 5m windows in a compliance period of 30 days (30d) or equal to 99.9% for any month. The number of unsuccessful (bad) transactions we allow as an error budget is 0.1% of these 5m windows in 30d.
The following chart shows our calculations and an example 5m window for the month of January where a number of requests were unsuccessful due to completions that were greater than 500ms:
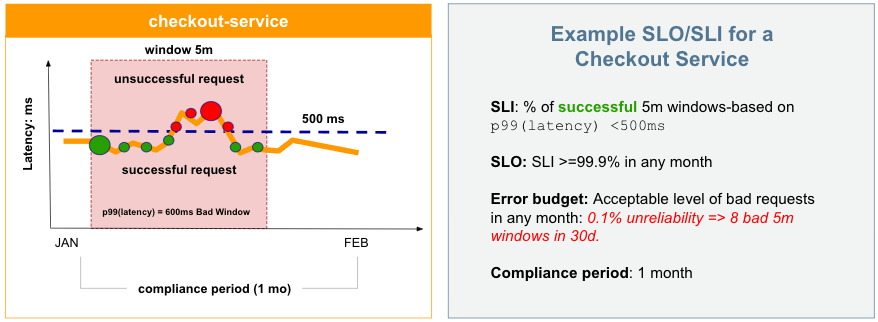
With these calculations, we can configure an SLO, add a monitor, and start managing this and other services with ease. This is just one example. You can develop many different SLOs based on evaluation types (windows-based and request-based), ratios and thresholds for calculations, and error budgets for rolling or calendar compliance periods.
SLOs include all historical data. For example, when you create an SLO with a monthly range part-way into a month, collected historical data to the beginning of that month is also evaluated and displayed.
SLO Evaluation Types
SLOs can be calculated and tracked using windows-based or request-based data.
- Window-based SLOs. Track on a given window of time or interval, such as 5m, 1h, and so on. An SLI calculated against this time will include the percentage of good and bad windows.
- Request-based SLOs. Track the percentage of good requests within a compliance period. Request-based SLOs can exhaust the error budget very quickly if you have severe incidents. However, they smooth over SLIs that are unpredictable by focussing SLOs on a longer time range than a windows-based SLO.
Golden Signal Types
SLIs can be defined by signals such as latency, load, error, bottleneck, throughput, and availability. See the Google SRE Handbook for more information.
Latency
Latency is considered the speed of a service. This is the response of the service to users for different types of actions, including:
- Interactions. How long a user waits for a response after clicking something, sometimes a read action.
- Write. Saving and changing underlying data to a server, database, or distributed system.
- Background. Backend actions that may not readily be seen or recognized by users, typically for refreshes of data or asynchronous actions.
Each of these actions may have different latencies and thresholds for good and bad thresholds. A user may not expect a faster response when writing data versus an interaction to read or retrieve data. You may also have defined latencies for each of these actions, such as a defined median of speed, typical latency, and tail latency.
Error
Systems and services include numerous errors beyond web errors, including custom errors, library errors, API errors, custom services, and edge cases. The errors SLI allows you to track specific errors in your system, focusing on key services or error types, to find and resolve issues. To best manage your SLO for errors, you'll need to clearly define the errors you need to monitor and receive alerts on. Recalculate and refine your SLIs over time to best respond to organization and user needs.
Throughput
Throughput is the amount of processing time by a service or system. Depending on the type of data and service, a data processing system may require more time to process. Bytes per second is a common measurement for processing, and tracking these SLIs can indicate a need for data processing partitions, more support and processors, and so on.
Availability
Availability indicates if a service is working and handling valid requests. Other systems, services, and even virtual storage all have potential metrics to track with SLIs. The other option gives you the ability to include different SLOs based on your specific business needs.
Data Retention
SLO data is retained for 800 days. It is retained separately, regardless of underlying logs/metrics retention. You can access this data via SLO dashboards or your logs.
Accessing SLOs
Classic UI. To access SLOs, in the main Sumo Logic menu select Manage Data > Monitoring > SLOs.
New UI. To access SLOs, in the main Sumo Logic menu select Alerts > SLOs. You can also click the Go To... menu at the top of the screen and select SLOs.
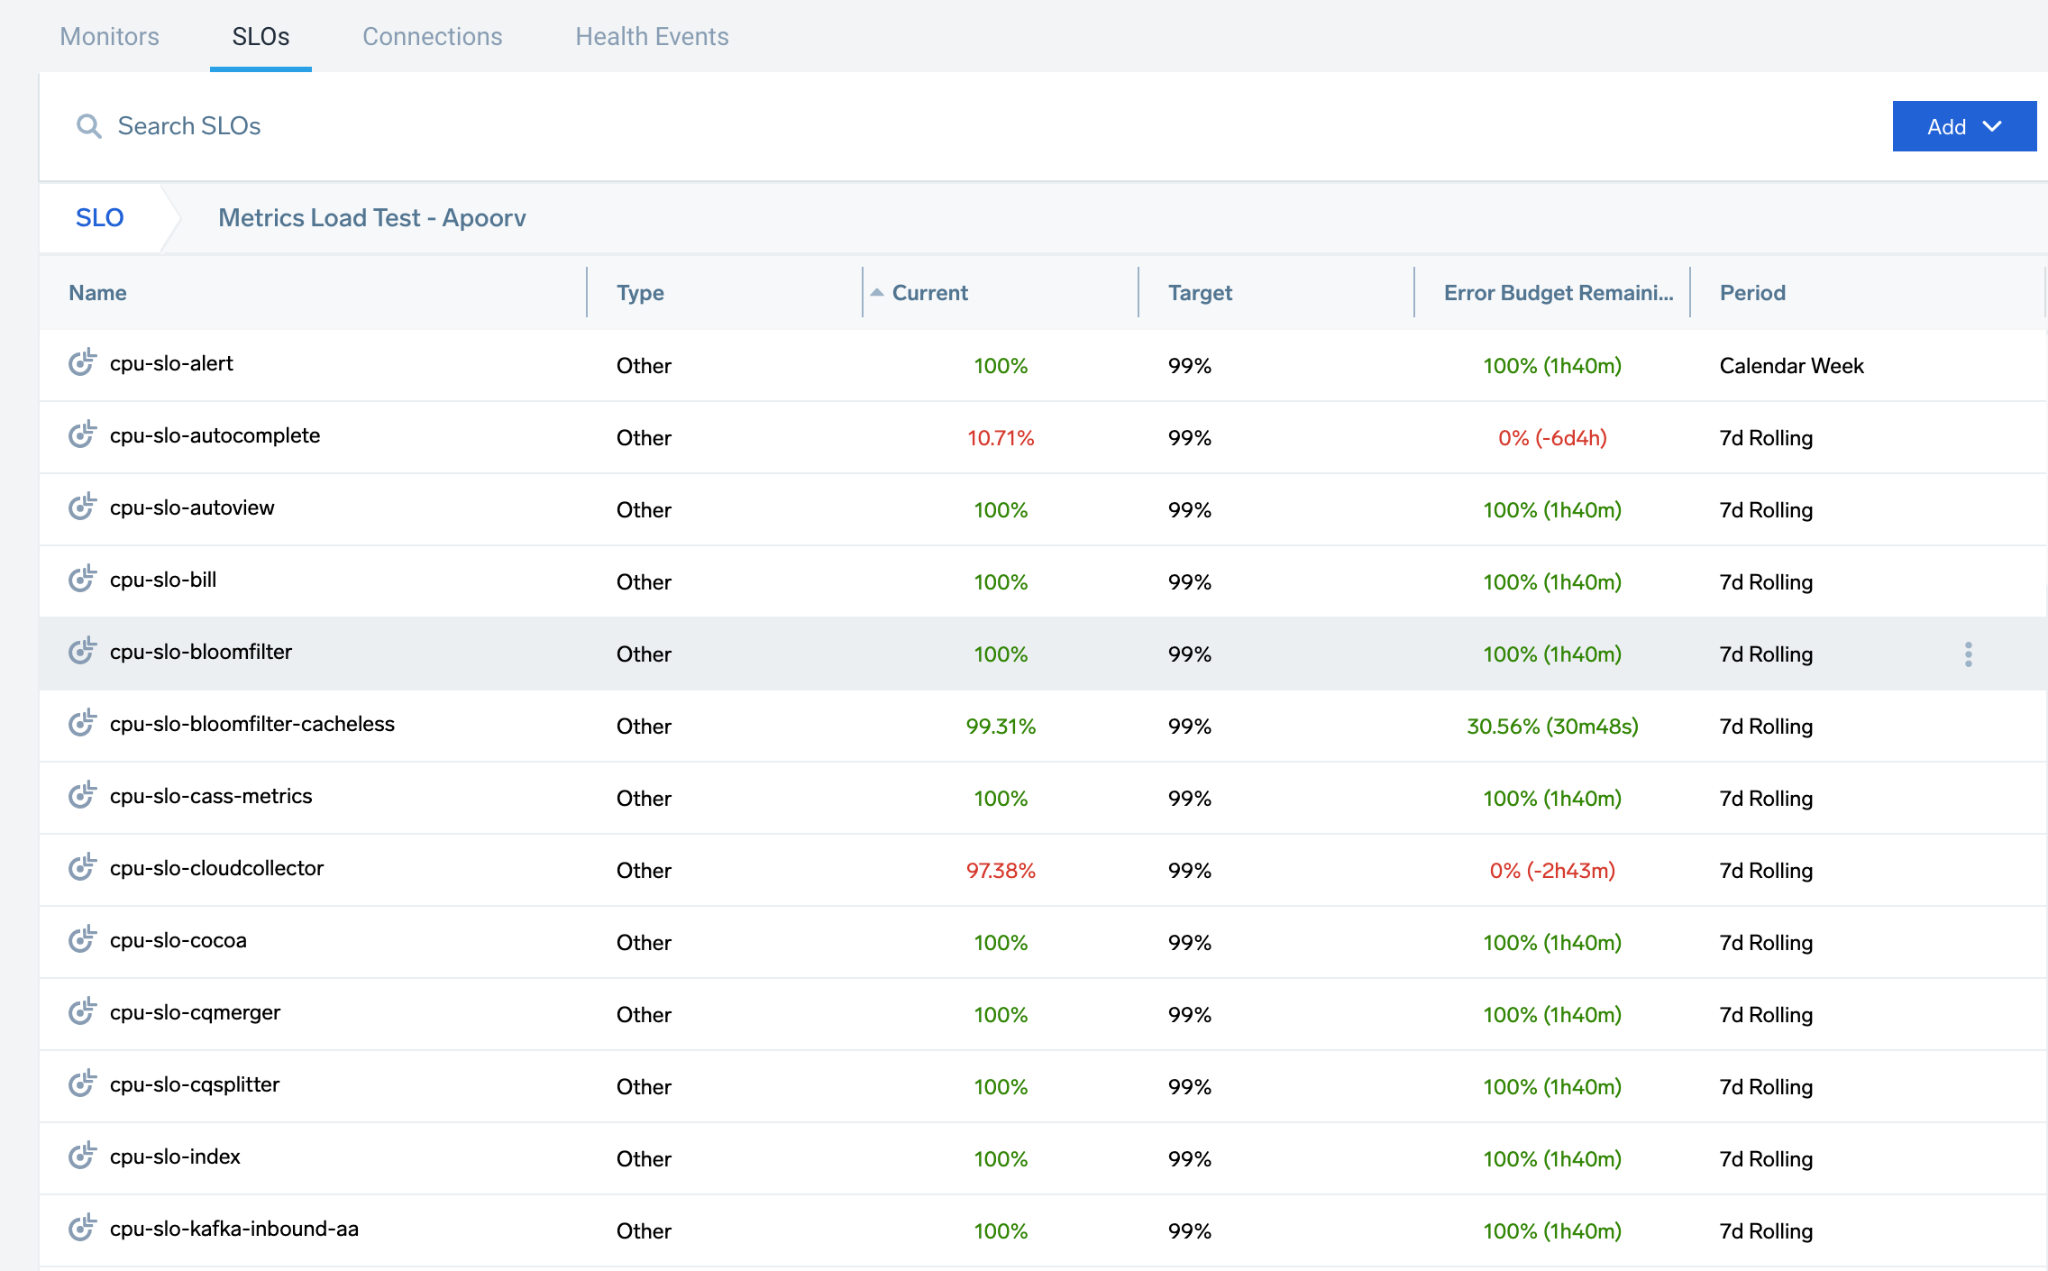
In the SLO screen, you can view, search, and add SLOs. Use folders to collect, package, and manage SLOs with ease, moving SLOs as needed.
To locate an SLO, use the search that returns a list of SLOs based on the name and description.
To open the dashboard, locate and select an SLO. The details pane gives you a preview and an option to Open SLO Dashboard. See SLO Dashboards and Notifications for more information.
Previewing SLOs
Select an SLO to see a quick preview including the configuration details, targets, queries, any associated monitors, and general information. The previewing includes the SLO Details and Monitors tabs.
- Open SLO Dashboard: Access the Dashboard to monitor and investigate data
- Open: Open this SLO to review and edit
- More Options: Access additional options to Edit, Copy Path, Duplicate, Move, Export, and Delete the SLO
The SLO Details tab provides a quick view of the SLO ID, description, configurations, and creation information.
The Monitors tab provides a list of associated monitors for the SLO. Expand entries to review the status, condition, and configured triggers. Click the open icon (![]() ) to open and edit the monitor.
) to open and edit the monitor.
Query Recommendations
The heart of an SLO is the queries used for the SLI query types, including metrics and logs.
General Information
For general information on querying metrics and logs, see Overview of Metrics in Sumo and About Search Basics.
A preview runs the query in real-time to help test and refine results, with a time range to see broader results as needed.
Aggregation Queries
You cannot use aggregate log queries to define your SLO because such queries summarize data and lose the concept of time. Aggregation occurs through the SLO backend and is not required in the query, for example, avg(latency) < 500 ms or "successful event must have latency below 50ms".