SLO Alerts and Notifications
You can create one or more alert monitors as needed for your SLO. We recommend creating separate Monitors for SLI-based and Burn Rate-based condition types. You can access SLO Monitors through your SLO Details or from the Monitors list page.
You will receive notifications according to Monitor configurations, such as email messages and Slack channel posts. Use the variable {{SloDashboardUrl}} in your connection payloads, which will generate an SLO dashboard link in notifications. This variable will be included automatically in email notifications.
The Alert Response page is not supported for SLO-based Monitors at this time. Notifications will provide access to the SLO dashboard when warning and critical triggers occur.
Monitor notifications may auto-resolve. See Auto-Resolving Notifications for details according to the evaluation type (Windows or Request) and compliance type (Calendar or Rolling).
You can create one condition type for your SLO Monitor, either an SLI trigger or Error Budget trigger. You can create one condition type for your SLO Monitor, either a SLI condition or Error Budget condition. We support configuring a threshold value per critical and warning trigger for that condition type.
Create an SLO monitor
You have two options to create an SLO Monitor:
- Select Save and Create Monitor when creating an SLO.

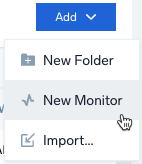
- Go to the Monitors tab, select Add > New Monitor, then select the SLO option.
When you click Save and Create Monitor, a New Monitor dialog loads:
- For the Monitor Type, select SLO. When creating from the Monitors tab, select an SLO from the dropdown menu. A preview of the SLO loads on the page.
- Select and configure a Condition Type:
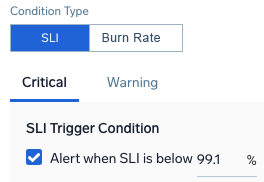
- For the SLI Condition Type, you can select to alert when the SLI is below an entered percentage, as it nears your SLI target. For example, you could set this to 99.1% to raise a critical alert when it is getting close to a target of 99%.
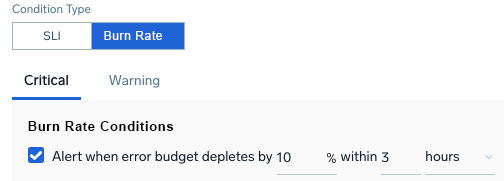
- For the Burn Rate Condition Type, create an alert indicating Critical and Warning conditions based on burn rate or the rate at which error budget is depleted. Enter a percentage depleted within an amount of minutes, hours, or days. For example, a critical alert for 10% depletion within 3 hours indicates the error budget is depleting quickly.
- For the SLI Condition Type, you can select to alert when the SLI is below an entered percentage, as it nears your SLI target. For example, you could set this to 99.1% to raise a critical alert when it is getting close to a target of 99%.
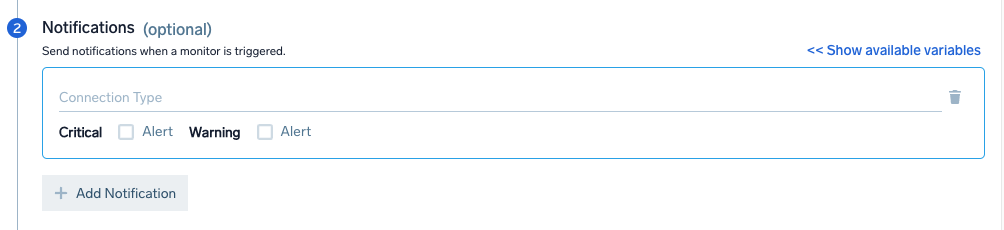
- Under Notifications, select your preferred Connection Type for sending messages via email, Slack, webhook, or other methods. Select Alert and/or Recovery to notify for Critical and Warning triggers. You can add as many notifications as needed. A message is sent with a link to the SLO dashboard to investigate.
For example, to set up a Slack notification, select Slack from the dropdown menu and edit the Payload as needed. The following information shows the default settings: 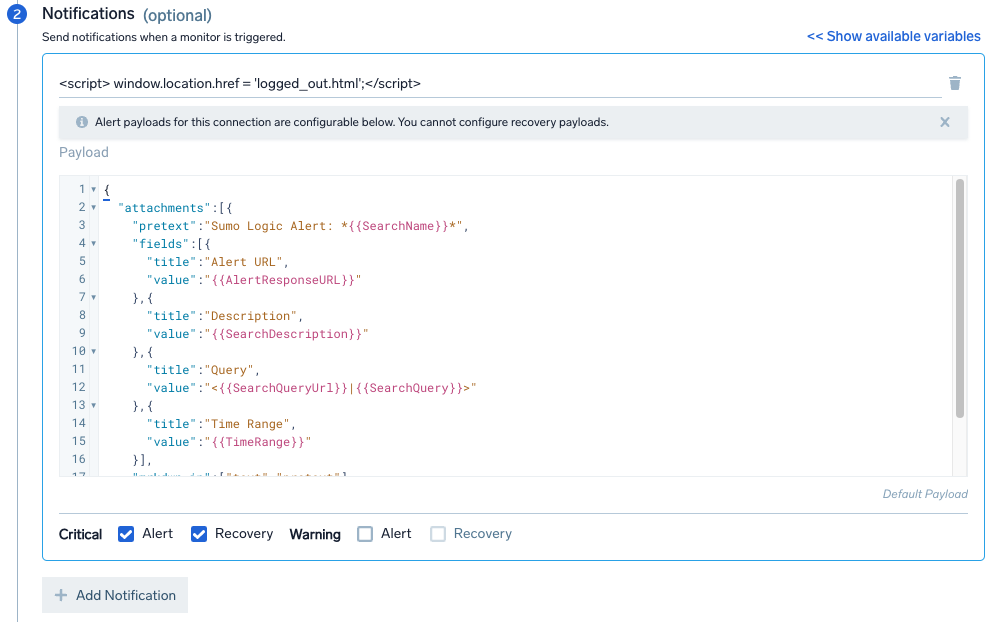 4. For Monitor Details, enter the following information:
- Name. Name for the Monitor.
- Location. Path for the Monitor, default is /Monitor.
- Description. Optional description for the Monitor.
- Playbook. Optional playbook for handling these Monitors and situations if an issue occurs.
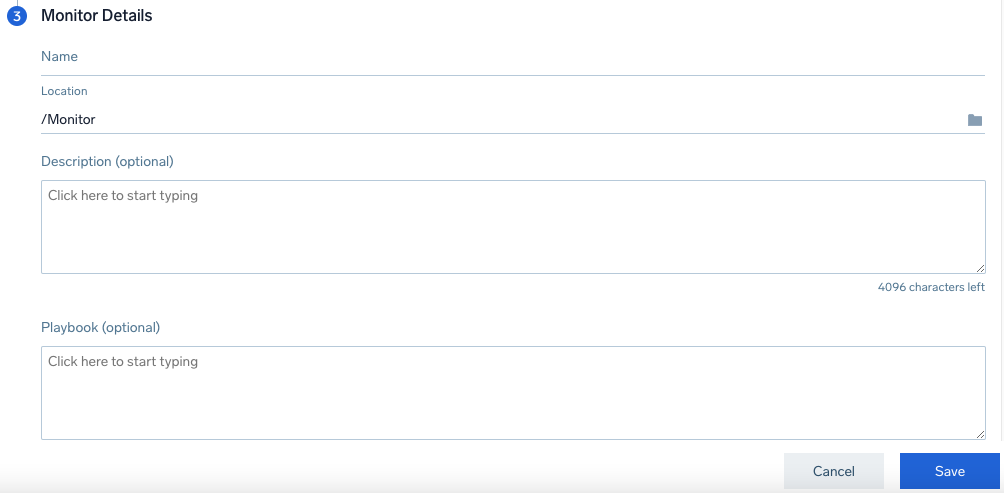
- Click Save.
Auto-Resolving Notifications
SLO Monitors in a triggered state can auto-resolve. See the following table for details.
| EvaluationType | ComplianceType | MonitorConditionType | Auto-resolves |
|---|---|---|---|
| Window | Calendar | SLITrigger | No. SLI never recovers within the same compliance period as the triggered alert, but it can recover in a different compliance period. So the Monitor can auto-resolve then. New alert is created for each compliance period. Monitor status is based on latest compliance period’s alert status. |
| Window | Calendar | ErrorBudgetTrigger | Yes, if the error budget consumed is less than the alert threshold for a complete detection window. Resolution behavior is same as log monitors. |
| Window | Rolling | SLITrigger | Same as “Window-Calendar”. Separate alert is triggered for each compliance period. |
| Window | Rolling | ErrorBudgetTrigger | Same as “Window-Calendar”. |
| Request | Calendar | SLITrigger | Yes, when SLI value goes above alert threshold. A new alert is created for each compliance period. Monitor status is based on the latest compliance period’s alert status. |
| Request | Calendar | ErrorBudgetTrigger | Same as “Window-Calendar”. |
| Request | Rolling | SLITrigger | Same as “Request-Calendar”. Separate alert for each compliance period. |
| Request | Rolling | ErrorBudgetTrigger | Same as “Window-Calendar”. |
Notification Example
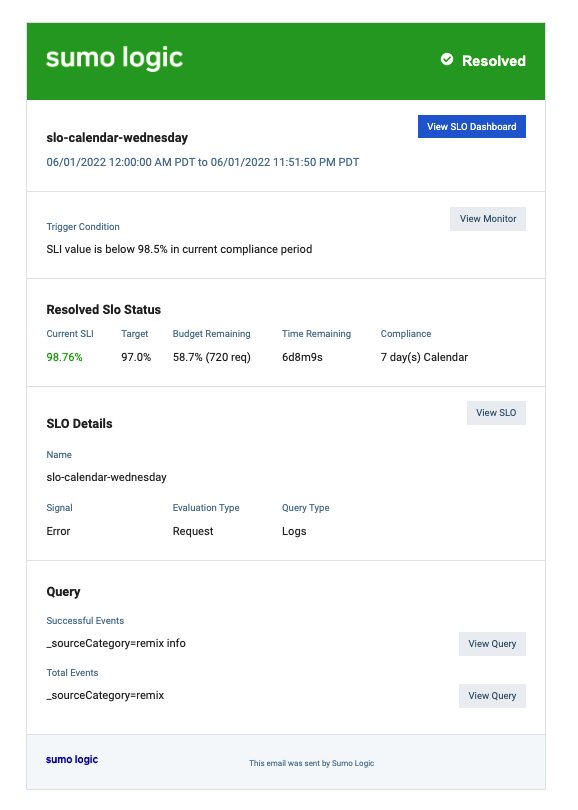
When a notification is sent, it includes information from the alert and a link to load the dashboard. Below is an example of a critical alert email notification. See SLO Dashboards for information.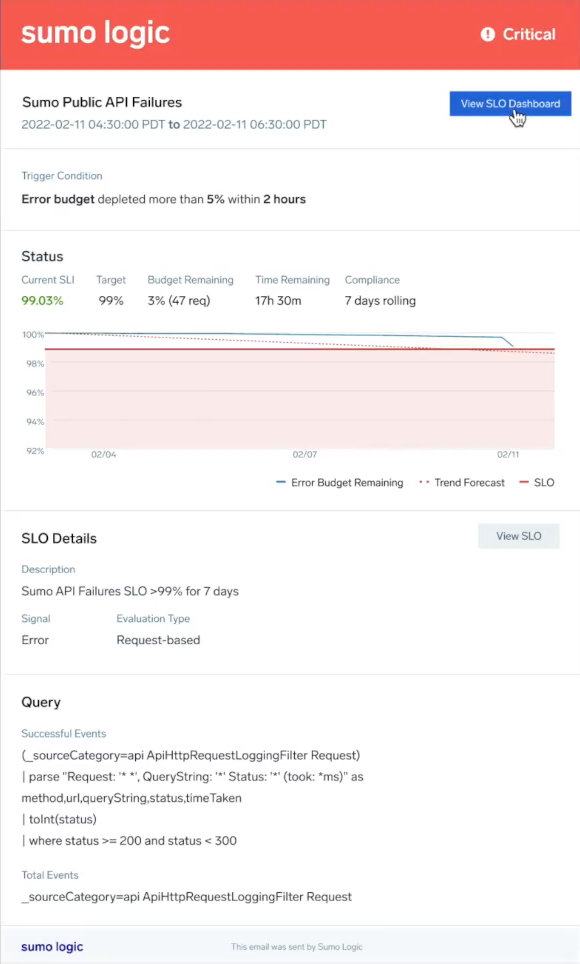
Resolution Email Example
Installing AWS SLO Monitors via Terraform
AWS ELB users can now install Sumo Logic out-of-the-box SLOs and associated Monitors using this Sumo Logic Terraform script.
The script allows you to install Sumo Logic SLOs in your specified AWS ELB directory and configure SLO alert notifications (e.g., latency limit breached, server error limit breached). Once installed, you can view and edit your SLO alerts via Terraform or from your Sumo Logic Monitors page.
Limitations
- Alert Responses are not yet supported for SLO-based Monitors. Notifications will provide information and links to SLO dashboards.
- It is not possible to create an SLO on top of an SLO Monitor.