Create an SLO
When creating an SLO, you'll need to define the following:
- SLI (service level indicator) metric you are tracking and target configuration using ratio- or threshold-based definitions
- SLO (service level objective) defining the target and duration to monitor (for example, the uptime for the target)
- Basic details for SLO name and description
You have multiple configurations for creating SLOs:
- Measurement for SLO: Windows of time or Requests.
- Query type: Metrics or Logs.
- Calculation definition: Ratio (tracked amount against a total) or Threshold. Instead of defining two queries to identify successful versus total events to create a Ratio, you can specify a Threshold for the Total Events query that identifies successful events.
The following table lists the available options for an SLO:
| Window-based | Request-based | |
|---|---|---|
| Metrics-based SLO | Ratio and Threshold | Ratio Only |
| Logs-based SLO | Ratio and Threshold | Ratio and Threshold |
Create an SLO (General)
-
Classic UI. In the main Sumo Logic menu select Manage Data > Monitoring > SLOs.
New UI. In the main Sumo Logic menu, select Alerts > SLOs. You can also click the Go To... menu at the top of the screen and select SLOs. -
Click Add > New SLO. Optionally, you can also:
- Create folders to manage your SLOs.
- Import an SLO.
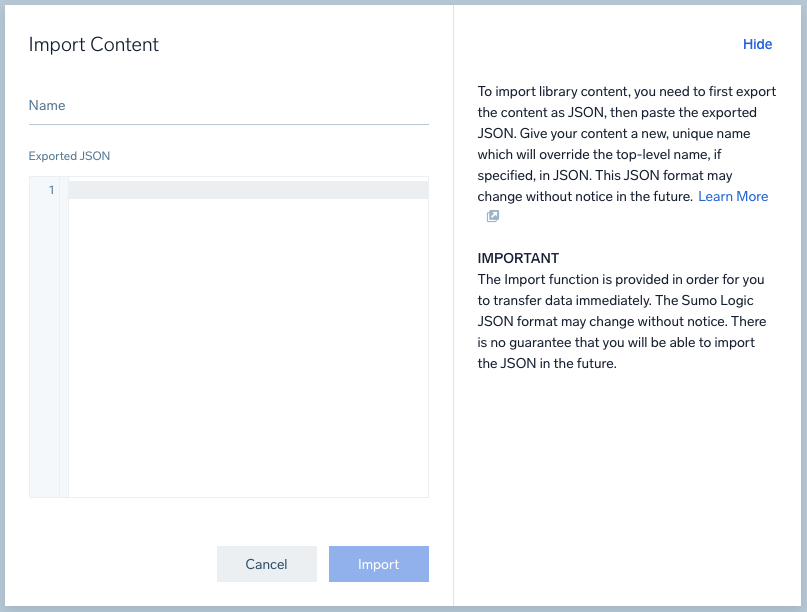
To transfer data immediately and create an SLO using an import, you should first export JSON content to use that formatting. The Sumo Logic JSON format may change without notice. See Export and Import Content in the Library for complete details.- Click Add > Import.
- Enter a Name for the SLO.
- Copy and paste the JSON in the text editor.
- Click Import.
-
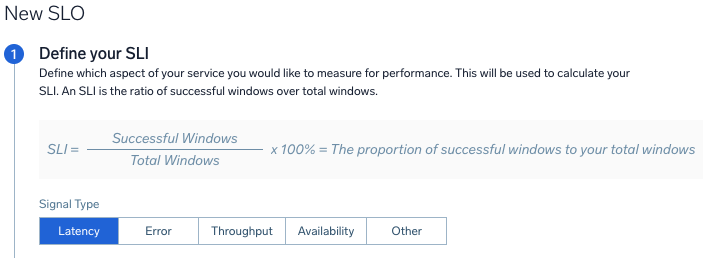
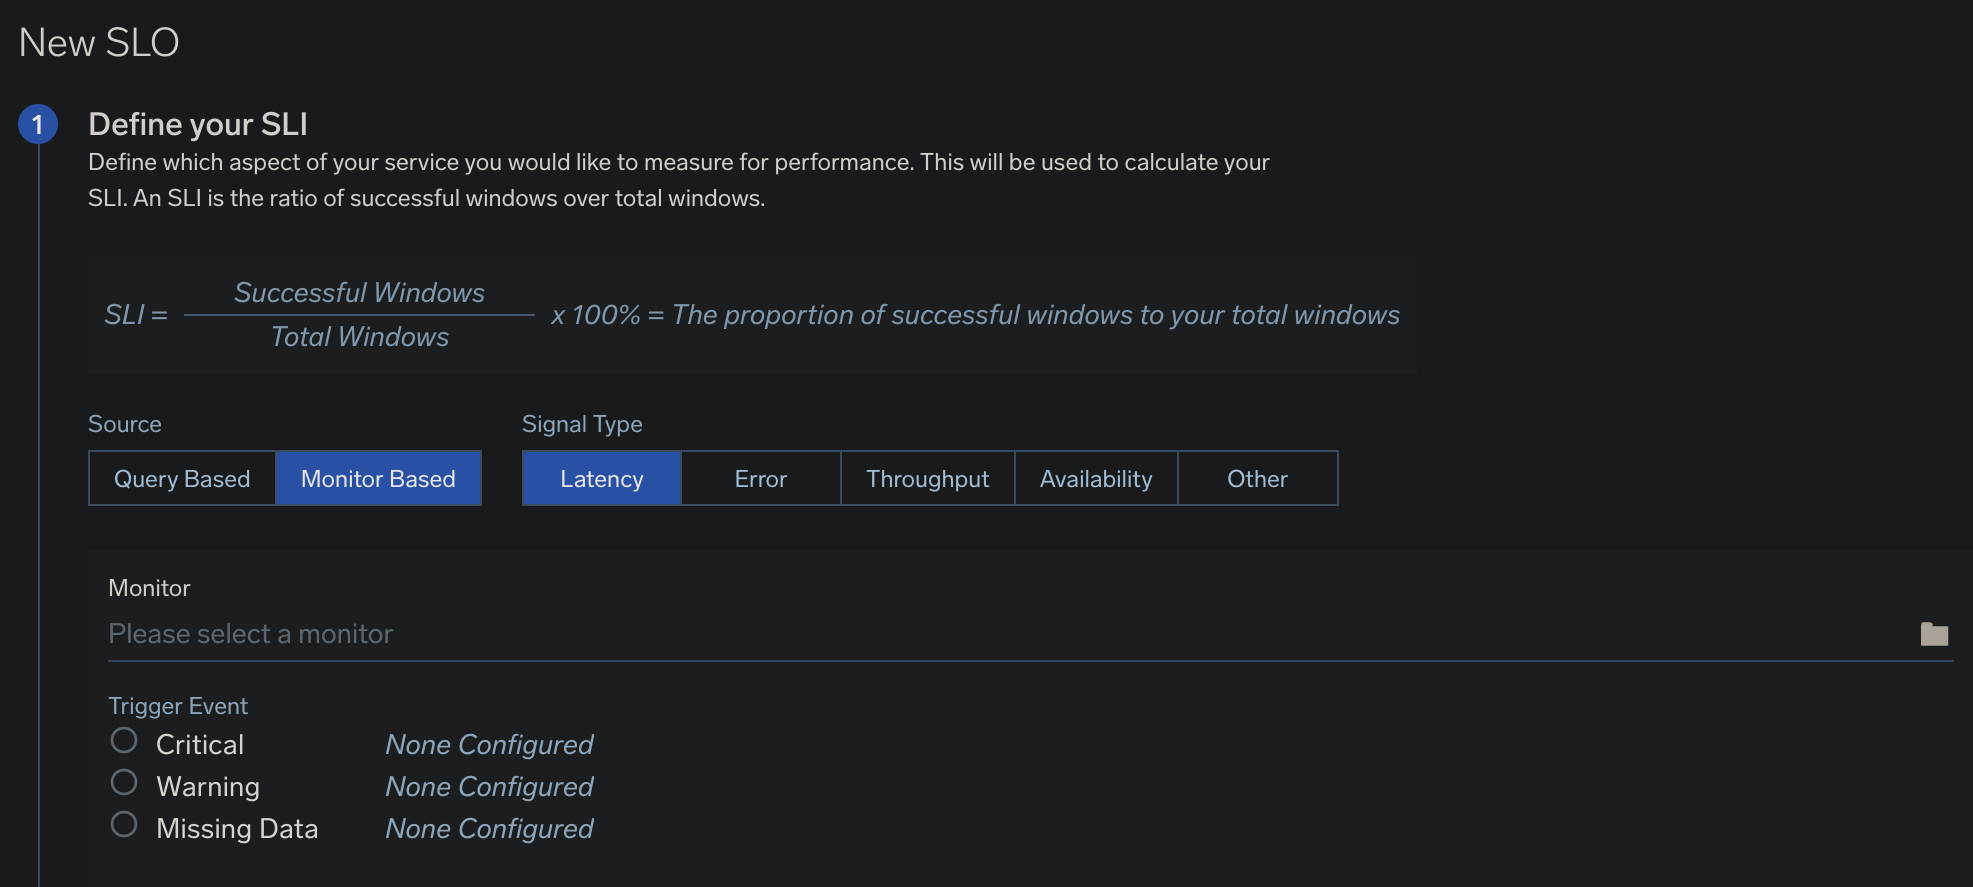
Select the Signal Type:
- Latency. Select to calculate the speed of services, lag time.
- Error. Select to monitor for errors that occur in your services.
- Throughput. Select to track the throughput of services and processing.
- Availability. Select to monitor the uptime of services.
- Other. Select to monitor any other metric or log for SLIs.
-
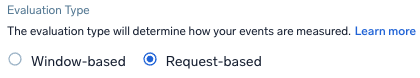
Select the Evaluation Type which determines how the events are measured:
- Window-based. Select the time frame window for the events. Window sizes should be between 1m to 60m.
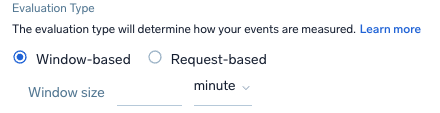
- Request-based.
Select the Query Type to select and build your queries for the SLI data. You have a choice of Metrics or Logs with a ratio-based (partial against the total) or threshold-based (events amount against a set threshold amount) calculation.
Follow the instructions below based on the query type:
- Window-based. Select the time frame window for the events. Window sizes should be between 1m to 60m.
| Metrics: Ratio-based | Metrics: Threshold-based |
For Ratio-based definition, define queries for the successful or unsuccessful events to calculate against total events:
| For Threshold-based definitions, which calculate against success criteria:
|
| Logs: Ratio-based | Logs: Threshold-based |
For Ratio-based definitions, which calculate successful or unsuccessful events against total events:
| For Threshold-based definitions, which calculate against success criteria:
|
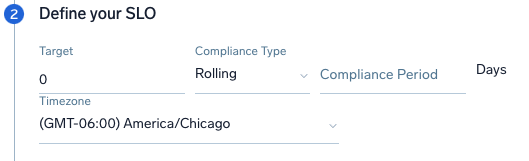
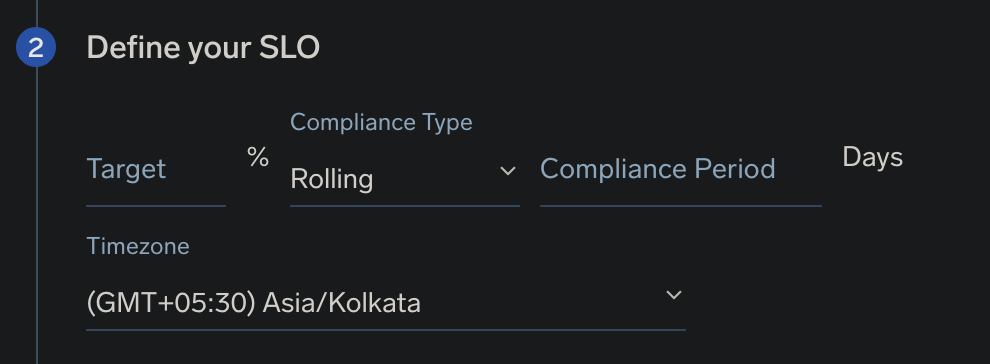
- Define your SLO for target amount and duration period to monitor:
- Target. The value in percentage you want to target for the SLO (for example, you'd enter
99for 99%). - Compliance Type. Rolling provides a sequence of recent days for the Compliance Period, such as the last 7d or last 30d. Calendar calculates over a window of time for a Week.
- Timezone. Selecting a timezone is important to accurately assign events on the boundary of a compliance period, such as events received at 11:59 PM in a particular time zone.
- Target. The value in percentage you want to target for the SLO (for example, you'd enter
- Enter SLO Details:
- Name. Name of the SLO.
- Description. Short explanation of your SLO.
- Tags. Tags are key/value pairs that allow you to apply additional metadata to your SLOs beyond the name and description. Learn more here. Tags can help you categorize, search, and filter your SLOs. They also enable you to correlate your other content items and data with SLOs.
Select the key and its possible values from the tags dropdown, or create your own key/value pair for the tag.
infoYou can associate multiple tags with your SLO.
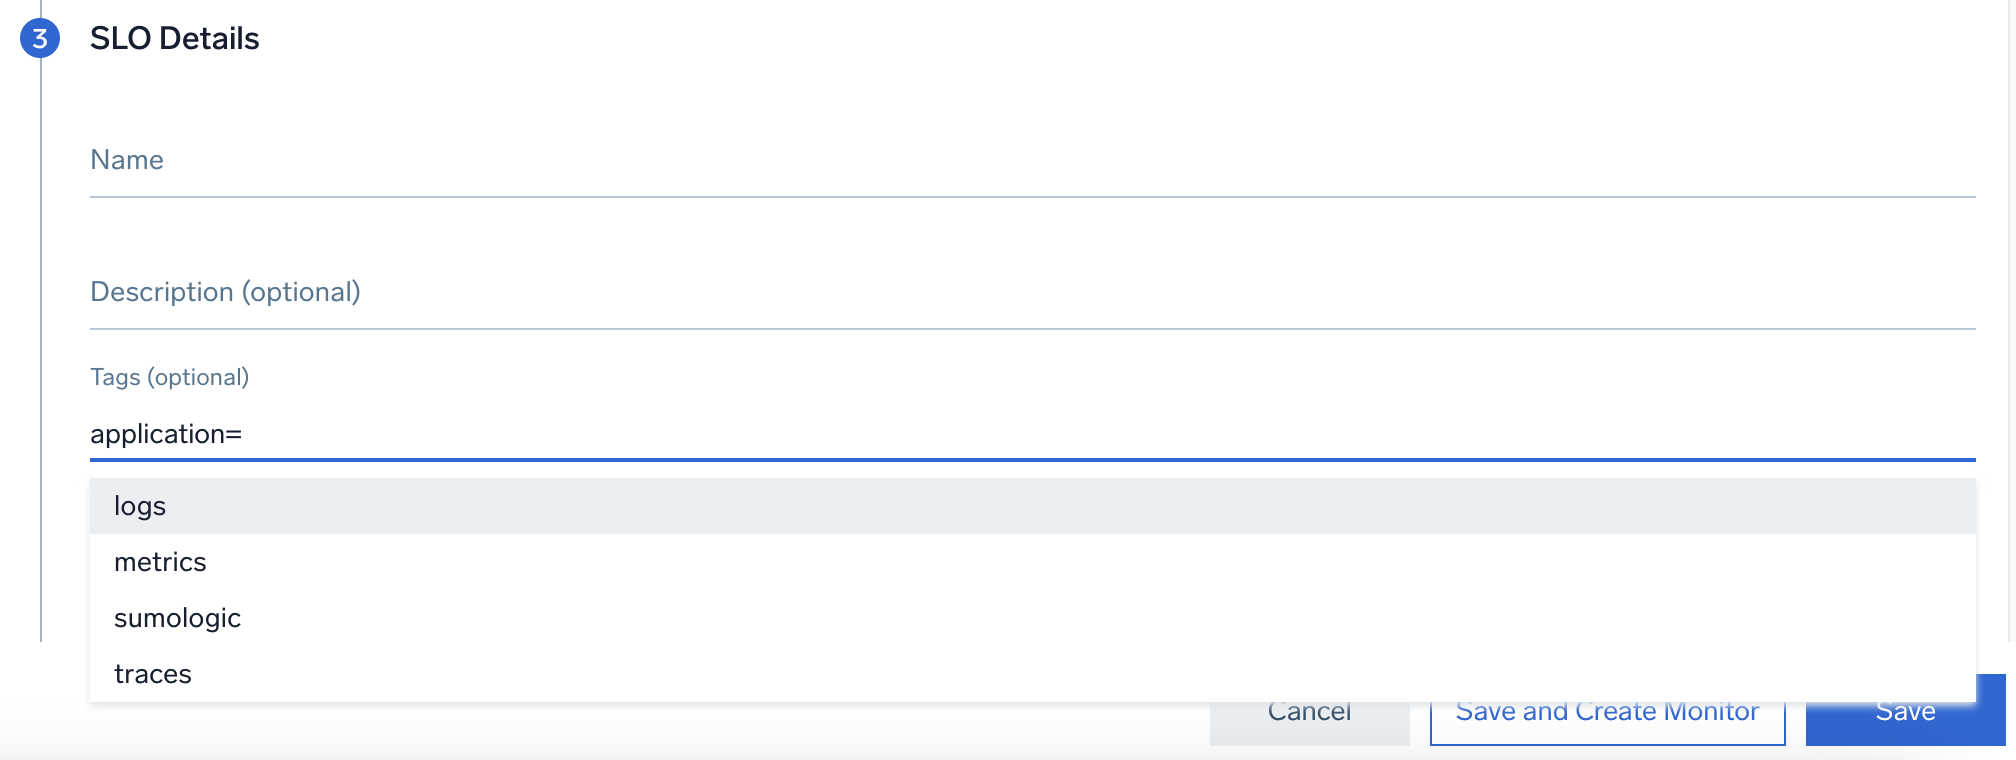
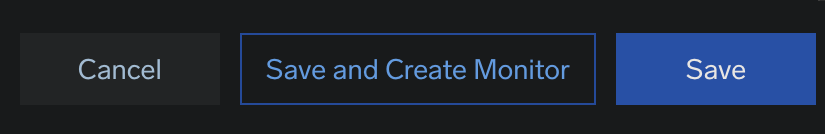
- Click Save. To create a monitor, click Save and Create Monitor.
Create an SLO from Log Search page
You can create SLOs directly from your Sumo Logic log search. This allows you to validate queries, quickly create SLOs, and reuse queries from existing dashboard panels.
- Enter a new Log search query (or use an existing one).

- Click the More Actions (kebab icon) dropdown menu.
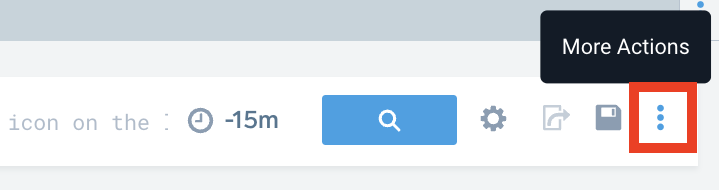
- Click Create an SLO.
Create an SLO from Metrics page
To create an SLO from the Metrics page:
- Classic UI. Go to the Home screen and select Metrics.
New UI. In the main Sumo Logic menu, select Metrics > All Metric Searches. You can also click the Go To... menu at the top of the screen and select All Metric Searches. - Under Metrics Explorer, select your desired Metric and Filters. Optionally, you can Add Operator.
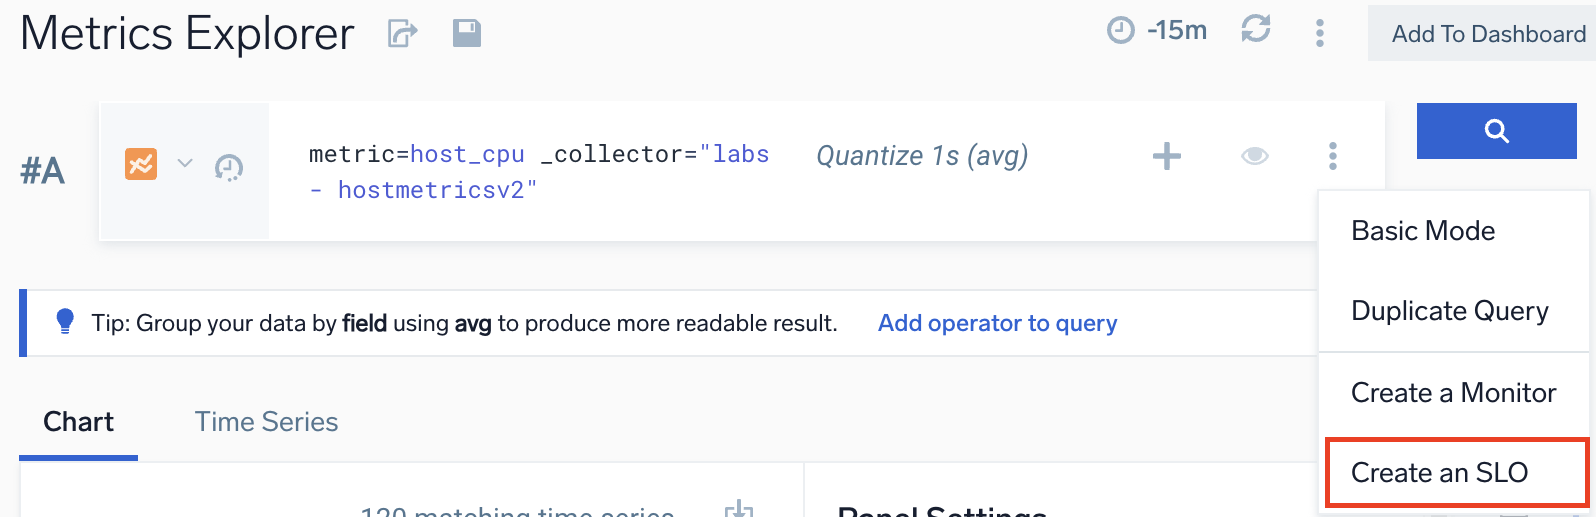
- Click the three-dot kebab icon, then select Create an SLO.
- Follow the instructions under Create an SLO (General).
You can use metrics operators for metrics-based SLOs. The metrics query specified in your SLO should have a quantization after the selector. You can specify one or more operators in the query for SLO.
As an example, a pure selector query with no operators could be _sourceCategory=my-web-server metric=is_healthy, which returns one time series per instance your web server indicating if it is healthy or not (1 or 0). To count the number of instances that were healthy in a given minute, you can use the sum operator with an appropriate quantization method and interval, as follows: _sourceCategory=my-web-server metric=is_healthy | quantize to 1m using max | sum.
Create an SLO from Monitors list page
Critical Monitors are great candidates to convert to SLOs. From the Monitors section, you can create a Monitor- and window-based SLO for a given trigger condition.
As an example, say you have an existing Monitor that fires a Critical alert if the latency of a customer-critical service exceeds 500ms. By creating an SLO directly through this specific Monitor, those thresholds will automatically carry over into the new SLO, saving you time and effort.
Your Monitor must be in an active state.
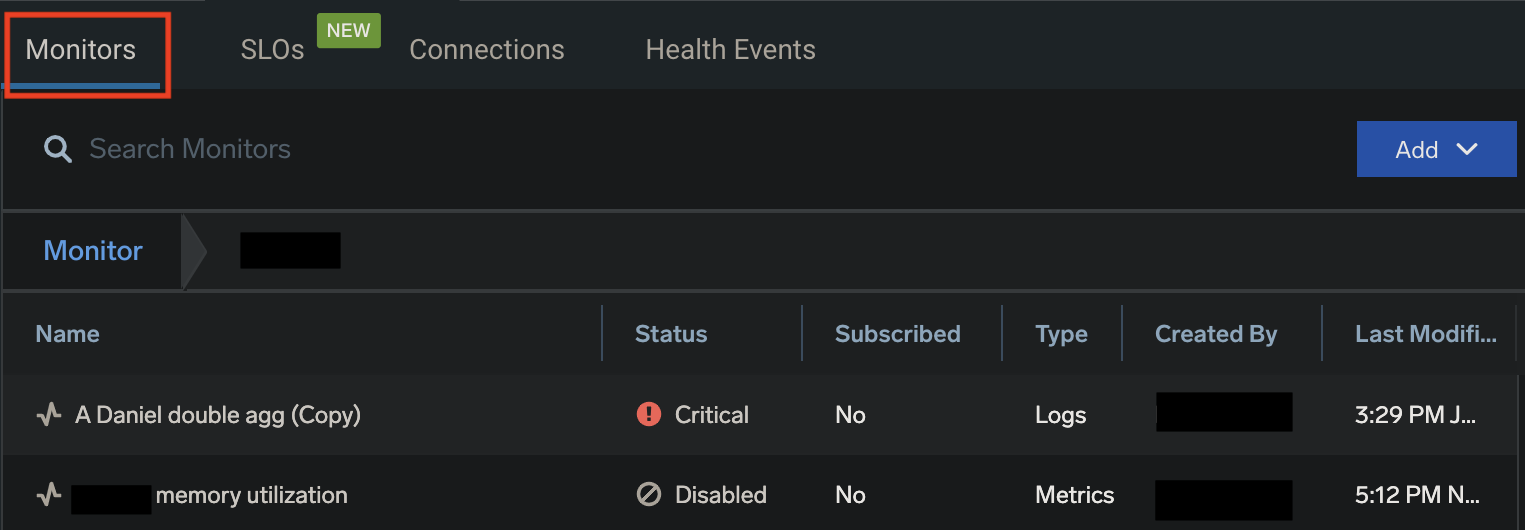
- Classic UI. In the main Sumo Logic menu, select Manage Data > Monitoring > Monitors.
New UI. In the main Sumo Logic menu, select Alerts > Monitors. You can also click the Go To... menu at the top of the screen and select Monitors. - Click on any active Monitor to open its panel.
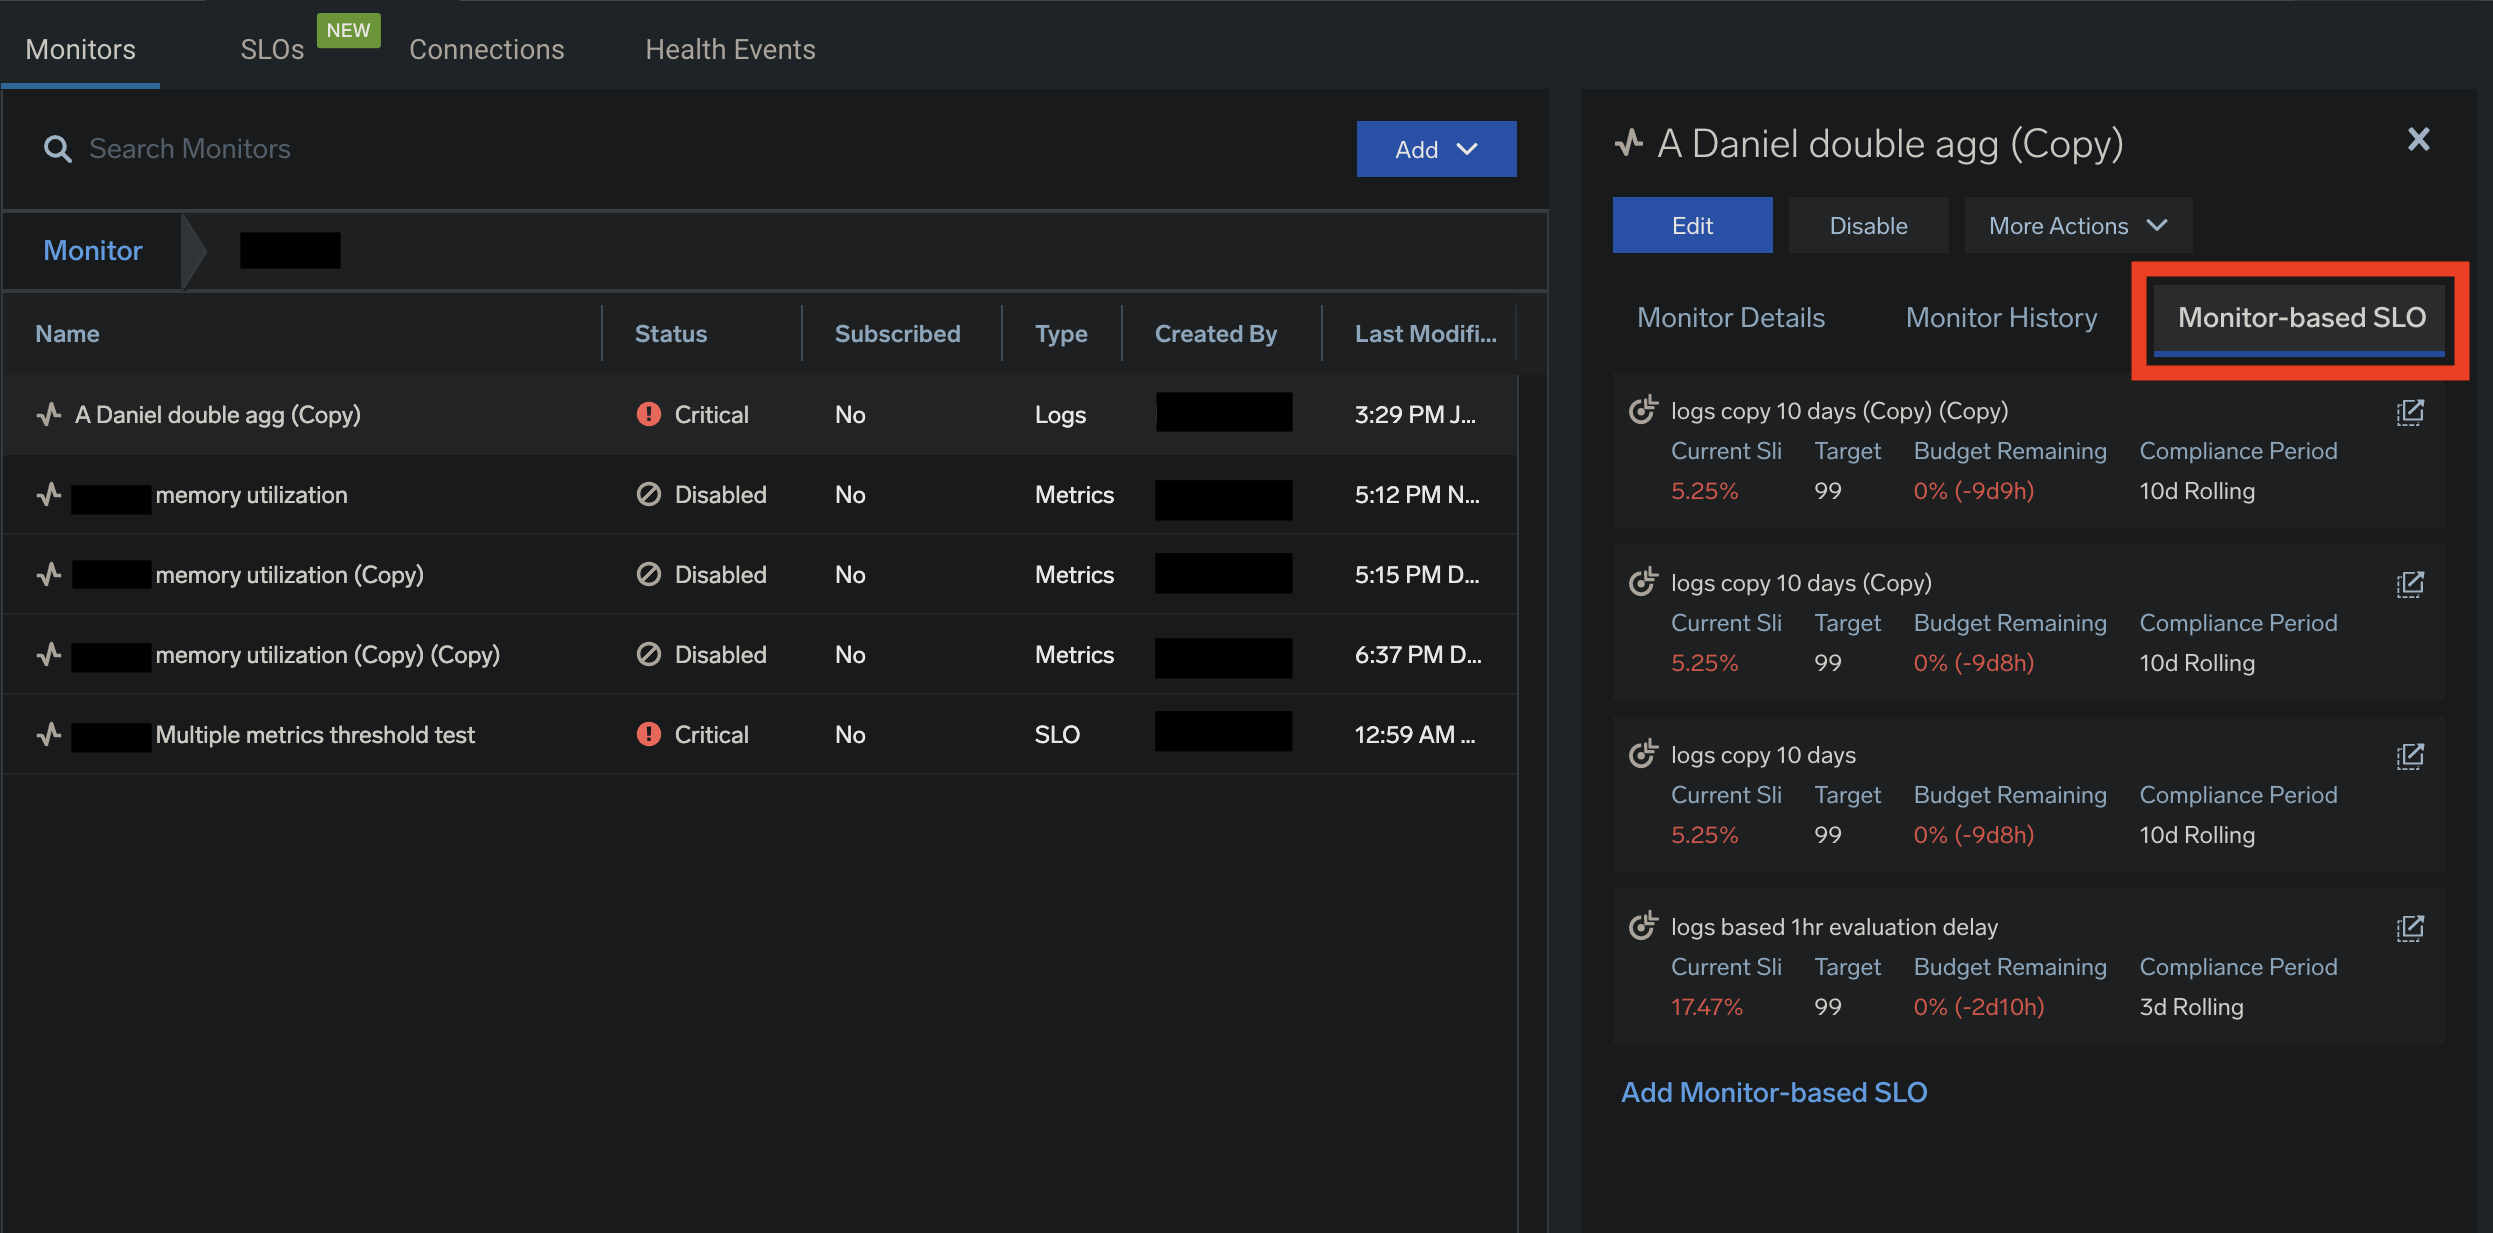
- Choose one of the methods below:
Click More Actions > Create SLO.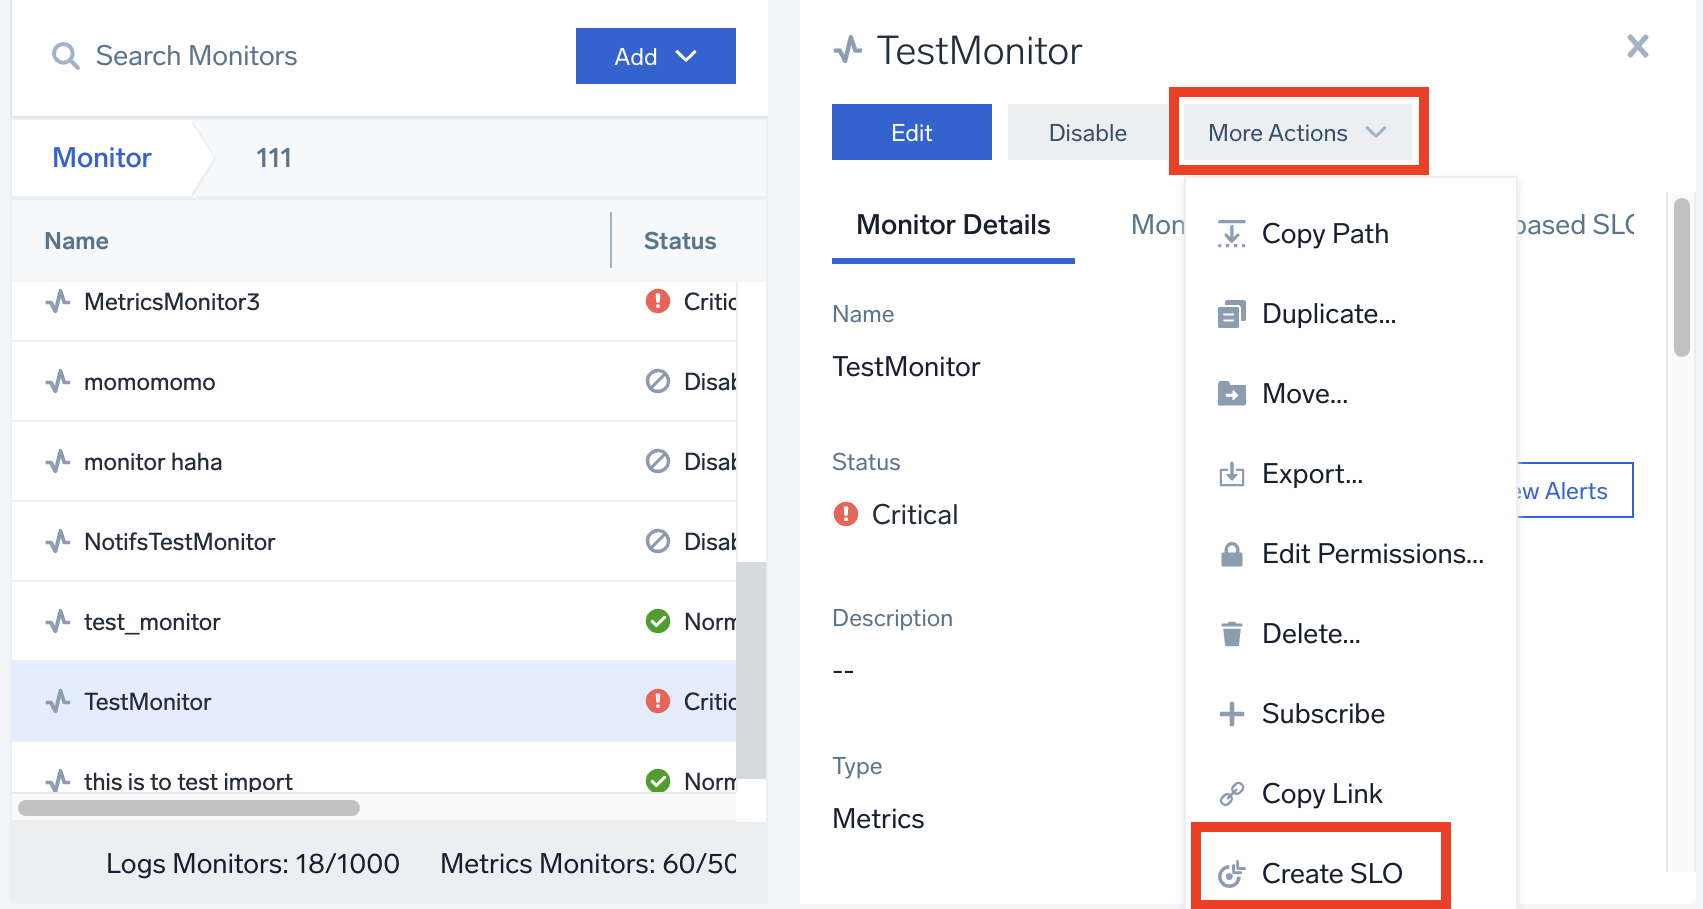
Or, click Monitor-based SLO > Add Monitor-based SLO.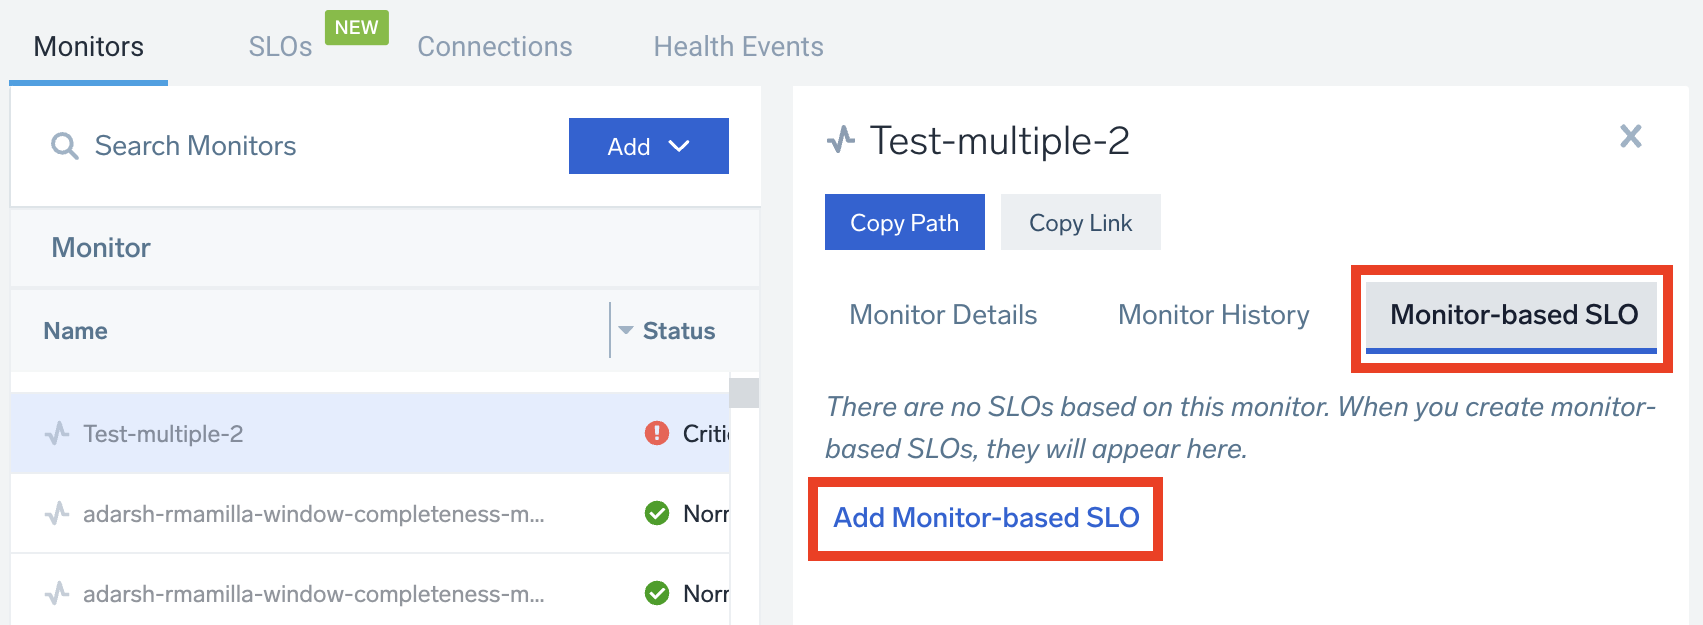
This will open the New SLO window. - Define your SLI. Your Monitor's Source, Signal Type, and Trigger Event settings will auto-populate here (you can override these if you need to).
- Define your SLO. Set your window-based threshold here.
- When you're done, click Save, which will save the SLO.
To edit SLO parameters:
- Go to the SLO tab, locate your SLO and click on it. (If you're unable to find it, try applying filters or go to the search bar at the top and enter the SLO name or folder name.)
- Edit definition and other parameters.
To edit SLO parameters from a Monitor:
- Go to the Monitors tab and click on any Monitor.
- In the panel, click Monitor-based SLO to view the list of SLOs associated with that particular Monitor.
Any Monitor update that changes the Monitor definition will lead to a change in the version of related SLOs. This means that the SLO history or SLI will get reset for the SLO. Example include trigger condition changes and evaluation delay changes. Changes unrelated to the definition like Name, Description will not affect the related SLOs.
SLI calculation for Monitor-based SLOs
SLIs for Monitor-based SLOs are calculated at a granularity of 1 minute. One minute is treated as unsuccessful if the Monitor threshold is violated at any point of time within that minute.
Create an SLO via Terraform
You can use the Sumo Logic Terraform provider to automate the creation of SLOs (sumologic_slo) and SLO folders (sumologic_slo_folder). This can be useful for organizations that want to:
- Templatize SLOs
- Standardize the configuration of SLOs, monitors, and dashboards
- Automate SLO-related workflows
You can use the Monitor Terraform provider (sumologic_monitor) to create monitors associated with SLOs.
Managing your SLOs
Below are some best practices for managing your SLOs.
Classic UI. To access SLOs, in the main Sumo Logic menu select Manage Data > Monitoring > SLOs.
New UI. To access SLOs, in the main Sumo Logic menu select Alerts > SLOs. You can also click the Go To... menu at the top of the screen and select SLOs.
Tags and Filters
You can add key/value pair tags to your SLOs to allow you to better organize and filter them. For example, you might find it useful to add tags for team, service, and application.
- Tag keys cannot start with the prefixes
sumo.or_ - Tag keys must only contain letters, numbers, and/or the symbols
_,.,/,+,-,@ - Tag values can only contain letters, white spaces, numbers, and/or the symbols
_,.,/,=,+,-,@ - You can associate a maximum of 50 tags per SLO.
Add a Tag
To add a tag(s) to an existing SLO:
- Click on any SLO line item in your list, then click Edit.
- Scroll down to section (3) SLO Details. Click on Tags (Optional) and type in a new tag or select an existing tag.
- Click Save.
To add a tag while creating a new SLO:
- Click Add > New SLO.
- After you've filled out sections 1 and 2, scroll down to section (3) SLO Details. Click on Tags (Optional) and type in a new tag or select an existing tag.
- Click Save.
Filter SLOs By Tags
After you've added a tag, you'll see it populate in the Tags column next to your SLO in the list.
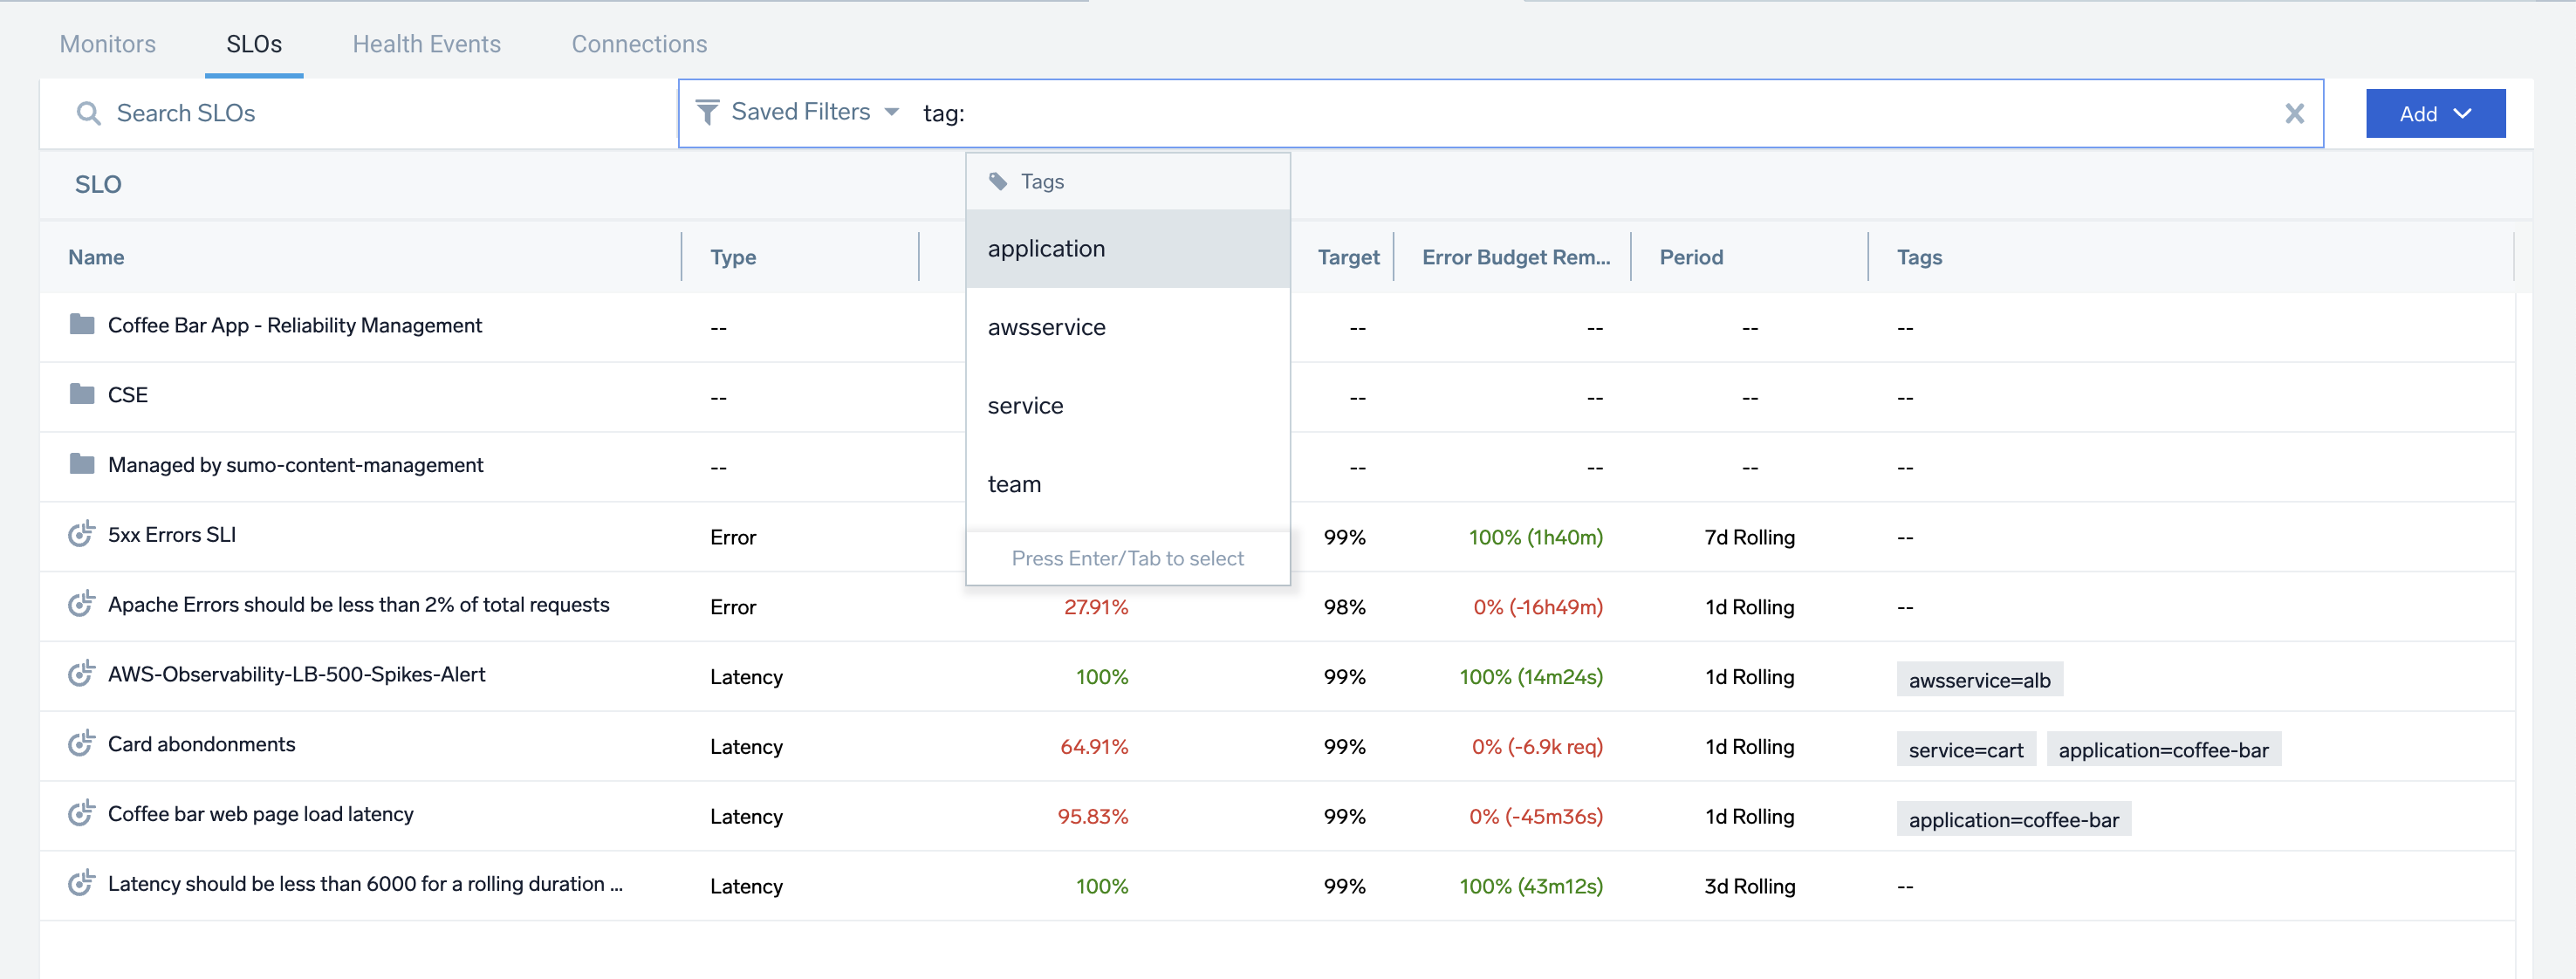
-
Click Add a filter at the top of the screen, then click Tag.
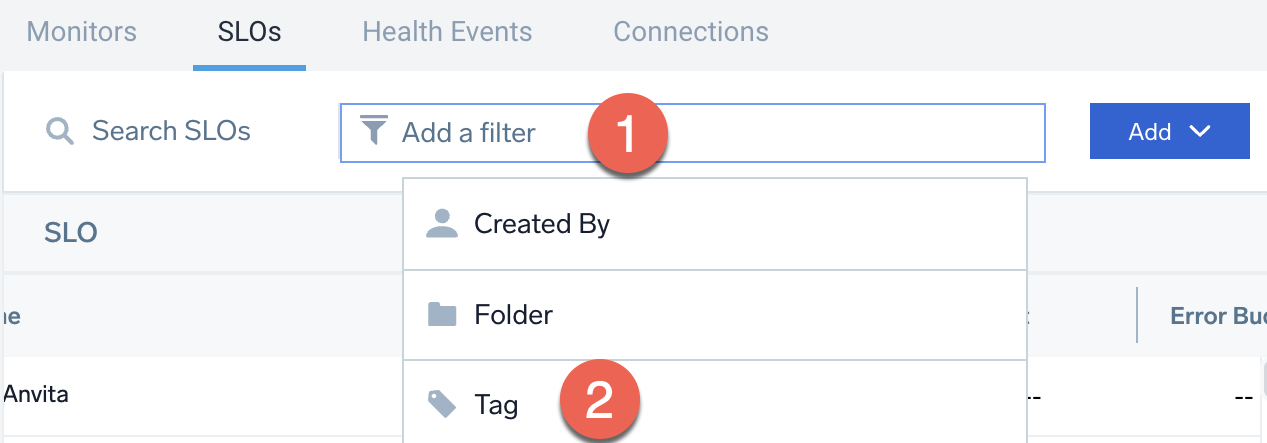
-
Scroll through the list of tags or type in the tag name you're looking for.
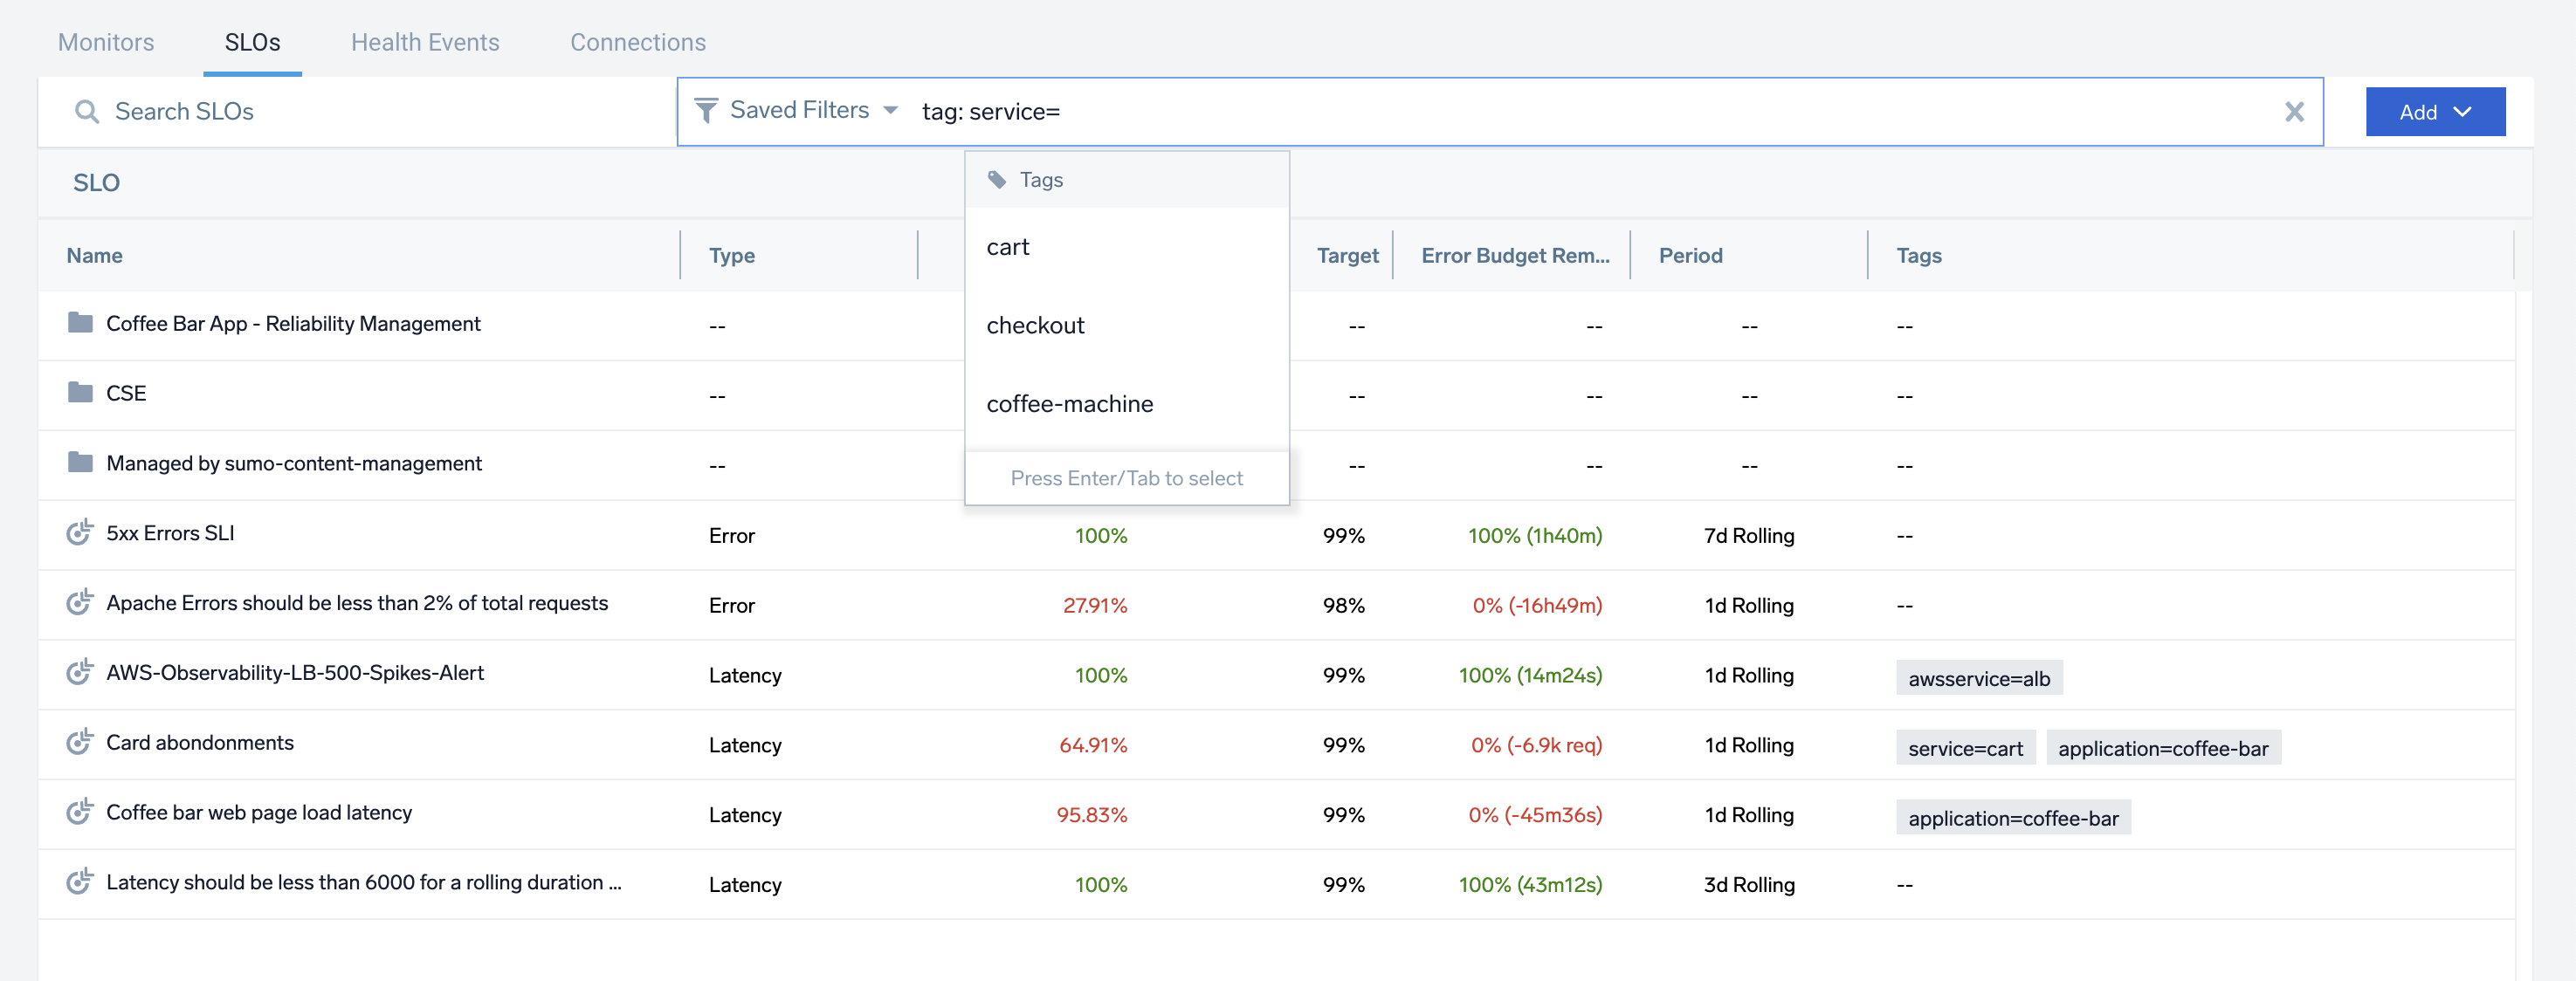
If you run a query with multiple values for same tag key, they are OR'd. Tag filters for different tag keys are AND'd.
In this tag filter example query below, it's looking for SLOs where the service is either cart OR checkout OR coffee-machine.
Save filter
You can create and save custom filter views, allowing you to focus on the SLOs and insights most important to you. In this example, we'll create a view that contains the filters we've created above.
-
Click in the Add a filter field.
-
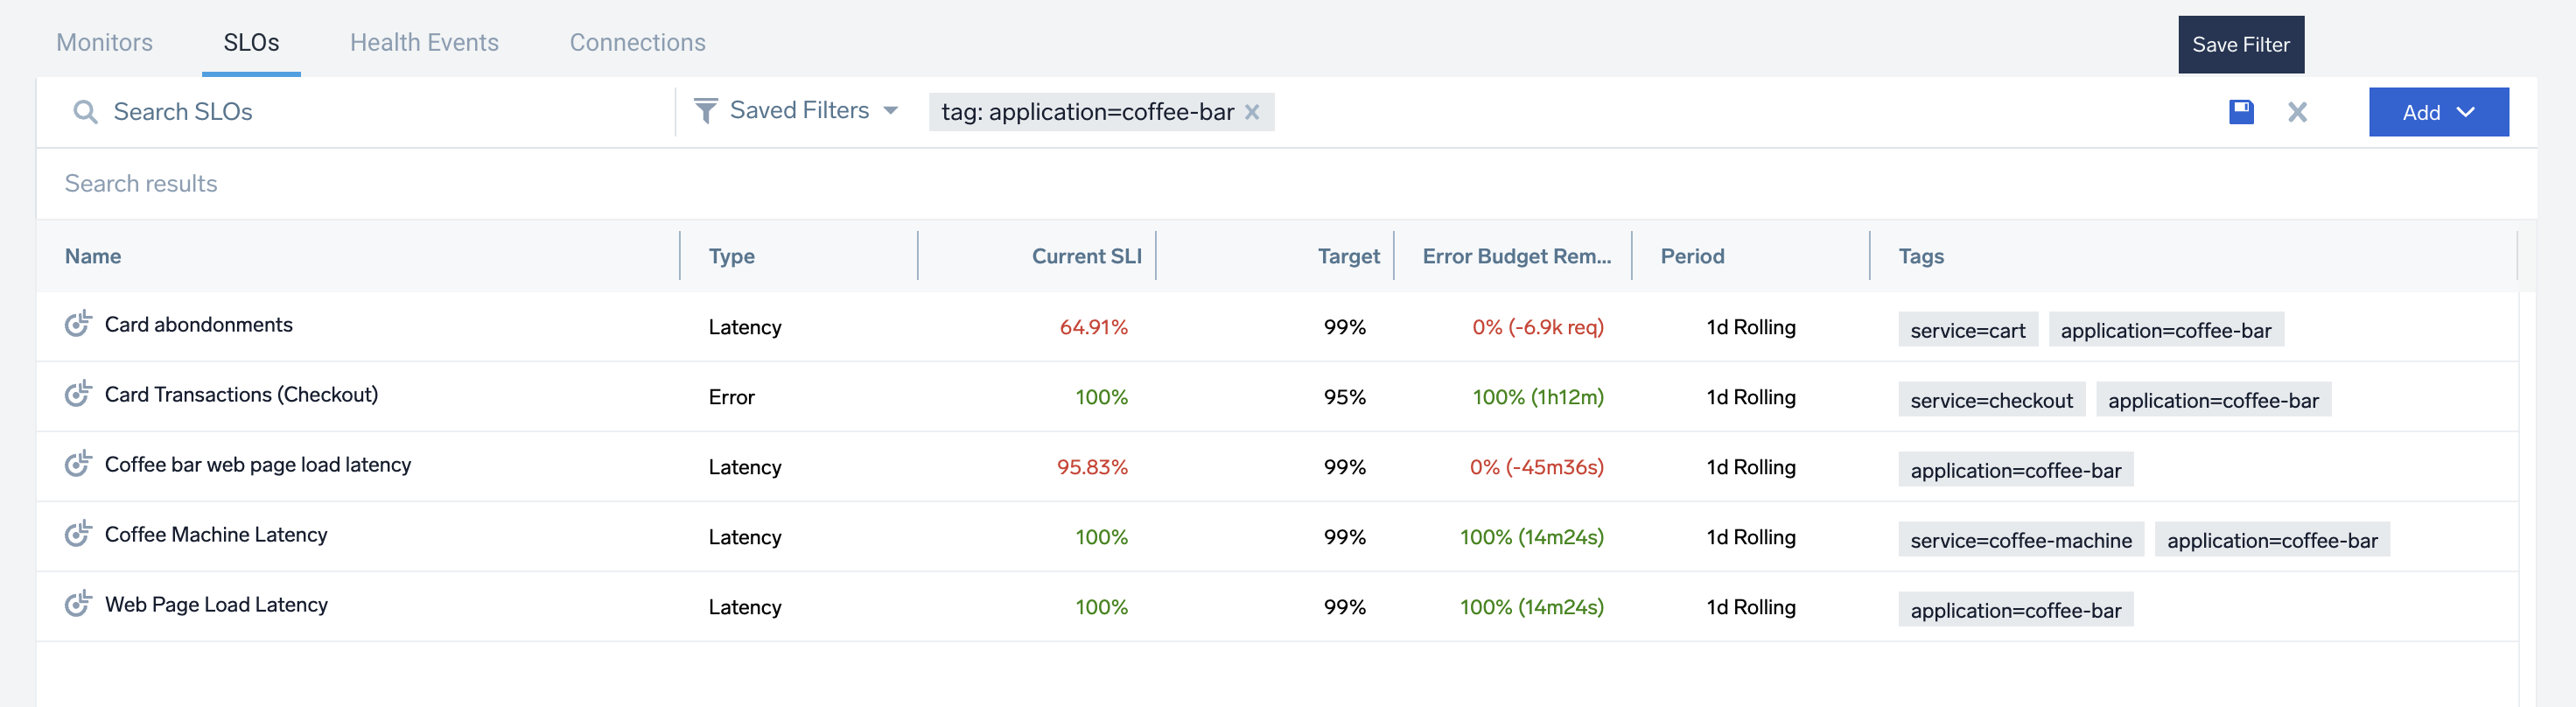
Enter the filters. In this example (see screenshot below #3), we are using tag filters. To use a tag filter, select
tag-> select tag key (applicationin this example) -> select value for that tag key (coffee-barin this example). You can select multiple filters for a saved filters. -
Click the Save Filter icon on the right.
- Enter a name for the filter (we'll call it
Coffee Bar Application).
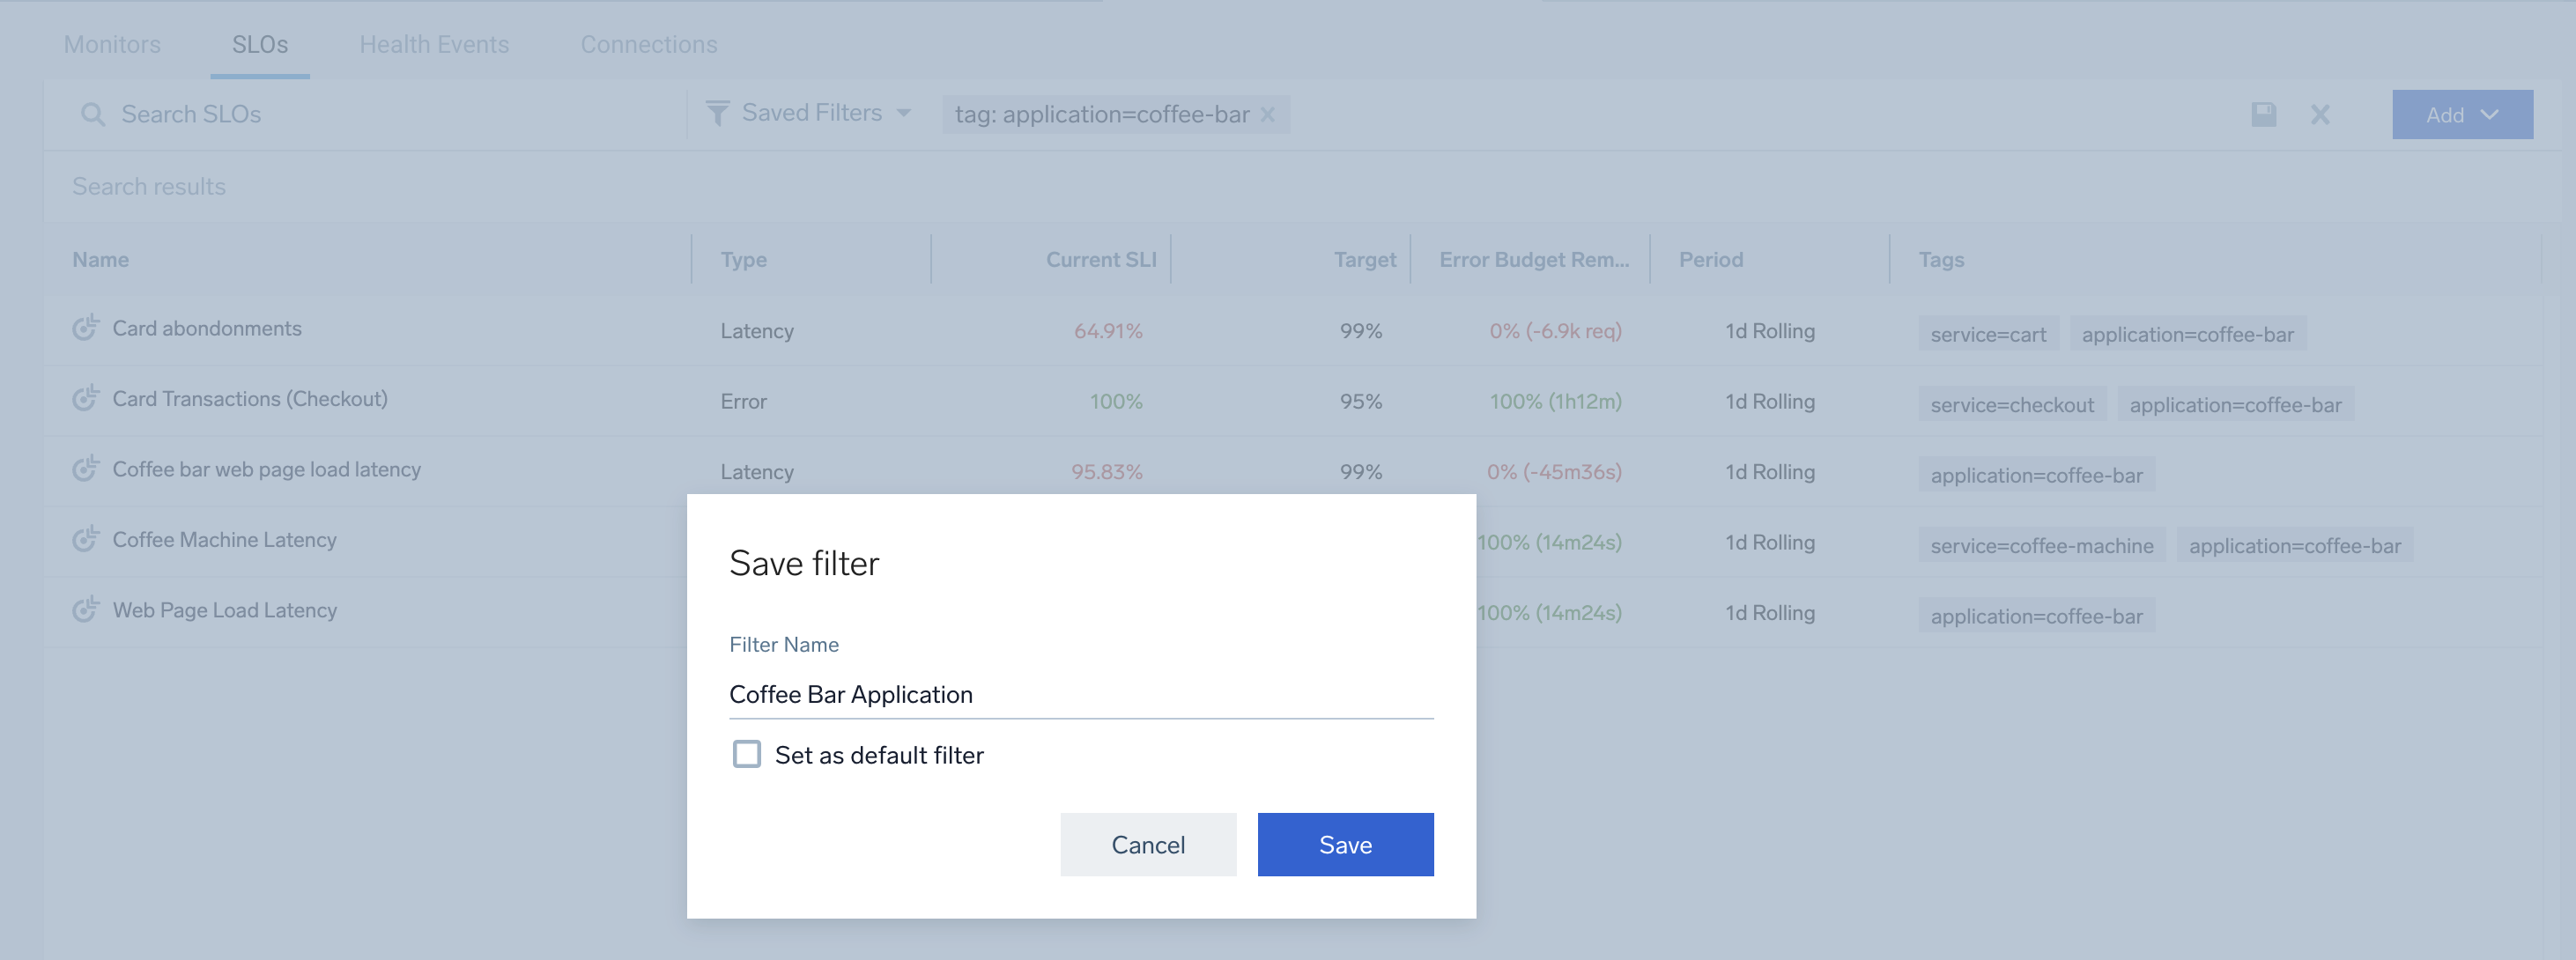
-
Optionally, you can set this as your default view so that when you load SLOs list page, this set of filters will be rendered by default.
-
Click Save.
This is how default filter rendering looks like:
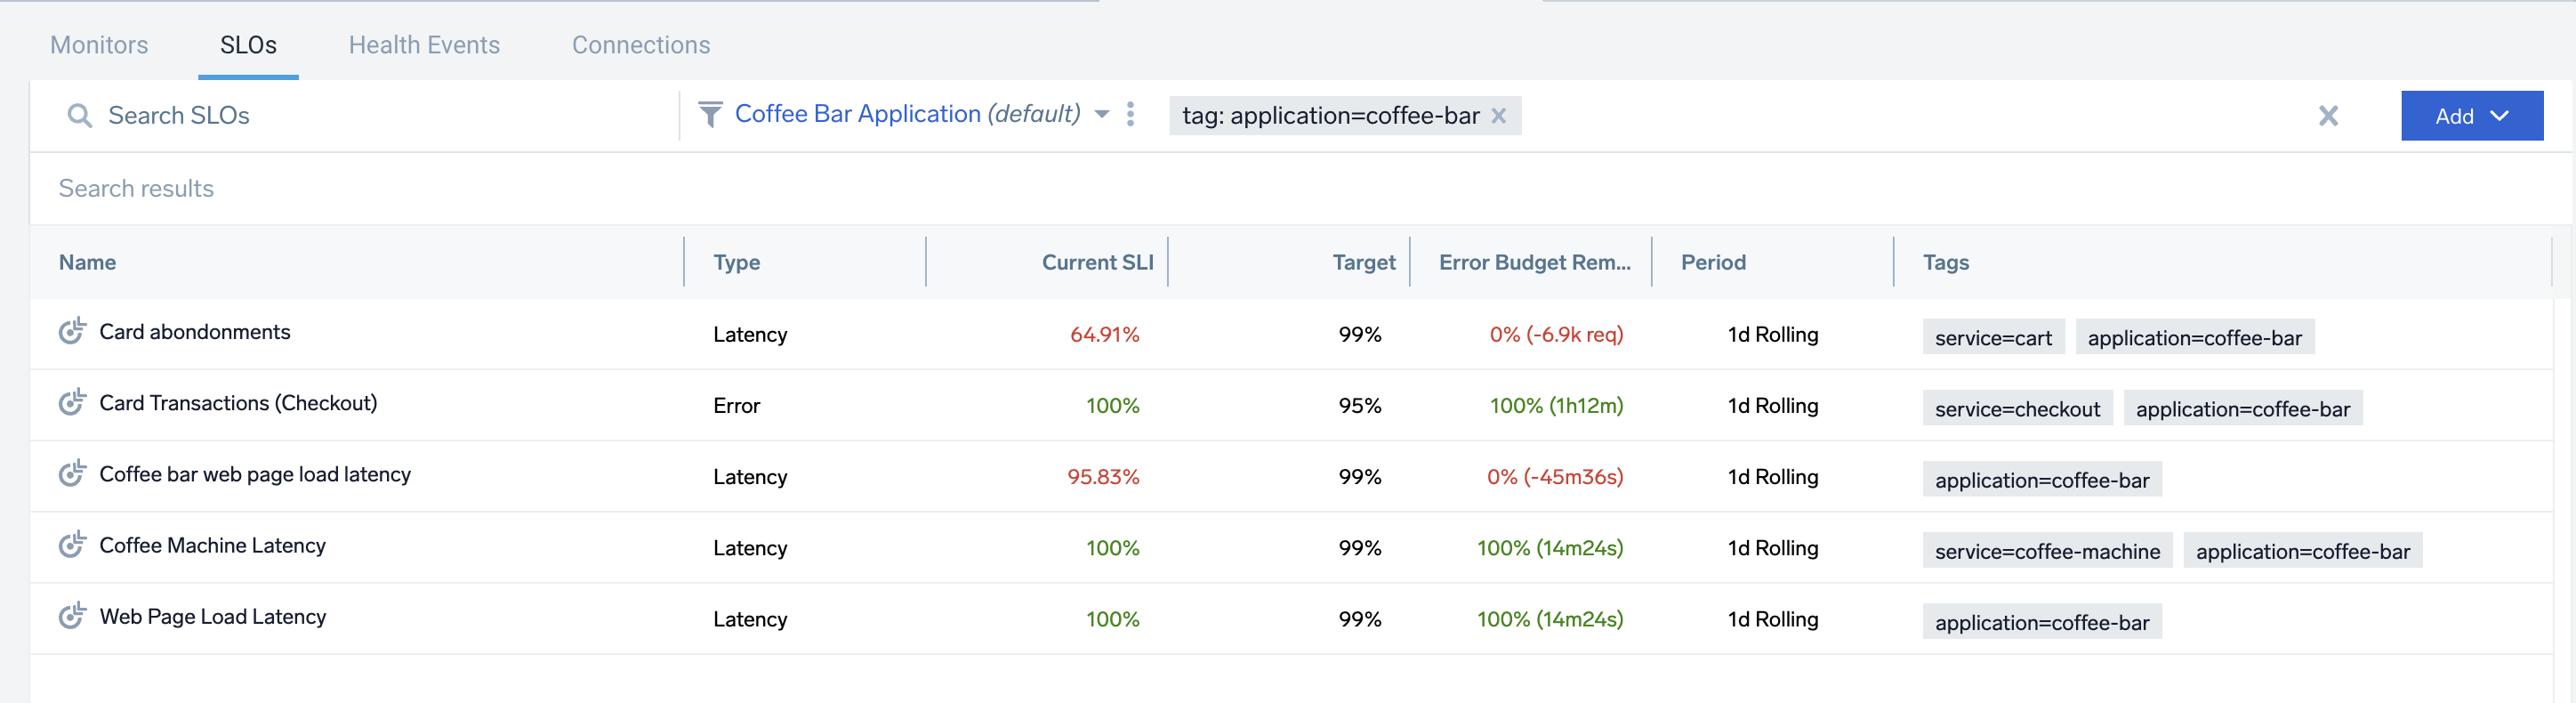
You can also set a saved filter view as default later by clicking the kebab menu next to the funnel icon > Click on Set as default.
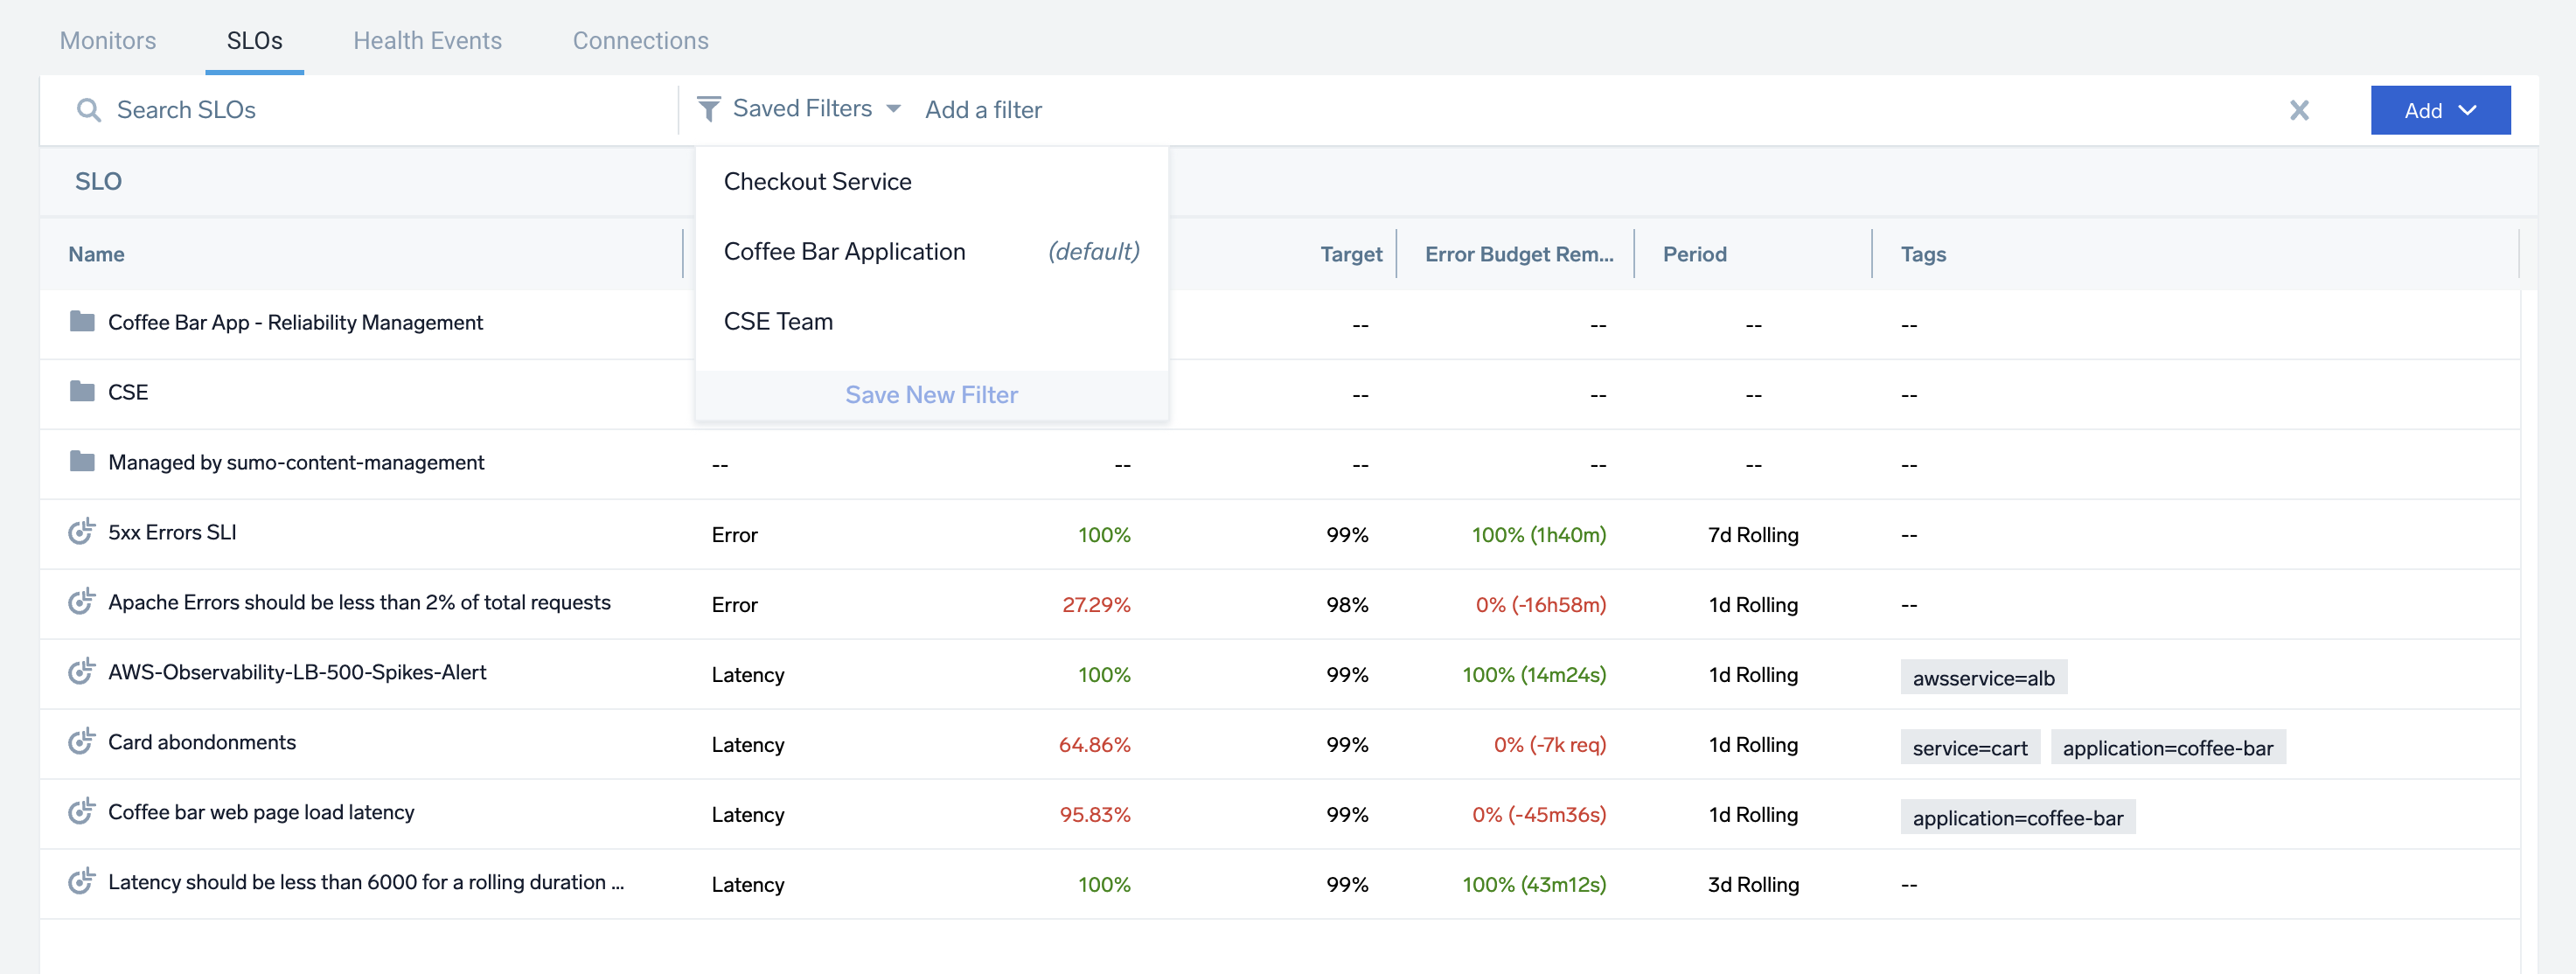
You can see the list of all saved filter views by clicking on the funnel icon.
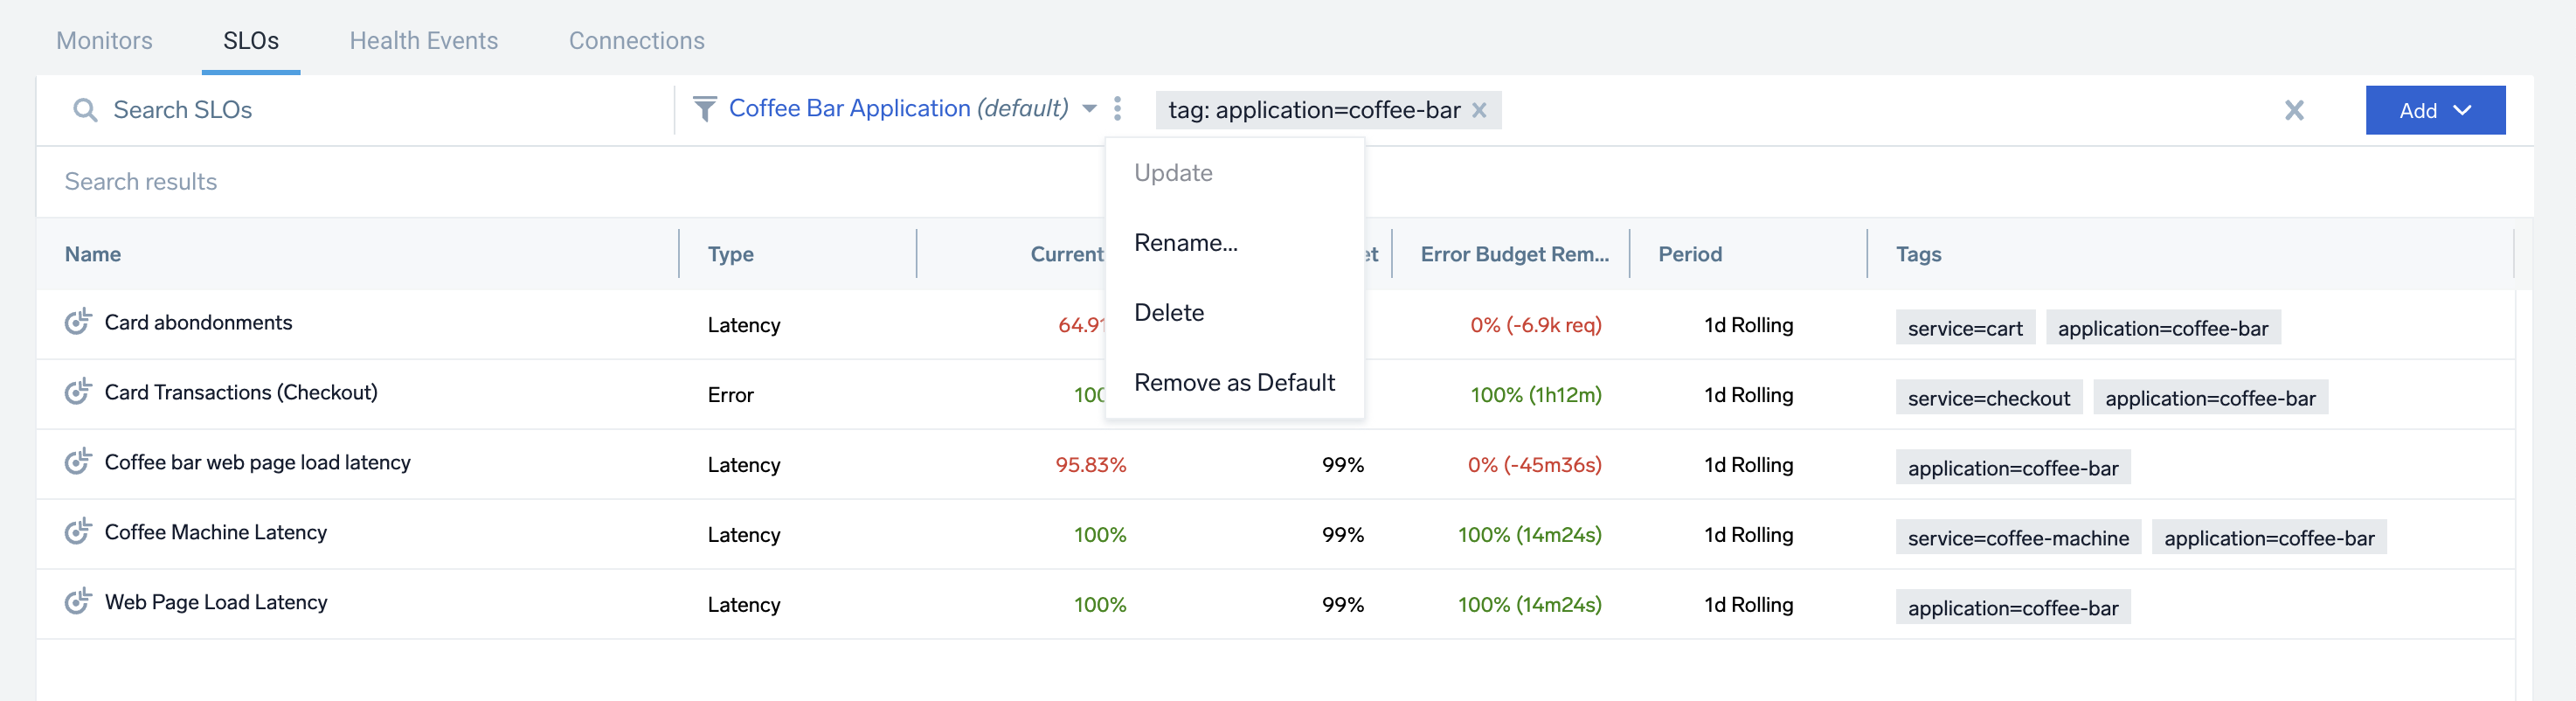
You can make further modifications to a saved filter view later using kebab menu options next to the funnel icon.
- A maximum of 10 saved views are allowed per user.
- Saved filter views are only visible to you and cannot be shared with other users in your org.