SLO Dashboards
Pre-built SLO Dashboards
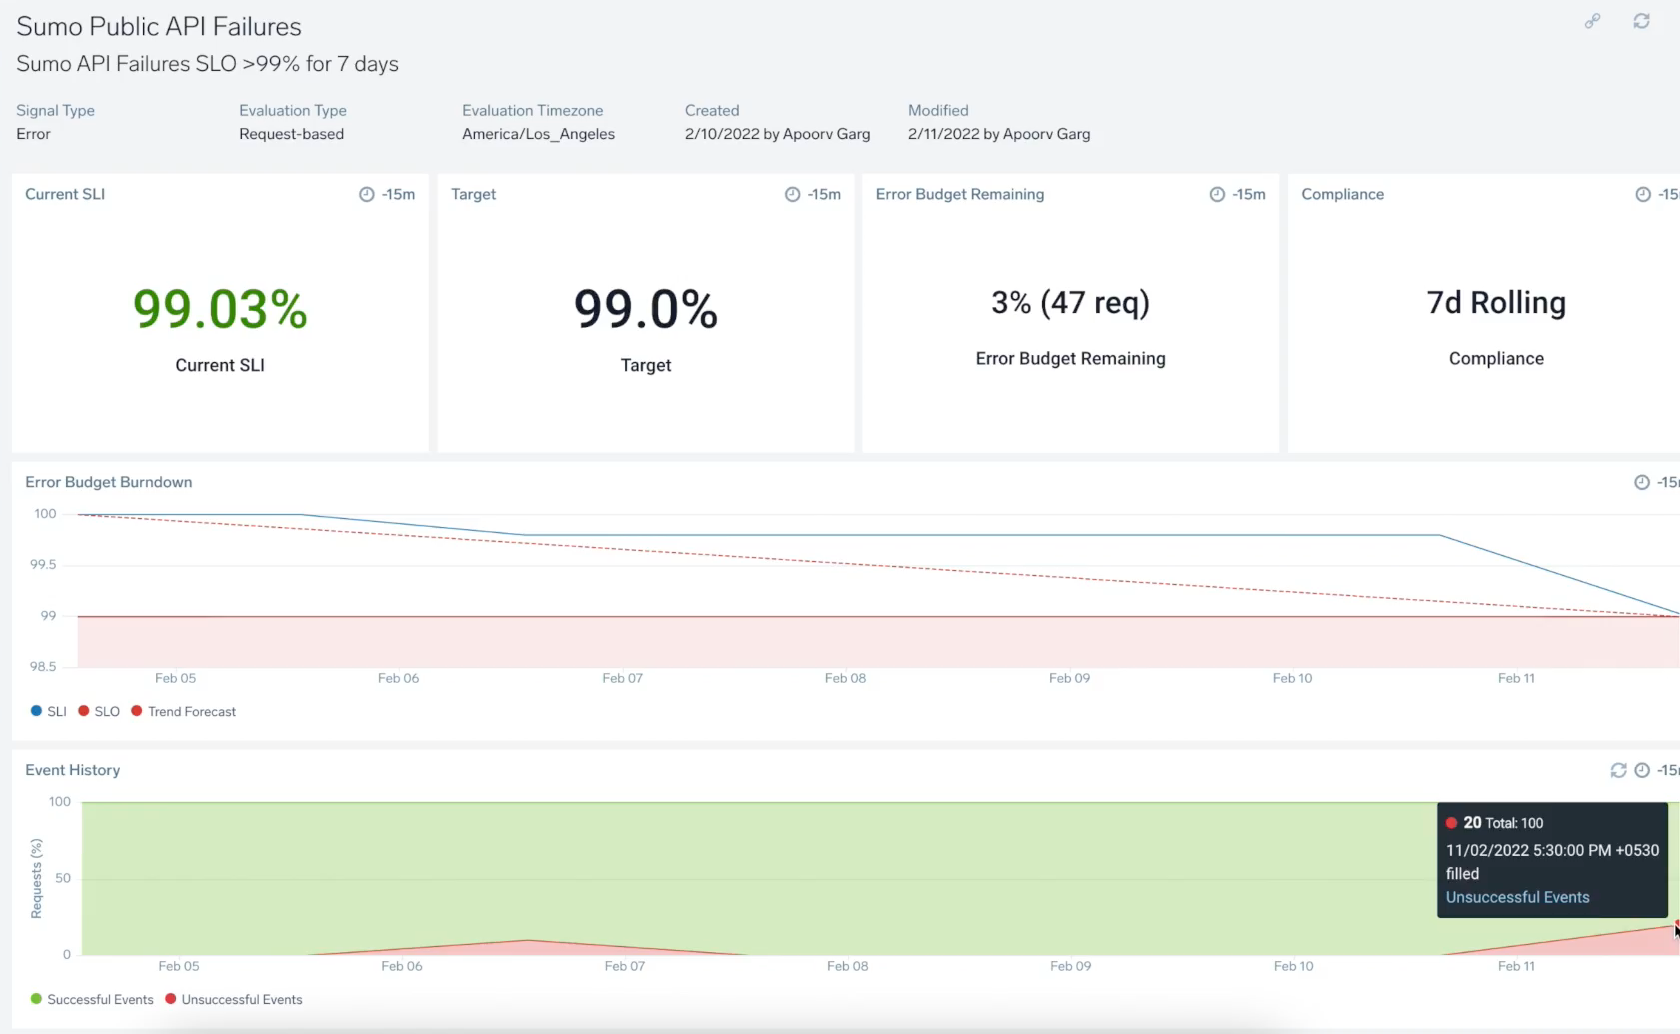
Each SLO comes with a pre-built dashboard that provides an active view into the health and status of your SLO, including the current SLI, the remaining error budget, an error budget burndown chart as well as historical performance of your SLO.
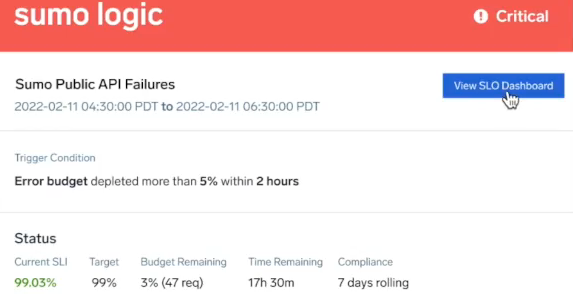
SLO dashboards are also the first point of investigation once you get alerted via SLO monitors. Click View SLO Dashboard from the alert notifications to begin investigating the alerts on your SLOs.
Dashboard Panels
Each SLO dashboard contains the following information: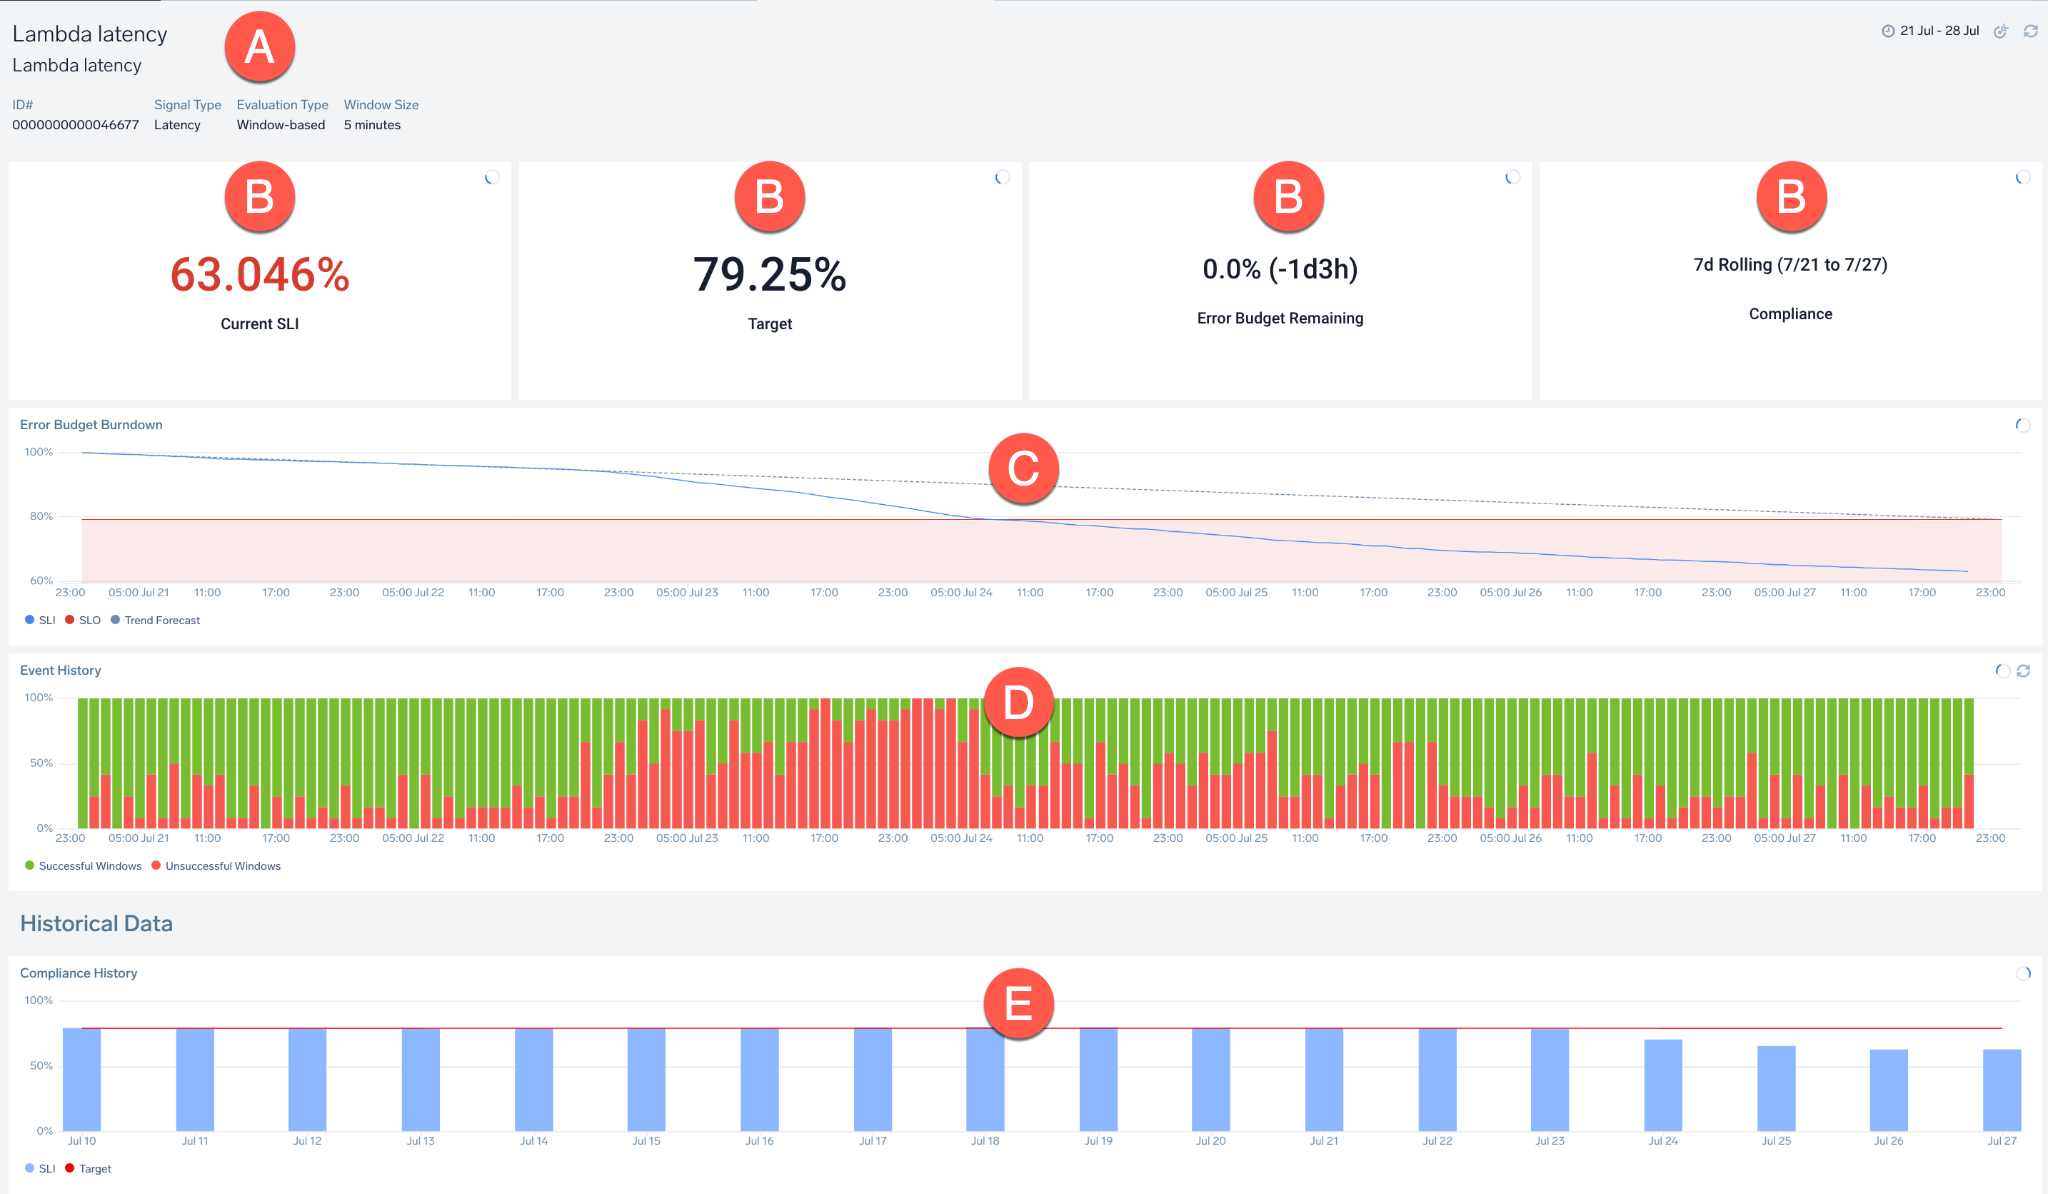
| A | General information, including the SLO name/description and SLI information:
|
| B | Panels showing:
|
| C | Error Budget Burndown: Chart tracking amount of error budget and the events that consumed it within the compliance period. Hover over any timeline to receive more information. |
| D | Event History: Tracked events that occurred during the compliance period as successful (good) and unsuccessful (bad) events. Hover over the chart to learn more about the total number of good or bad events, timeframe, and more. |
| E | Compliance History/Historical Data: Displays SLI and SLO for up to 30 compliance periods. |
Setting SLO Data Granularity
Time Ranges
To modify the time range, select and drag across dates to zoom in further. This can be useful if you want to zoom in for granular details, especially for charts with larger compliance periods.
Compliance Period
You can also filter by compliance period to view your past activity and plan ahead.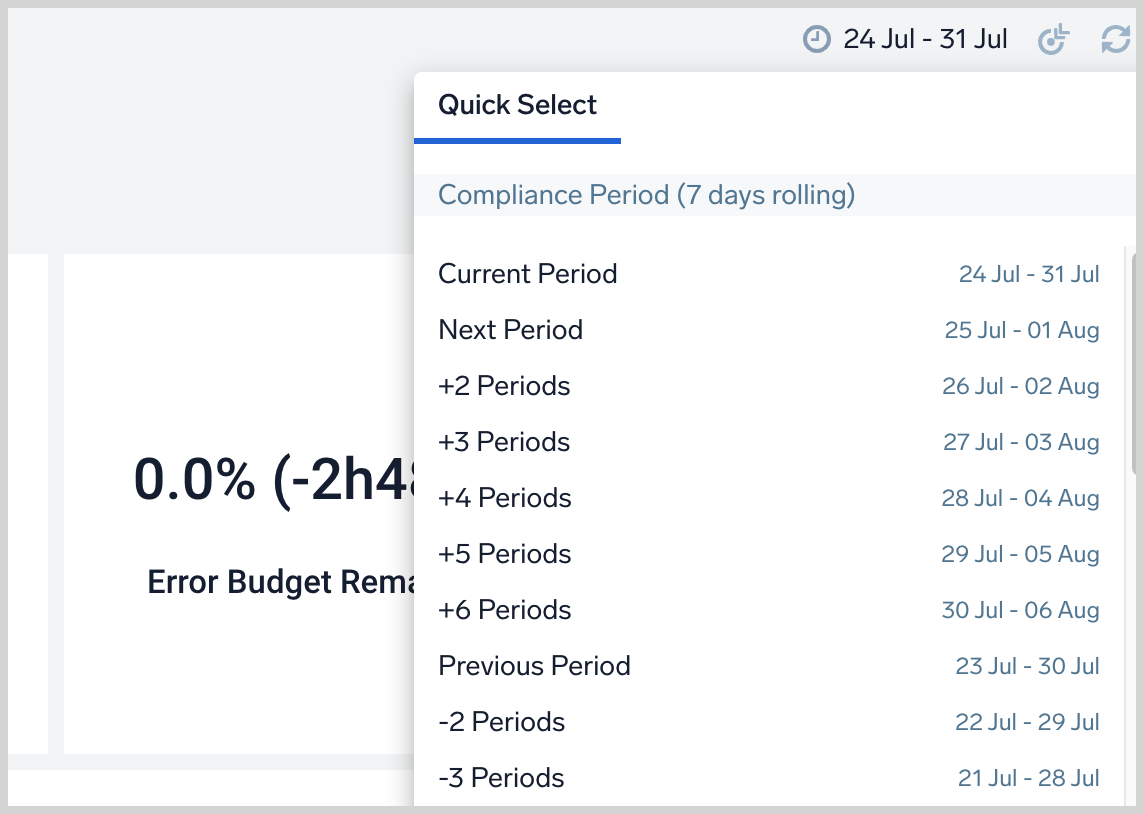
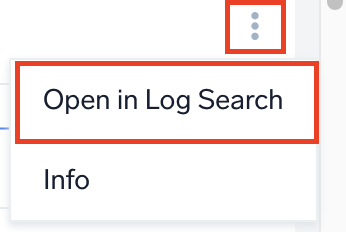
Open in Log Search
You can launch a Log Search session directly from an SLO dashboard panel, giving you the ability to drill down into further granular details.
- New UI. In the main Sumo Logic menu, select Monitoring > SLOs. You can also click the Go To... menu at the top of the screen and select SLOs.
Classic UI. In the main Sumo Logic menu, select Manage Data > Monitoring > SLOs. - Double-click on any SLO line item.
- Hover over the panel > Click the kebab icon > Open in Log Search.
Once opened in Log Search, you can click on Add to Dashboard button to add SLO dashboard panels to your own custom dashboards.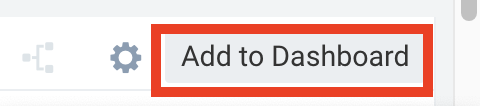
Custom SLO Dashboards
SLO Output Data as Log Messages
Sumo Logic continuously computes data for your SLOs behind the scenes. This data, which powers your SLO dashboards, is also made available as log messages, and can be used to build custom dashboards. You can execute the following query to access your SLO data in logs:
_view=sumologic_slo_output
It has the following schema:
-
Time: timestamp -
sloId: Id of the SLO, as displayed in the SLO dashboard URL -
goodCount: count of good requests, for request-based, and good windows for windows-based SLOs, based on SLO query definition -
totalCount: count of eligible requests for request-based, and eligible windows for windows-based SLOs, based SLO query definition -
sloVersion: version of SLO definition. ThesloVersionis only changed whenever there is a change in semantics of the underlying SLI definition. Therefore, thesloVersionis incremented by 1 in case of following modifications only:- Changing Source of the SLO. Example: changing Query Based to Monitor Based.
- Changing Evaluation Type. Example: changing Request-based to Window-based or changing Window size of SLO.
- Any changes to SLO Queries. This includes modifying the queries, changing Query Type, changing the Use values from and changing the Success Criteria.
- Changing Timezone of SLO.
Likewise,
sloVersiondoes NOT change on modifications to fields like Name, Description, Target, Compliance Type, Compliance Period, Tags, and Signal Type.
These log messages may be delayed by up to an hour, as the system ensures consistency to account for ingest delay of source telemetry.
SLO Lookup Table
The SLO lookup table is a fully managed lookup table, that contains the latest definitions of all your SLOs. It can be use to enrich the data in your sumologic_slo_output view to build custom dashboards.
The SLO lookup table resides under a fixed path, sumo://content/slos. You can list all your SLOs using the log query cat sumo://content/slos.
To join the results of your SLO precomputed data from _view=sumologic_slo_output with the metadata contained in the SLO lookup table, you can use the following query:
_view=sumologic_slo_output
| lookup * from sumo://content/slos on sloId, sloVersion
Custom Dashboard Examples
Error Budget Remaining for all SLOs
Say you want a high-level overview into the health of your SLOs. A honeycomb visualization on the error budget remaining percentage is a nice way to achieve that.
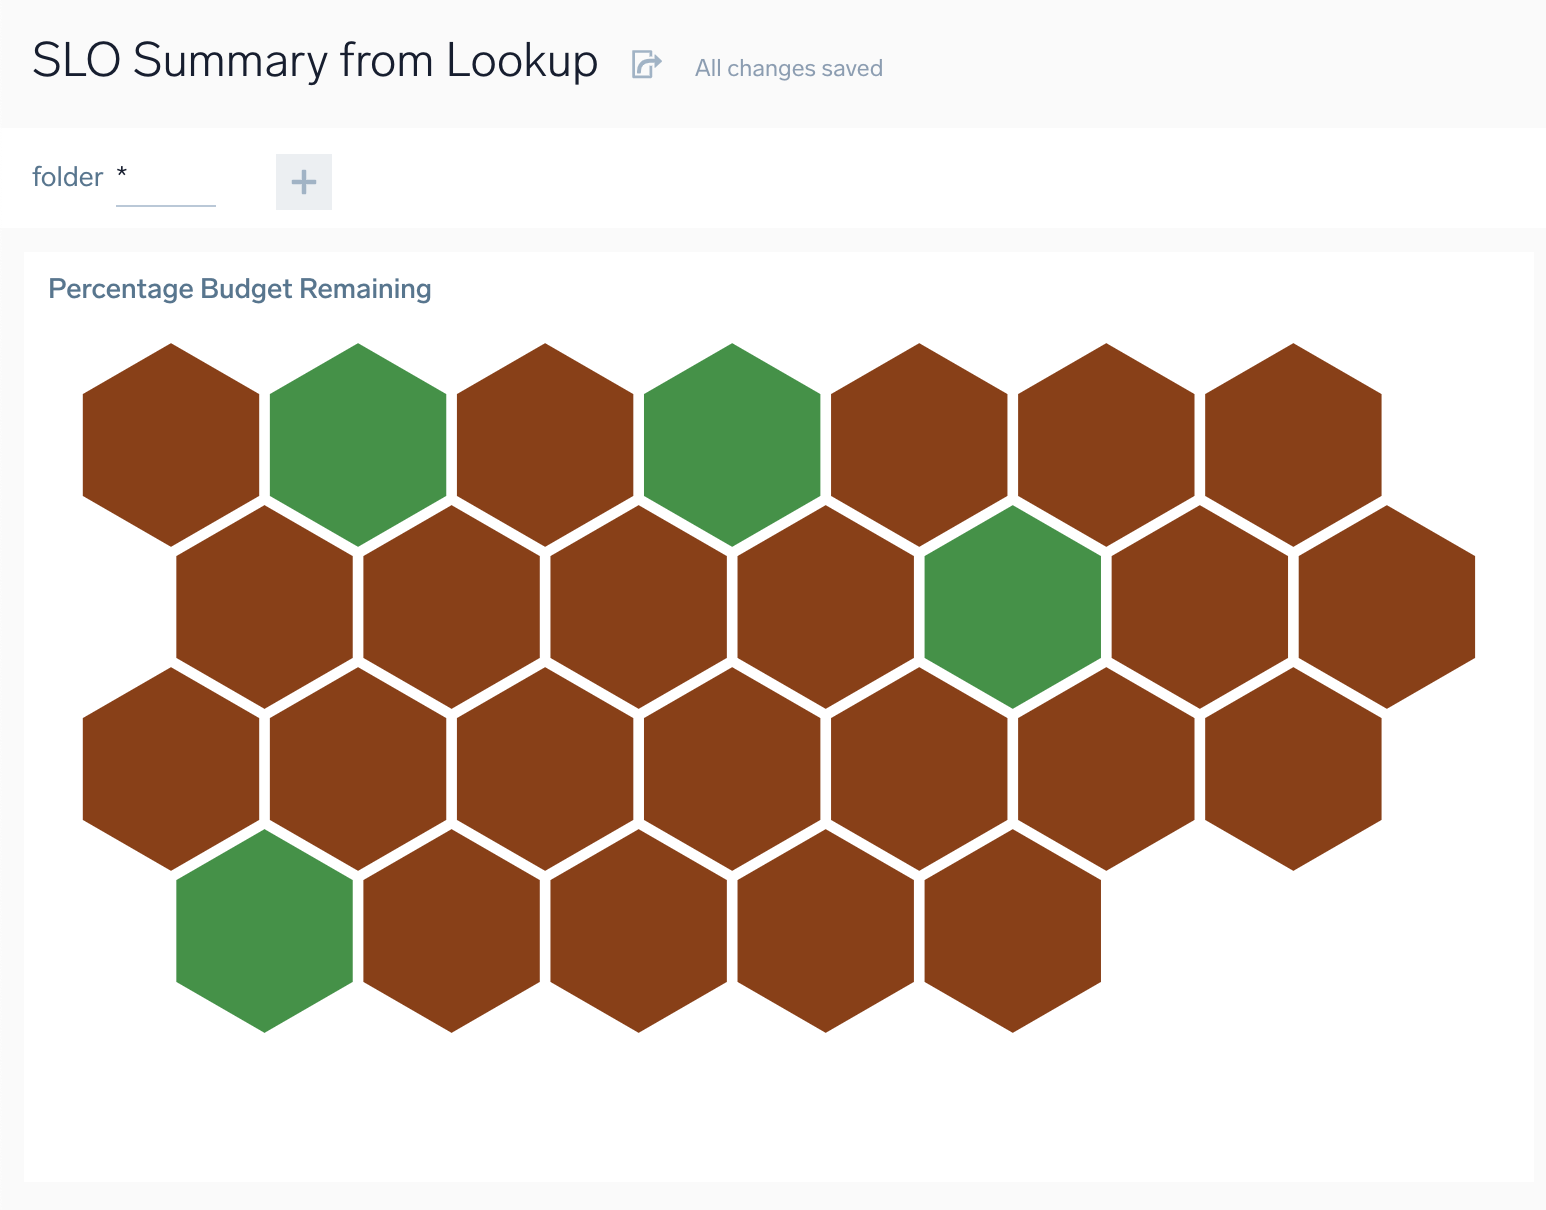
You can use the following query to construct the above:
_view=sumologic_slo_output
| lookup * from sumo://content/slos on sloId, sloVersion
| where !isBlank (sloname) and slofolderpath matches "*"
| concat (sloname, " (", sloId, ")") as sloUniqueName
| sum (goodCount) as goodEvents, sum(totalCount) as totalEvents, last (compliancetarget) as target, last(slofolderpath) as sloPath, last(sliwindowsize) as sliwindowsize, last(slievaluationtype) as evaluationType by sloUniqueName
| totalEvents - goodEvents as badEvents
| if (evaluationType = "Window", queryTimeRange() / sliwindowsize, totalEvents) as denominator
| 100 * (1 - badEvents / denominator) as sli
| 100 * (sli - target) / (100 - target) as budgetRemaining
| if(budgetRemaining < 0, 0, budgetRemaining) as budgetRemaining
| fields sloUniqueName, budgetRemaining
Visualize all SLOs for a service
Let's say you have multiple SLOs for your ingestion service and you want to visualize all of those together. You can tag all those SLOs with service=ingestion and then leverage your SLO tags in Log Search queries using the SLO lookup table. Here's the query that will return data from all your SLOs belonging to the ingestion service:
_view=sumologic_slo_output
| lookup tags from sumo://content/slos on sloId, sloVersion
| json field=tags "service"
| where service="ingestion"
Now that you have filtered the exact set of SLOs needed, all sorts of roll ups can be done using log search operators.
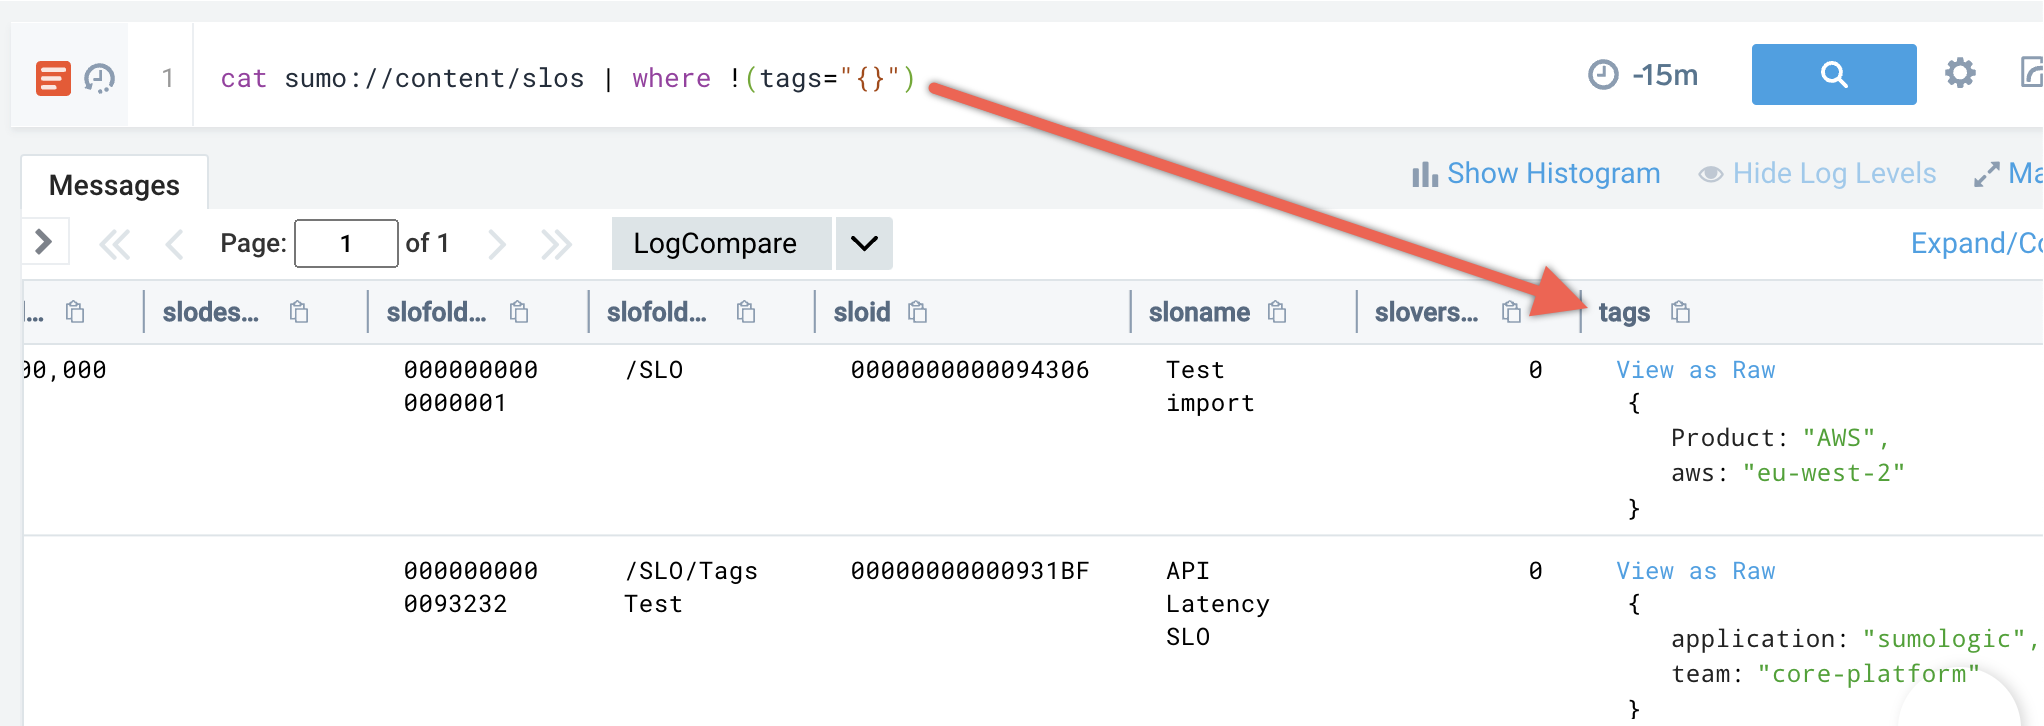
In general, to display all of your SLOs that have one or more tags:
CAT sumo://content/slos
| where !(tags = "{}")