Installing the SDO App and Dashboards
If you've set up the Software Development Optimization (SDO) solution using Terraform, you can skip the manual installation of SDO app.
Installing the SDO app
Now that you've set up SDO configuration and collection, install the Sumo Logic App for Software Development Optimization to use the pre-configured searches and dashboards that provide you insights and visibility into your DevOps phases and pipelines.
To install the app:
- Select App Catalog.
- In the 🔎 Search Apps field, run a search for your desired app, then select it.
- Click Install App.
note
Sometimes this button says Add Integration.
- On the next configuration page, under Select Data Source for your App, complete the following fields:
- Data Source. Select one of the following options:
- Choose Source Category and select a source category from the list; or
- Choose Enter a Custom Data Filter, and enter a custom source category beginning with an underscore. For example,
_sourceCategory=MyCategory.
- Folder Name. You can retain the existing name or enter a custom name of your choice for the app.
- All Folders (optional). The default location is the Personal folder in your Library. If desired, you can choose a different location and/or click New Folder to add it to a new folder.
- Data Source. Select one of the following options:
- Click Next.
- Look for the dialog confirming that your app was installed successfully.
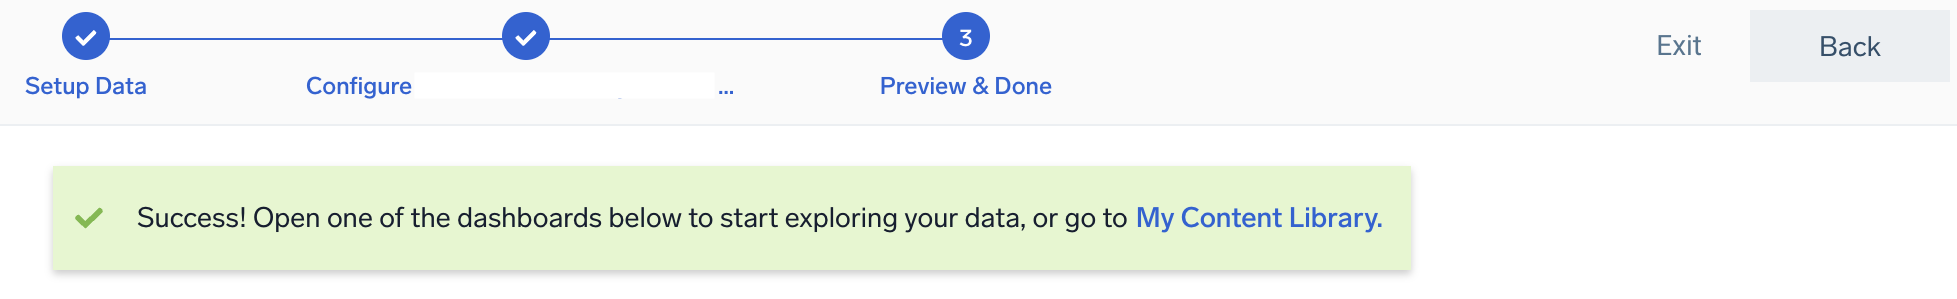
Post-installation
Once your app is installed, it will appear in your Personal folder or the folder that you specified. From here, you can share it with other users in your organization. Dashboard panels will automatically start to fill with data matching the time range query received since you created the panel. Results won't be available immediately, but within about 20 minutes, you'll see completed graphs and maps.
Each of the Software Development Optimization Solution apps provides a set of pre-configured dashboards that display real-time data from across your environment. Being able to access this information behind single-pane-of-glass allows you to more effectively monitor and troubleshoot your DevOps projects from inception through deployment.
Software Development Optimization App Dashboards
The SDO solution comprises multiple apps listed below.
- Software Development Optimization. Dashboards in this app provide insights into the four DORA metrics that help measure application release velocity and availability as well as help you monitor and troubleshoot issues in individual phases of your DevOps pipelines.
- Jira Cloud App and Jira (Server) App. Dashboards in these apps provide insights into the “Plan” phase of the DevOps plan phase that so as to enable you to more effectively plan, assign, track, report, and manage work across multiple teams.
- Bitbucket App. Dashboards in this app provide insights into Bitbucket issues, pull requests, builds, and deployments.
- Opsgenie App and PagerDuty App. Dashboards in these apps provide insights into how production incidents are being created and resolved.
- GitHub App. Dashboards in this app provide analytics around GitHub branch operations, issues, pull requests, user activity, and security events.
- Jenkins App. Dashboards in this app help you monitor build successes, failures, and Jenkins master and slave server performance.
- GitLab App. Dashboards in this app provide a complete overview of your GitLab’s builds, deployments, pipelines, issues, merge requests, and commits.
- CircleCI App. The CircleCI app for Sumo Logic provides advanced views to track the performance and health of your continuous integration and deployment pipelines.
Dashboard Filter with Template Variables
Template variables provide dynamic dashboards that rescope data on the fly. As you apply variables to troubleshoot through your dashboard, you can view dynamic changes to the data for a fast resolution to the root cause. For more information, see the Filter with template variables help page.
You can use template variables to drill down and examine the data on a granular level.
DORA Metrics Dashboards
These dashboards calculate four DORA metrics that help measure application release velocity and availability. The Software Development Optimization - DORA Metrics dashboard resides in the top-level folder created at app install time and detailed dashboards that help you drill-down into the individual metrics reside in the DORA Metrics folder.
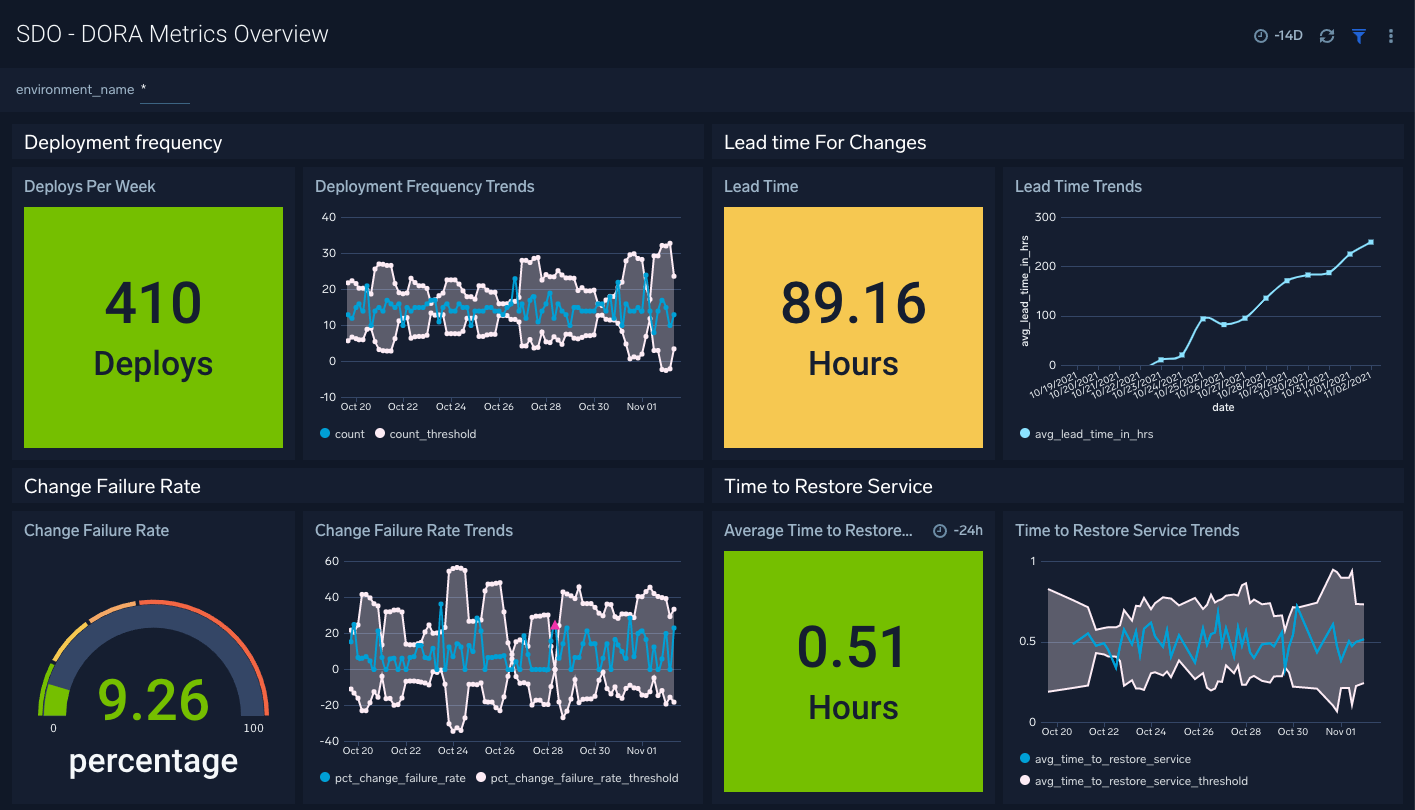
SDO - DORA Metrics Overview
The Software Development Optimization- DORA Metrics Overview dashboard calculates the four key DORA metrics identified in the State of DevOps report, which help you measure application development velocity and application reliability.
The four metrics are:
- Lead time, which quantifies how long it takes to go from code commit to completed production deployment. This is identified by the time taken from when a merge commit event occurs to when that commit is successfully deployed to production.
- Deployment Frequency measures how often code is deployed to production.
- Time to restore service measures the average elapsed time from when a service incident occurs to when it is resolved. This is calculated by the time it takes to close a priority 1 or most critical incident once opened.
- Change Failure rate describes the percentage of deployments to production that subsequently requires remediation (For example, by rolling a release back or deploying a hotfix). This is the percentage of the number of priority one or critical incidents to the number of successful deploys to production.
Use this dashboard to:
- Understand the effectiveness of the development and delivery process in terms of application development velocity and reliability.
- Monitor trends for each metric to identify any unexpected peaks and lows.
- Understand how the DORA metrics apply to each team, service, and application environment.
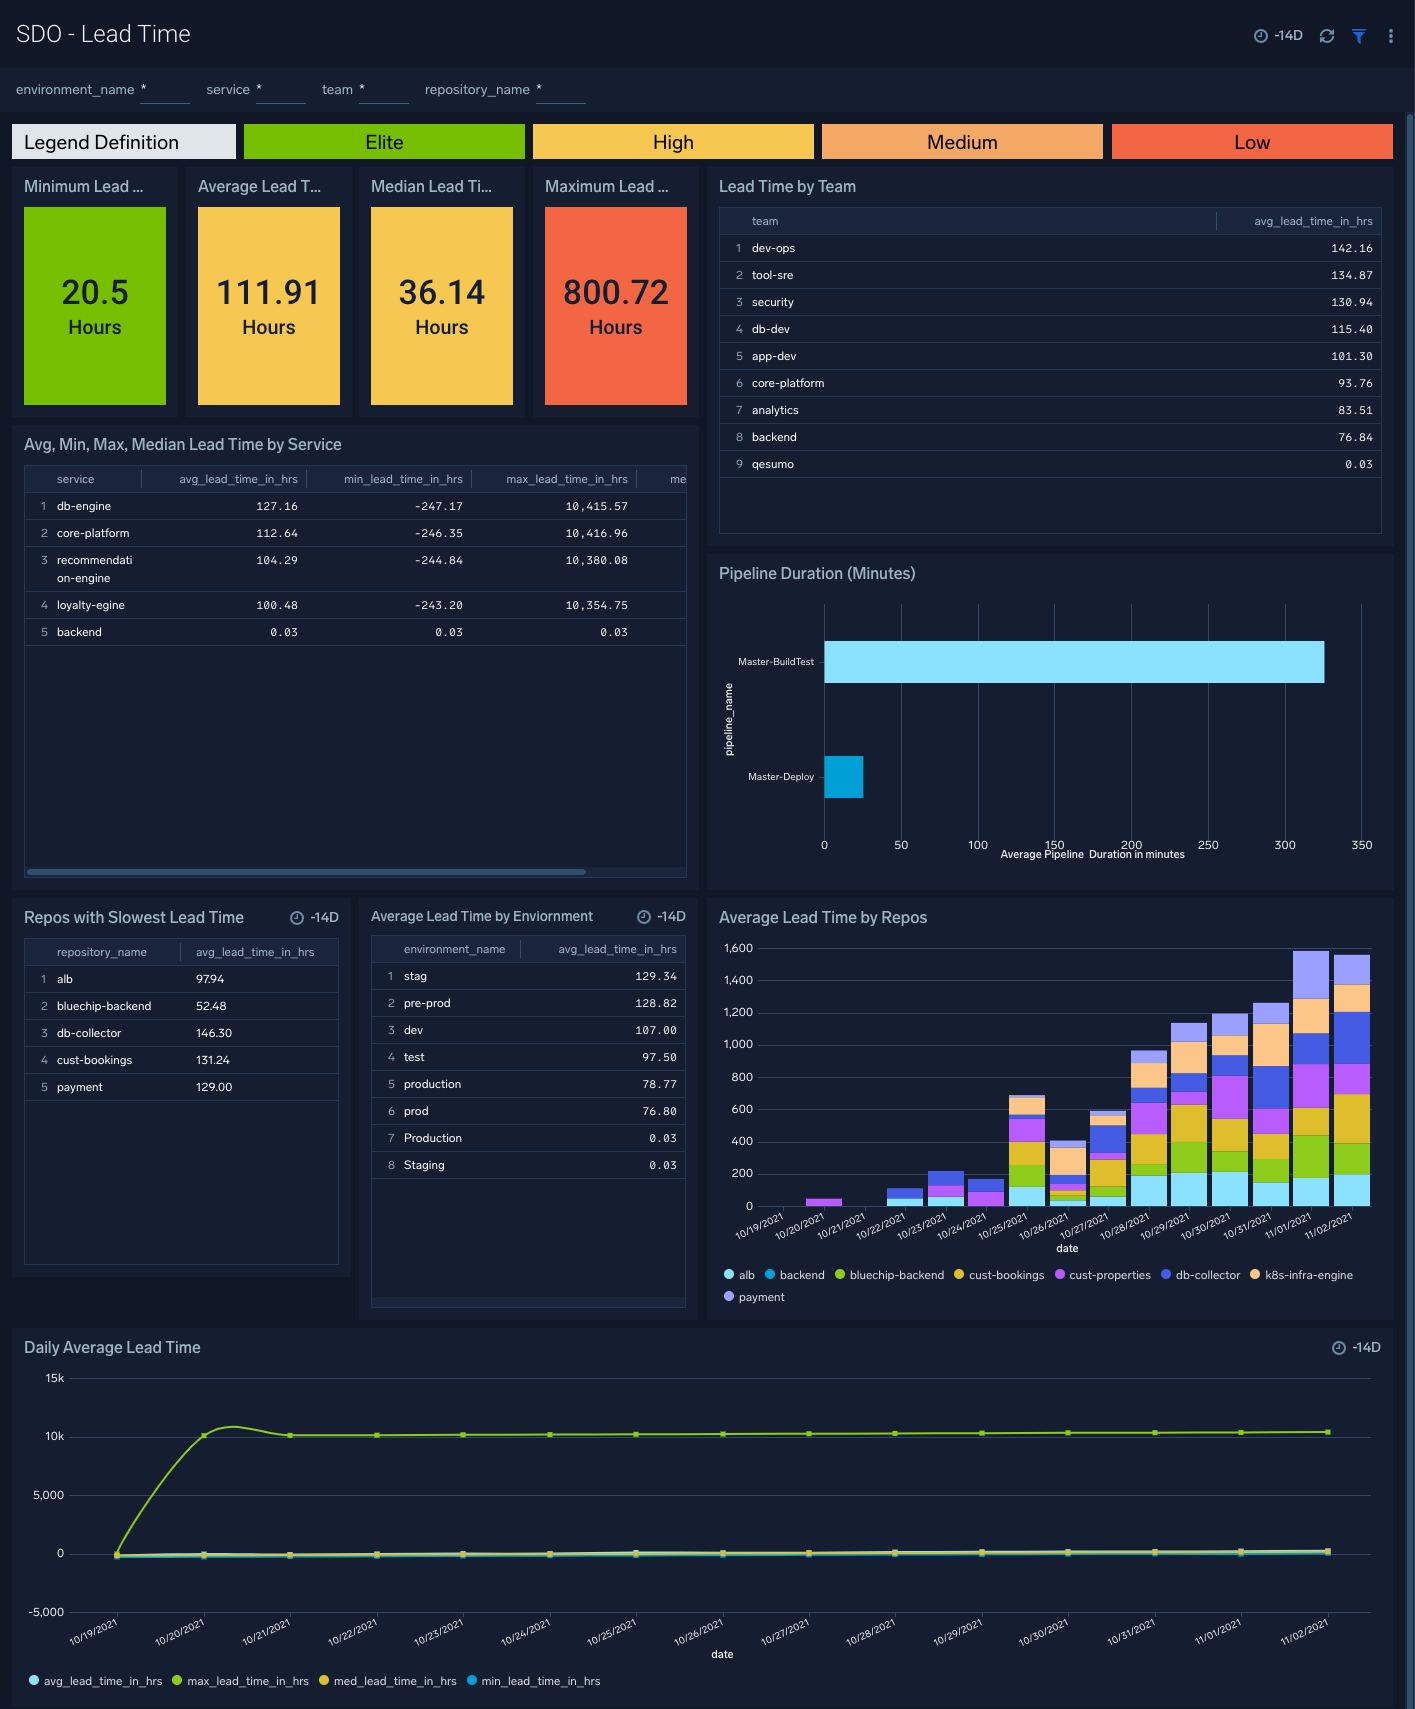
SDO - Lead Time
The Software Development Optimization- Lead Time dashboard provides insight into various aspects that affect the lead time DORA metric.
Use this dashboard to:
- Determine the overall lead time.
- Determine which service, team, repositories, or pipelines are affecting the overall lead time have.
- Monitor deployment frequency trends and quickly identify any unexpected highs and lows.
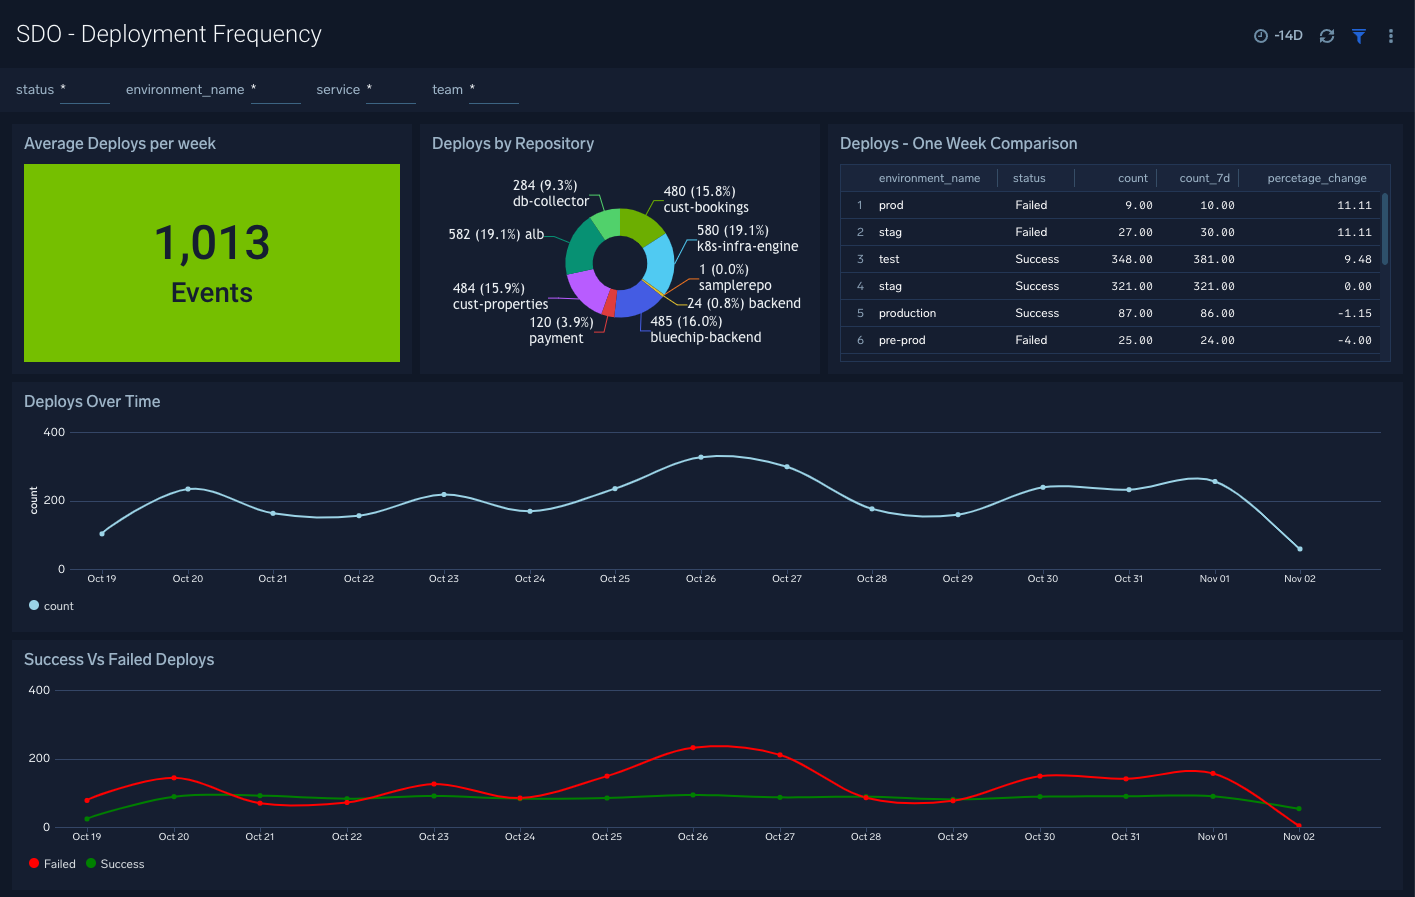
SDO - Deployment Frequency
The Software Development Optimization- Deployment Frequency dashboard provides insight on how deploys to production affect your overall deployment frequency.
Use this dashboard to:
- Determine the overall deployment frequency.
- Monitor trends of successful and failed deploy to determine how it affects deployment frequency.
- Identify deploys by service, team, and deployment environments (production, test, staging, etc.) to determine areas of improvement.
- Monitor deployment frequency trends and quickly identify any unexpected highs and lows.
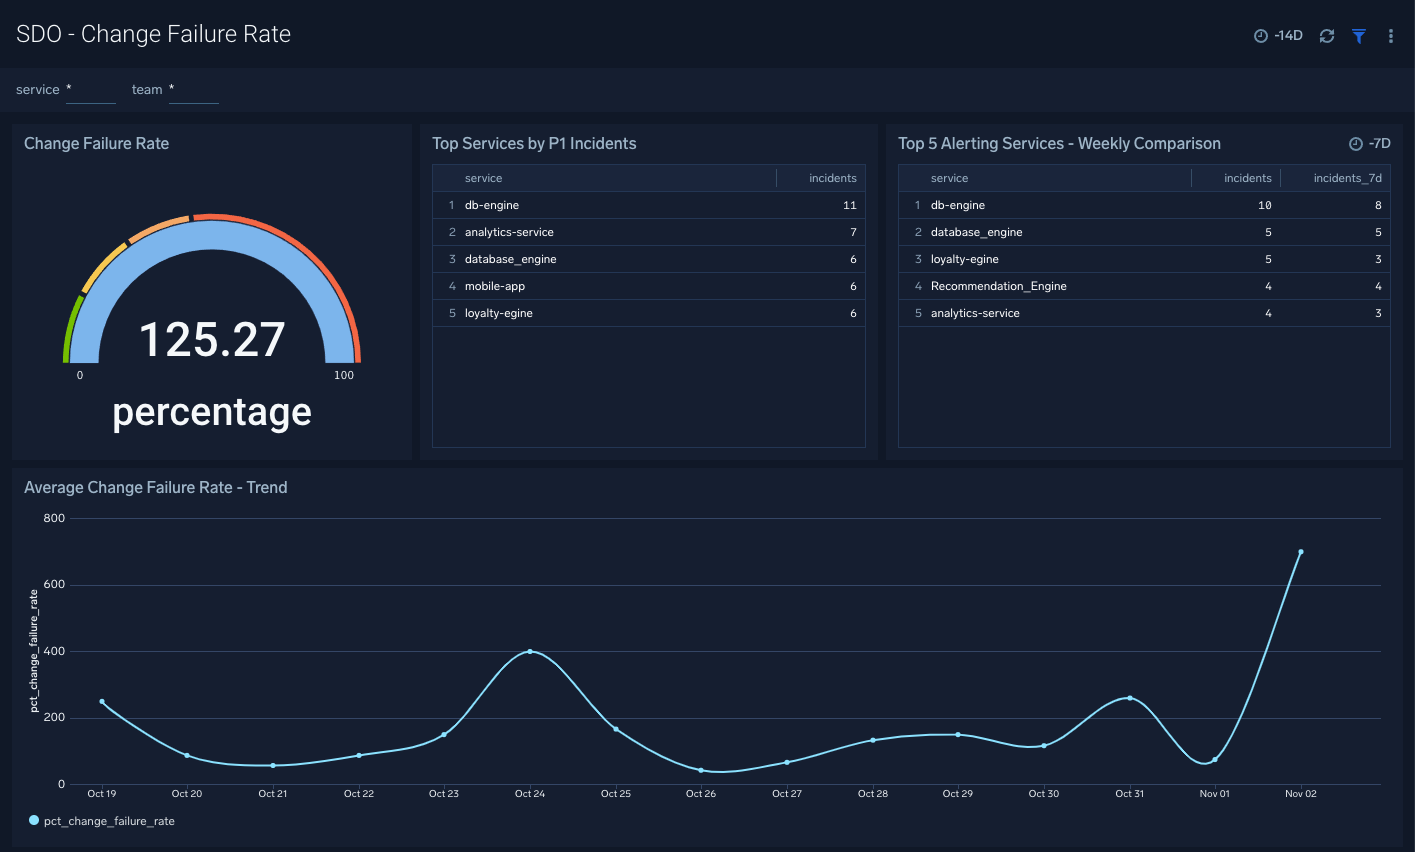
SDO - Change Failure Rate
The Software Development Optimization- Change Failure Rate dashboard provides insights into services and trends affecting Change Failure Rate.
Use this dashboard to:
- Determine the overall change failure rate
- Find top services that are impacted by critical incidents so you can allocate resources accordingly.
- Monitor change failure rate trends and identify unexpected highs and lows
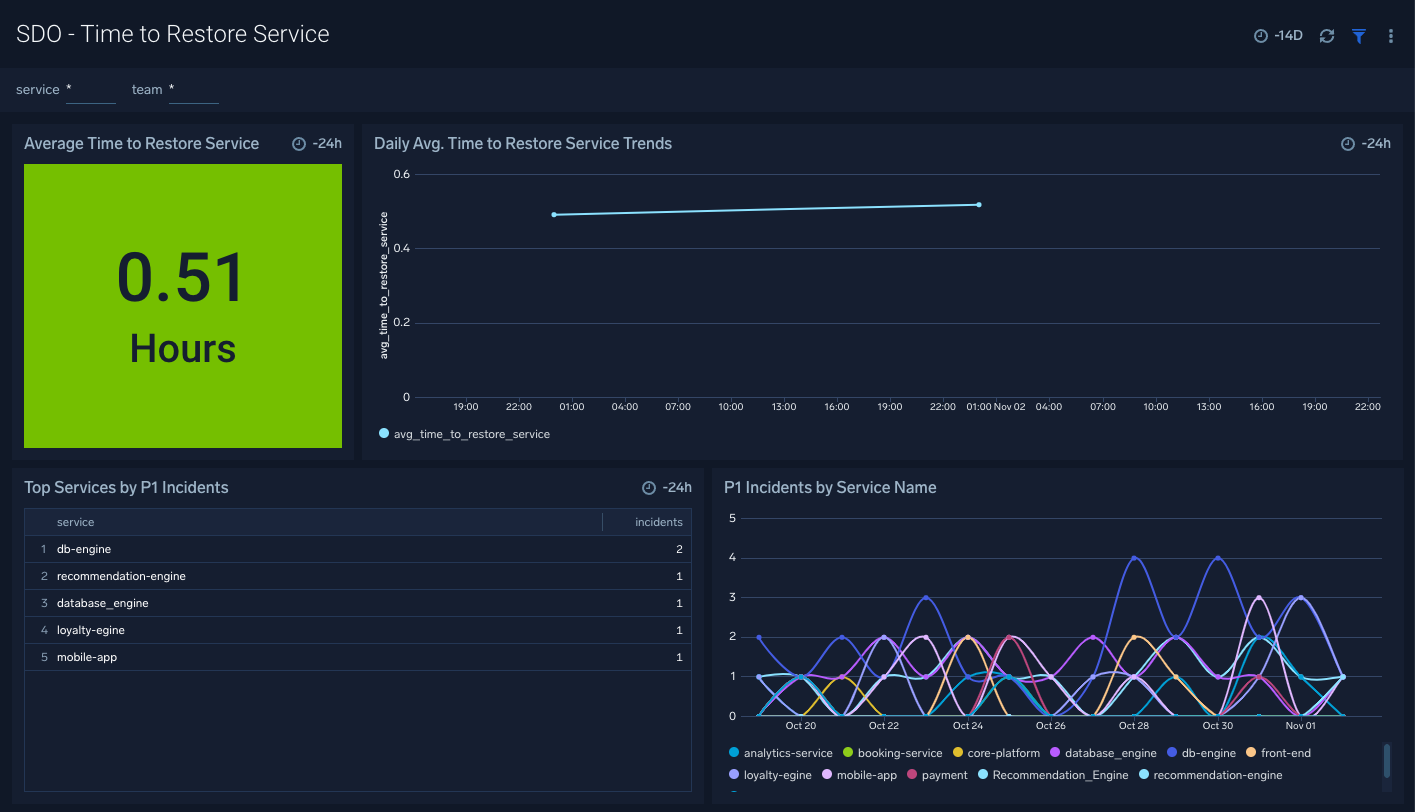
SDO - Time To Restore Service
The Software Development Optimization- Time To Restore Service dashboard provides insights into services and trends affecting Change Failure Rate.
Use this dashboard to:
- Determine the overall time to restore the service DORA metric.
- Determine top services, that are impacted by critical incidents so you can allocate resources accordingly.
- Monitor trends in the time to restore service values and identify unexpected highs and lows.
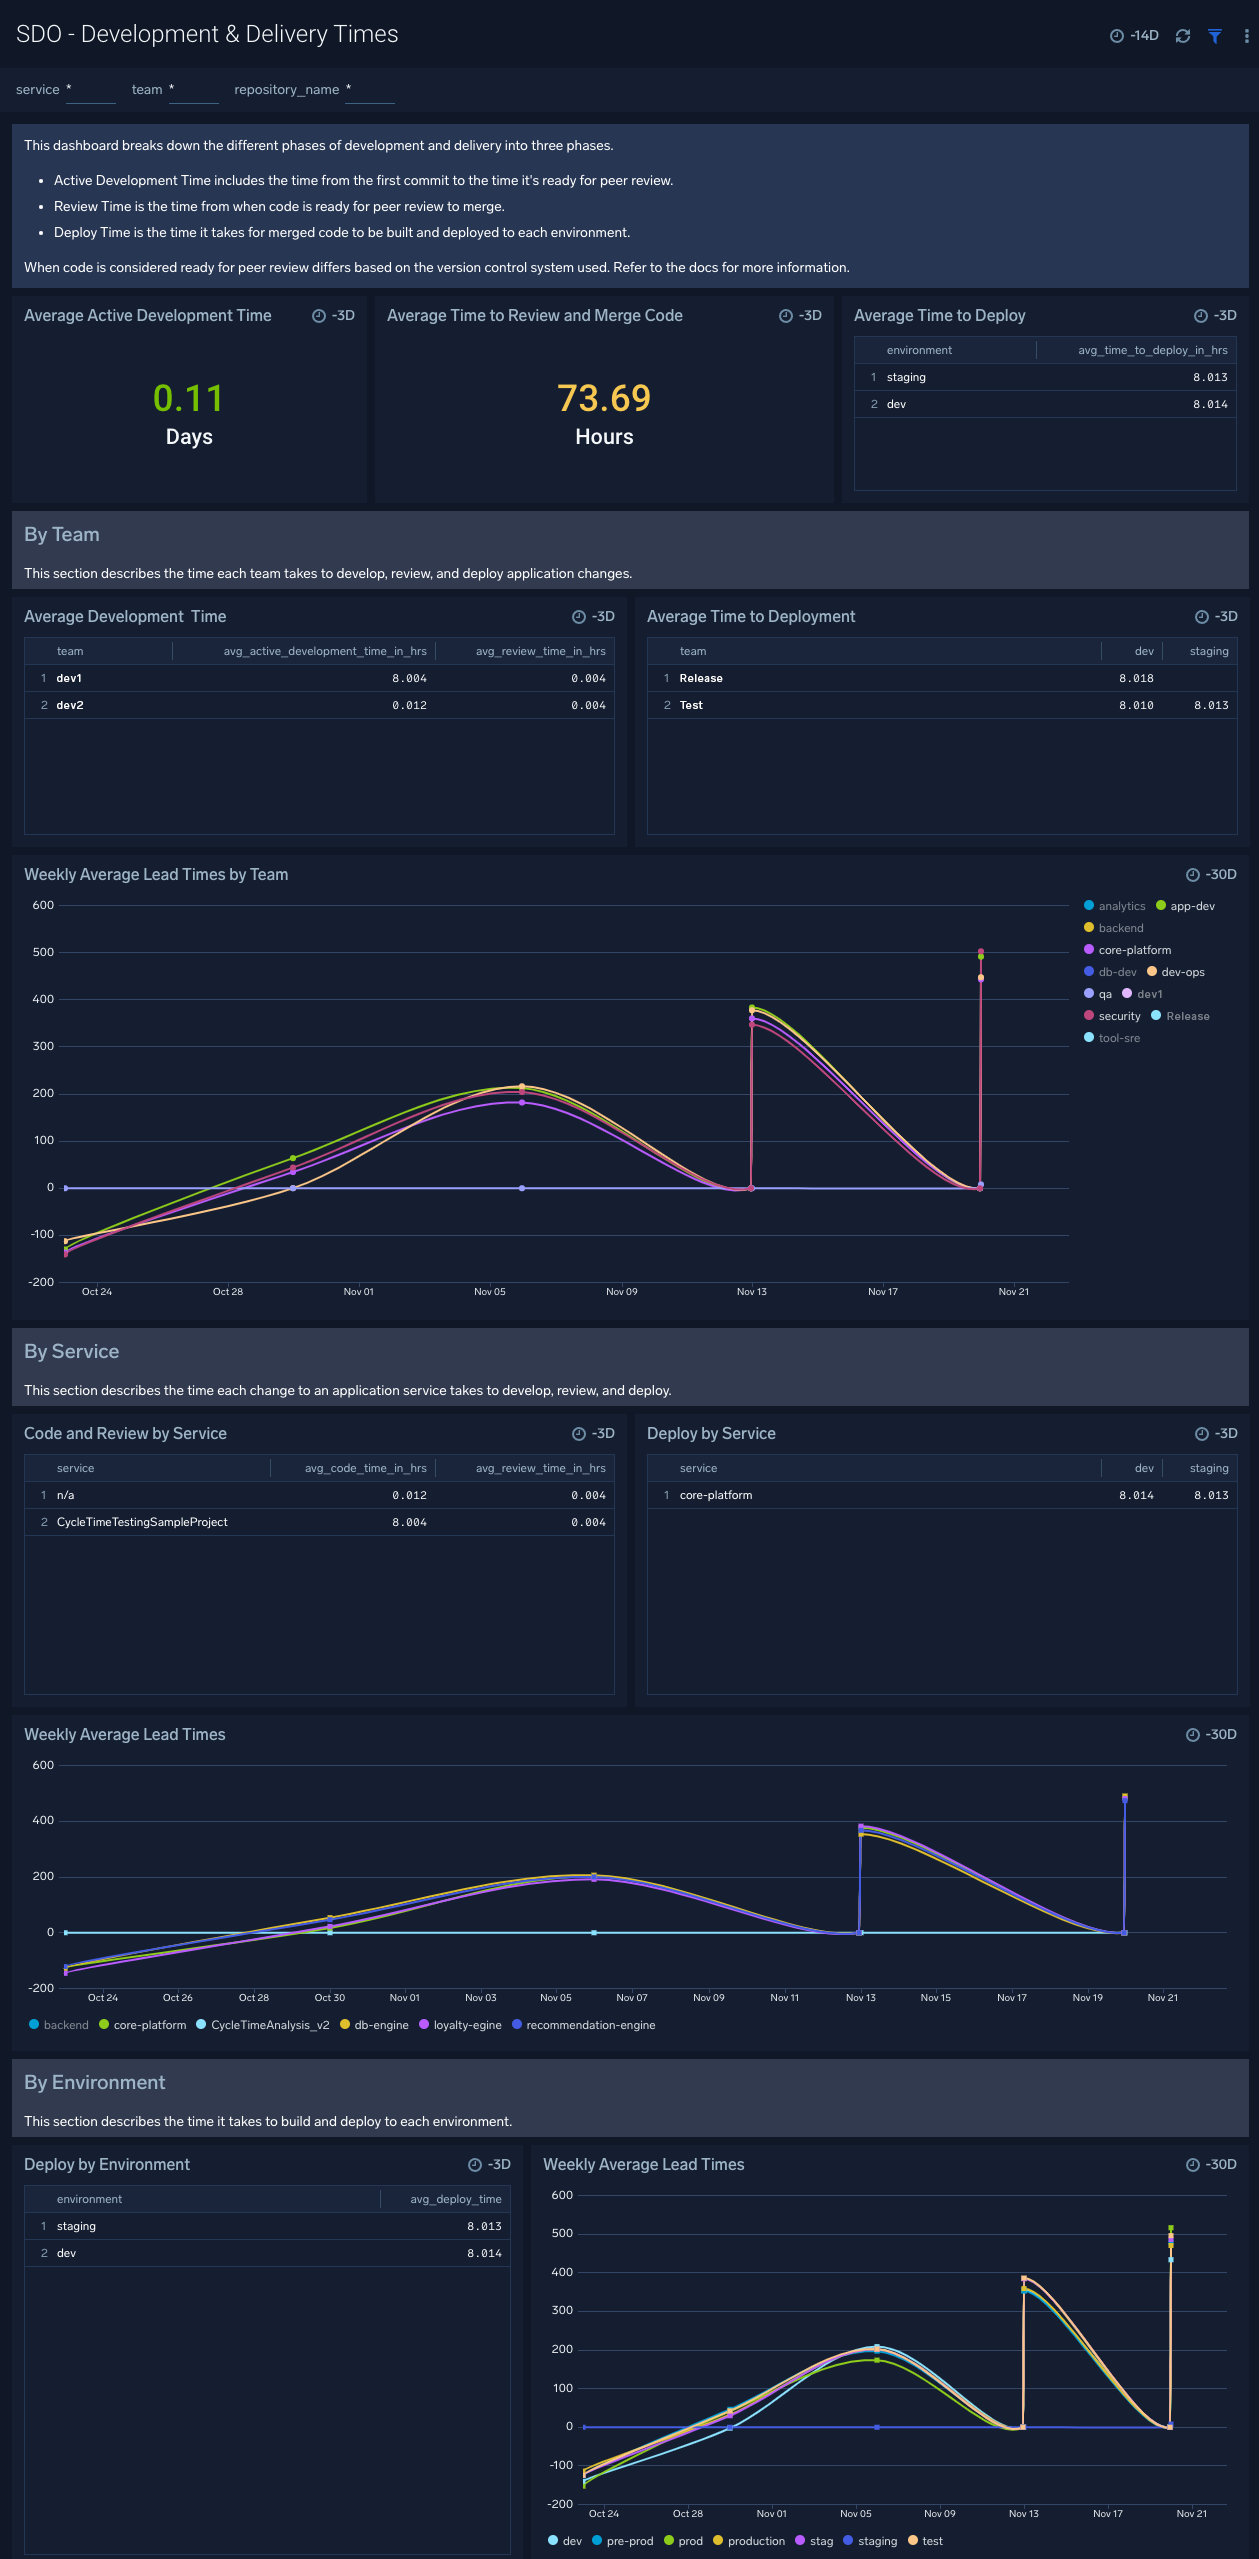
SDO - Development & Delivery Times
The Software Development Optimization - Development & Delivery Times dashboard helps you monitor both development lead times as well as delivery lead times across the three main phases of development and delivery:
- Active Development is the time it takes for developers to begin development on application code and have that code ready for peer review.
- Review & Merge is the time it takes for peers to review the code change, the developer to make any necessary changes, and to finally merge the code.
- Deployment is the time it takes for merged code changes to be deployed to application environments.
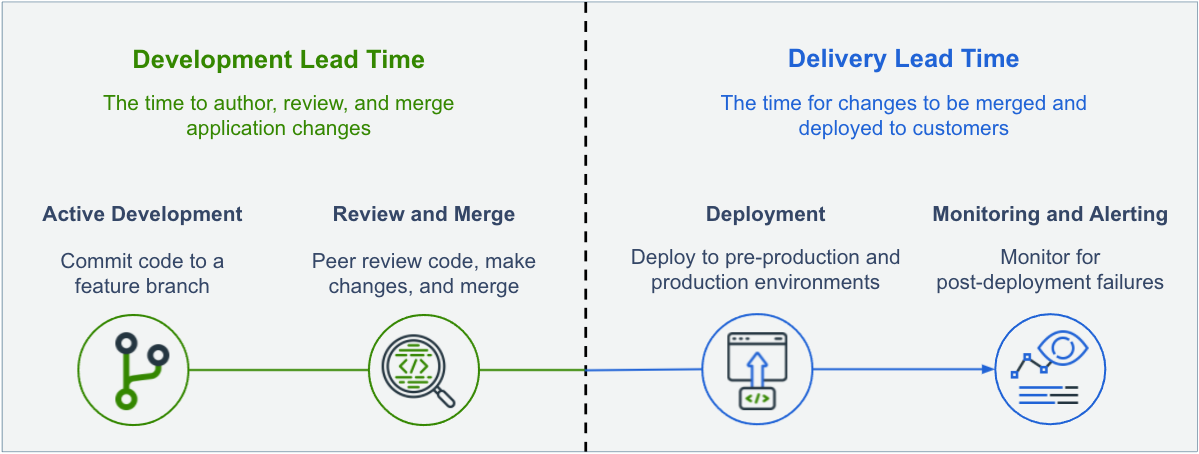
The dashboard will not only show the rate of changes as it goes through the three phases of development and delivery, but also show the phases broken down by team, service, and environment.
Use this dashboard to:
- Measure the throughput and quality of application changes
- Measure the adoption of teams practicing small batch application development and delivery
- Measure the impact of process improvements on application services and environments
How each phase of development is measured
The dashboard measures the time code spends in active development, review, and delivery. The method varies from the VCS tools used like BitBucket, GitHub, and GitLab.
How Active Development is measured:
-
For each merged pull request, measure the time between the first commit push to the time the pull request was ready for review. “Ready for review” is measured by:
-
For Bitbucket and GitLab: The time the PR was created
-
For GitHub: The time the PR was marked as “Ready for Review”
-
Average the Active Development time for each PR merged in the given timeframe issued by each team and for each service
How Review Time is measured:
-
For each merged pull request, measure the time between the pull request being ready for review and it being merged. “Ready for review” is measured by:
-
For Bitbucket and GitLab: The time the PR was created
-
For GitHub: The time the PR was marked as “Ready for Review”
-
Average the Review Time for each PR merged in the given timeframe issued by each team and for each service
Important limitations:
For the Active Development and Review & Merge times to be accurate, the following development workflows/practices must be used:
- New application development must be on feature branches and merged into a main branch.
- Pull requests are created when the code change is ready for review, or for GitHub specifically, pull requests are marked as “Ready for Review”.
CI/CD Pipeline Monitoring
These dashboards help you monitor and troubleshoot issues in individual phases of your DevOps pipelines. The Software Development Optimization - Pipeline Overview dashboard resides in the top-level folder created at app install time and detailed dashboards that help you drill-down into the individual metrics reside in the “CI/CD Pipeline Monitoring” folder.
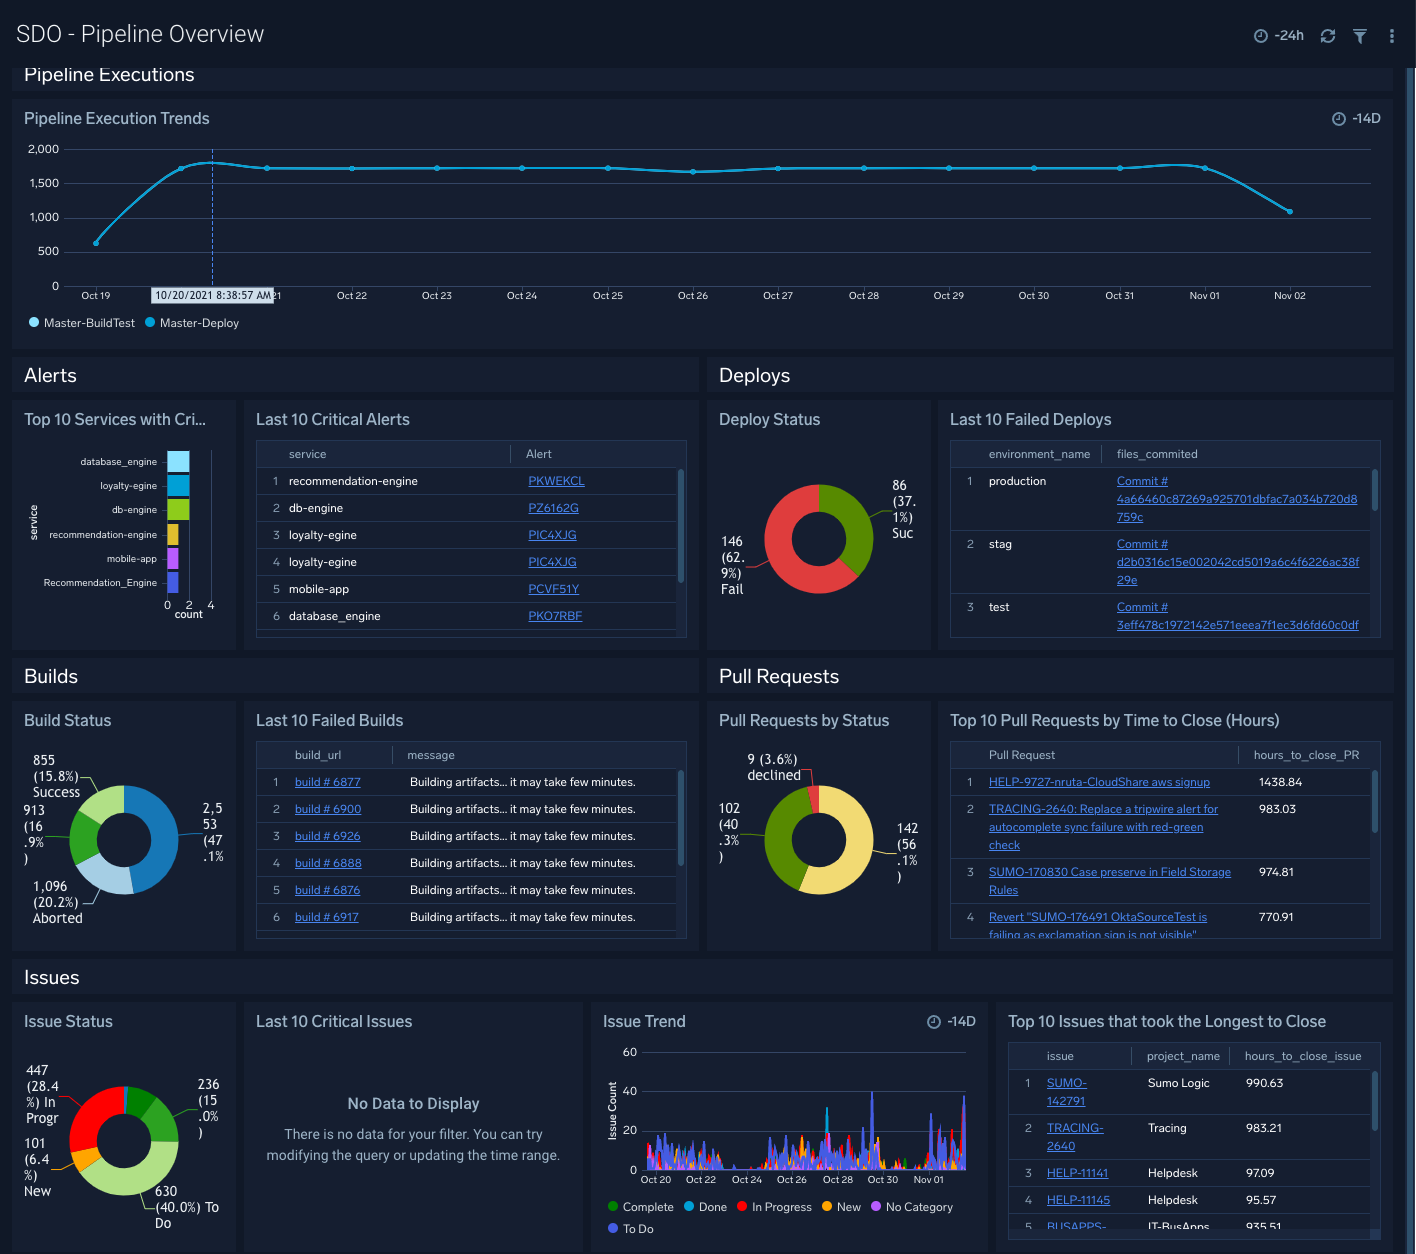
SDO - Pipeline Overview
The Software Development Optimization- Pipeline Overview dashboard gives you at a glance view of all critical aspects of your DevOps pipelines. such as alerts, deploys, builds, pull requests, and issues.
Use this dashboard to:
- Quickly identify the most critical and important events in each DevOps phase.
- Monitor trends across all phases and across multiple CI/CD pipelines and investigate any unexpected behavior.
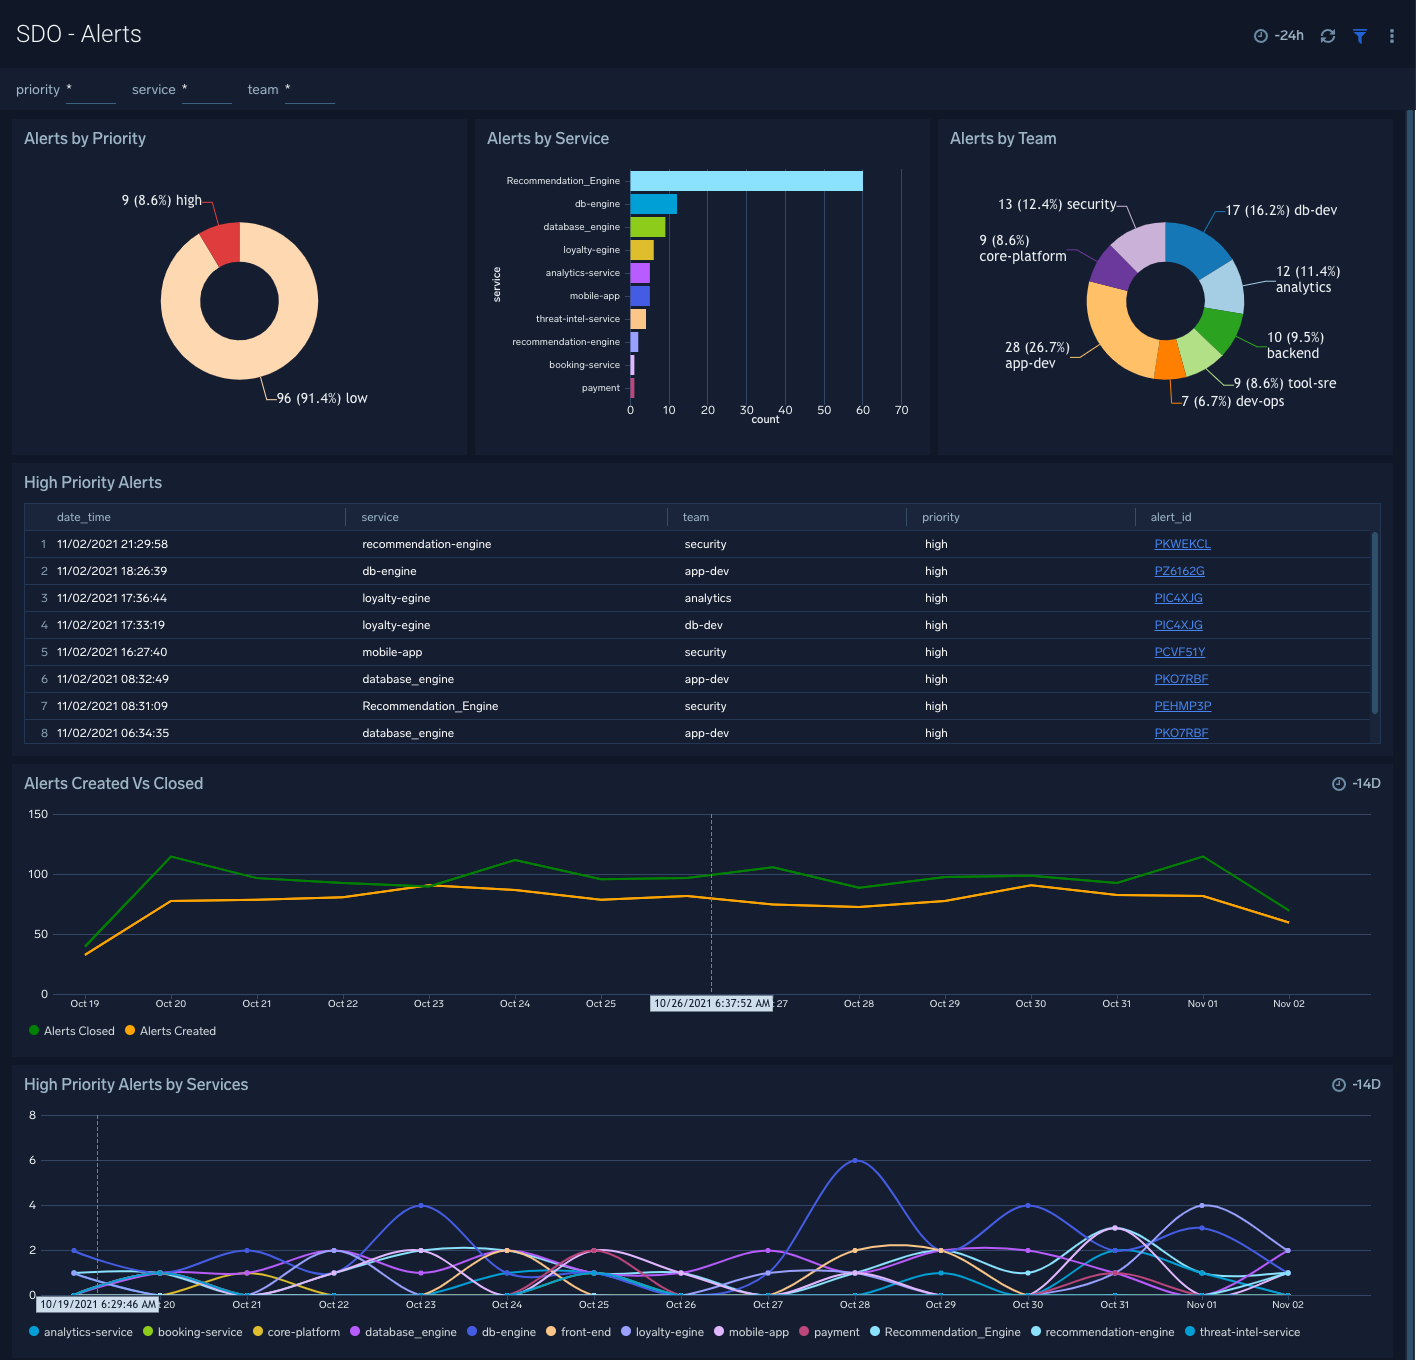
SDO - Alerts
The Software Development Optimization- Alerts dashboard provides insights into how alerts are being created, escalated, and resolved.
Use this dashboard to:
- Quickly identify and drill-down into high priority alerts and drill down into them.
- Identify services that are impacted most by production incidents.
- Determine teams that are overloaded with production alerts.
- Monitor trends to identify and drill-down into unexpected behavior.
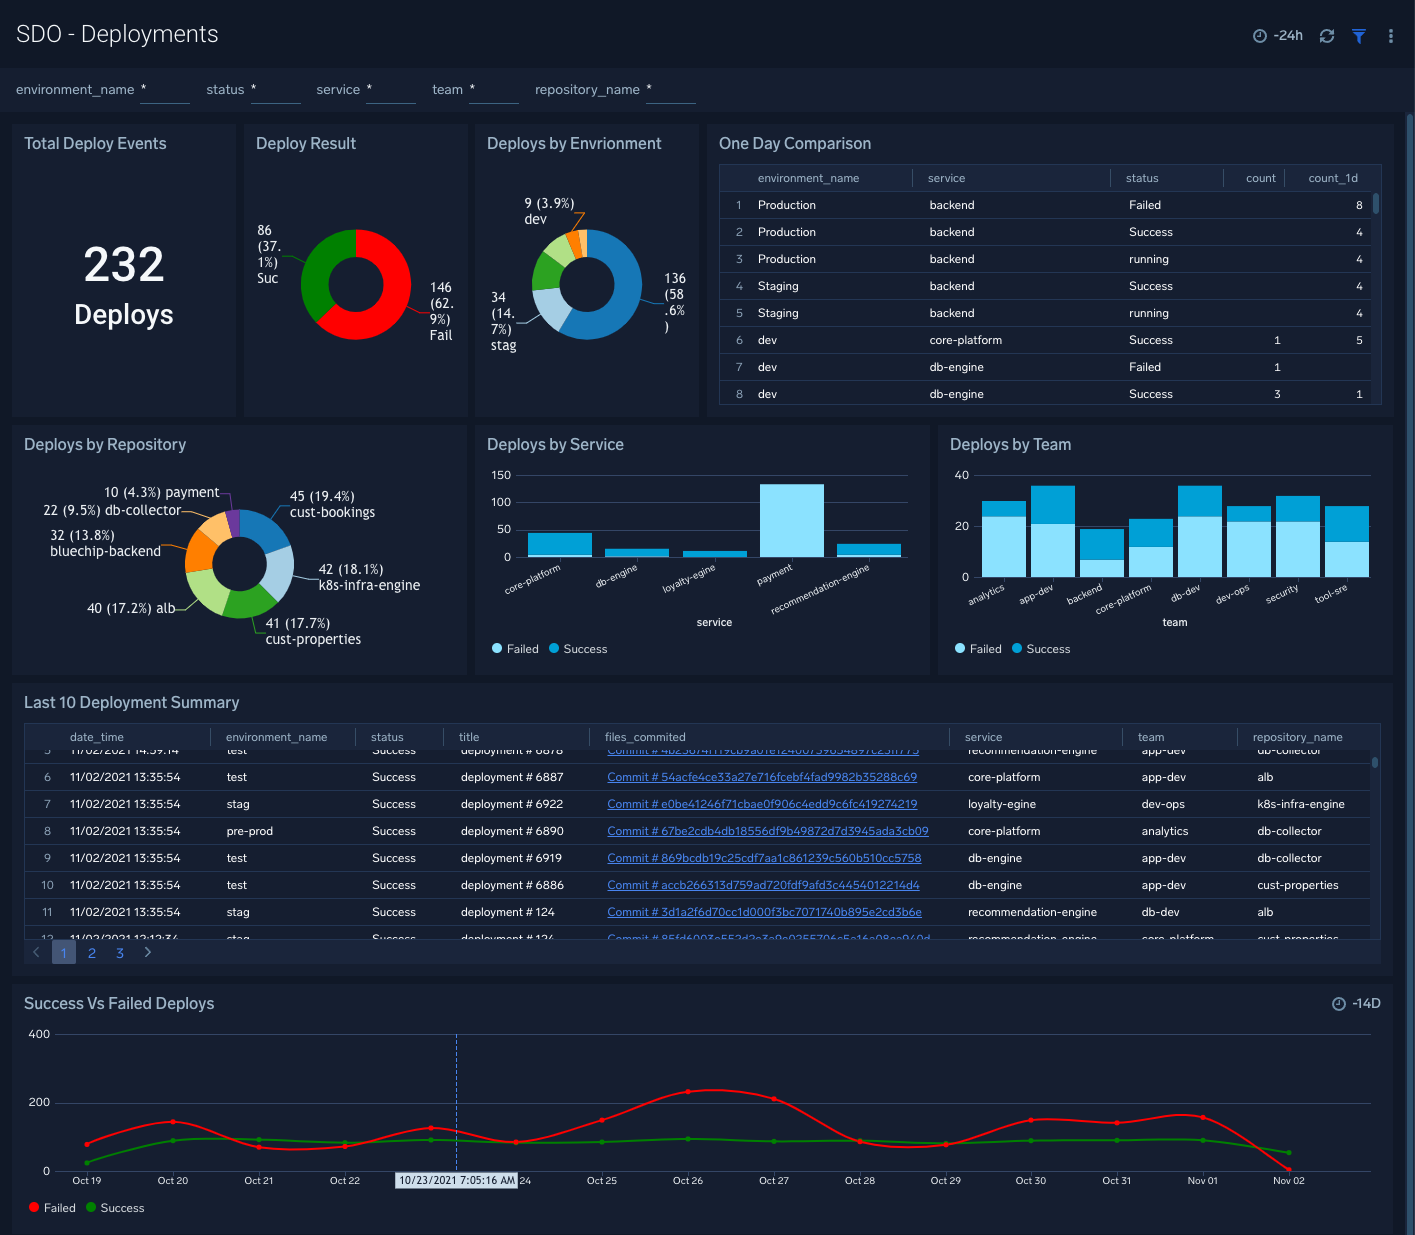
SDO - Deployment
The Software Development Optimization- Deployment dashboard provides detailed information around all deploy events to various environments and helps you identify deploys by repository, service, and team.
Use this dashboard to:
- Determine if code was successfully deployed to a given production or non-production environment.
- Identify and drill-down into commits that led to failed deployments or that led to production or testing issues.
- Identify which services and teams have the most deployment failures.
- Monitor successful/failure deploy events across repositories, services, teams, and environments.
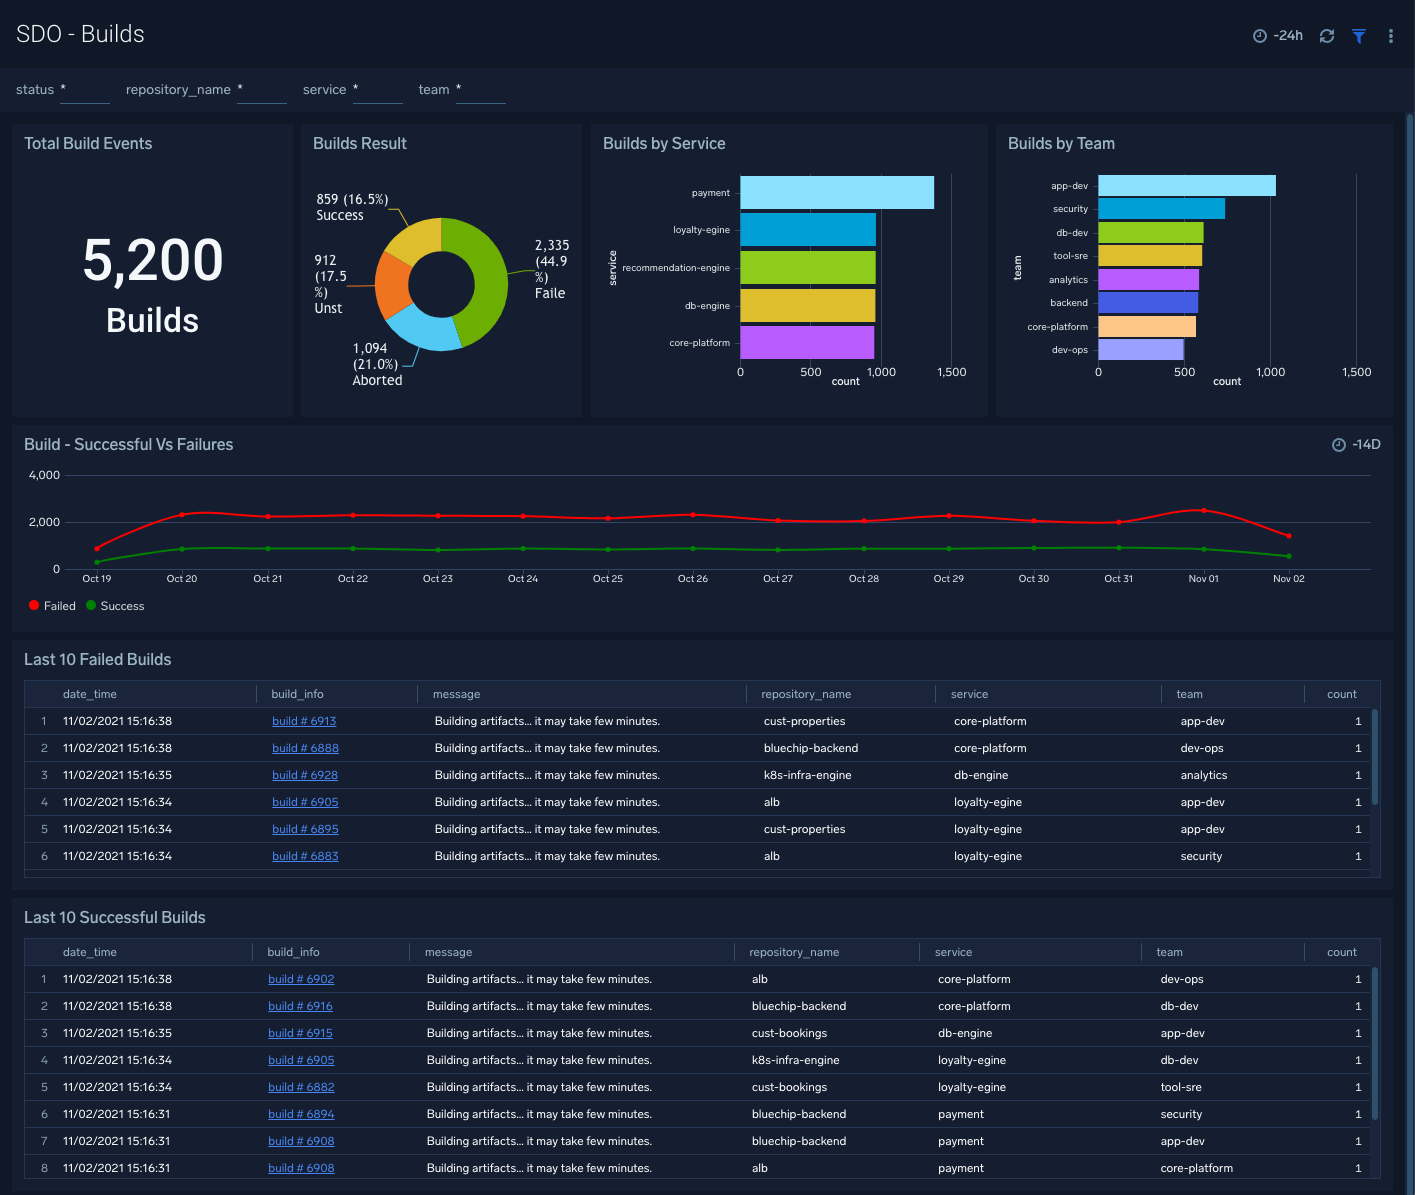
SDO - Builds
The Software Development Optimization- Builds dashboard provides insights into failed and successful builds.
Use this dashboard to:
- Speed up software delivery by quickly identifying bottlenecks in build failures.
- Monitor which teams, service, and repositories need more attention than other success/failure rate of builds and identify service, team, and repos.
- Quickly identify code commits that led to failed builds.
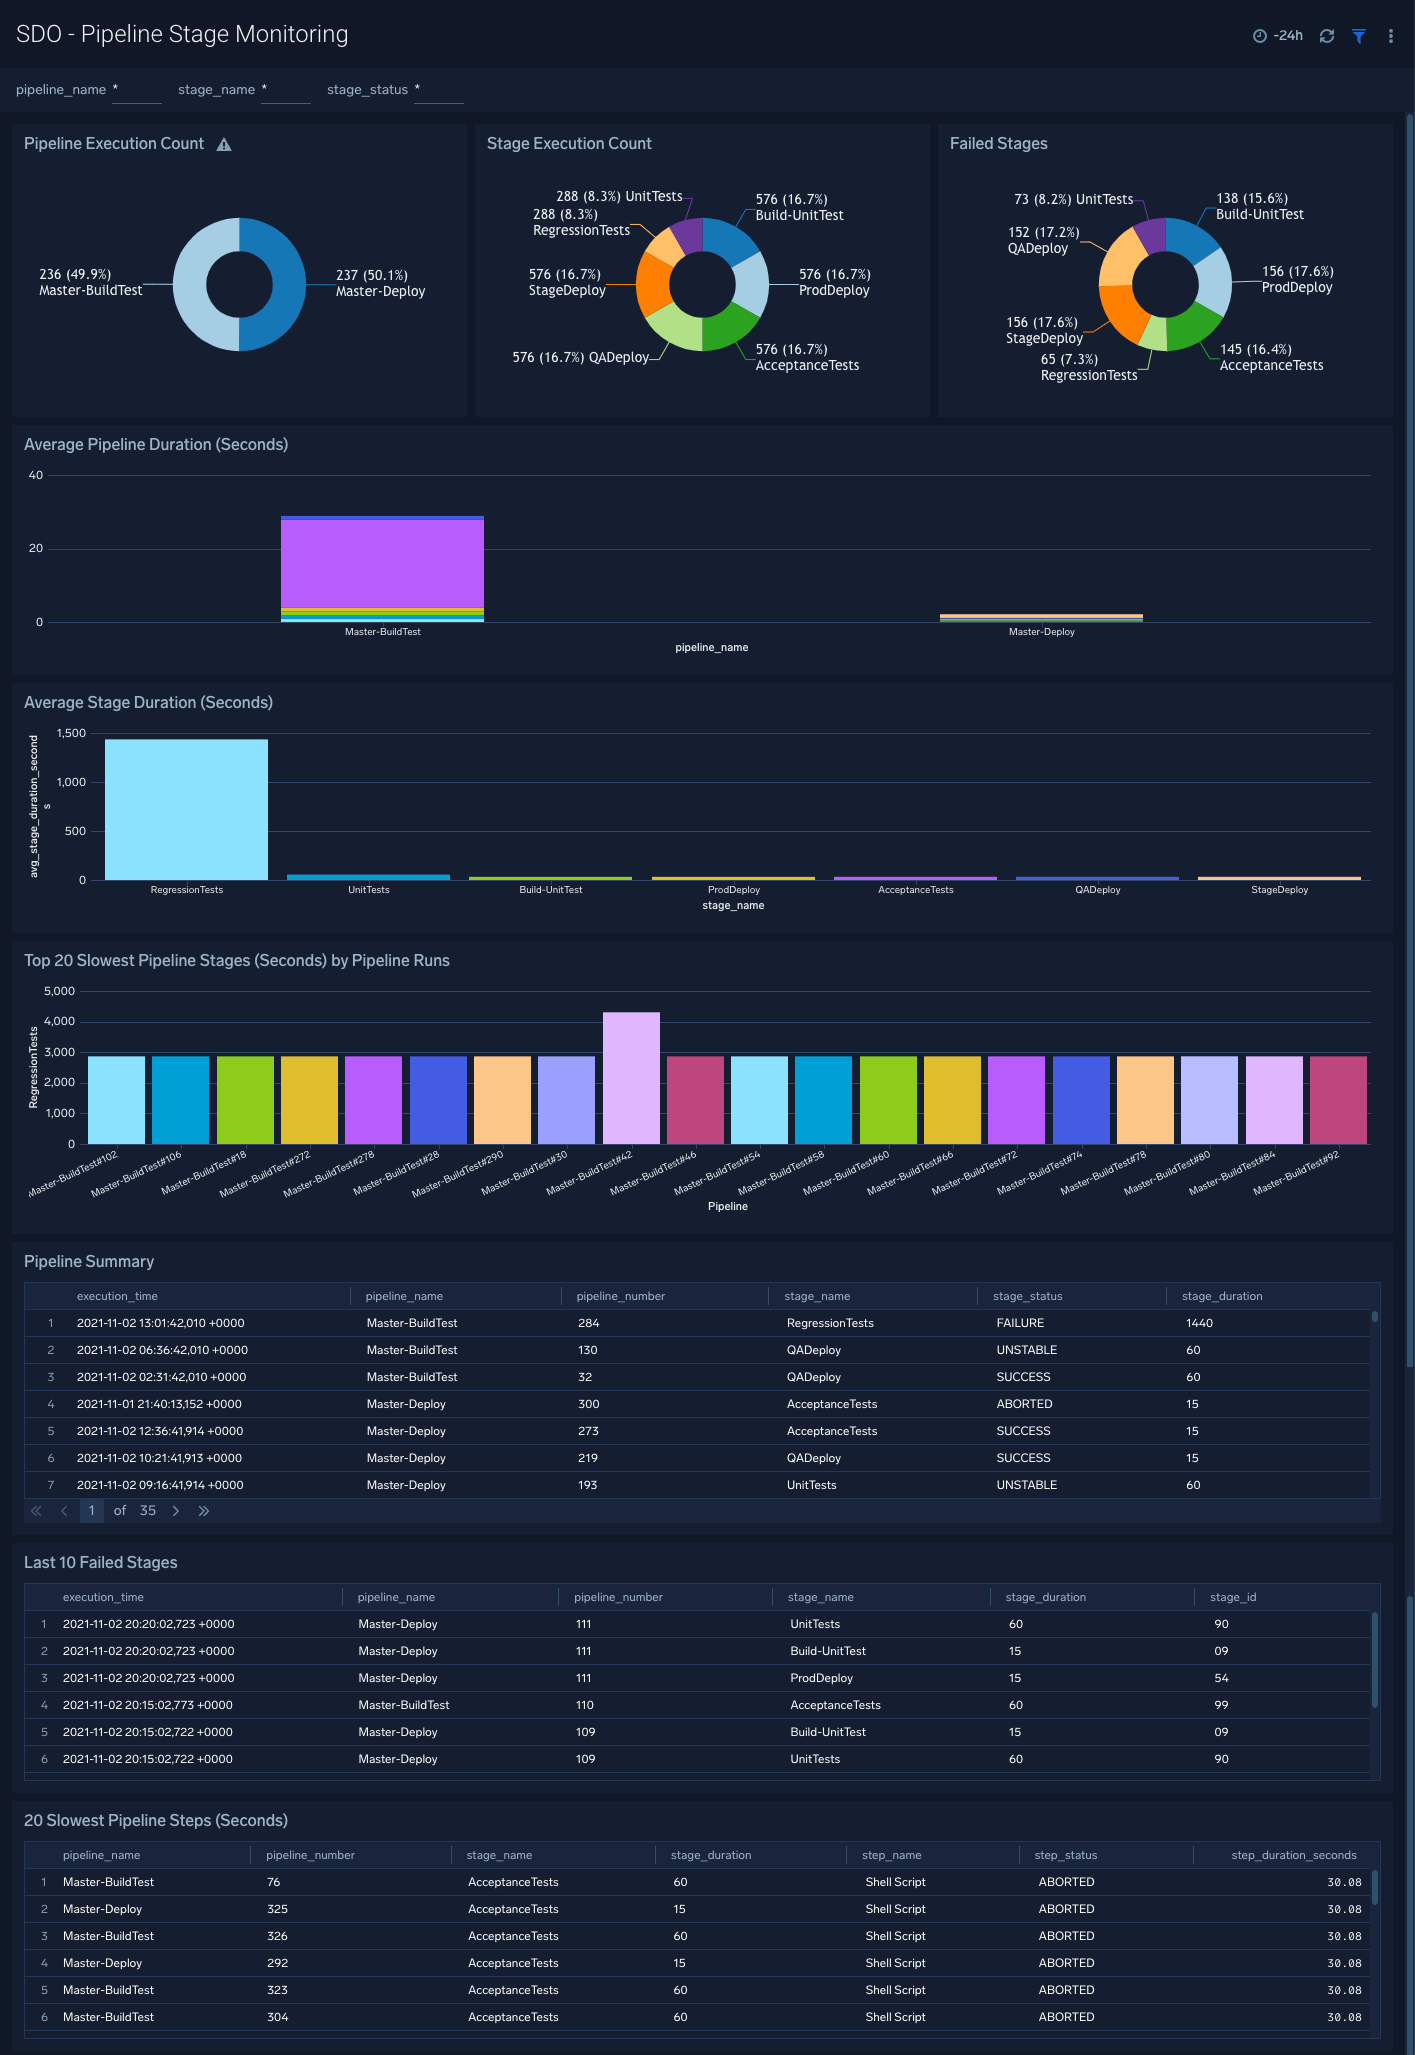
SDO - Pipeline Stage Monitoring
The Software Development Optimization - Pipeline Stage Monitoring dashboard provides insights into pipeline performances.
Use this dashboard to:
- Identify which pipelines are taking the longest to complete.
- Drilldown to slowest stages and steps within each pipeline.
- Compare pipeline executions to identify which runs slower or faster than others.
- Identify the failed pipeline stages and steps.
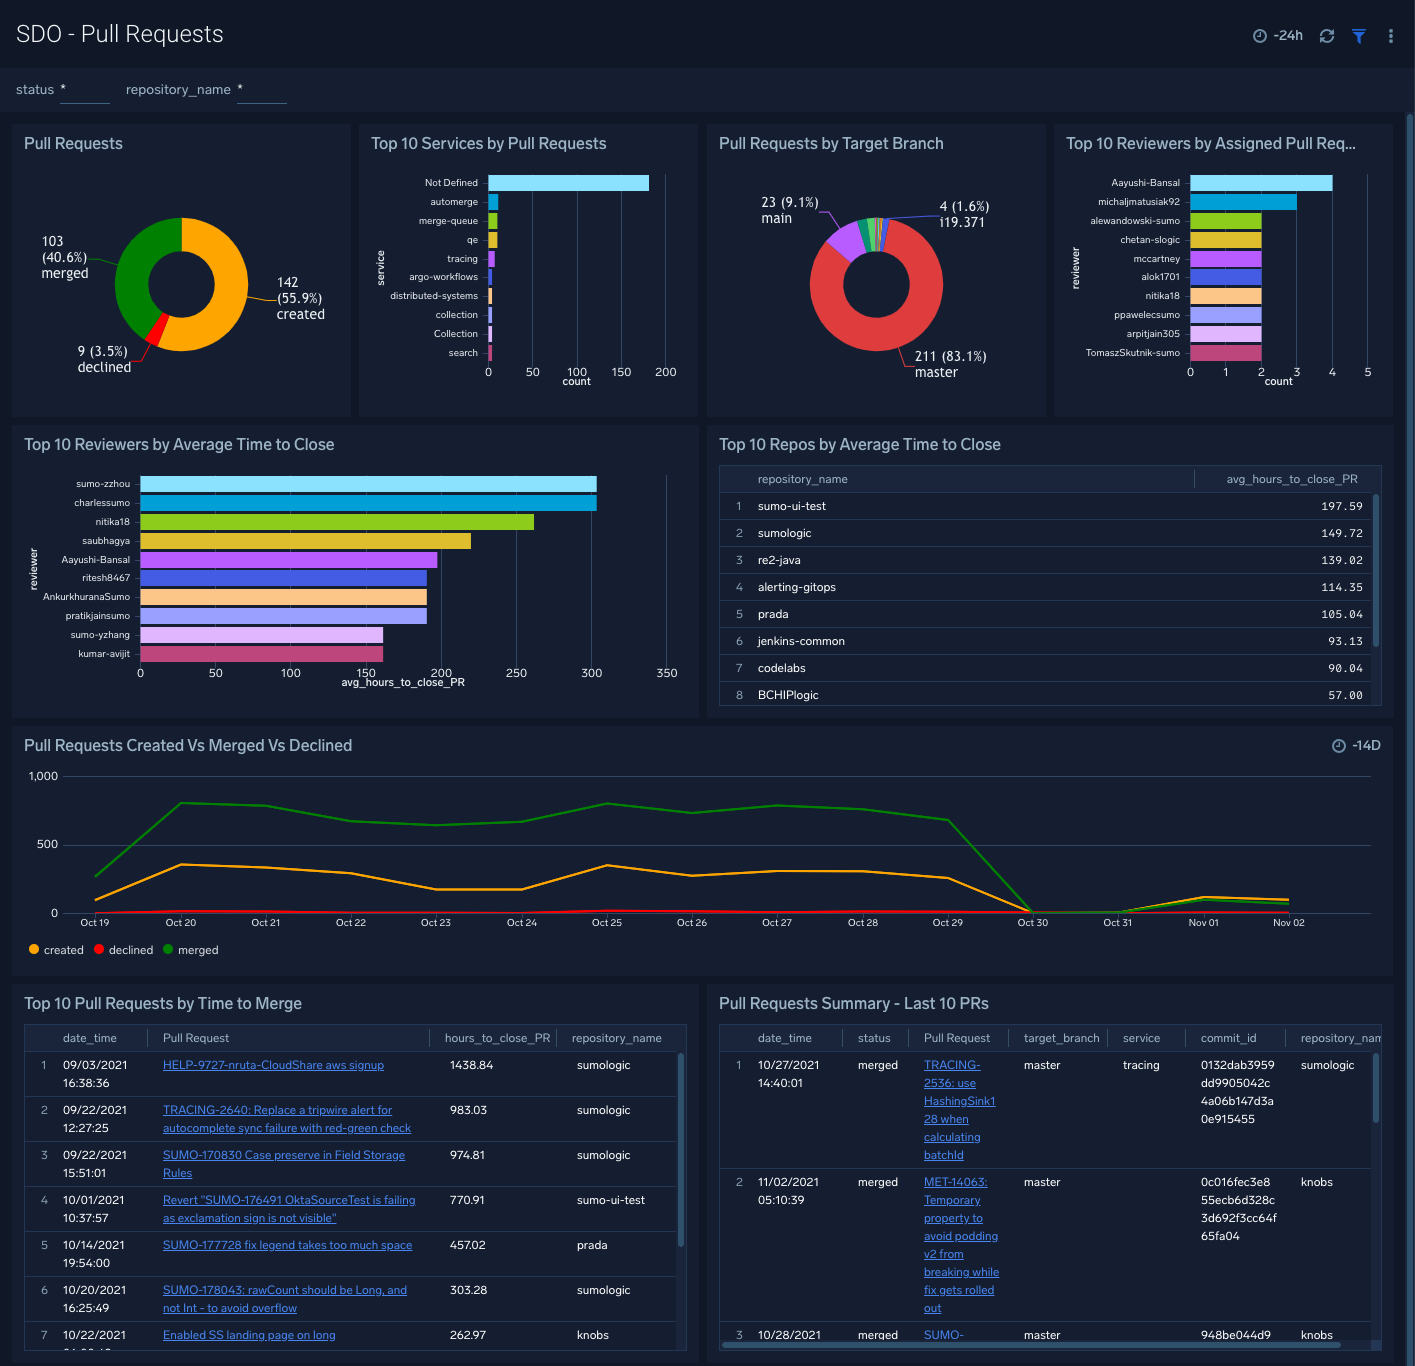
SDO - Pull Requests
The Software Development Optimization- Pull Requests dashboard provides insights into how pull requests are being created and merged across all your repositories.
Use this dashboard to:
- Improve the overall software delivery processes by identifying bottlenecks in review processes.
- Identify the individuals and repos that take the longest to close pull requests.
- Analyze trends, and compare created/merged/declined pull requests to understand and optimize the velocity of your software delivery process.
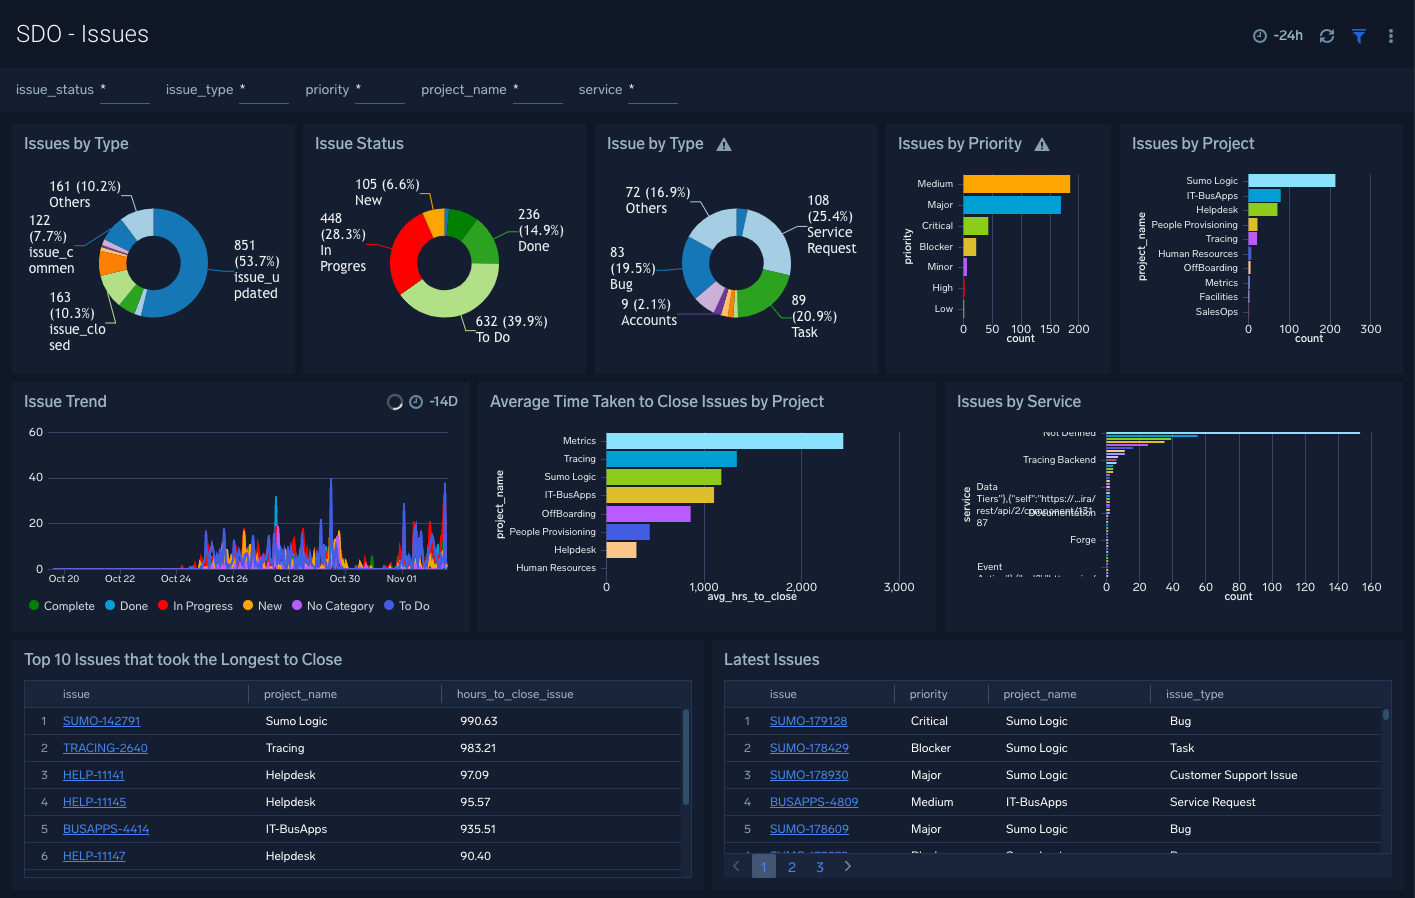
SDO - Issues
The Software Development Optimization- Issues dashboard provides a detailed view of issues classified by various dimensions such as type, status, priority, and project as well as details around on issue trends, latest issues, and prolonged issues.
Use this dashboard to:
- Understand how issues are being created, closed, and reopened.
- Quickly identify issue types, services, and projects that need the most attention.
- Identify how to work in progress could affect your development and delivery lifecycle.
- Get insights into blockers and issues that are taking the longest to resolve.
- Monitor issue creation trends to identify any unexpected behavior.